Big Water, UT Map & Demographics
Big Water Map
Big Water Overview
$35,122
PER CAPITA INCOME
$95,625
AVG FAMILY INCOME
$58,864
AVG HOUSEHOLD INCOME
50.8%
WAGE / INCOME GAP [ % ]
49.2¢/ $1
WAGE / INCOME GAP [ $ ]
0.40
INEQUALITY / GINI INDEX
574
TOTAL POPULATION
281
MALE POPULATION
293
FEMALE POPULATION
95.90
MALES / 100 FEMALES
104.27
FEMALES / 100 MALES
49.5
MEDIAN AGE
2.8
AVG FAMILY SIZE
2.2
AVG HOUSEHOLD SIZE
262
LABOR FORCE [ PEOPLE ]
56.8%
PERCENT IN LABOR FORCE
5.0%
UNEMPLOYMENT RATE
Big Water Area Codes
Income in Big Water
Income Overview in Big Water
Per Capita Income in Big Water is $35,122, while median incomes of families and households are $95,625 and $58,864 respectively.
| Characteristic | Number | Measure |
| Per Capita Income | 574 | $35,122 |
| Median Family Income | 112 | $95,625 |
| Mean Family Income | 112 | $102,170 |
| Median Household Income | 262 | $58,864 |
| Mean Household Income | 262 | $70,277 |
| Income Deficit | 112 | $0 |
| Wage / Income Gap (%) | 574 | 50.78% |
| Wage / Income Gap ($) | 574 | 49.22¢ per $1 |
| Gini / Inequality Index | 574 | 0.40 |
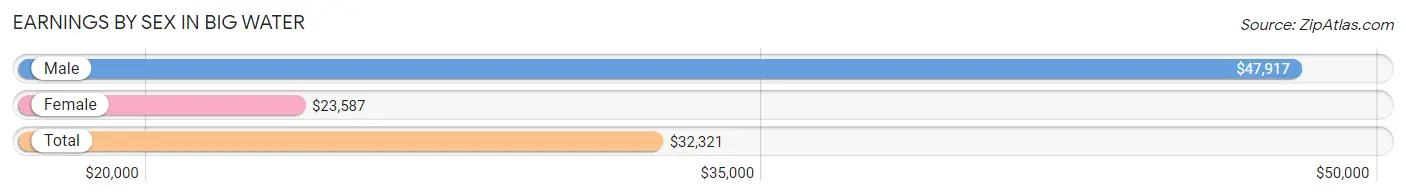
Earnings by Sex in Big Water
Average Earnings in Big Water are $32,321, $47,917 for men and $23,587 for women, a difference of 50.8%.
| Sex | Number | Average Earnings |
| Male | 143 (44.0%) | $47,917 |
| Female | 182 (56.0%) | $23,587 |
| Total | 325 (100.0%) | $32,321 |
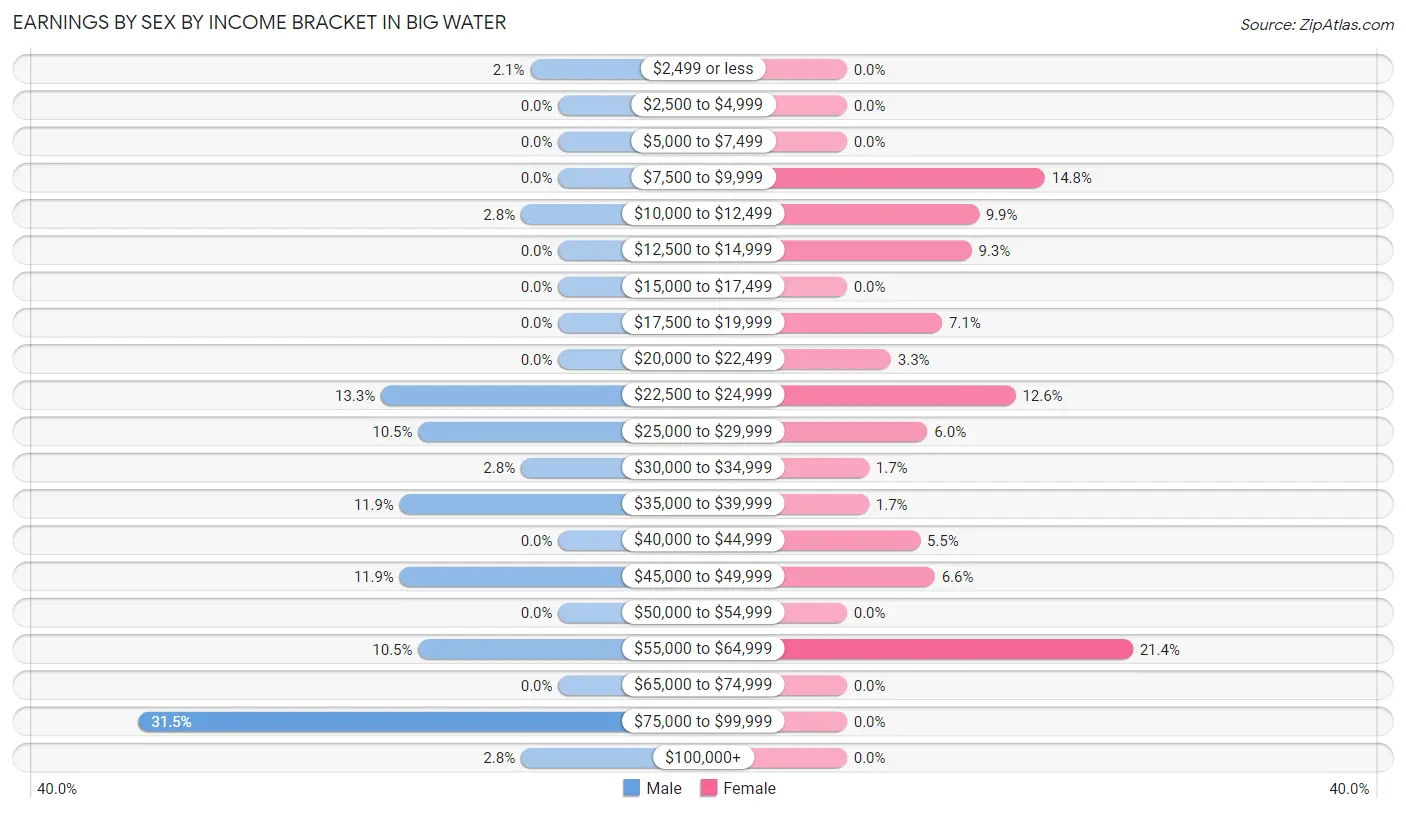
Earnings by Sex by Income Bracket in Big Water
The most common earnings brackets in Big Water are $75,000 to $99,999 for men (45 | 31.5%) and $55,000 to $64,999 for women (39 | 21.4%).
| Income | Male | Female |
| $2,499 or less | 3 (2.1%) | 0 (0.0%) |
| $2,500 to $4,999 | 0 (0.0%) | 0 (0.0%) |
| $5,000 to $7,499 | 0 (0.0%) | 0 (0.0%) |
| $7,500 to $9,999 | 0 (0.0%) | 27 (14.8%) |
| $10,000 to $12,499 | 4 (2.8%) | 18 (9.9%) |
| $12,500 to $14,999 | 0 (0.0%) | 17 (9.3%) |
| $15,000 to $17,499 | 0 (0.0%) | 0 (0.0%) |
| $17,500 to $19,999 | 0 (0.0%) | 13 (7.1%) |
| $20,000 to $22,499 | 0 (0.0%) | 6 (3.3%) |
| $22,500 to $24,999 | 19 (13.3%) | 23 (12.6%) |
| $25,000 to $29,999 | 15 (10.5%) | 11 (6.0%) |
| $30,000 to $34,999 | 4 (2.8%) | 3 (1.7%) |
| $35,000 to $39,999 | 17 (11.9%) | 3 (1.7%) |
| $40,000 to $44,999 | 0 (0.0%) | 10 (5.5%) |
| $45,000 to $49,999 | 17 (11.9%) | 12 (6.6%) |
| $50,000 to $54,999 | 0 (0.0%) | 0 (0.0%) |
| $55,000 to $64,999 | 15 (10.5%) | 39 (21.4%) |
| $65,000 to $74,999 | 0 (0.0%) | 0 (0.0%) |
| $75,000 to $99,999 | 45 (31.5%) | 0 (0.0%) |
| $100,000+ | 4 (2.8%) | 0 (0.0%) |
| Total | 143 (100.0%) | 182 (100.0%) |
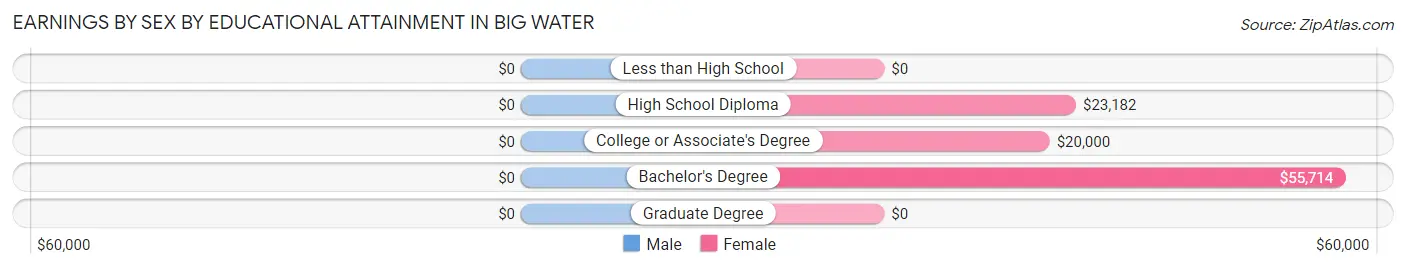
Earnings by Sex by Educational Attainment in Big Water
| Educational Attainment | Male Income | Female Income |
| Less than High School | - | - |
| High School Diploma | - | - |
| College or Associate's Degree | - | - |
| Bachelor's Degree | - | - |
| Graduate Degree | - | - |
| Total | $48,333 | $23,859 |
Family Income in Big Water
Family Income Brackets in Big Water
According to the Big Water family income data, there are 44 families falling into the $50,000 to $74,999 income range, which is the most common income bracket and makes up 39.3% of all families.
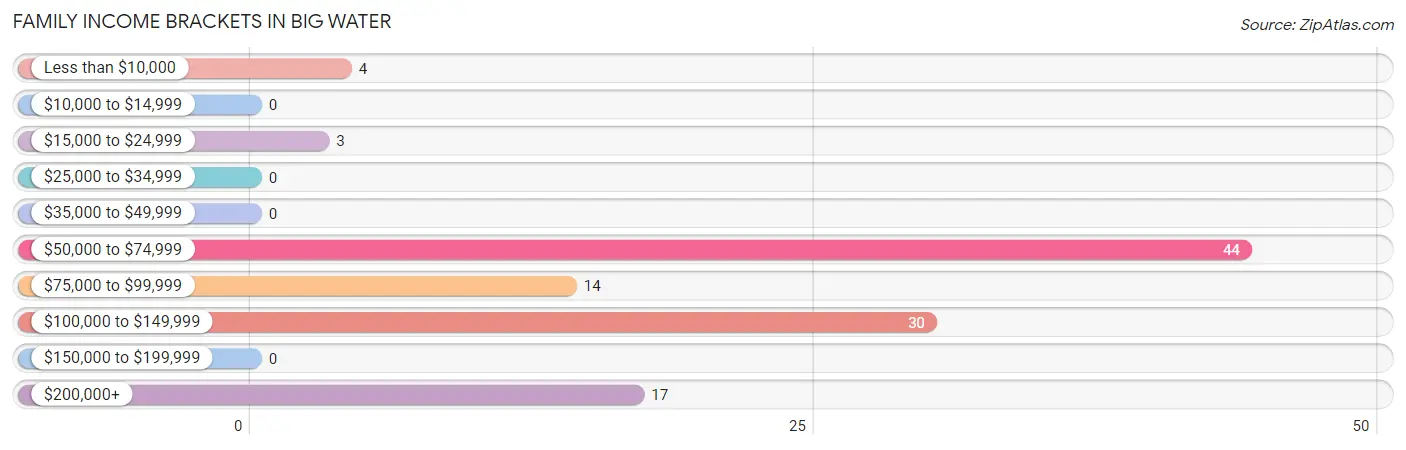
| Income Bracket | # Families | % Families |
| Less than $10,000 | 4 | 3.6% |
| $10,000 to $14,999 | 0 | 0.0% |
| $15,000 to $24,999 | 3 | 2.7% |
| $25,000 to $34,999 | 0 | 0.0% |
| $35,000 to $49,999 | 0 | 0.0% |
| $50,000 to $74,999 | 44 | 39.3% |
| $75,000 to $99,999 | 14 | 12.5% |
| $100,000 to $149,999 | 30 | 26.8% |
| $150,000 to $199,999 | 0 | 0.0% |
| $200,000+ | 17 | 15.2% |
Family Income by Famaliy Size in Big Water
3-person families (57 | 50.9%) account for the highest median family income in Big Water with $103,250 per family, while 3-person families (57 | 50.9%) have the highest median income of $34,417 per family member.
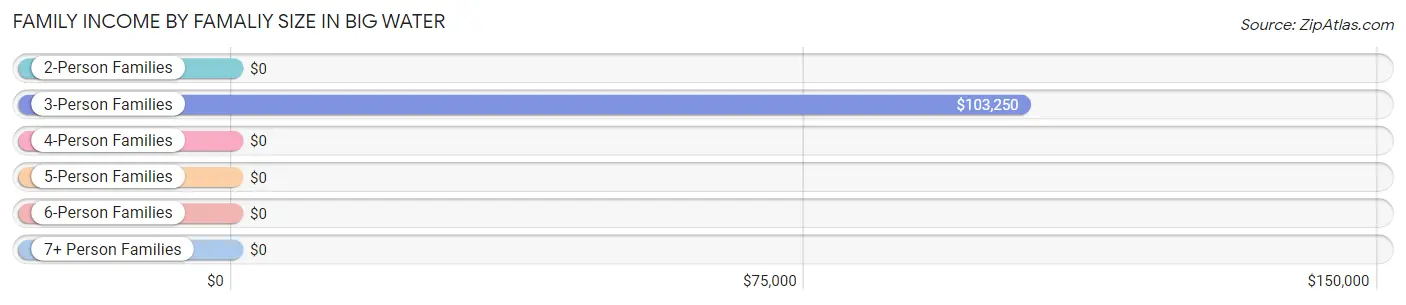
| Income Bracket | # Families | Median Income |
| 2-Person Families | 50 (44.6%) | $0 |
| 3-Person Families | 57 (50.9%) | $103,250 |
| 4-Person Families | 5 (4.5%) | $0 |
| 5-Person Families | 0 (0.0%) | $0 |
| 6-Person Families | 0 (0.0%) | $0 |
| 7+ Person Families | 0 (0.0%) | $0 |
| Total | 112 (100.0%) | $95,625 |
Family Income by Number of Earners in Big Water
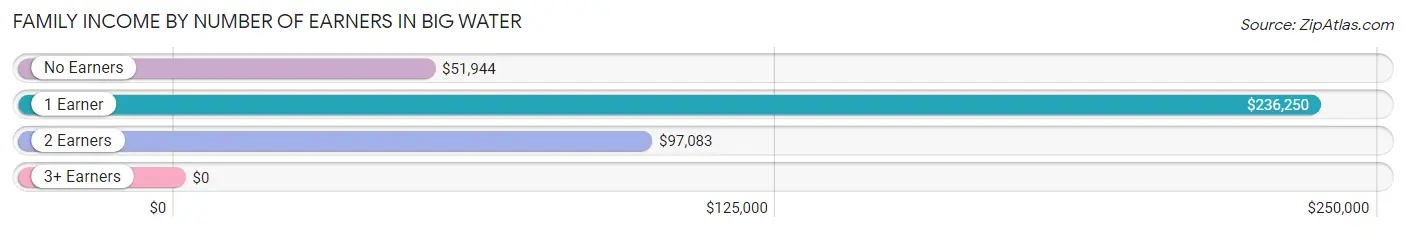
| Number of Earners | # Families | Median Income |
| No Earners | 22 (19.6%) | $51,944 |
| 1 Earner | 19 (17.0%) | $236,250 |
| 2 Earners | 54 (48.2%) | $97,083 |
| 3+ Earners | 17 (15.2%) | $0 |
| Total | 112 (100.0%) | $95,625 |
Household Income in Big Water
Household Income Brackets in Big Water
With 68 households falling in the category, the $50,000 to $74,999 income range is the most frequent in Big Water, accounting for 26.0% of all households.
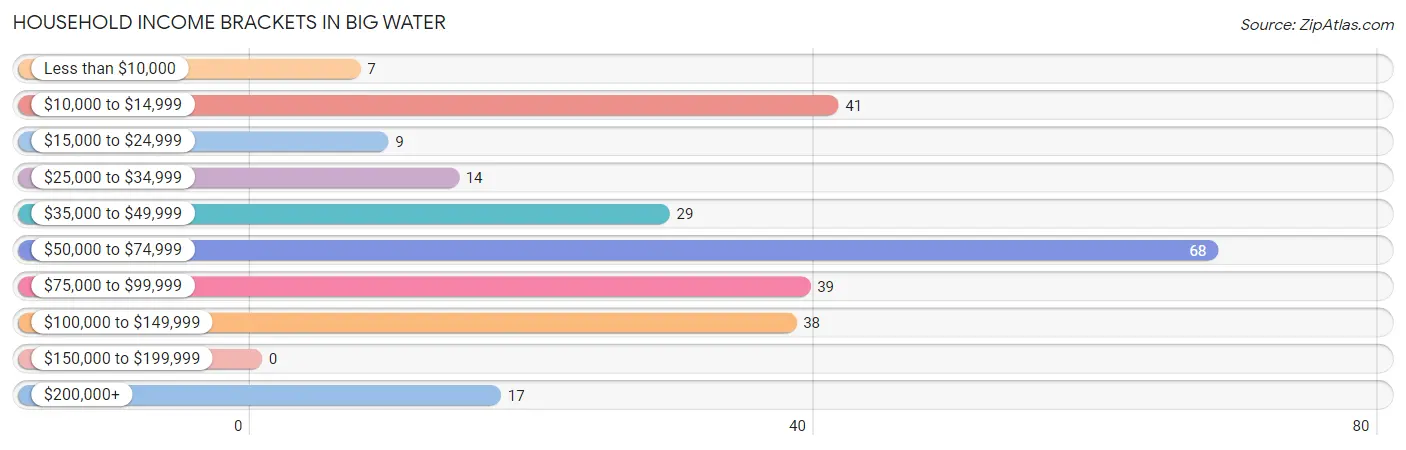
| Income Bracket | # Households | % Households |
| Less than $10,000 | 7 | 2.7% |
| $10,000 to $14,999 | 41 | 15.6% |
| $15,000 to $24,999 | 9 | 3.4% |
| $25,000 to $34,999 | 14 | 5.3% |
| $35,000 to $49,999 | 29 | 11.1% |
| $50,000 to $74,999 | 68 | 26.0% |
| $75,000 to $99,999 | 39 | 14.9% |
| $100,000 to $149,999 | 38 | 14.5% |
| $150,000 to $199,999 | 0 | 0.0% |
| $200,000+ | 17 | 6.5% |
Household Income by Householder Age in Big Water
The median household income in Big Water is $58,864, with the highest median household income of $82,500 found in the 45 to 64 years age bracket for the primary householder. A total of 138 households (52.7%) fall into this category. Meanwhile, the 15 to 24 years age bracket for the primary householder has the lowest median household income of $0, with 3 households (1.1%) in this group.
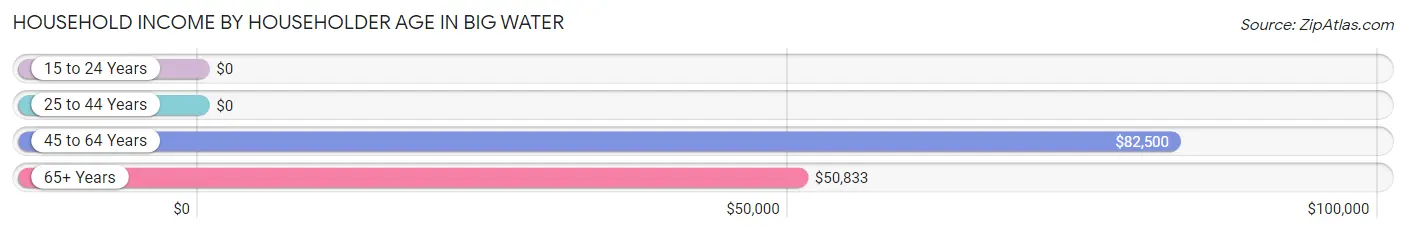
| Income Bracket | # Households | Median Income |
| 15 to 24 Years | 3 (1.1%) | $0 |
| 25 to 44 Years | 33 (12.6%) | $0 |
| 45 to 64 Years | 138 (52.7%) | $82,500 |
| 65+ Years | 88 (33.6%) | $50,833 |
| Total | 262 (100.0%) | $58,864 |
Poverty in Big Water
Income Below Poverty by Sex and Age in Big Water
With 14.3% poverty level for males and 22.2% for females among the residents of Big Water, 5 year old males and 12 to 14 year old females are the most vulnerable to poverty, with 5 males (100.0%) and 5 females (100.0%) in their respective age groups living below the poverty level.
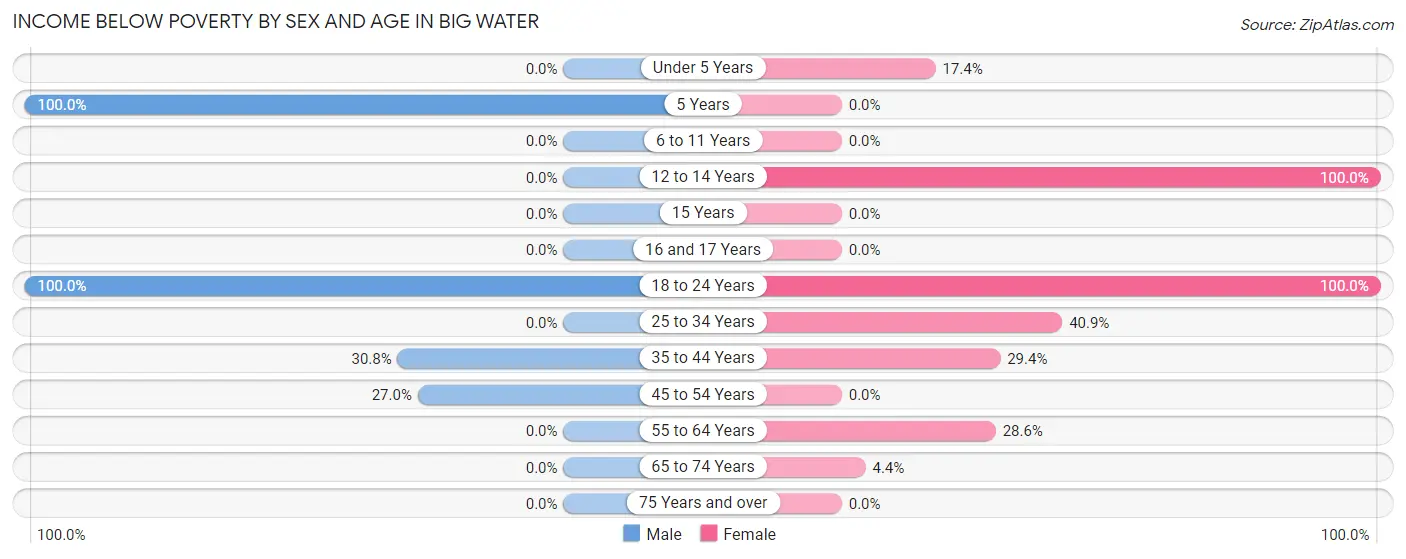
| Age Bracket | Male | Female |
| Under 5 Years | 0 (0.0%) | 4 (17.4%) |
| 5 Years | 5 (100.0%) | 0 (0.0%) |
| 6 to 11 Years | 0 (0.0%) | 0 (0.0%) |
| 12 to 14 Years | 0 (0.0%) | 5 (100.0%) |
| 15 Years | 0 (0.0%) | 0 (0.0%) |
| 16 and 17 Years | 0 (0.0%) | 0 (0.0%) |
| 18 to 24 Years | 3 (100.0%) | 5 (100.0%) |
| 25 to 34 Years | 0 (0.0%) | 27 (40.9%) |
| 35 to 44 Years | 4 (30.8%) | 5 (29.4%) |
| 45 to 54 Years | 20 (27.0%) | 0 (0.0%) |
| 55 to 64 Years | 0 (0.0%) | 16 (28.6%) |
| 65 to 74 Years | 0 (0.0%) | 3 (4.4%) |
| 75 Years and over | 0 (0.0%) | 0 (0.0%) |
| Total | 32 (14.3%) | 65 (22.2%) |
Income Above Poverty by Sex and Age in Big Water
According to the poverty statistics in Big Water, males aged 6 to 11 years and females aged 45 to 54 years are the age groups that are most secure financially, with 100.0% of males and 100.0% of females in these age groups living above the poverty line.
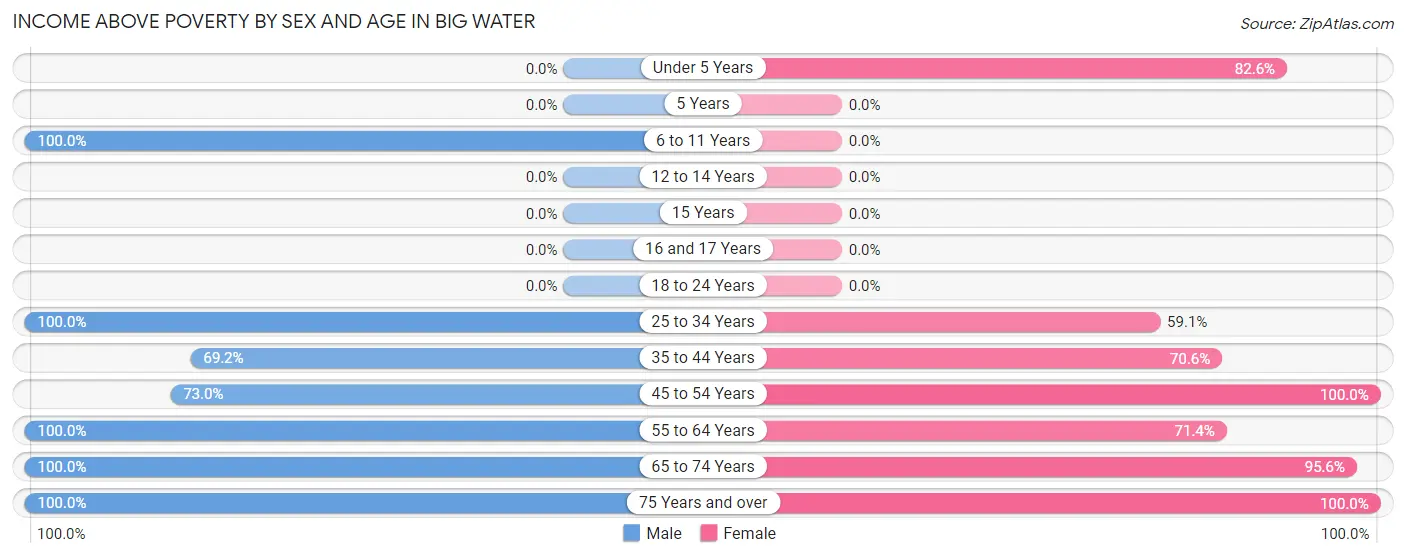
| Age Bracket | Male | Female |
| Under 5 Years | 0 (0.0%) | 19 (82.6%) |
| 5 Years | 0 (0.0%) | 0 (0.0%) |
| 6 to 11 Years | 22 (100.0%) | 0 (0.0%) |
| 12 to 14 Years | 0 (0.0%) | 0 (0.0%) |
| 15 Years | 0 (0.0%) | 0 (0.0%) |
| 16 and 17 Years | 0 (0.0%) | 0 (0.0%) |
| 18 to 24 Years | 0 (0.0%) | 0 (0.0%) |
| 25 to 34 Years | 31 (100.0%) | 39 (59.1%) |
| 35 to 44 Years | 9 (69.2%) | 12 (70.6%) |
| 45 to 54 Years | 54 (73.0%) | 45 (100.0%) |
| 55 to 64 Years | 23 (100.0%) | 40 (71.4%) |
| 65 to 74 Years | 35 (100.0%) | 65 (95.6%) |
| 75 Years and over | 17 (100.0%) | 8 (100.0%) |
| Total | 191 (85.7%) | 228 (77.8%) |
Income Below Poverty Among Married-Couple Families in Big Water
The poverty statistics for married-couple families in Big Water show that 2.9% or 3 of the total 104 families live below the poverty line. Families with 1 or 2 children have the highest poverty rate of 7.3%, comprising of 3 families. On the other hand, families with no children have the lowest poverty rate of 0.0%, which includes 0 families.
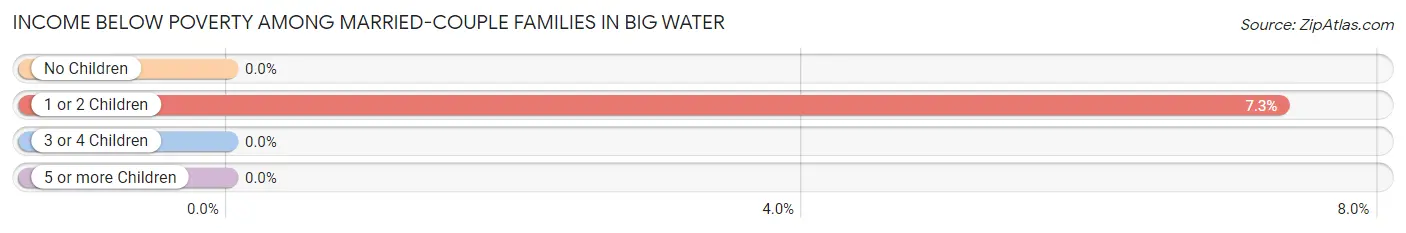
| Children | Above Poverty | Below Poverty |
| No Children | 63 (100.0%) | 0 (0.0%) |
| 1 or 2 Children | 38 (92.7%) | 3 (7.3%) |
| 3 or 4 Children | 0 (0.0%) | 0 (0.0%) |
| 5 or more Children | 0 (0.0%) | 0 (0.0%) |
| Total | 101 (97.1%) | 3 (2.9%) |
Income Below Poverty Among Single-Parent Households in Big Water
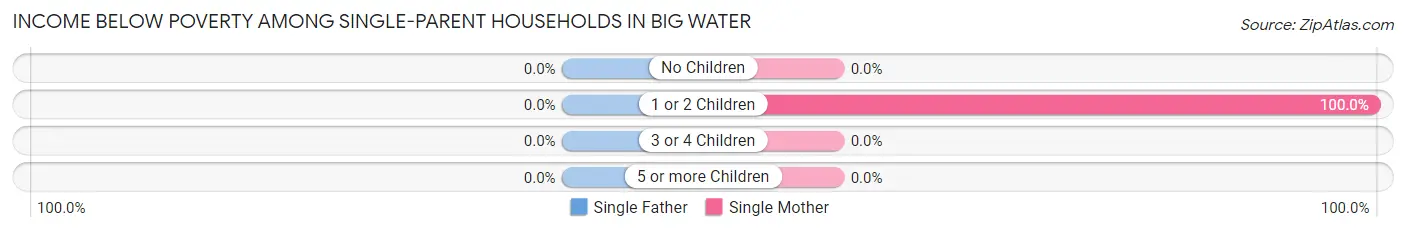
| Children | Single Father | Single Mother |
| No Children | 0 (0.0%) | 0 (0.0%) |
| 1 or 2 Children | 0 (0.0%) | 4 (100.0%) |
| 3 or 4 Children | 0 (0.0%) | 0 (0.0%) |
| 5 or more Children | 0 (0.0%) | 0 (0.0%) |
| Total | 0 (0.0%) | 4 (50.0%) |
Income Below Poverty Among Married-Couple vs Single-Parent Households in Big Water
The poverty data for Big Water shows that 3 of the married-couple family households (2.9%) and 4 of the single-parent households (50.0%) are living below the poverty level. Within the married-couple family households, those with 1 or 2 children have the highest poverty rate, with 3 households (7.3%) falling below the poverty line. Among the single-parent households, those with 1 or 2 children have the highest poverty rate, with 4 household (100.0%) living below poverty.
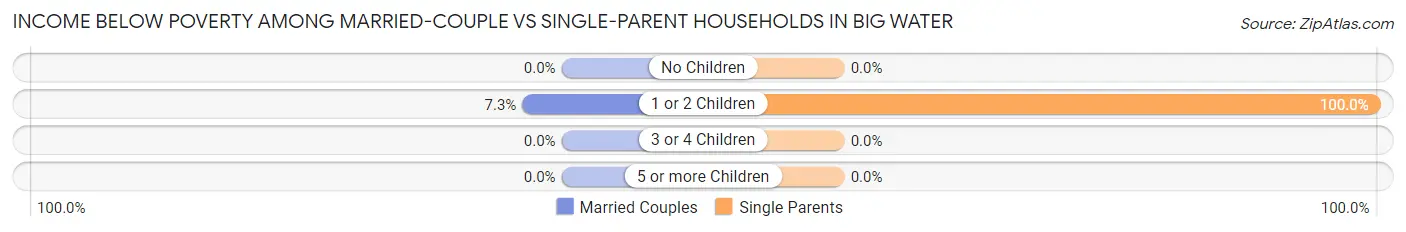
| Children | Married-Couple Families | Single-Parent Households |
| No Children | 0 (0.0%) | 0 (0.0%) |
| 1 or 2 Children | 3 (7.3%) | 4 (100.0%) |
| 3 or 4 Children | 0 (0.0%) | 0 (0.0%) |
| 5 or more Children | 0 (0.0%) | 0 (0.0%) |
| Total | 3 (2.9%) | 4 (50.0%) |
Race in Big Water
The most populous races in Big Water are White / Caucasian (466 | 81.2%), Some other Race (95 | 16.6%), and Hispanic or Latino (85 | 14.8%).
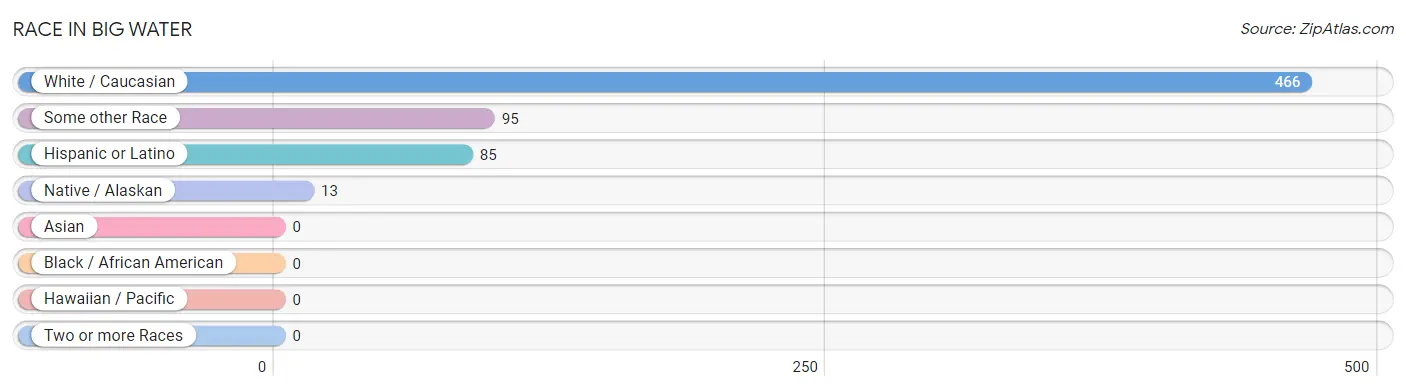
| Race | # Population | % Population |
| Asian | 0 | 0.0% |
| Black / African American | 0 | 0.0% |
| Hawaiian / Pacific | 0 | 0.0% |
| Hispanic or Latino | 85 | 14.8% |
| Native / Alaskan | 13 | 2.3% |
| White / Caucasian | 466 | 81.2% |
| Two or more Races | 0 | 0.0% |
| Some other Race | 95 | 16.6% |
| Total | 574 | 100.0% |
Ancestry in Big Water
The most populous ancestries reported in Big Water are German (129 | 22.5%), Irish (102 | 17.8%), Spanish (85 | 14.8%), English (79 | 13.8%), and Danish (49 | 8.5%), together accounting for 77.3% of all Big Water residents.
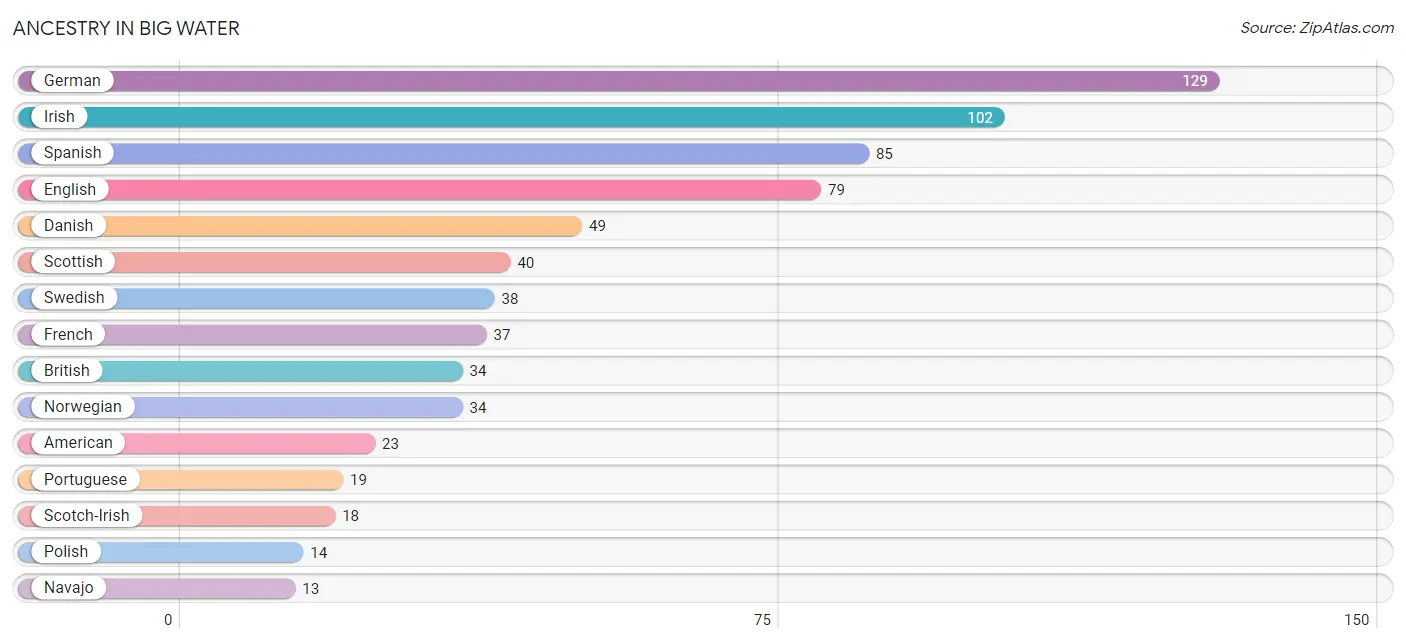
| Ancestry | # Population | % Population |
| American | 23 | 4.0% |
| British | 34 | 5.9% |
| Danish | 49 | 8.5% |
| Dutch | 8 | 1.4% |
| English | 79 | 13.8% |
| French | 37 | 6.5% |
| German | 129 | 22.5% |
| Greek | 10 | 1.7% |
| Irish | 102 | 17.8% |
| Italian | 5 | 0.9% |
| Navajo | 13 | 2.3% |
| Norwegian | 34 | 5.9% |
| Polish | 14 | 2.4% |
| Portuguese | 19 | 3.3% |
| Scotch-Irish | 18 | 3.1% |
| Scottish | 40 | 7.0% |
| Spanish | 85 | 14.8% |
| Swedish | 38 | 6.6% |
| Welsh | 7 | 1.2% | View All 19 Rows |
Immigrants in Big Water

| Immigration Origin | # Population | % Population | View All 0 Rows |
Sex and Age in Big Water
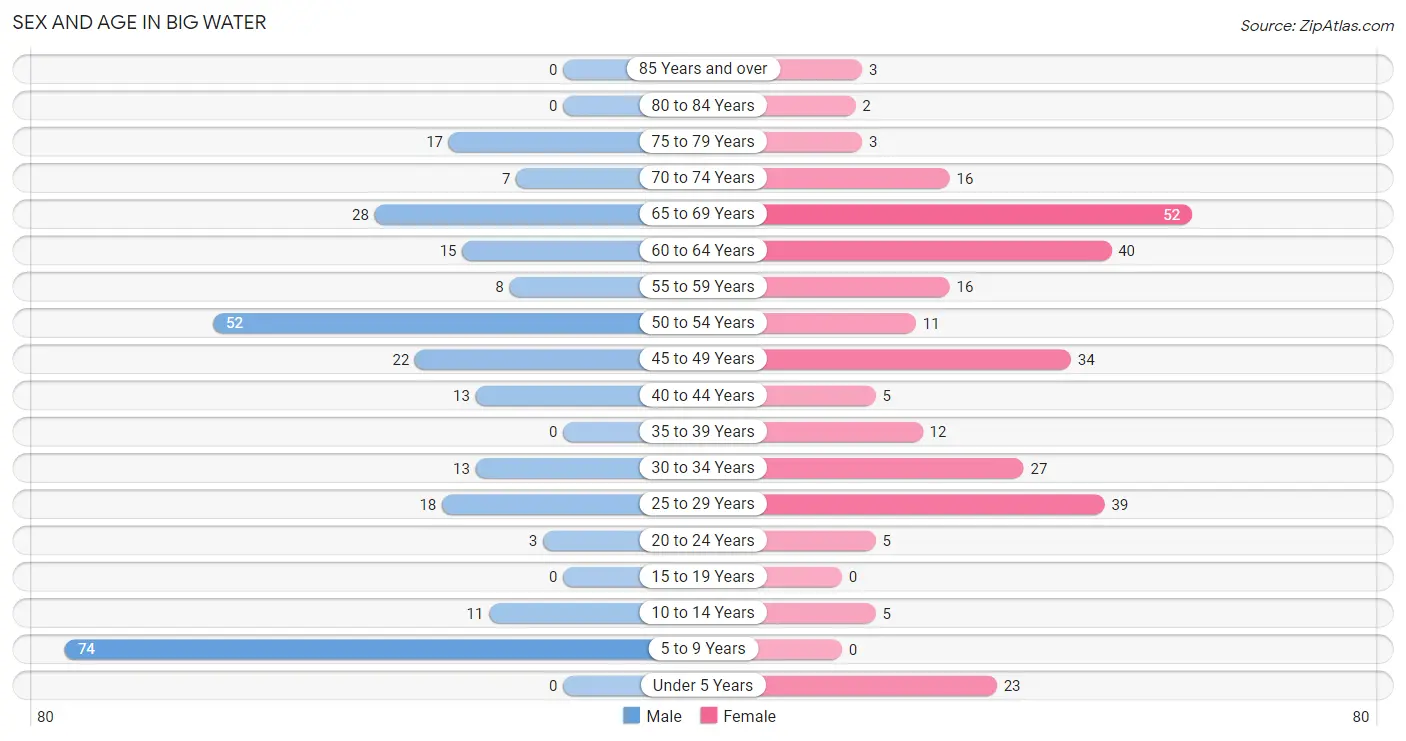
Sex and Age in Big Water
The most populous age groups in Big Water are 5 to 9 Years (74 | 26.3%) for men and 65 to 69 Years (52 | 17.7%) for women.
| Age Bracket | Male | Female |
| Under 5 Years | 0 (0.0%) | 23 (7.9%) |
| 5 to 9 Years | 74 (26.3%) | 0 (0.0%) |
| 10 to 14 Years | 11 (3.9%) | 5 (1.7%) |
| 15 to 19 Years | 0 (0.0%) | 0 (0.0%) |
| 20 to 24 Years | 3 (1.1%) | 5 (1.7%) |
| 25 to 29 Years | 18 (6.4%) | 39 (13.3%) |
| 30 to 34 Years | 13 (4.6%) | 27 (9.2%) |
| 35 to 39 Years | 0 (0.0%) | 12 (4.1%) |
| 40 to 44 Years | 13 (4.6%) | 5 (1.7%) |
| 45 to 49 Years | 22 (7.8%) | 34 (11.6%) |
| 50 to 54 Years | 52 (18.5%) | 11 (3.7%) |
| 55 to 59 Years | 8 (2.9%) | 16 (5.5%) |
| 60 to 64 Years | 15 (5.3%) | 40 (13.7%) |
| 65 to 69 Years | 28 (10.0%) | 52 (17.7%) |
| 70 to 74 Years | 7 (2.5%) | 16 (5.5%) |
| 75 to 79 Years | 17 (6.0%) | 3 (1.0%) |
| 80 to 84 Years | 0 (0.0%) | 2 (0.7%) |
| 85 Years and over | 0 (0.0%) | 3 (1.0%) |
| Total | 281 (100.0%) | 293 (100.0%) |
Families and Households in Big Water
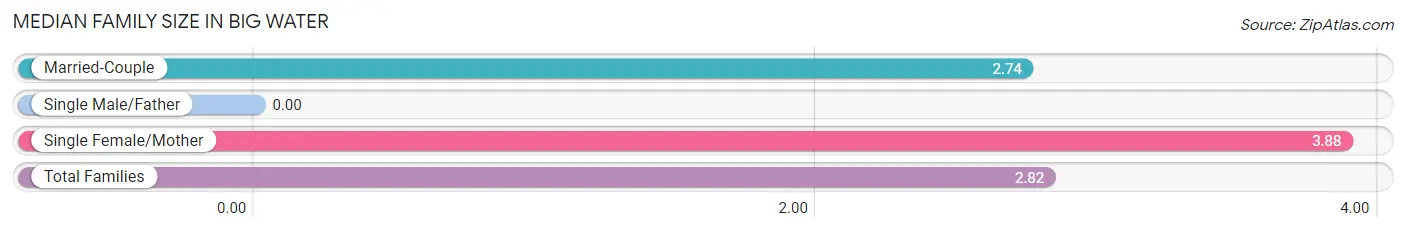
Median Family Size in Big Water
| Family Type | # Families | Family Size |
| Married-Couple | 104 (92.9%) | 2.74 |
| Single Male/Father | 0 (0.0%) | - |
| Single Female/Mother | 8 (7.1%) | 3.88 |
| Total Families | 112 (100.0%) | 2.82 |
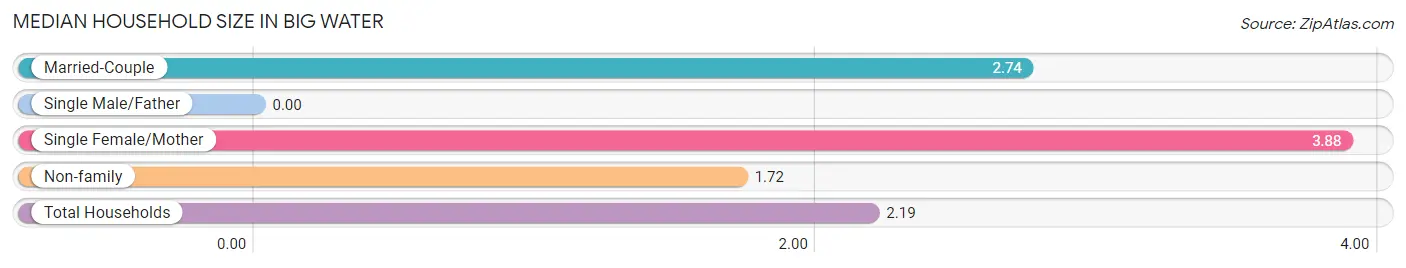
Median Household Size in Big Water
| Household Type | # Households | Household Size |
| Married-Couple | 104 (39.7%) | 2.74 |
| Single Male/Father | 0 (0.0%) | - |
| Single Female/Mother | 8 (3.0%) | 3.88 |
| Non-family | 150 (57.3%) | 1.72 |
| Total Households | 262 (100.0%) | 2.19 |
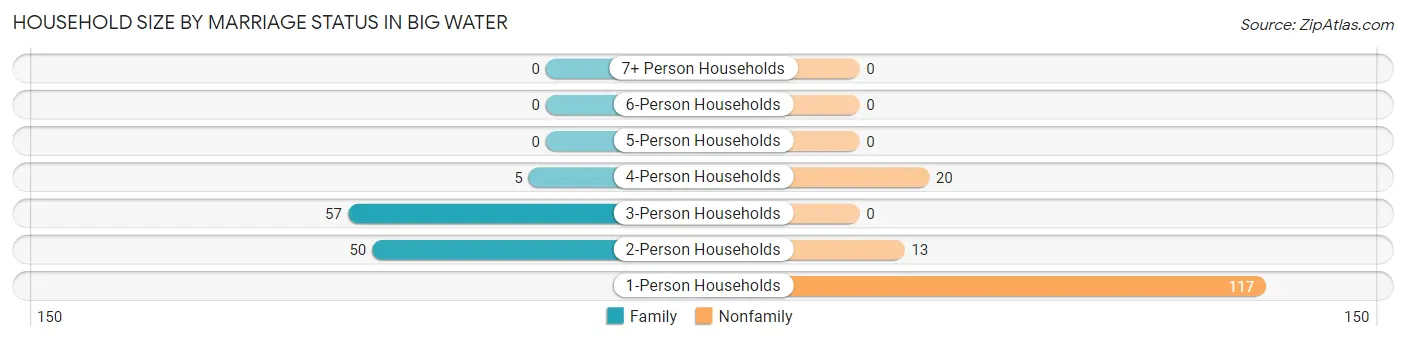
Household Size by Marriage Status in Big Water
Out of a total of 262 households in Big Water, 112 (42.7%) are family households, while 150 (57.3%) are nonfamily households. The most numerous type of family households are 3-person households, comprising 57, and the most common type of nonfamily households are 1-person households, comprising 117.
| Household Size | Family Households | Nonfamily Households |
| 1-Person Households | - | 117 (44.7%) |
| 2-Person Households | 50 (19.1%) | 13 (5.0%) |
| 3-Person Households | 57 (21.8%) | 0 (0.0%) |
| 4-Person Households | 5 (1.9%) | 20 (7.6%) |
| 5-Person Households | 0 (0.0%) | 0 (0.0%) |
| 6-Person Households | 0 (0.0%) | 0 (0.0%) |
| 7+ Person Households | 0 (0.0%) | 0 (0.0%) |
| Total | 112 (42.7%) | 150 (57.3%) |
Female Fertility in Big Water
Fertility by Age in Big Water
Average fertility rate in Big Water is 195.0 births per 1,000 women. Women in the age bracket of 20 to 34 years have the highest fertility rate with 366.0 births per 1,000 women. Women in the age bracket of 20 to 34 years acount for 100.0% of all women with births.
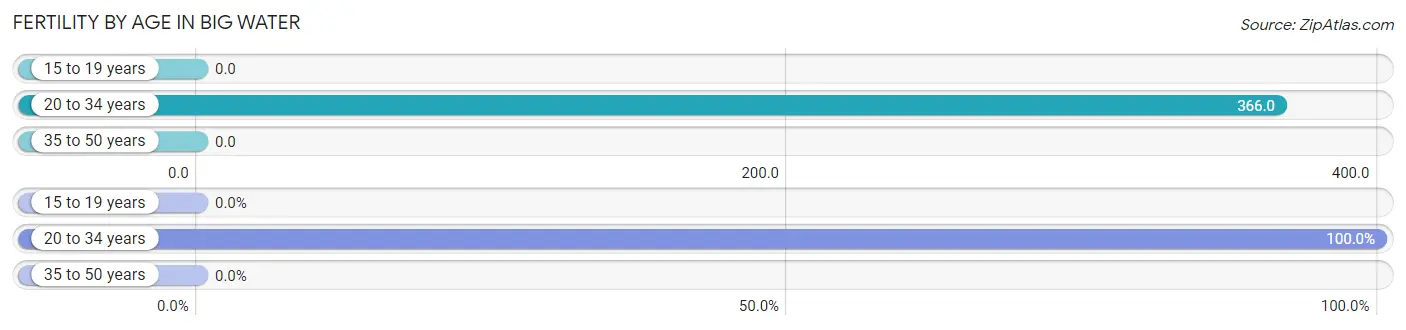
| Age Bracket | Women with Births | Births / 1,000 Women |
| 15 to 19 years | 0 (0.0%) | 0.0 |
| 20 to 34 years | 26 (100.0%) | 366.0 |
| 35 to 50 years | 0 (0.0%) | 0.0 |
| Total | 26 (100.0%) | 195.0 |
Fertility by Age by Marriage Status in Big Water
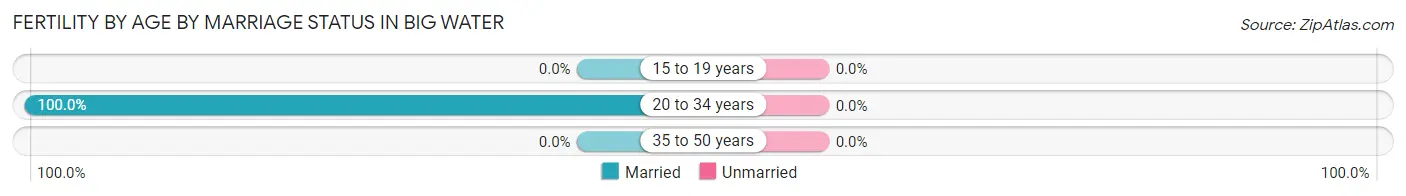
| Age Bracket | Married | Unmarried |
| 15 to 19 years | 0 (0.0%) | 0 (0.0%) |
| 20 to 34 years | 26 (100.0%) | 0 (0.0%) |
| 35 to 50 years | 0 (0.0%) | 0 (0.0%) |
| Total | 26 (100.0%) | 0 (0.0%) |
Fertility by Education in Big Water
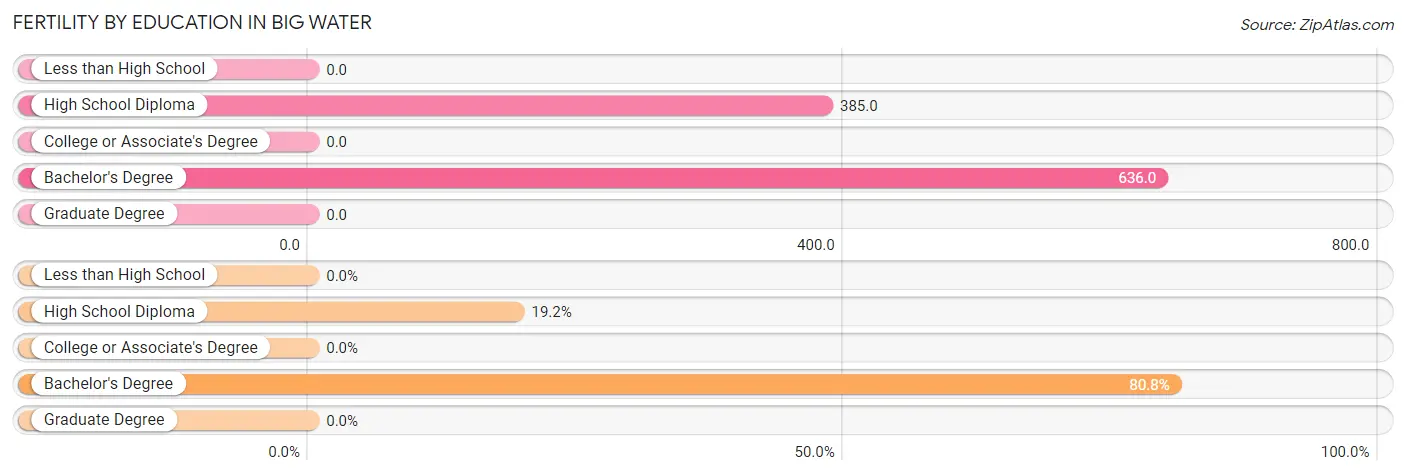
| Educational Attainment | Women with Births | Births / 1,000 Women |
| Less than High School | 0 (0.0%) | 0.0 |
| High School Diploma | 5 (19.2%) | 385.0 |
| College or Associate's Degree | 0 (0.0%) | 0.0 |
| Bachelor's Degree | 21 (80.8%) | 636.0 |
| Graduate Degree | 0 (0.0%) | 0.0 |
| Total | 26 (100.0%) | 195.0 |
Fertility by Education by Marriage Status in Big Water
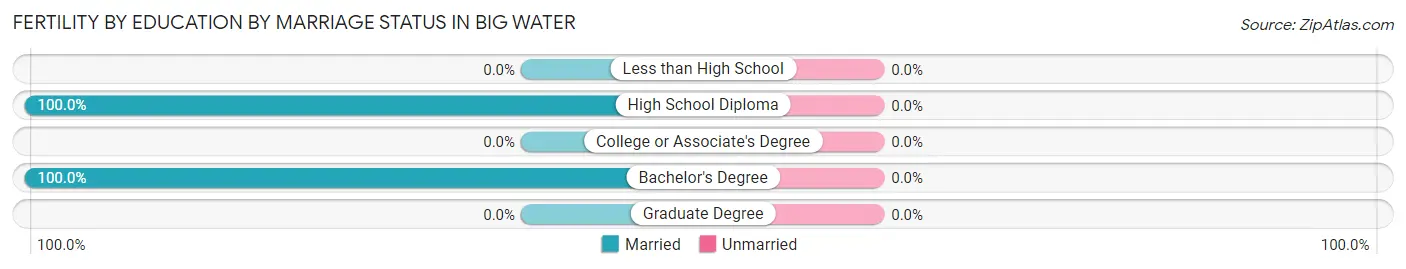
| Educational Attainment | Married | Unmarried |
| Less than High School | 0 (0.0%) | 0 (0.0%) |
| High School Diploma | 5 (100.0%) | 0 (0.0%) |
| College or Associate's Degree | 0 (0.0%) | 0 (0.0%) |
| Bachelor's Degree | 21 (100.0%) | 0 (0.0%) |
| Graduate Degree | 0 (0.0%) | 0 (0.0%) |
| Total | 26 (100.0%) | 0 (0.0%) |
Employment Characteristics in Big Water
Employment by Class of Employer in Big Water
Among the 215 employed individuals in Big Water, private company employees (141 | 65.6%), self-employed (incorporated) (26 | 12.1%), and local government employees (14 | 6.5%) make up the most common classes of employment.
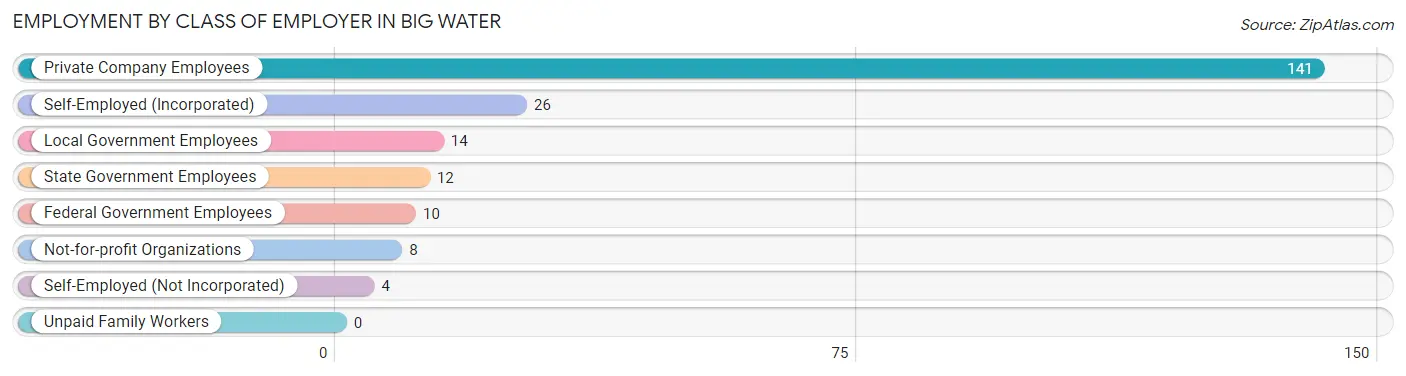
| Employer Class | # Employees | % Employees |
| Private Company Employees | 141 | 65.6% |
| Self-Employed (Incorporated) | 26 | 12.1% |
| Self-Employed (Not Incorporated) | 4 | 1.9% |
| Not-for-profit Organizations | 8 | 3.7% |
| Local Government Employees | 14 | 6.5% |
| State Government Employees | 12 | 5.6% |
| Federal Government Employees | 10 | 4.6% |
| Unpaid Family Workers | 0 | 0.0% |
| Total | 215 | 100.0% |
Employment Status by Age in Big Water
According to the labor force statistics for Big Water, out of the total population over 16 years of age (461), 56.8% or 262 individuals are in the labor force, with 5.0% or 13 of them unemployed. The age group with the highest labor force participation rate is 20 to 24 years, with 100.0% or 8 individuals in the labor force. Within the labor force, the 25 to 29 years age range has the highest percentage of unemployed individuals, with 25.0% or 13 of them being unemployed.
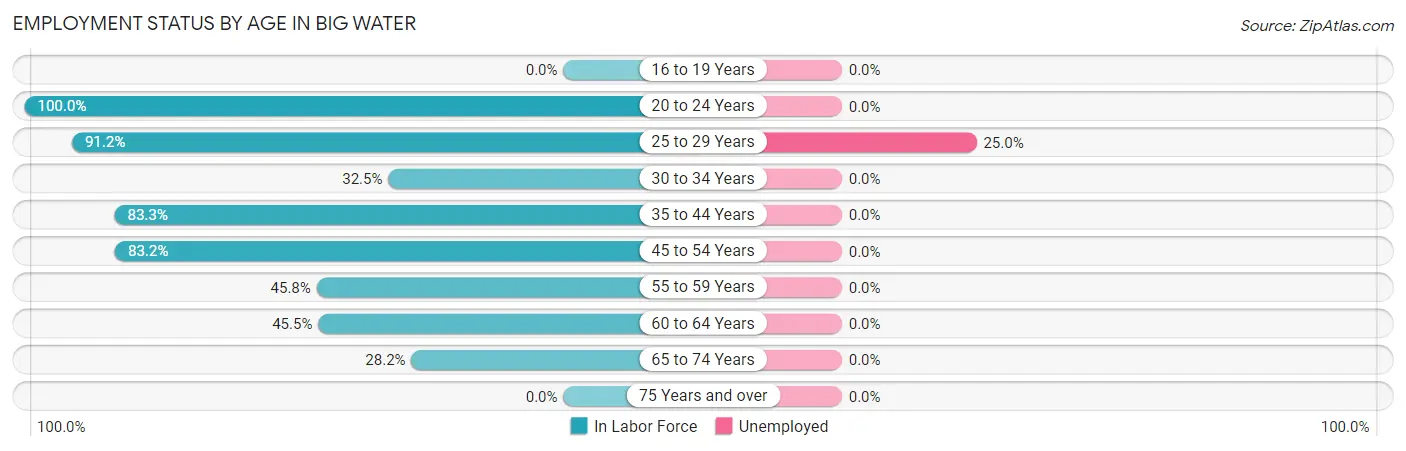
| Age Bracket | In Labor Force | Unemployed |
| 16 to 19 Years | 0 (0.0%) | 0 (0.0%) |
| 20 to 24 Years | 8 (100.0%) | 0 (0.0%) |
| 25 to 29 Years | 52 (91.2%) | 13 (25.0%) |
| 30 to 34 Years | 13 (32.5%) | 0 (0.0%) |
| 35 to 44 Years | 25 (83.3%) | 0 (0.0%) |
| 45 to 54 Years | 99 (83.2%) | 0 (0.0%) |
| 55 to 59 Years | 11 (45.8%) | 0 (0.0%) |
| 60 to 64 Years | 25 (45.5%) | 0 (0.0%) |
| 65 to 74 Years | 29 (28.2%) | 0 (0.0%) |
| 75 Years and over | 0 (0.0%) | 0 (0.0%) |
| Total | 262 (56.8%) | 13 (5.0%) |
Employment Status by Educational Attainment in Big Water
According to labor force statistics for Big Water, 69.2% of individuals (225) out of the total population between 25 and 64 years of age (325) are in the labor force, with 5.8% or 13 of them being unemployed. The group with the highest labor force participation rate are those with the educational attainment of college / associate degree, with 90.7% or 49 individuals in the labor force. Within the labor force, individuals with college / associate degree education have the highest percentage of unemployment, with 26.5% or 13 of them being unemployed.
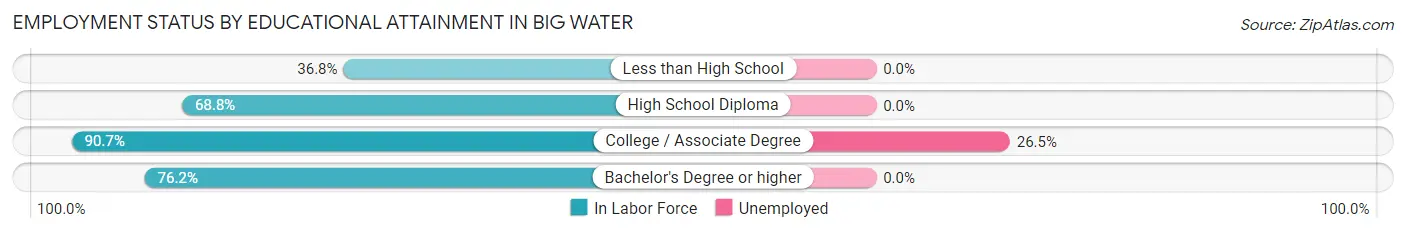
| Educational Attainment | In Labor Force | Unemployed |
| Less than High School | 21 (36.8%) | 0 (0.0%) |
| High School Diploma | 75 (68.8%) | 0 (0.0%) |
| College / Associate Degree | 49 (90.7%) | 14 (26.5%) |
| Bachelor's Degree or higher | 80 (76.2%) | 0 (0.0%) |
| Total | 225 (69.2%) | 19 (5.8%) |
Employment Occupations by Sex in Big Water
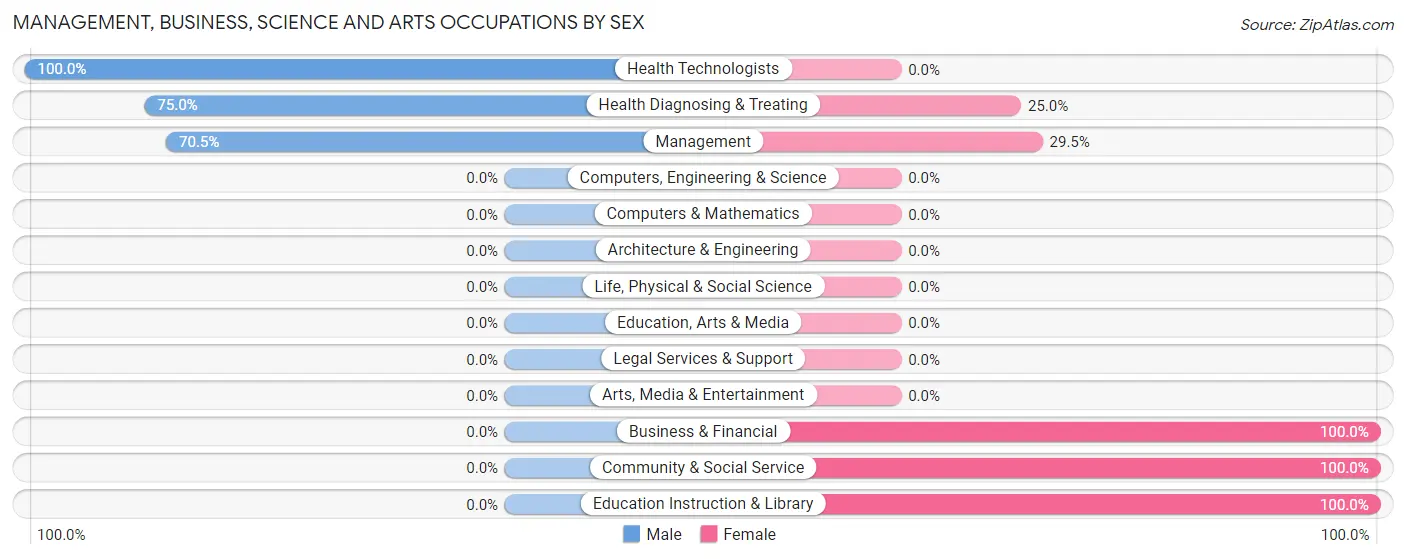
Management, Business, Science and Arts Occupations
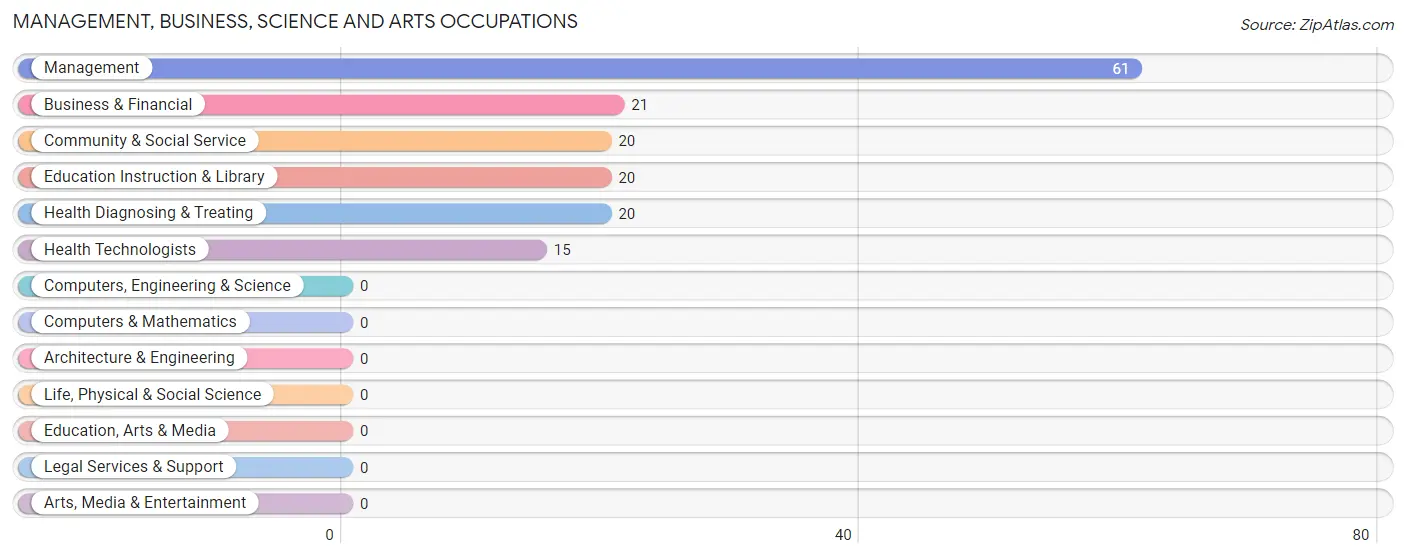
The most common Management, Business, Science and Arts occupations in Big Water are Management (61 | 24.5%), Business & Financial (21 | 8.4%), Community & Social Service (20 | 8.0%), Education Instruction & Library (20 | 8.0%), and Health Diagnosing & Treating (20 | 8.0%).
Management, Business, Science and Arts Occupations by Sex
Within the Management, Business, Science and Arts occupations in Big Water, the most male-oriented occupations are Health Technologists (100.0%), Health Diagnosing & Treating (75.0%), and Management (70.5%), while the most female-oriented occupations are Business & Financial (100.0%), Community & Social Service (100.0%), and Education Instruction & Library (100.0%).
| Occupation | Male | Female |
| Management | 43 (70.5%) | 18 (29.5%) |
| Business & Financial | 0 (0.0%) | 21 (100.0%) |
| Computers, Engineering & Science | 0 (0.0%) | 0 (0.0%) |
| Computers & Mathematics | 0 (0.0%) | 0 (0.0%) |
| Architecture & Engineering | 0 (0.0%) | 0 (0.0%) |
| Life, Physical & Social Science | 0 (0.0%) | 0 (0.0%) |
| Community & Social Service | 0 (0.0%) | 20 (100.0%) |
| Education, Arts & Media | 0 (0.0%) | 0 (0.0%) |
| Legal Services & Support | 0 (0.0%) | 0 (0.0%) |
| Education Instruction & Library | 0 (0.0%) | 20 (100.0%) |
| Arts, Media & Entertainment | 0 (0.0%) | 0 (0.0%) |
| Health Diagnosing & Treating | 15 (75.0%) | 5 (25.0%) |
| Health Technologists | 15 (100.0%) | 0 (0.0%) |
| Total (Category) | 58 (47.5%) | 64 (52.5%) |
| Total (Overall) | 128 (51.4%) | 121 (48.6%) |
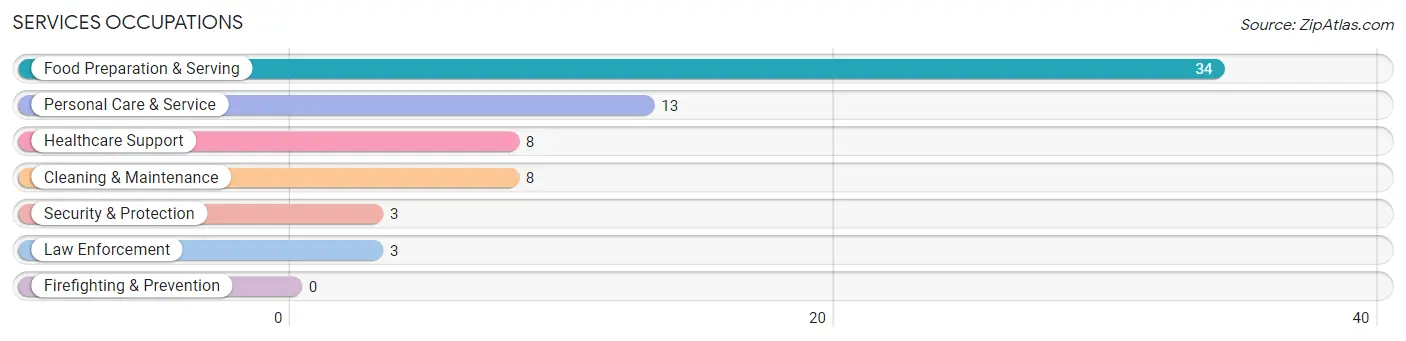
Services Occupations
The most common Services occupations in Big Water are Food Preparation & Serving (34 | 13.7%), Personal Care & Service (13 | 5.2%), Healthcare Support (8 | 3.2%), Cleaning & Maintenance (8 | 3.2%), and Security & Protection (3 | 1.2%).
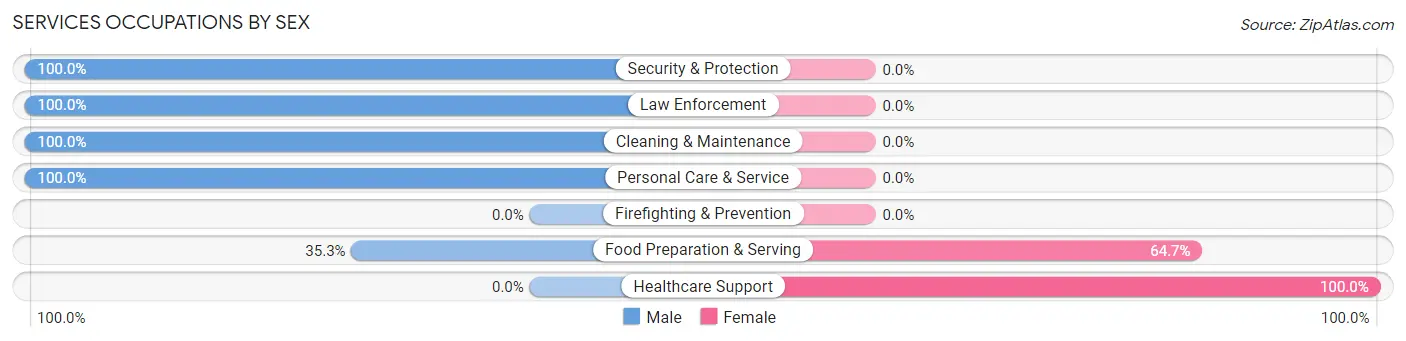
Services Occupations by Sex
Within the Services occupations in Big Water, the most male-oriented occupations are Security & Protection (100.0%), Law Enforcement (100.0%), and Cleaning & Maintenance (100.0%), while the most female-oriented occupations are Healthcare Support (100.0%), and Food Preparation & Serving (64.7%).
| Occupation | Male | Female |
| Healthcare Support | 0 (0.0%) | 8 (100.0%) |
| Security & Protection | 3 (100.0%) | 0 (0.0%) |
| Firefighting & Prevention | 0 (0.0%) | 0 (0.0%) |
| Law Enforcement | 3 (100.0%) | 0 (0.0%) |
| Food Preparation & Serving | 12 (35.3%) | 22 (64.7%) |
| Cleaning & Maintenance | 8 (100.0%) | 0 (0.0%) |
| Personal Care & Service | 13 (100.0%) | 0 (0.0%) |
| Total (Category) | 36 (54.5%) | 30 (45.5%) |
| Total (Overall) | 128 (51.4%) | 121 (48.6%) |
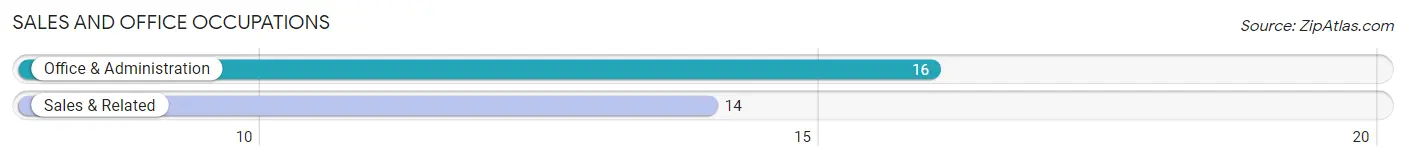
Sales and Office Occupations
The most common Sales and Office occupations in Big Water are Office & Administration (16 | 6.4%), and Sales & Related (14 | 5.6%).
Sales and Office Occupations by Sex
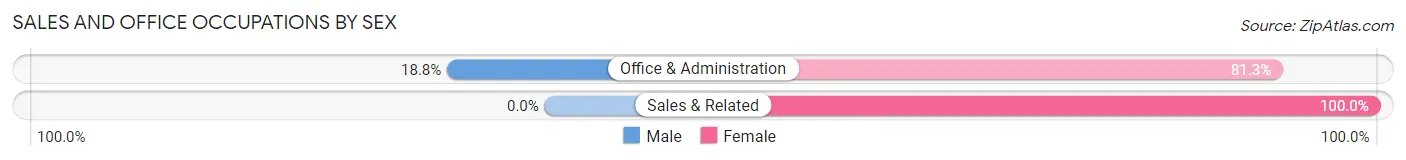
| Occupation | Male | Female |
| Sales & Related | 0 (0.0%) | 14 (100.0%) |
| Office & Administration | 3 (18.8%) | 13 (81.2%) |
| Total (Category) | 3 (10.0%) | 27 (90.0%) |
| Total (Overall) | 128 (51.4%) | 121 (48.6%) |
Natural Resources, Construction and Maintenance Occupations
The most common Natural Resources, Construction and Maintenance occupations in Big Water are , and Construction & Extraction (8 | 3.2%).
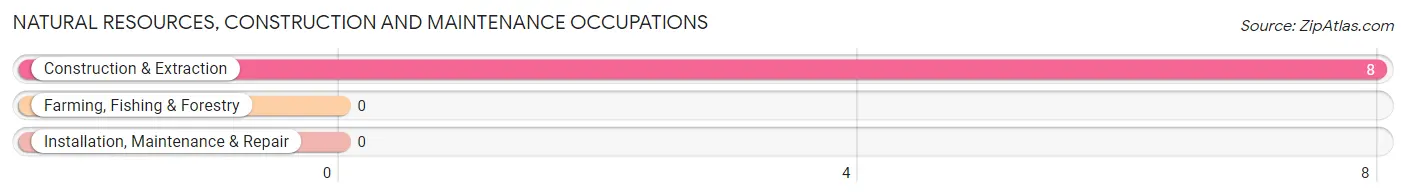
Natural Resources, Construction and Maintenance Occupations by Sex
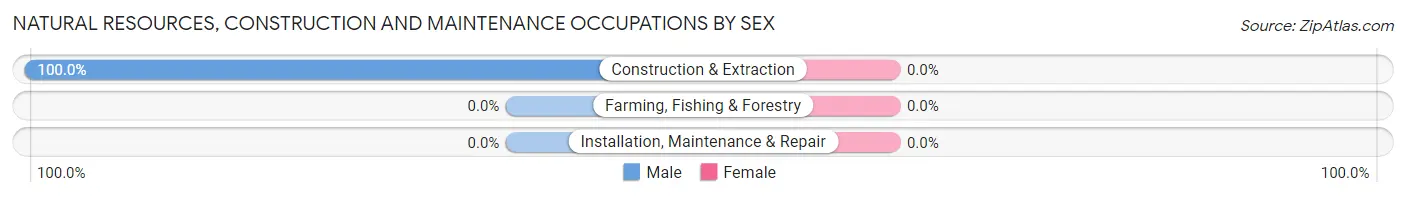
| Occupation | Male | Female |
| Farming, Fishing & Forestry | 0 (0.0%) | 0 (0.0%) |
| Construction & Extraction | 8 (100.0%) | 0 (0.0%) |
| Installation, Maintenance & Repair | 0 (0.0%) | 0 (0.0%) |
| Total (Category) | 8 (100.0%) | 0 (0.0%) |
| Total (Overall) | 128 (51.4%) | 121 (48.6%) |
Production, Transportation and Moving Occupations
The most common Production, Transportation and Moving occupations in Big Water are Material Moving (16 | 6.4%), and Transportation (7 | 2.8%).
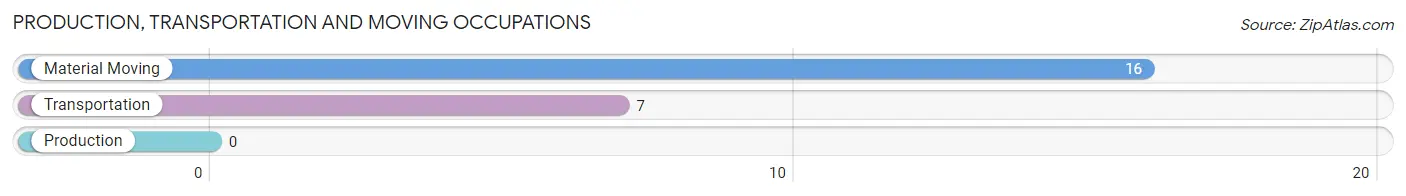
Production, Transportation and Moving Occupations by Sex
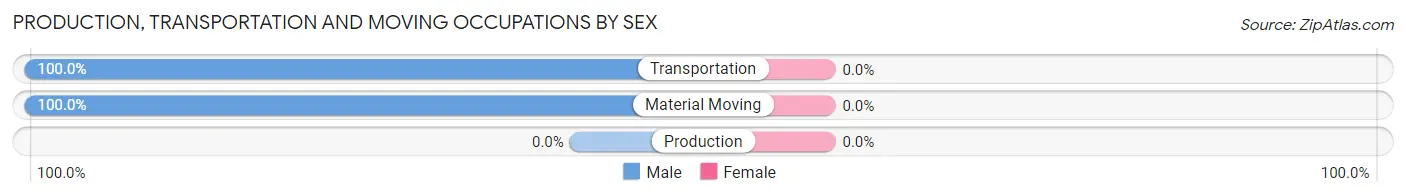
| Occupation | Male | Female |
| Production | 0 (0.0%) | 0 (0.0%) |
| Transportation | 7 (100.0%) | 0 (0.0%) |
| Material Moving | 16 (100.0%) | 0 (0.0%) |
| Total (Category) | 23 (100.0%) | 0 (0.0%) |
| Total (Overall) | 128 (51.4%) | 121 (48.6%) |
Employment Industries by Sex in Big Water
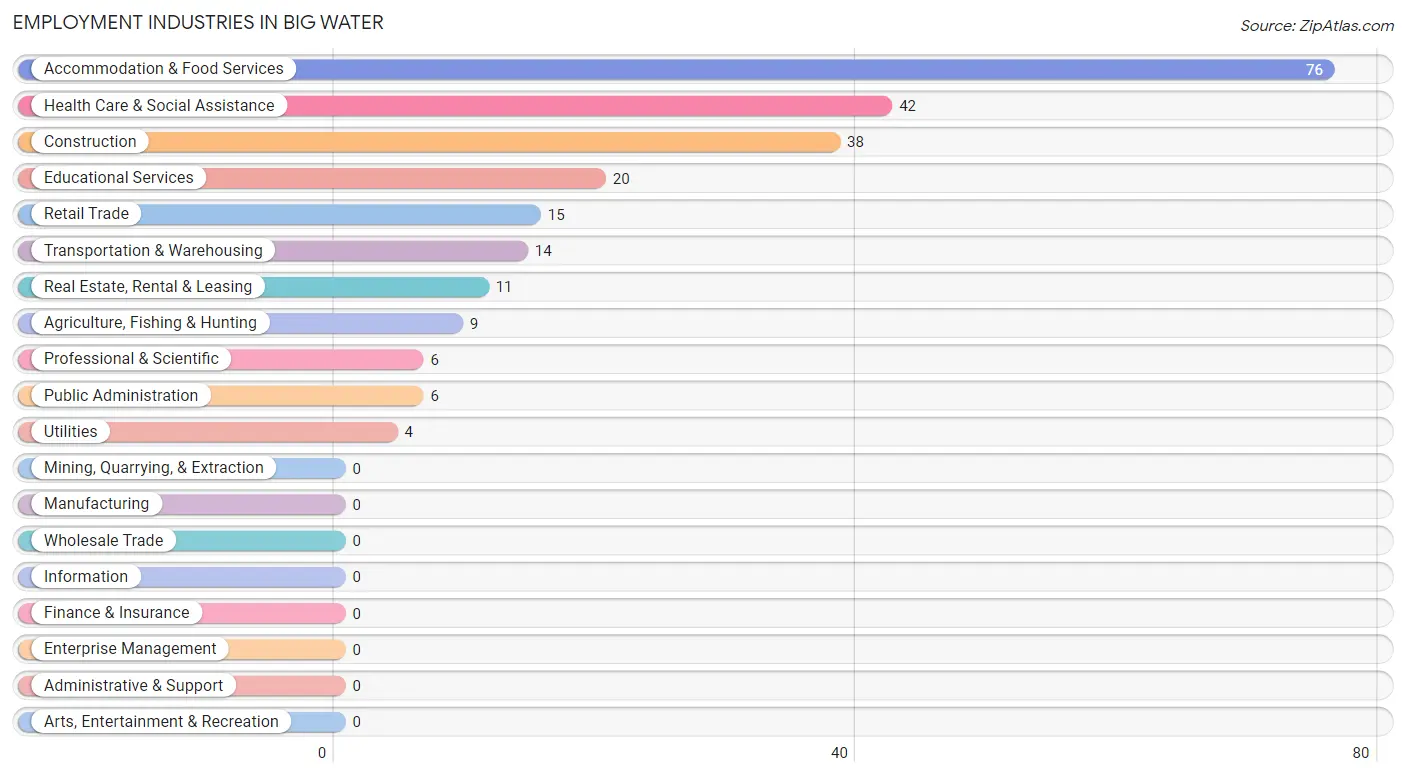
Employment Industries in Big Water
The major employment industries in Big Water include Accommodation & Food Services (76 | 30.5%), Health Care & Social Assistance (42 | 16.9%), Construction (38 | 15.3%), Educational Services (20 | 8.0%), and Retail Trade (15 | 6.0%).
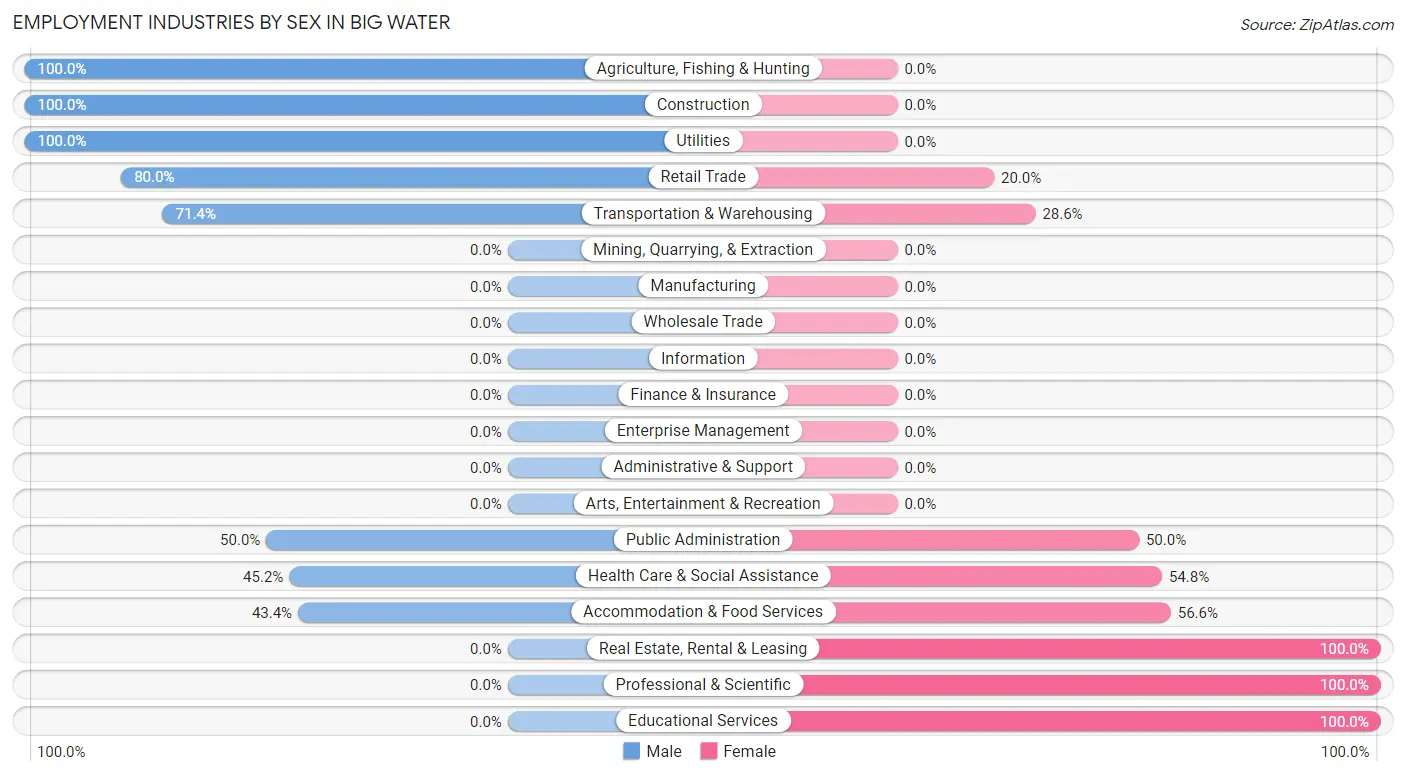
Employment Industries by Sex in Big Water
The Big Water industries that see more men than women are Agriculture, Fishing & Hunting (100.0%), Construction (100.0%), and Utilities (100.0%), whereas the industries that tend to have a higher number of women are Real Estate, Rental & Leasing (100.0%), Professional & Scientific (100.0%), and Educational Services (100.0%).
| Industry | Male | Female |
| Agriculture, Fishing & Hunting | 9 (100.0%) | 0 (0.0%) |
| Mining, Quarrying, & Extraction | 0 (0.0%) | 0 (0.0%) |
| Construction | 38 (100.0%) | 0 (0.0%) |
| Manufacturing | 0 (0.0%) | 0 (0.0%) |
| Wholesale Trade | 0 (0.0%) | 0 (0.0%) |
| Retail Trade | 12 (80.0%) | 3 (20.0%) |
| Transportation & Warehousing | 10 (71.4%) | 4 (28.6%) |
| Utilities | 4 (100.0%) | 0 (0.0%) |
| Information | 0 (0.0%) | 0 (0.0%) |
| Finance & Insurance | 0 (0.0%) | 0 (0.0%) |
| Real Estate, Rental & Leasing | 0 (0.0%) | 11 (100.0%) |
| Professional & Scientific | 0 (0.0%) | 6 (100.0%) |
| Enterprise Management | 0 (0.0%) | 0 (0.0%) |
| Administrative & Support | 0 (0.0%) | 0 (0.0%) |
| Educational Services | 0 (0.0%) | 20 (100.0%) |
| Health Care & Social Assistance | 19 (45.2%) | 23 (54.8%) |
| Arts, Entertainment & Recreation | 0 (0.0%) | 0 (0.0%) |
| Accommodation & Food Services | 33 (43.4%) | 43 (56.6%) |
| Public Administration | 3 (50.0%) | 3 (50.0%) |
| Total | 128 (51.4%) | 121 (48.6%) |
Education in Big Water
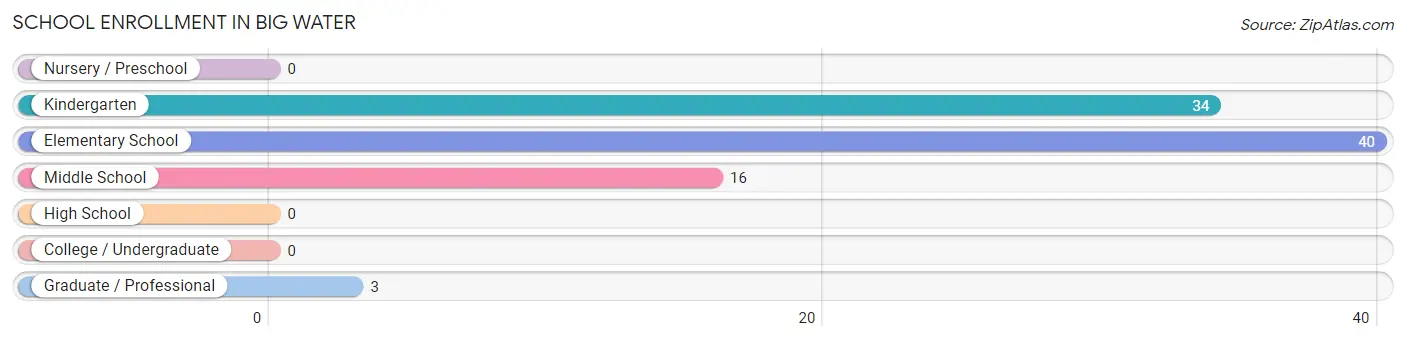
School Enrollment in Big Water
The most common levels of schooling among the 93 students in Big Water are elementary school (40 | 43.0%), kindergarten (34 | 36.6%), and middle school (16 | 17.2%).
| School Level | # Students | % Students |
| Nursery / Preschool | 0 | 0.0% |
| Kindergarten | 34 | 36.6% |
| Elementary School | 40 | 43.0% |
| Middle School | 16 | 17.2% |
| High School | 0 | 0.0% |
| College / Undergraduate | 0 | 0.0% |
| Graduate / Professional | 3 | 3.2% |
| Total | 93 | 100.0% |
School Enrollment by Age by Funding Source in Big Water
Out of a total of 93 students who are enrolled in schools in Big Water, 5 (5.4%) attend a private institution, while the remaining 88 (94.6%) are enrolled in public schools. The age group of 10 to 14 year olds has the highest likelihood of being enrolled in private schools, with 5 (31.2% in the age bracket) enrolled. Conversely, the age group of 5 to 9 year old has the lowest likelihood of being enrolled in a private school, with 74 (100.0% in the age bracket) attending a public institution.
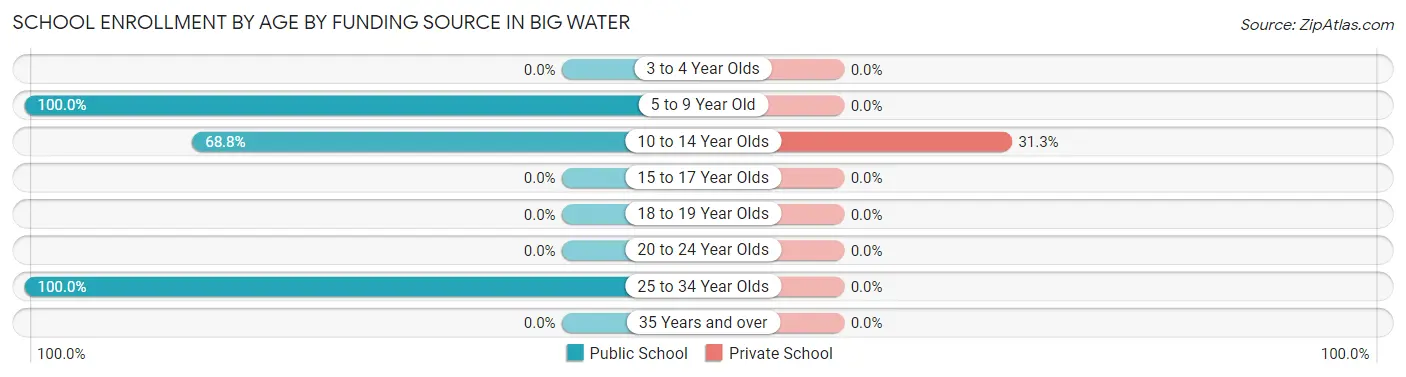
| Age Bracket | Public School | Private School |
| 3 to 4 Year Olds | 0 (0.0%) | 0 (0.0%) |
| 5 to 9 Year Old | 74 (100.0%) | 0 (0.0%) |
| 10 to 14 Year Olds | 11 (68.8%) | 5 (31.2%) |
| 15 to 17 Year Olds | 0 (0.0%) | 0 (0.0%) |
| 18 to 19 Year Olds | 0 (0.0%) | 0 (0.0%) |
| 20 to 24 Year Olds | 0 (0.0%) | 0 (0.0%) |
| 25 to 34 Year Olds | 3 (100.0%) | 0 (0.0%) |
| 35 Years and over | 0 (0.0%) | 0 (0.0%) |
| Total | 88 (94.6%) | 5 (5.4%) |
Educational Attainment by Field of Study in Big Water
Business (42 | 23.3%), education (29 | 16.1%), bio, nature & agricultural (16 | 8.9%), multidisciplinary studies (16 | 8.9%), and science & technology (16 | 8.9%) are the most common fields of study among 180 individuals in Big Water who have obtained a bachelor's degree or higher.
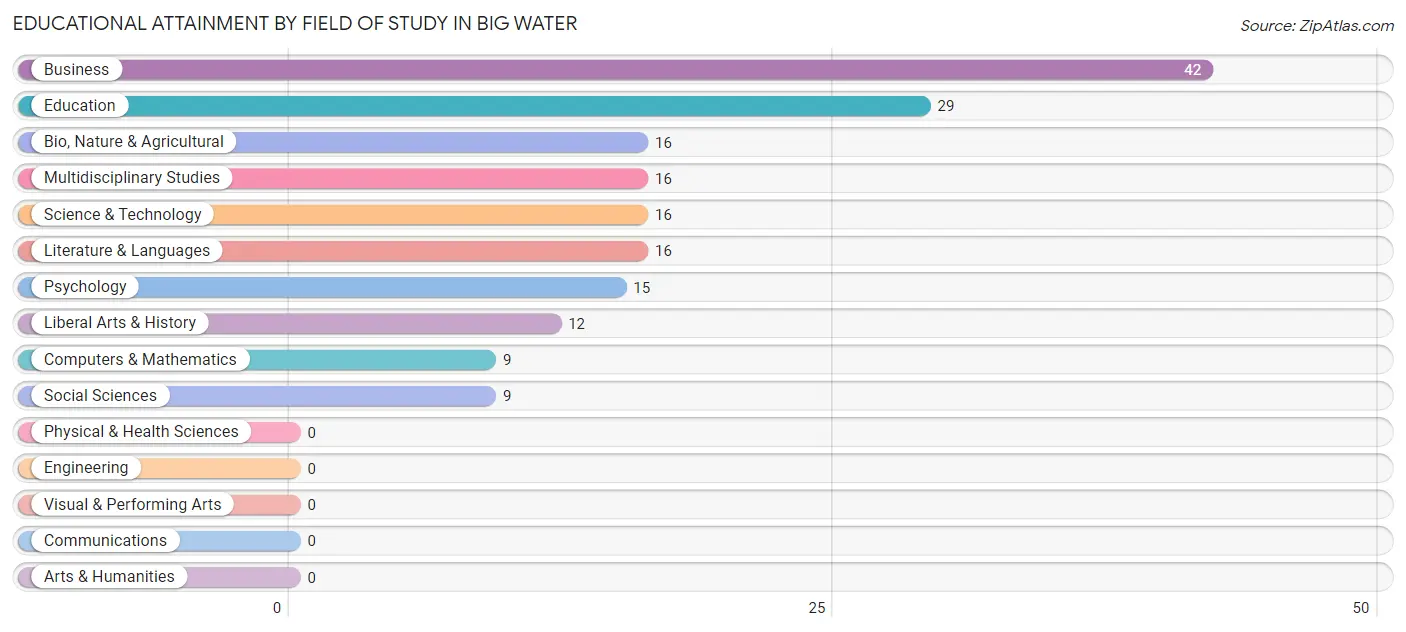
| Field of Study | # Graduates | % Graduates |
| Computers & Mathematics | 9 | 5.0% |
| Bio, Nature & Agricultural | 16 | 8.9% |
| Physical & Health Sciences | 0 | 0.0% |
| Psychology | 15 | 8.3% |
| Social Sciences | 9 | 5.0% |
| Engineering | 0 | 0.0% |
| Multidisciplinary Studies | 16 | 8.9% |
| Science & Technology | 16 | 8.9% |
| Business | 42 | 23.3% |
| Education | 29 | 16.1% |
| Literature & Languages | 16 | 8.9% |
| Liberal Arts & History | 12 | 6.7% |
| Visual & Performing Arts | 0 | 0.0% |
| Communications | 0 | 0.0% |
| Arts & Humanities | 0 | 0.0% |
| Total | 180 | 100.0% |
Transportation & Commute in Big Water
Vehicle Availability by Sex in Big Water
The most prevalent vehicle ownership categories in Big Water are males with 2 vehicles (41, accounting for 35.6%) and females with 2 vehicles (35, making up 41.0%).
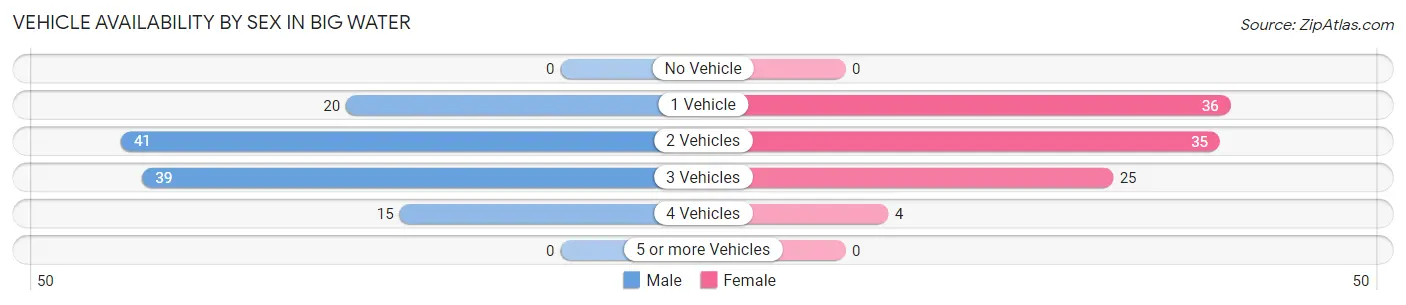
| Vehicles Available | Male | Female |
| No Vehicle | 0 (0.0%) | 0 (0.0%) |
| 1 Vehicle | 20 (17.4%) | 36 (36.0%) |
| 2 Vehicles | 41 (35.6%) | 35 (35.0%) |
| 3 Vehicles | 39 (33.9%) | 25 (25.0%) |
| 4 Vehicles | 15 (13.0%) | 4 (4.0%) |
| 5 or more Vehicles | 0 (0.0%) | 0 (0.0%) |
| Total | 115 (100.0%) | 100 (100.0%) |
Commute Time in Big Water
The most frequently occuring commute durations in Big Water are 20 to 24 minutes (110 commuters, 55.6%), 25 to 29 minutes (43 commuters, 21.7%), and 5 to 9 minutes (20 commuters, 10.1%).
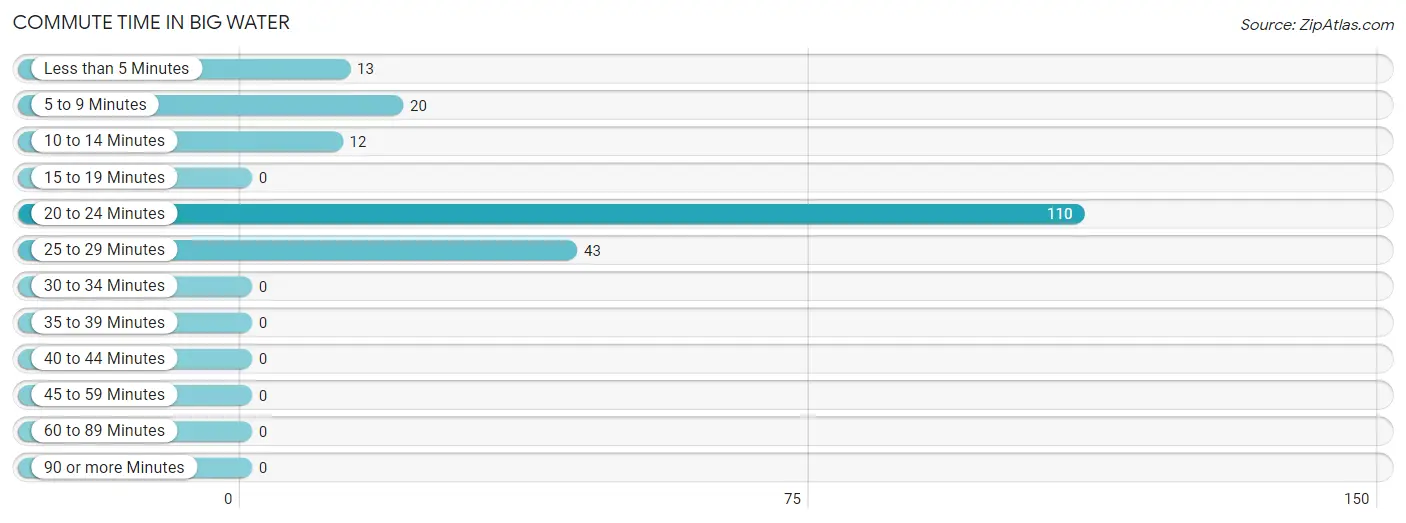
| Commute Time | # Commuters | % Commuters |
| Less than 5 Minutes | 13 | 6.6% |
| 5 to 9 Minutes | 20 | 10.1% |
| 10 to 14 Minutes | 12 | 6.1% |
| 15 to 19 Minutes | 0 | 0.0% |
| 20 to 24 Minutes | 110 | 55.6% |
| 25 to 29 Minutes | 43 | 21.7% |
| 30 to 34 Minutes | 0 | 0.0% |
| 35 to 39 Minutes | 0 | 0.0% |
| 40 to 44 Minutes | 0 | 0.0% |
| 45 to 59 Minutes | 0 | 0.0% |
| 60 to 89 Minutes | 0 | 0.0% |
| 90 or more Minutes | 0 | 0.0% |
Commute Time by Sex in Big Water
The most common commute times in Big Water are 20 to 24 minutes (70 commuters, 60.9%) for males and 20 to 24 minutes (40 commuters, 48.2%) for females.
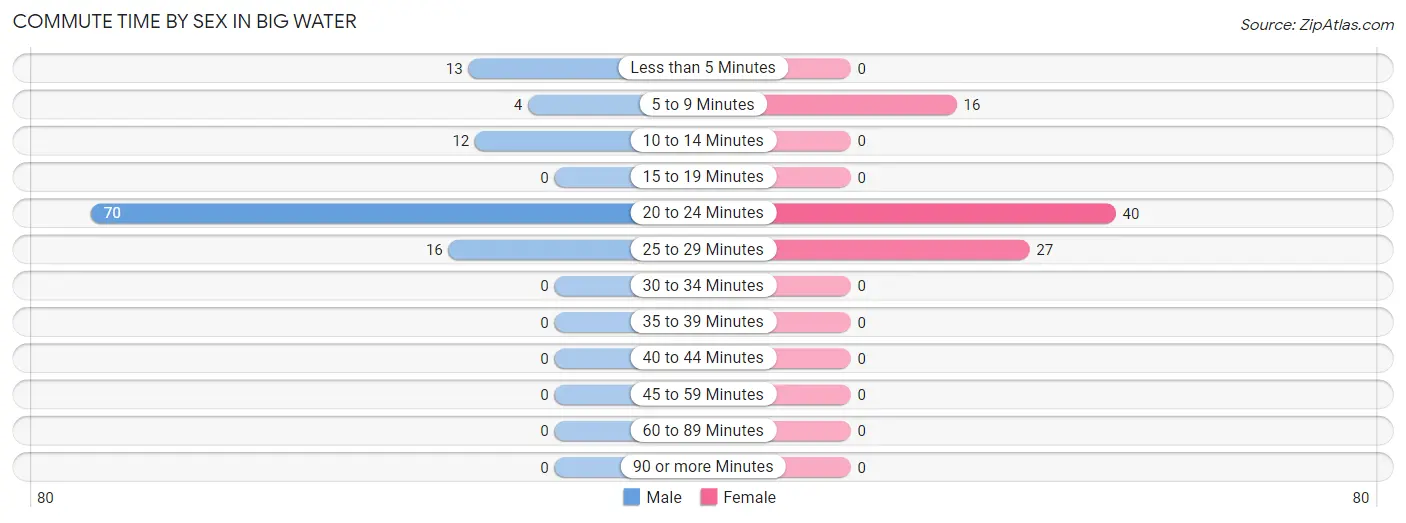
| Commute Time | Male | Female |
| Less than 5 Minutes | 13 (11.3%) | 0 (0.0%) |
| 5 to 9 Minutes | 4 (3.5%) | 16 (19.3%) |
| 10 to 14 Minutes | 12 (10.4%) | 0 (0.0%) |
| 15 to 19 Minutes | 0 (0.0%) | 0 (0.0%) |
| 20 to 24 Minutes | 70 (60.9%) | 40 (48.2%) |
| 25 to 29 Minutes | 16 (13.9%) | 27 (32.5%) |
| 30 to 34 Minutes | 0 (0.0%) | 0 (0.0%) |
| 35 to 39 Minutes | 0 (0.0%) | 0 (0.0%) |
| 40 to 44 Minutes | 0 (0.0%) | 0 (0.0%) |
| 45 to 59 Minutes | 0 (0.0%) | 0 (0.0%) |
| 60 to 89 Minutes | 0 (0.0%) | 0 (0.0%) |
| 90 or more Minutes | 0 (0.0%) | 0 (0.0%) |
Time of Departure to Work by Sex in Big Water
The most frequent times of departure to work in Big Water are 5:30 AM to 5:59 AM (48, 41.7%) for males and 12:00 PM to 3:59 PM (20, 24.1%) for females.
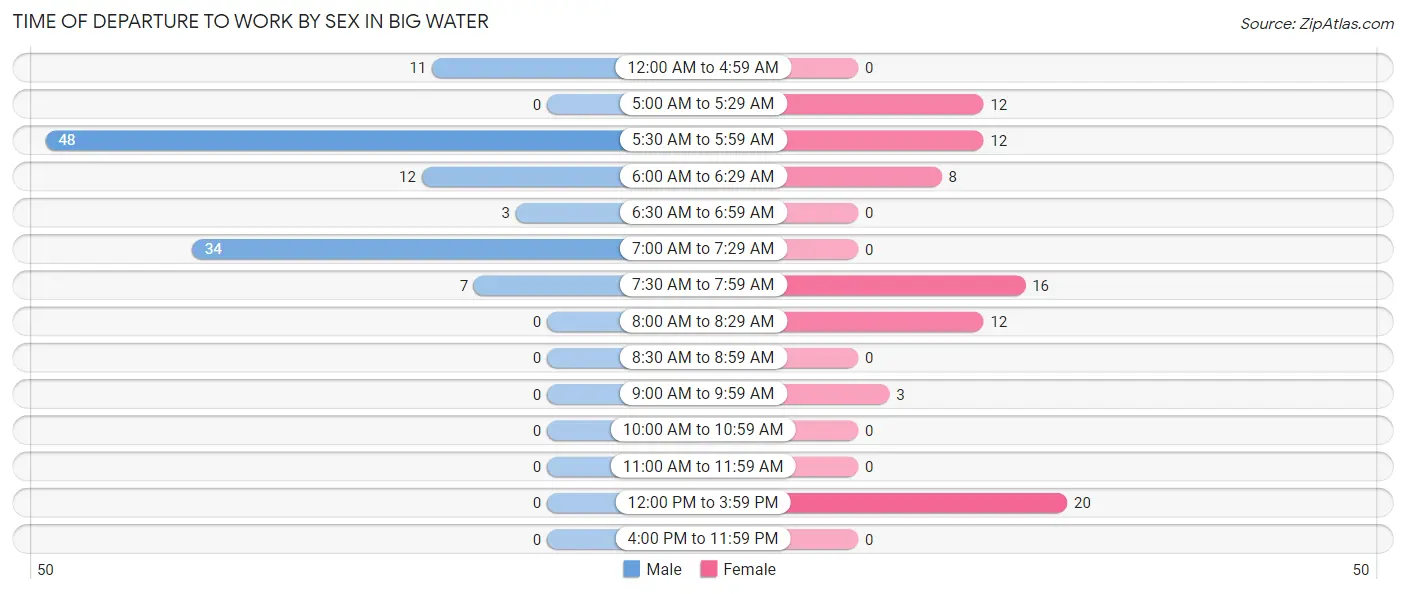
| Time of Departure | Male | Female |
| 12:00 AM to 4:59 AM | 11 (9.6%) | 0 (0.0%) |
| 5:00 AM to 5:29 AM | 0 (0.0%) | 12 (14.5%) |
| 5:30 AM to 5:59 AM | 48 (41.7%) | 12 (14.5%) |
| 6:00 AM to 6:29 AM | 12 (10.4%) | 8 (9.6%) |
| 6:30 AM to 6:59 AM | 3 (2.6%) | 0 (0.0%) |
| 7:00 AM to 7:29 AM | 34 (29.6%) | 0 (0.0%) |
| 7:30 AM to 7:59 AM | 7 (6.1%) | 16 (19.3%) |
| 8:00 AM to 8:29 AM | 0 (0.0%) | 12 (14.5%) |
| 8:30 AM to 8:59 AM | 0 (0.0%) | 0 (0.0%) |
| 9:00 AM to 9:59 AM | 0 (0.0%) | 3 (3.6%) |
| 10:00 AM to 10:59 AM | 0 (0.0%) | 0 (0.0%) |
| 11:00 AM to 11:59 AM | 0 (0.0%) | 0 (0.0%) |
| 12:00 PM to 3:59 PM | 0 (0.0%) | 20 (24.1%) |
| 4:00 PM to 11:59 PM | 0 (0.0%) | 0 (0.0%) |
| Total | 115 (100.0%) | 83 (100.0%) |
Housing Occupancy in Big Water
Occupancy by Ownership in Big Water
Of the total 262 dwellings in Big Water, owner-occupied units account for 226 (86.3%), while renter-occupied units make up 36 (13.7%).
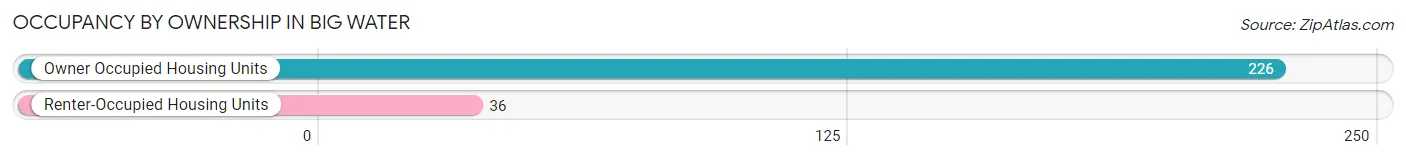
| Occupancy | # Housing Units | % Housing Units |
| Owner Occupied Housing Units | 226 | 86.3% |
| Renter-Occupied Housing Units | 36 | 13.7% |
| Total Occupied Housing Units | 262 | 100.0% |
Occupancy by Household Size in Big Water
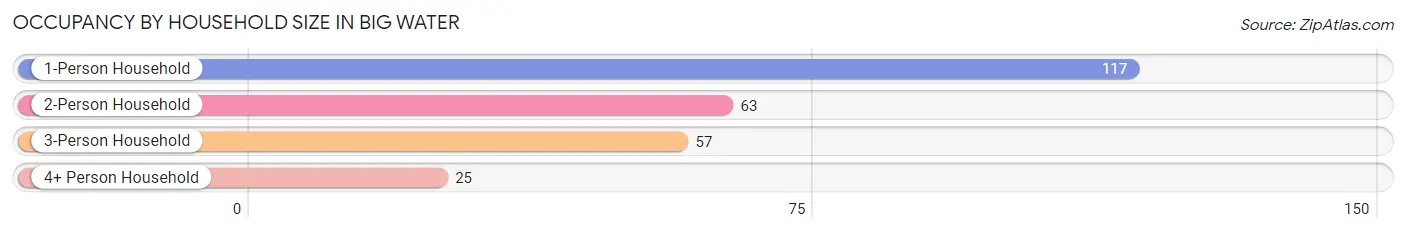
| Household Size | # Housing Units | % Housing Units |
| 1-Person Household | 117 | 44.7% |
| 2-Person Household | 63 | 24.0% |
| 3-Person Household | 57 | 21.8% |
| 4+ Person Household | 25 | 9.5% |
| Total Housing Units | 262 | 100.0% |
Occupancy by Ownership by Household Size in Big Water
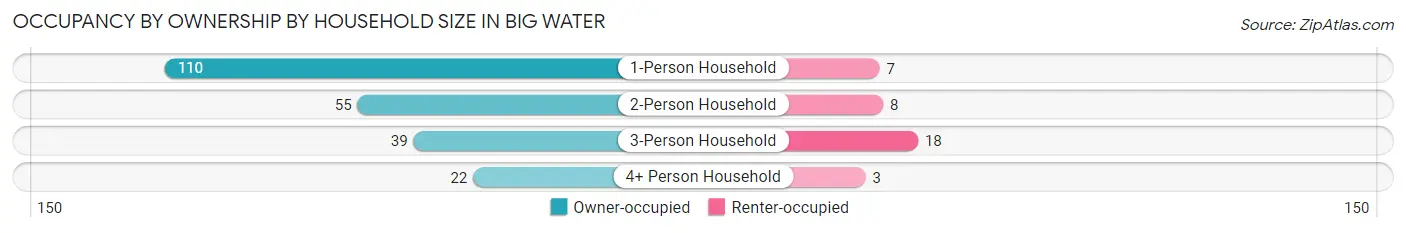
| Household Size | Owner-occupied | Renter-occupied |
| 1-Person Household | 110 (94.0%) | 7 (6.0%) |
| 2-Person Household | 55 (87.3%) | 8 (12.7%) |
| 3-Person Household | 39 (68.4%) | 18 (31.6%) |
| 4+ Person Household | 22 (88.0%) | 3 (12.0%) |
| Total Housing Units | 226 (86.3%) | 36 (13.7%) |
Occupancy by Educational Attainment in Big Water
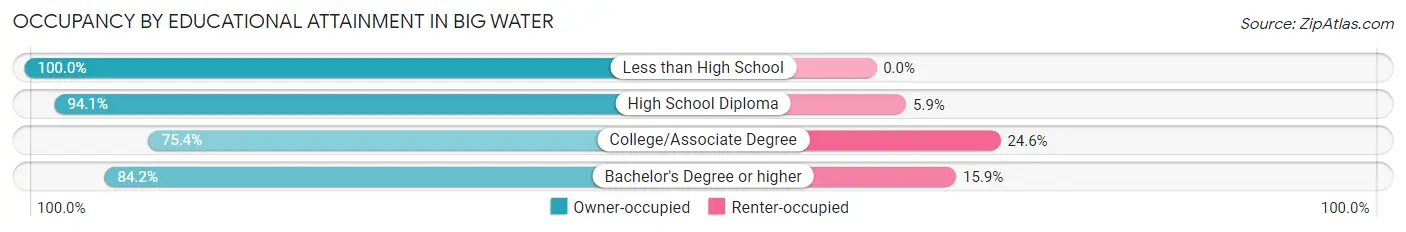
| Household Size | Owner-occupied | Renter-occupied |
| Less than High School | 10 (100.0%) | 0 (0.0%) |
| High School Diploma | 95 (94.1%) | 6 (5.9%) |
| College/Associate Degree | 52 (75.4%) | 17 (24.6%) |
| Bachelor's Degree or higher | 69 (84.2%) | 13 (15.9%) |
Occupancy by Age of Householder in Big Water
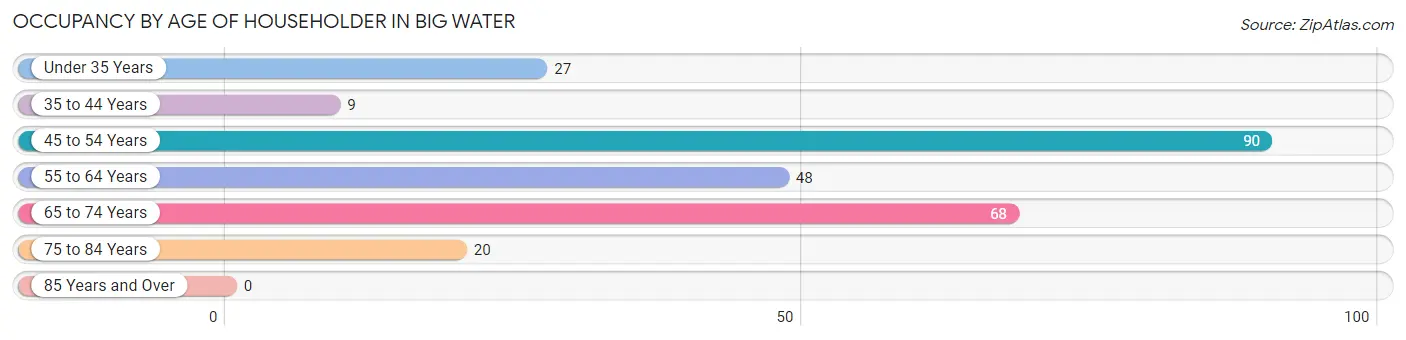
| Age Bracket | # Households | % Households |
| Under 35 Years | 27 | 10.3% |
| 35 to 44 Years | 9 | 3.4% |
| 45 to 54 Years | 90 | 34.4% |
| 55 to 64 Years | 48 | 18.3% |
| 65 to 74 Years | 68 | 26.0% |
| 75 to 84 Years | 20 | 7.6% |
| 85 Years and Over | 0 | 0.0% |
| Total | 262 | 100.0% |
Housing Finances in Big Water
Median Income by Occupancy in Big Water
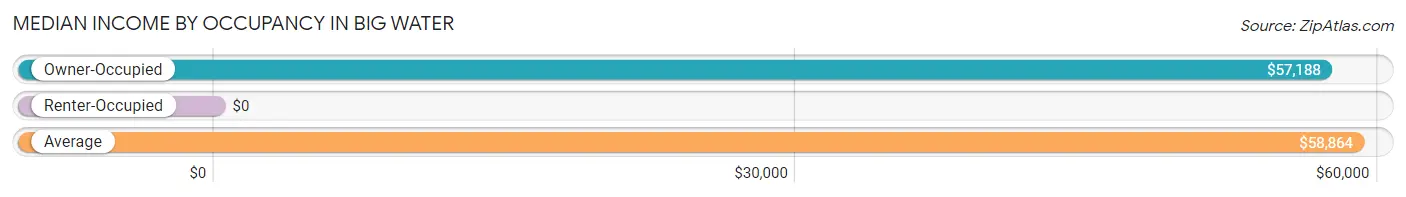
| Occupancy Type | # Households | Median Income |
| Owner-Occupied | 226 (86.3%) | $57,188 |
| Renter-Occupied | 36 (13.7%) | $0 |
| Average | 262 (100.0%) | $58,864 |
Occupancy by Householder Income Bracket in Big Water
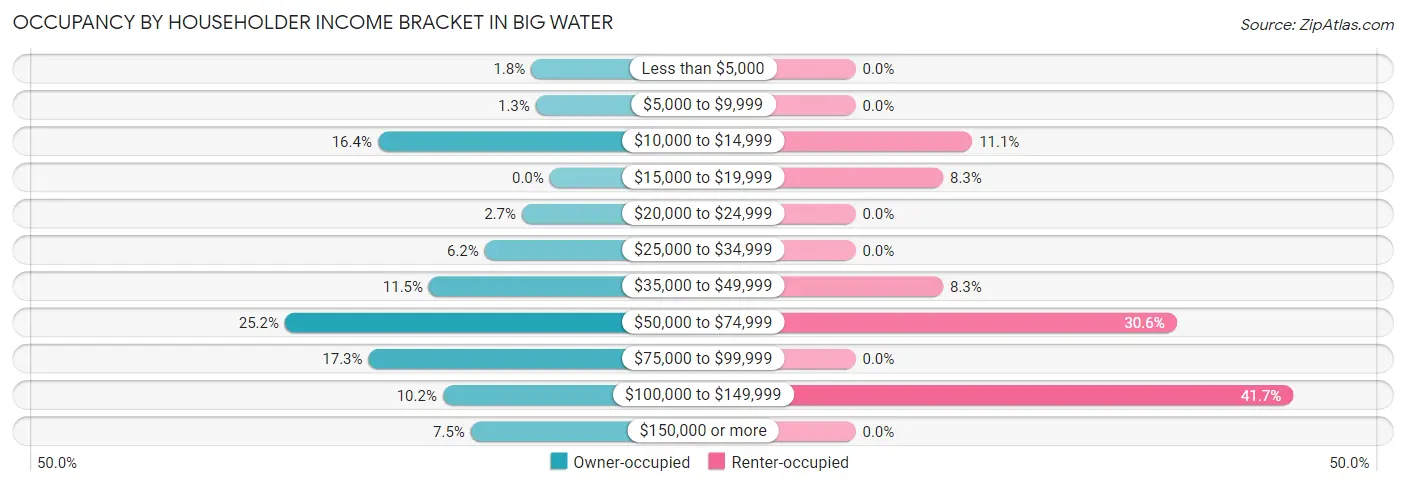
| Income Bracket | Owner-occupied | Renter-occupied |
| Less than $5,000 | 4 (1.8%) | 0 (0.0%) |
| $5,000 to $9,999 | 3 (1.3%) | 0 (0.0%) |
| $10,000 to $14,999 | 37 (16.4%) | 4 (11.1%) |
| $15,000 to $19,999 | 0 (0.0%) | 3 (8.3%) |
| $20,000 to $24,999 | 6 (2.6%) | 0 (0.0%) |
| $25,000 to $34,999 | 14 (6.2%) | 0 (0.0%) |
| $35,000 to $49,999 | 26 (11.5%) | 3 (8.3%) |
| $50,000 to $74,999 | 57 (25.2%) | 11 (30.6%) |
| $75,000 to $99,999 | 39 (17.3%) | 0 (0.0%) |
| $100,000 to $149,999 | 23 (10.2%) | 15 (41.7%) |
| $150,000 or more | 17 (7.5%) | 0 (0.0%) |
| Total | 226 (100.0%) | 36 (100.0%) |
Monthly Housing Cost Tiers in Big Water
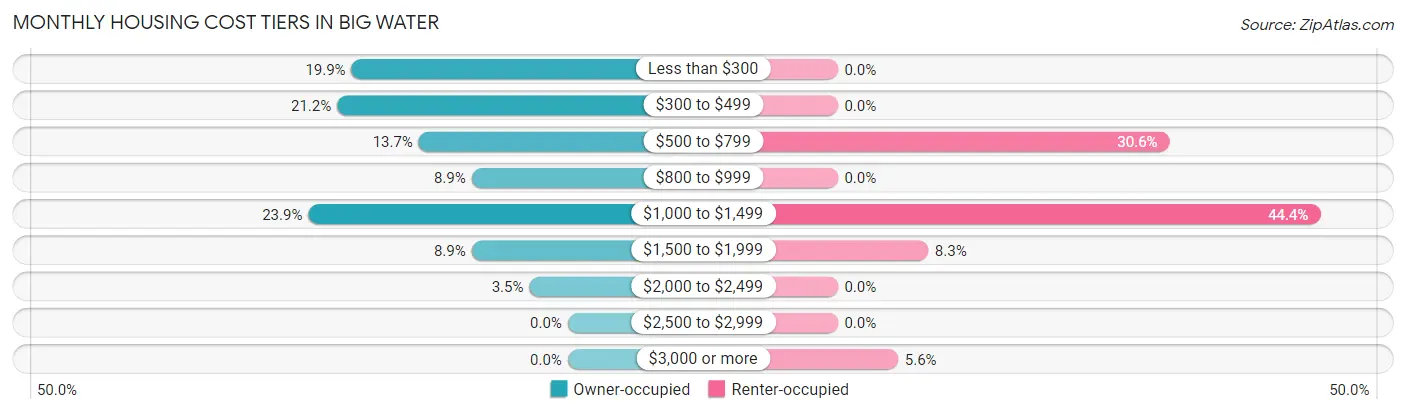
| Monthly Cost | Owner-occupied | Renter-occupied |
| Less than $300 | 45 (19.9%) | 0 (0.0%) |
| $300 to $499 | 48 (21.2%) | 0 (0.0%) |
| $500 to $799 | 31 (13.7%) | 11 (30.6%) |
| $800 to $999 | 20 (8.8%) | 0 (0.0%) |
| $1,000 to $1,499 | 54 (23.9%) | 16 (44.4%) |
| $1,500 to $1,999 | 20 (8.8%) | 3 (8.3%) |
| $2,000 to $2,499 | 8 (3.5%) | 0 (0.0%) |
| $2,500 to $2,999 | 0 (0.0%) | 0 (0.0%) |
| $3,000 or more | 0 (0.0%) | 2 (5.6%) |
| Total | 226 (100.0%) | 36 (100.0%) |
Physical Housing Characteristics in Big Water
Housing Structures in Big Water
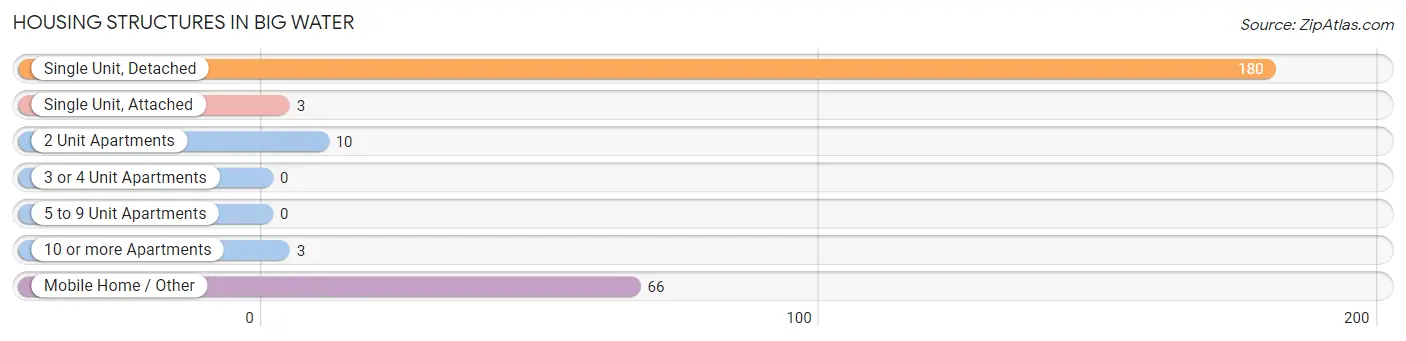
| Structure Type | # Housing Units | % Housing Units |
| Single Unit, Detached | 180 | 68.7% |
| Single Unit, Attached | 3 | 1.1% |
| 2 Unit Apartments | 10 | 3.8% |
| 3 or 4 Unit Apartments | 0 | 0.0% |
| 5 to 9 Unit Apartments | 0 | 0.0% |
| 10 or more Apartments | 3 | 1.1% |
| Mobile Home / Other | 66 | 25.2% |
| Total | 262 | 100.0% |
Housing Structures by Occupancy in Big Water
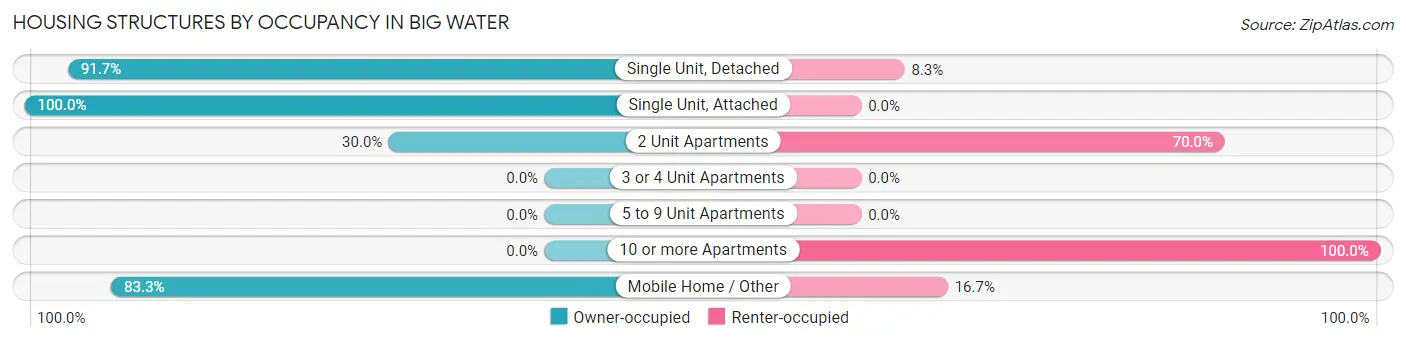
| Structure Type | Owner-occupied | Renter-occupied |
| Single Unit, Detached | 165 (91.7%) | 15 (8.3%) |
| Single Unit, Attached | 3 (100.0%) | 0 (0.0%) |
| 2 Unit Apartments | 3 (30.0%) | 7 (70.0%) |
| 3 or 4 Unit Apartments | 0 (0.0%) | 0 (0.0%) |
| 5 to 9 Unit Apartments | 0 (0.0%) | 0 (0.0%) |
| 10 or more Apartments | 0 (0.0%) | 3 (100.0%) |
| Mobile Home / Other | 55 (83.3%) | 11 (16.7%) |
| Total | 226 (86.3%) | 36 (13.7%) |
Housing Structures by Number of Rooms in Big Water
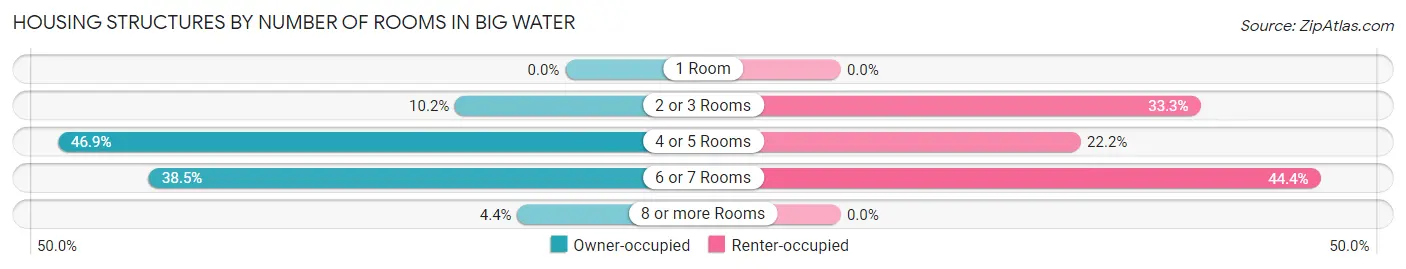
| Number of Rooms | Owner-occupied | Renter-occupied |
| 1 Room | 0 (0.0%) | 0 (0.0%) |
| 2 or 3 Rooms | 23 (10.2%) | 12 (33.3%) |
| 4 or 5 Rooms | 106 (46.9%) | 8 (22.2%) |
| 6 or 7 Rooms | 87 (38.5%) | 16 (44.4%) |
| 8 or more Rooms | 10 (4.4%) | 0 (0.0%) |
| Total | 226 (100.0%) | 36 (100.0%) |
Housing Structure by Heating Type in Big Water
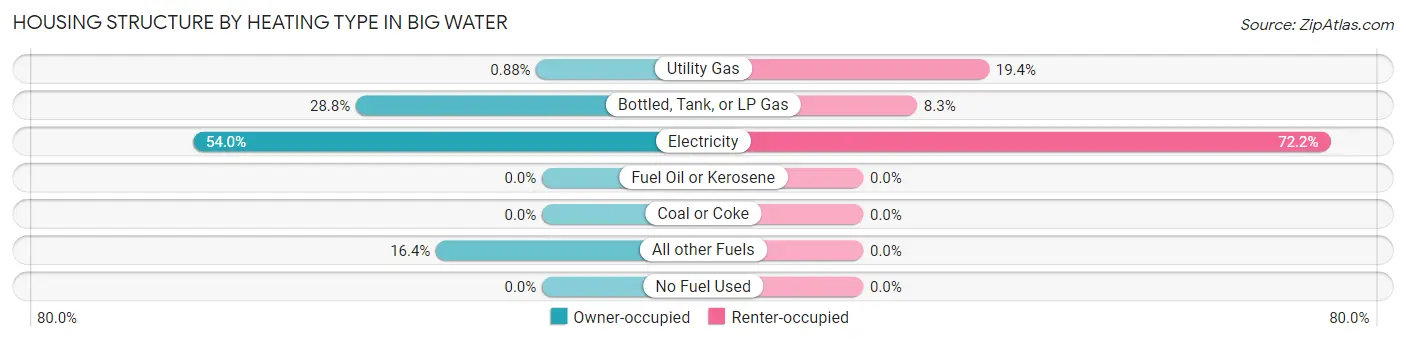
| Heating Type | Owner-occupied | Renter-occupied |
| Utility Gas | 2 (0.9%) | 7 (19.4%) |
| Bottled, Tank, or LP Gas | 65 (28.8%) | 3 (8.3%) |
| Electricity | 122 (54.0%) | 26 (72.2%) |
| Fuel Oil or Kerosene | 0 (0.0%) | 0 (0.0%) |
| Coal or Coke | 0 (0.0%) | 0 (0.0%) |
| All other Fuels | 37 (16.4%) | 0 (0.0%) |
| No Fuel Used | 0 (0.0%) | 0 (0.0%) |
| Total | 226 (100.0%) | 36 (100.0%) |
Household Vehicle Usage in Big Water
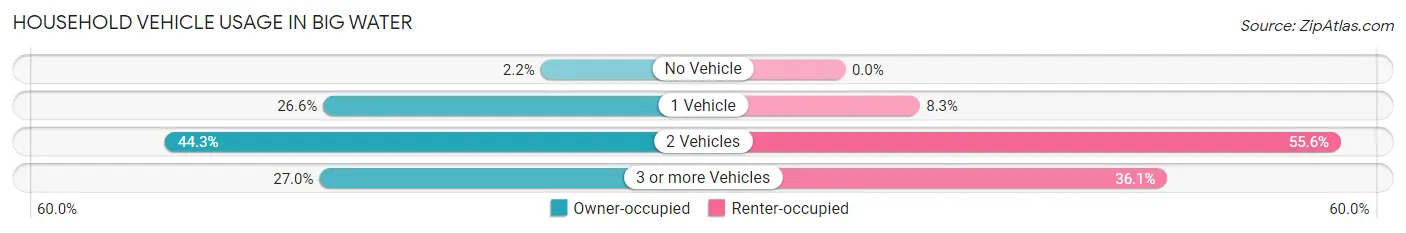
| Vehicles per Household | Owner-occupied | Renter-occupied |
| No Vehicle | 5 (2.2%) | 0 (0.0%) |
| 1 Vehicle | 60 (26.6%) | 3 (8.3%) |
| 2 Vehicles | 100 (44.3%) | 20 (55.6%) |
| 3 or more Vehicles | 61 (27.0%) | 13 (36.1%) |
| Total | 226 (100.0%) | 36 (100.0%) |
Real Estate & Mortgages in Big Water
Real Estate and Mortgage Overview in Big Water
| Characteristic | Without Mortgage | With Mortgage |
| Housing Units | 119 | 107 |
| Median Property Value | $213,000 | $138,700 |
| Median Household Income | $50,972 | $0 |
| Monthly Housing Costs | $348 | $0 |
| Real Estate Taxes | $1,304 | $5 |
Property Value by Mortgage Status in Big Water

| Property Value | Without Mortgage | With Mortgage |
| Less than $50,000 | 21 (17.6%) | 0 (0.0%) |
| $50,000 to $99,999 | 18 (15.1%) | 5 (4.7%) |
| $100,000 to $299,999 | 42 (35.3%) | 91 (85.1%) |
| $300,000 to $499,999 | 29 (24.4%) | 11 (10.3%) |
| $500,000 to $749,999 | 9 (7.6%) | 0 (0.0%) |
| $750,000 to $999,999 | 0 (0.0%) | 0 (0.0%) |
| $1,000,000 or more | 0 (0.0%) | 0 (0.0%) |
| Total | 119 (100.0%) | 107 (100.0%) |
Household Income by Mortgage Status in Big Water
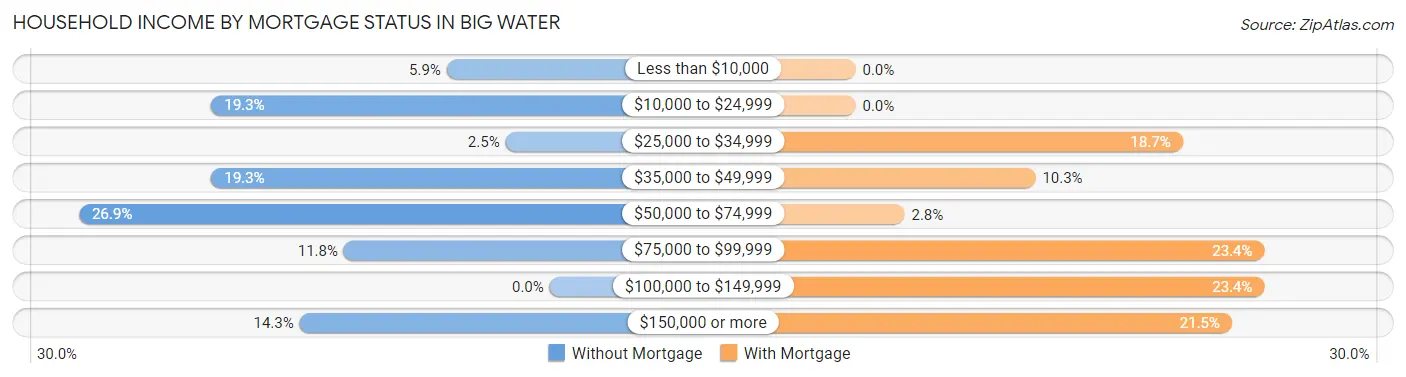
| Household Income | Without Mortgage | With Mortgage |
| Less than $10,000 | 7 (5.9%) | 0 (0.0%) |
| $10,000 to $24,999 | 23 (19.3%) | 0 (0.0%) |
| $25,000 to $34,999 | 3 (2.5%) | 20 (18.7%) |
| $35,000 to $49,999 | 23 (19.3%) | 11 (10.3%) |
| $50,000 to $74,999 | 32 (26.9%) | 3 (2.8%) |
| $75,000 to $99,999 | 14 (11.8%) | 25 (23.4%) |
| $100,000 to $149,999 | 0 (0.0%) | 25 (23.4%) |
| $150,000 or more | 17 (14.3%) | 23 (21.5%) |
| Total | 119 (100.0%) | 107 (100.0%) |
Property Value to Household Income Ratio in Big Water
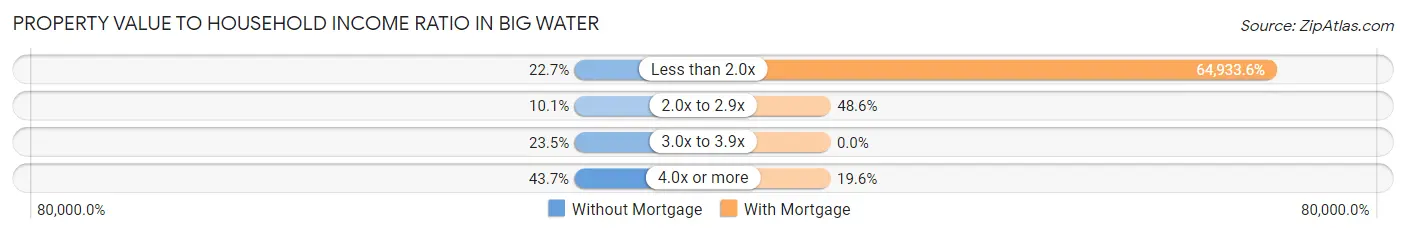
| Value-to-Income Ratio | Without Mortgage | With Mortgage |
| Less than 2.0x | 27 (22.7%) | 69,479 (64,933.6%) |
| 2.0x to 2.9x | 12 (10.1%) | 52 (48.6%) |
| 3.0x to 3.9x | 28 (23.5%) | 0 (0.0%) |
| 4.0x or more | 52 (43.7%) | 21 (19.6%) |
| Total | 119 (100.0%) | 107 (100.0%) |
Real Estate Taxes by Mortgage Status in Big Water
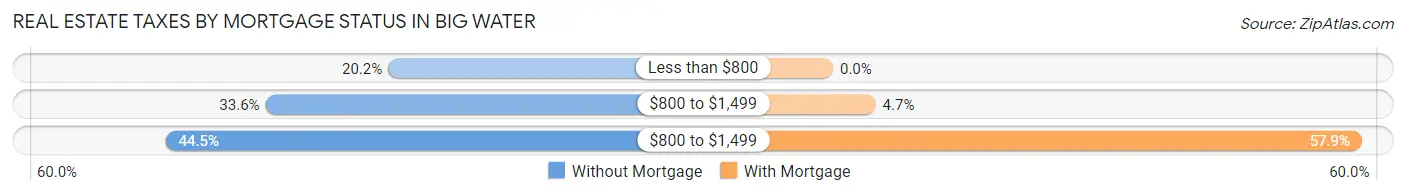
| Property Taxes | Without Mortgage | With Mortgage |
| Less than $800 | 24 (20.2%) | 0 (0.0%) |
| $800 to $1,499 | 40 (33.6%) | 5 (4.7%) |
| $800 to $1,499 | 53 (44.5%) | 62 (57.9%) |
| Total | 119 (100.0%) | 107 (100.0%) |
Health & Disability in Big Water
Health Insurance Coverage by Age in Big Water
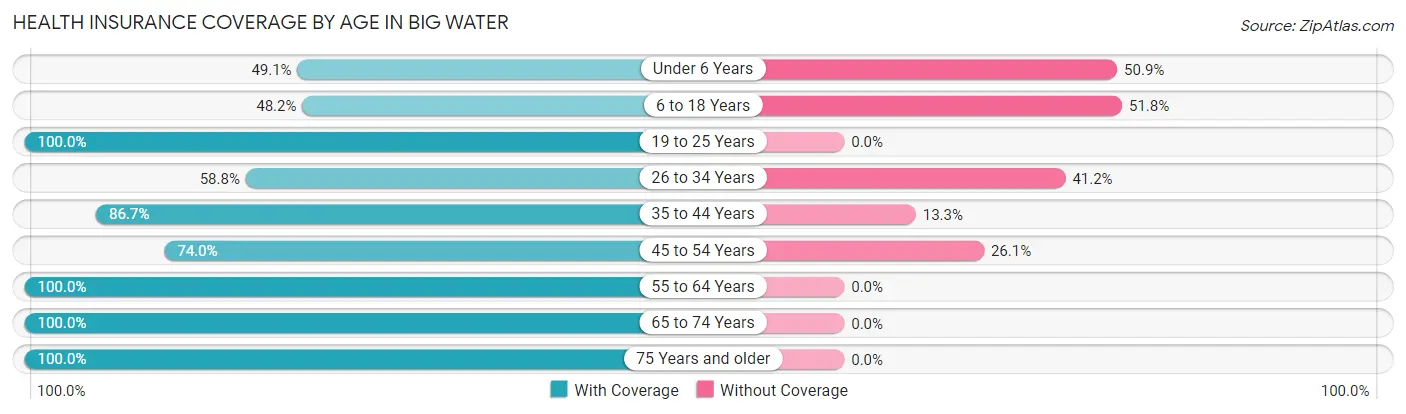
| Age Bracket | With Coverage | Without Coverage |
| Under 6 Years | 28 (49.1%) | 29 (50.9%) |
| 6 to 18 Years | 27 (48.2%) | 29 (51.8%) |
| 19 to 25 Years | 8 (100.0%) | 0 (0.0%) |
| 26 to 34 Years | 57 (58.8%) | 40 (41.2%) |
| 35 to 44 Years | 26 (86.7%) | 4 (13.3%) |
| 45 to 54 Years | 88 (74.0%) | 31 (26.1%) |
| 55 to 64 Years | 79 (100.0%) | 0 (0.0%) |
| 65 to 74 Years | 103 (100.0%) | 0 (0.0%) |
| 75 Years and older | 25 (100.0%) | 0 (0.0%) |
| Total | 441 (76.8%) | 133 (23.2%) |
Health Insurance Coverage by Citizenship Status in Big Water
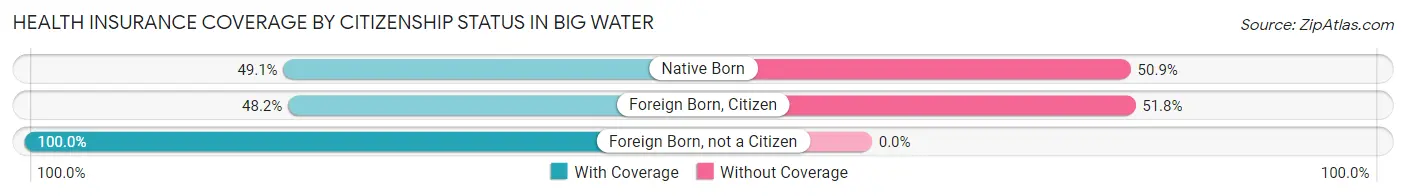
| Citizenship Status | With Coverage | Without Coverage |
| Native Born | 28 (49.1%) | 29 (50.9%) |
| Foreign Born, Citizen | 27 (48.2%) | 29 (51.8%) |
| Foreign Born, not a Citizen | 8 (100.0%) | 0 (0.0%) |
Health Insurance Coverage by Household Income in Big Water
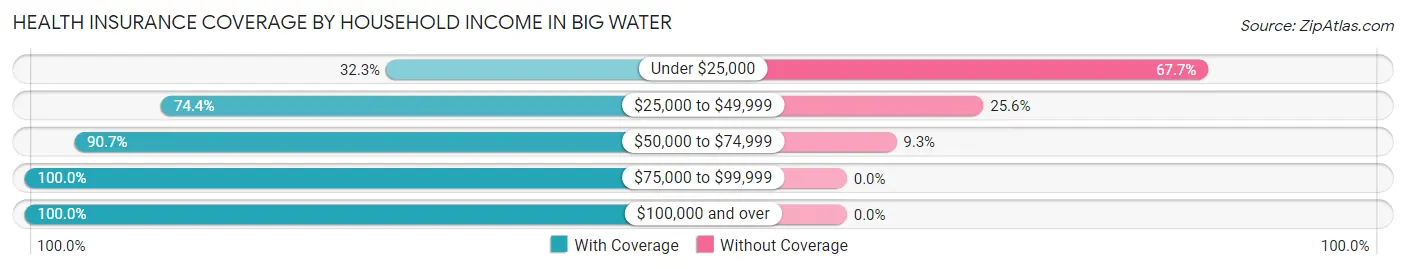
| Household Income | With Coverage | Without Coverage |
| Under $25,000 | 52 (32.3%) | 109 (67.7%) |
| $25,000 to $49,999 | 32 (74.4%) | 11 (25.6%) |
| $50,000 to $74,999 | 127 (90.7%) | 13 (9.3%) |
| $75,000 to $99,999 | 80 (100.0%) | 0 (0.0%) |
| $100,000 and over | 150 (100.0%) | 0 (0.0%) |
Public vs Private Health Insurance Coverage by Age in Big Water
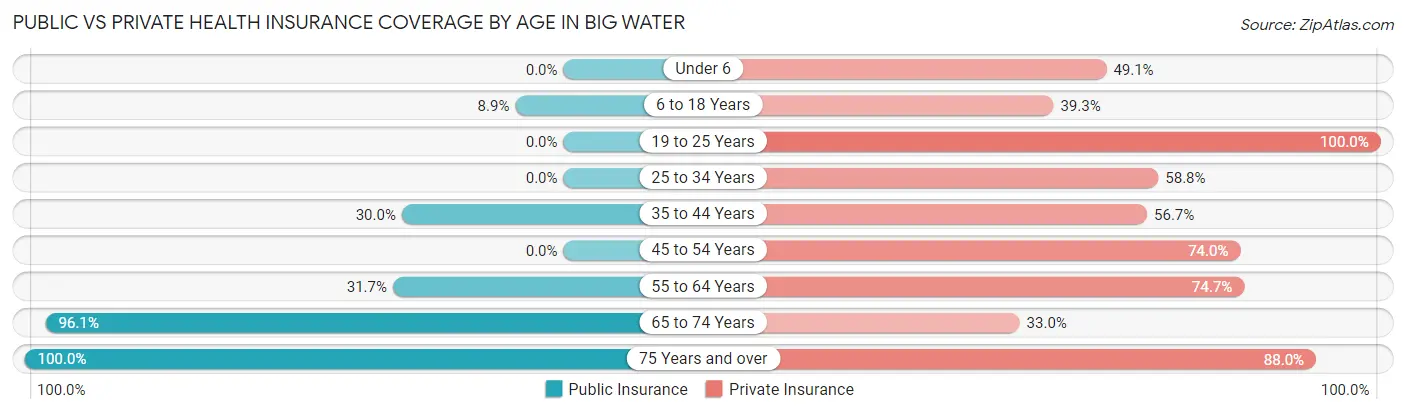
| Age Bracket | Public Insurance | Private Insurance |
| Under 6 | 0 (0.0%) | 28 (49.1%) |
| 6 to 18 Years | 5 (8.9%) | 22 (39.3%) |
| 19 to 25 Years | 0 (0.0%) | 8 (100.0%) |
| 25 to 34 Years | 0 (0.0%) | 57 (58.8%) |
| 35 to 44 Years | 9 (30.0%) | 17 (56.7%) |
| 45 to 54 Years | 0 (0.0%) | 88 (74.0%) |
| 55 to 64 Years | 25 (31.7%) | 59 (74.7%) |
| 65 to 74 Years | 99 (96.1%) | 34 (33.0%) |
| 75 Years and over | 25 (100.0%) | 22 (88.0%) |
| Total | 163 (28.4%) | 335 (58.4%) |
Disability Status by Sex by Age in Big Water
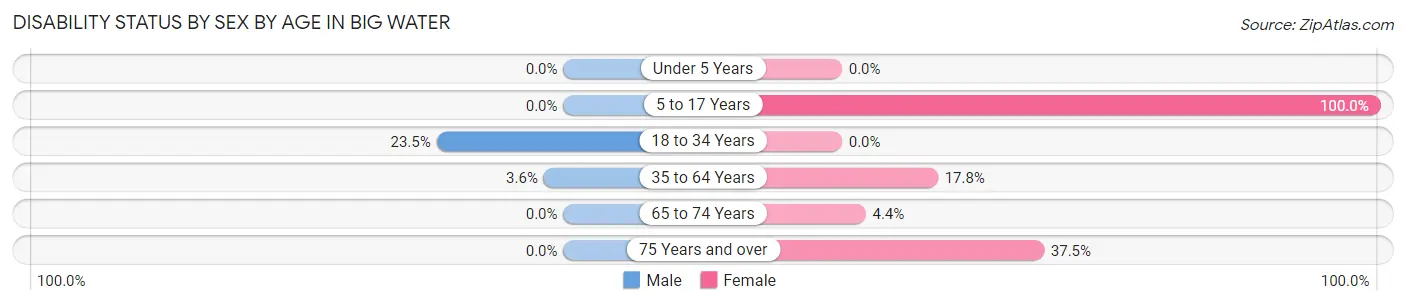
| Age Bracket | Male | Female |
| Under 5 Years | 0 (0.0%) | 0 (0.0%) |
| 5 to 17 Years | 0 (0.0%) | 5 (100.0%) |
| 18 to 34 Years | 8 (23.5%) | 0 (0.0%) |
| 35 to 64 Years | 4 (3.6%) | 21 (17.8%) |
| 65 to 74 Years | 0 (0.0%) | 3 (4.4%) |
| 75 Years and over | 0 (0.0%) | 3 (37.5%) |
Disability Class by Sex by Age in Big Water
Disability Class: Hearing Difficulty
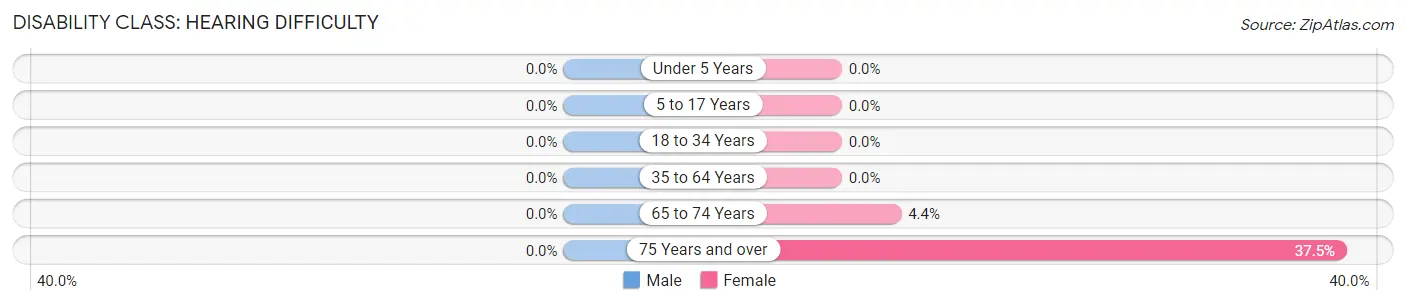
| Age Bracket | Male | Female |
| Under 5 Years | 0 (0.0%) | 0 (0.0%) |
| 5 to 17 Years | 0 (0.0%) | 0 (0.0%) |
| 18 to 34 Years | 0 (0.0%) | 0 (0.0%) |
| 35 to 64 Years | 0 (0.0%) | 0 (0.0%) |
| 65 to 74 Years | 0 (0.0%) | 3 (4.4%) |
| 75 Years and over | 0 (0.0%) | 3 (37.5%) |
Disability Class: Vision Difficulty
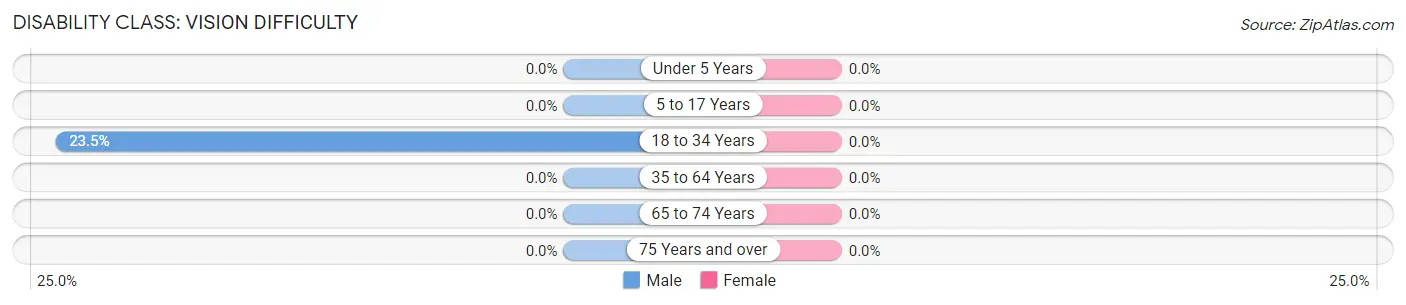
| Age Bracket | Male | Female |
| Under 5 Years | 0 (0.0%) | 0 (0.0%) |
| 5 to 17 Years | 0 (0.0%) | 0 (0.0%) |
| 18 to 34 Years | 8 (23.5%) | 0 (0.0%) |
| 35 to 64 Years | 0 (0.0%) | 0 (0.0%) |
| 65 to 74 Years | 0 (0.0%) | 0 (0.0%) |
| 75 Years and over | 0 (0.0%) | 0 (0.0%) |
Disability Class: Cognitive Difficulty
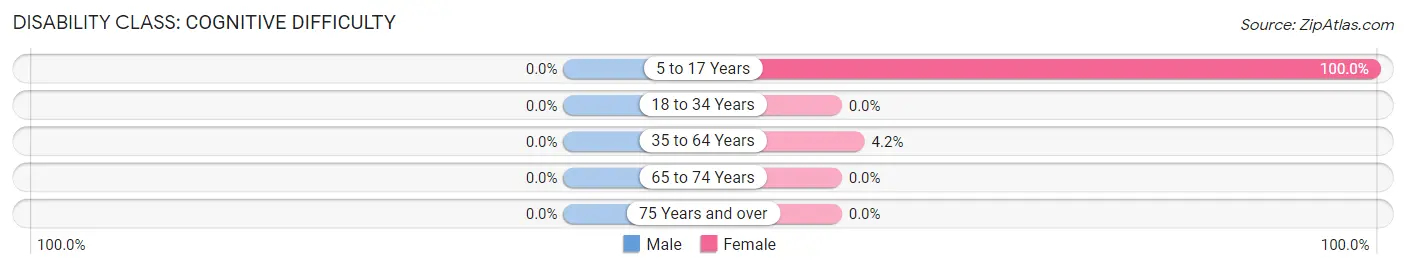
| Age Bracket | Male | Female |
| 5 to 17 Years | 0 (0.0%) | 5 (100.0%) |
| 18 to 34 Years | 0 (0.0%) | 0 (0.0%) |
| 35 to 64 Years | 0 (0.0%) | 5 (4.2%) |
| 65 to 74 Years | 0 (0.0%) | 0 (0.0%) |
| 75 Years and over | 0 (0.0%) | 0 (0.0%) |
Disability Class: Ambulatory Difficulty
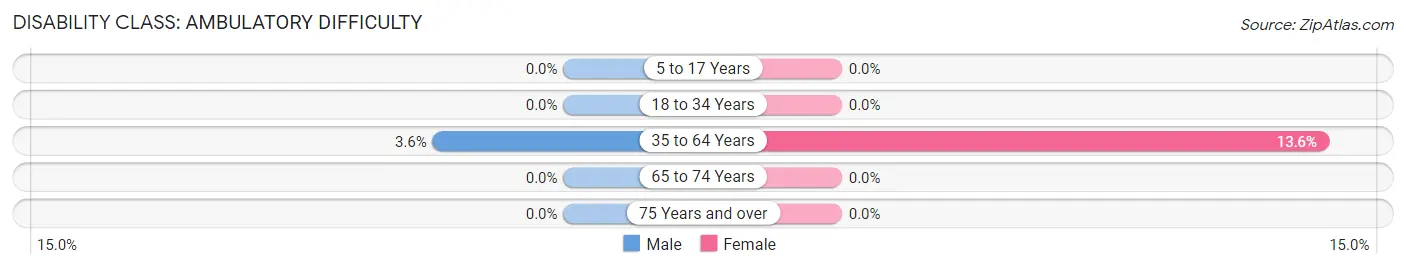
| Age Bracket | Male | Female |
| 5 to 17 Years | 0 (0.0%) | 0 (0.0%) |
| 18 to 34 Years | 0 (0.0%) | 0 (0.0%) |
| 35 to 64 Years | 4 (3.6%) | 16 (13.6%) |
| 65 to 74 Years | 0 (0.0%) | 0 (0.0%) |
| 75 Years and over | 0 (0.0%) | 0 (0.0%) |
Disability Class: Self-Care Difficulty
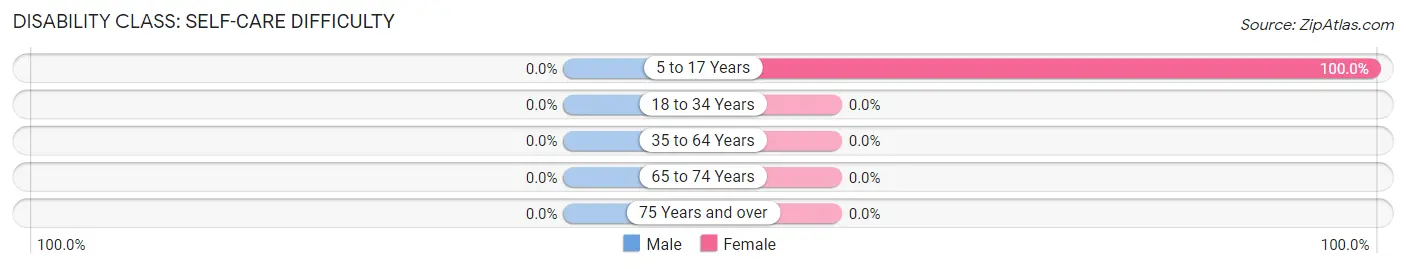
| Age Bracket | Male | Female |
| 5 to 17 Years | 0 (0.0%) | 5 (100.0%) |
| 18 to 34 Years | 0 (0.0%) | 0 (0.0%) |
| 35 to 64 Years | 0 (0.0%) | 0 (0.0%) |
| 65 to 74 Years | 0 (0.0%) | 0 (0.0%) |
| 75 Years and over | 0 (0.0%) | 0 (0.0%) |
Technology Access in Big Water
Computing Device Access in Big Water
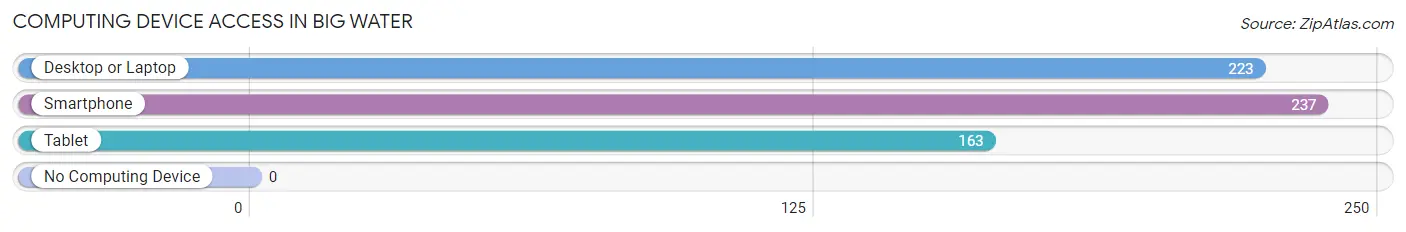
| Device Type | # Households | % Households |
| Desktop or Laptop | 223 | 85.1% |
| Smartphone | 237 | 90.5% |
| Tablet | 163 | 62.2% |
| No Computing Device | 0 | 0.0% |
| Total | 262 | 100.0% |
Internet Access in Big Water
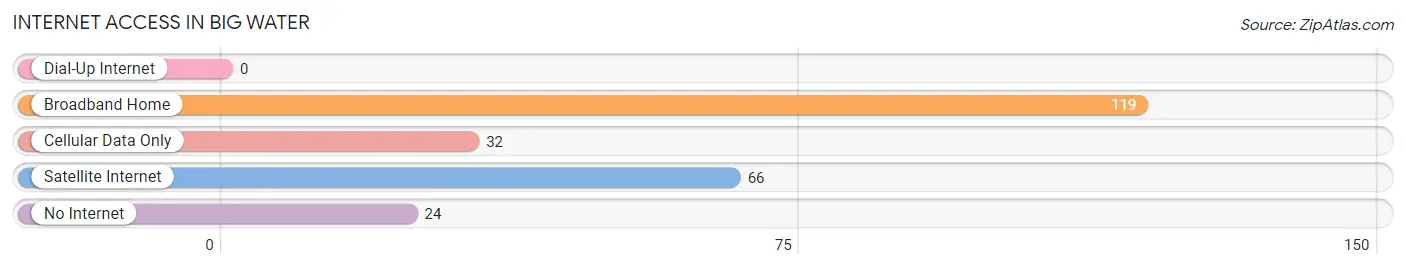
| Internet Type | # Households | % Households |
| Dial-Up Internet | 0 | 0.0% |
| Broadband Home | 119 | 45.4% |
| Cellular Data Only | 32 | 12.2% |
| Satellite Internet | 66 | 25.2% |
| No Internet | 24 | 9.2% |
| Total | 262 | 100.0% |
Big Water Summary
Water, Utah is a small town located in the southwestern corner of the state, near the Arizona border. It is situated in Kane County, and is part of the Grand Staircase-Escalante National Monument. The town is located at an elevation of 4,400 feet, and has a population of approximately 1,000 people.
History
The area around Water, Utah was first settled by Mormon pioneers in the late 1800s. The town was originally known as “Big Water”, and was established in 1891. The town was named after the nearby Big Water Creek, which was a major source of water for the settlers. The town was incorporated in 1895, and the first post office was established in 1896.
In the early 1900s, the town was a major hub for the mining industry, with several mines in the area. The town also had a large sheep ranching industry, and was home to several large ranches. The town was also home to a number of businesses, including a hotel, a general store, and a blacksmith shop.
Geography
Water, Utah is located in the southwestern corner of the state, near the Arizona border. It is situated in Kane County, and is part of the Grand Staircase-Escalante National Monument. The town is located at an elevation of 4,400 feet, and has a population of approximately 1,000 people.
The town is surrounded by the Grand Staircase-Escalante National Monument, which is a 1.9 million acre protected area. The monument is home to a variety of wildlife, including bighorn sheep, mule deer, elk, and mountain lions. The area is also home to a variety of plant life, including juniper, pinyon pine, and sagebrush.
Economy
The economy of Water, Utah is largely based on tourism and agriculture. The town is home to several tourist attractions, including the Grand Staircase-Escalante National Monument, which attracts visitors from all over the world. The town is also home to several ranches, which produce beef, sheep, and other livestock.
The town is also home to a number of businesses, including a hotel, a general store, and a blacksmith shop. The town is also home to a number of restaurants, which serve a variety of local and regional cuisine.
Demographics
As of the 2010 census, the population of Water, Utah was 1,000 people. The racial makeup of the town was 97.2% White, 0.2% African American, 0.2% Native American, 0.2% Asian, 0.2% Pacific Islander, 0.2% from other races, and 1.2% from two or more races. Hispanic or Latino of any race were 1.2% of the population.
The median income for a household in the town was $37,500, and the median income for a family was $41,250. The per capita income for the town was $17,857. About 11.2% of families and 13.2% of the population were below the poverty line, including 16.2% of those under age 18 and none of those age 65 or over.
Common Questions
What is Per Capita Income in Big Water?
Per Capita income in Big Water is $35,122.
What is the Median Family Income in Big Water?
Median Family Income in Big Water is $95,625.
What is the Median Household income in Big Water?
Median Household Income in Big Water is $58,864.
What is Income or Wage Gap in Big Water?
Income or Wage Gap in Big Water is 50.8%.
Women in Big Water earn 49.2 cents for every dollar earned by a man.
What is Inequality or Gini Index in Big Water?
Inequality or Gini Index in Big Water is 0.40.
What is the Total Population of Big Water?
Total Population of Big Water is 574.
What is the Total Male Population of Big Water?
Total Male Population of Big Water is 281.
What is the Total Female Population of Big Water?
Total Female Population of Big Water is 293.
What is the Ratio of Males per 100 Females in Big Water?
There are 95.90 Males per 100 Females in Big Water.
What is the Ratio of Females per 100 Males in Big Water?
There are 104.27 Females per 100 Males in Big Water.
What is the Median Population Age in Big Water?
Median Population Age in Big Water is 49.5 Years.
What is the Average Family Size in Big Water
Average Family Size in Big Water is 2.8 People.
What is the Average Household Size in Big Water
Average Household Size in Big Water is 2.2 People.
How Large is the Labor Force in Big Water?
There are 262 People in the Labor Forcein in Big Water.
What is the Percentage of People in the Labor Force in Big Water?
56.8% of People are in the Labor Force in Big Water.
What is the Unemployment Rate in Big Water?
Unemployment Rate in Big Water is 5.0%.