West Mountain, UT Map & Demographics
West Mountain Map
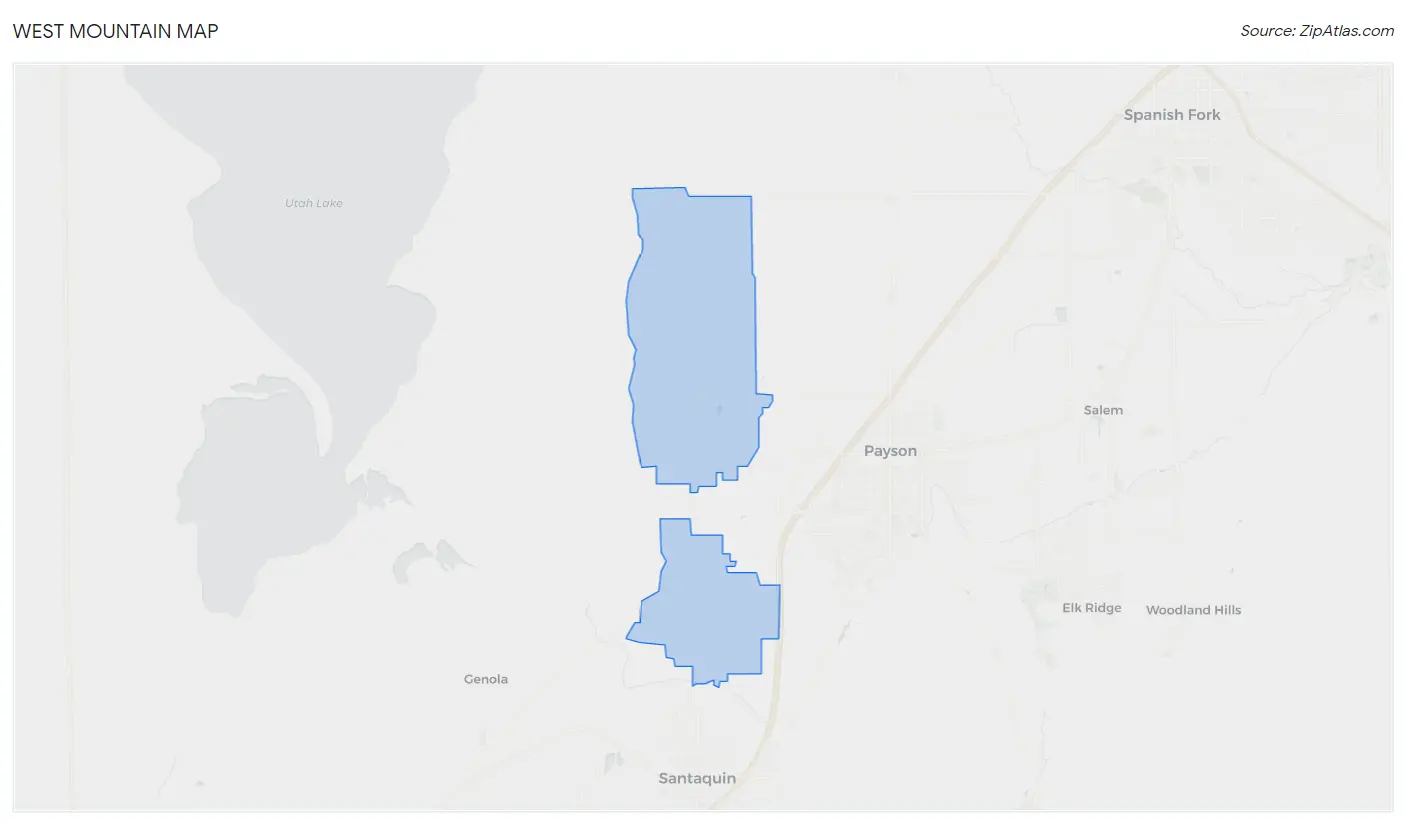
West Mountain Overview
$29,663
PER CAPITA INCOME
$103,438
AVG FAMILY INCOME
$103,365
AVG HOUSEHOLD INCOME
0.25
INEQUALITY / GINI INDEX
1,267
TOTAL POPULATION
653
MALE POPULATION
614
FEMALE POPULATION
106.35
MALES / 100 FEMALES
94.03
FEMALES / 100 MALES
35.3
MEDIAN AGE
4.4
AVG FAMILY SIZE
3.7
AVG HOUSEHOLD SIZE
679
LABOR FORCE [ PEOPLE ]
74.6%
PERCENT IN LABOR FORCE
4.9%
UNEMPLOYMENT RATE
Income in West Mountain
Income Overview in West Mountain
Per Capita Income in West Mountain is $29,663, while median incomes of families and households are $103,438 and $103,365 respectively.
| Characteristic | Number | Measure |
| Per Capita Income | 1,267 | $29,663 |
| Median Family Income | 269 | $103,438 |
| Mean Family Income | 269 | $115,014 |
| Median Household Income | 339 | $103,365 |
| Mean Household Income | 339 | $112,246 |
| Income Deficit | 269 | $0 |
| Wage / Income Gap (%) | 1,267 | 0.00% |
| Wage / Income Gap ($) | 1,267 | 100.00¢ per $1 |
| Gini / Inequality Index | 1,267 | 0.25 |
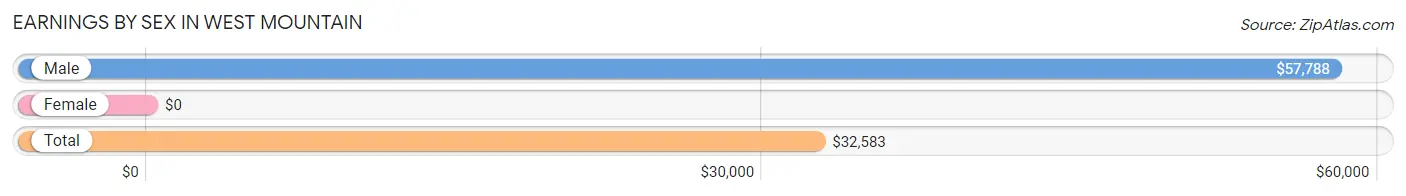
Earnings by Sex in West Mountain
| Sex | Number | Average Earnings |
| Male | 413 (57.1%) | $57,788 |
| Female | 310 (42.9%) | $0 |
| Total | 723 (100.0%) | $32,583 |
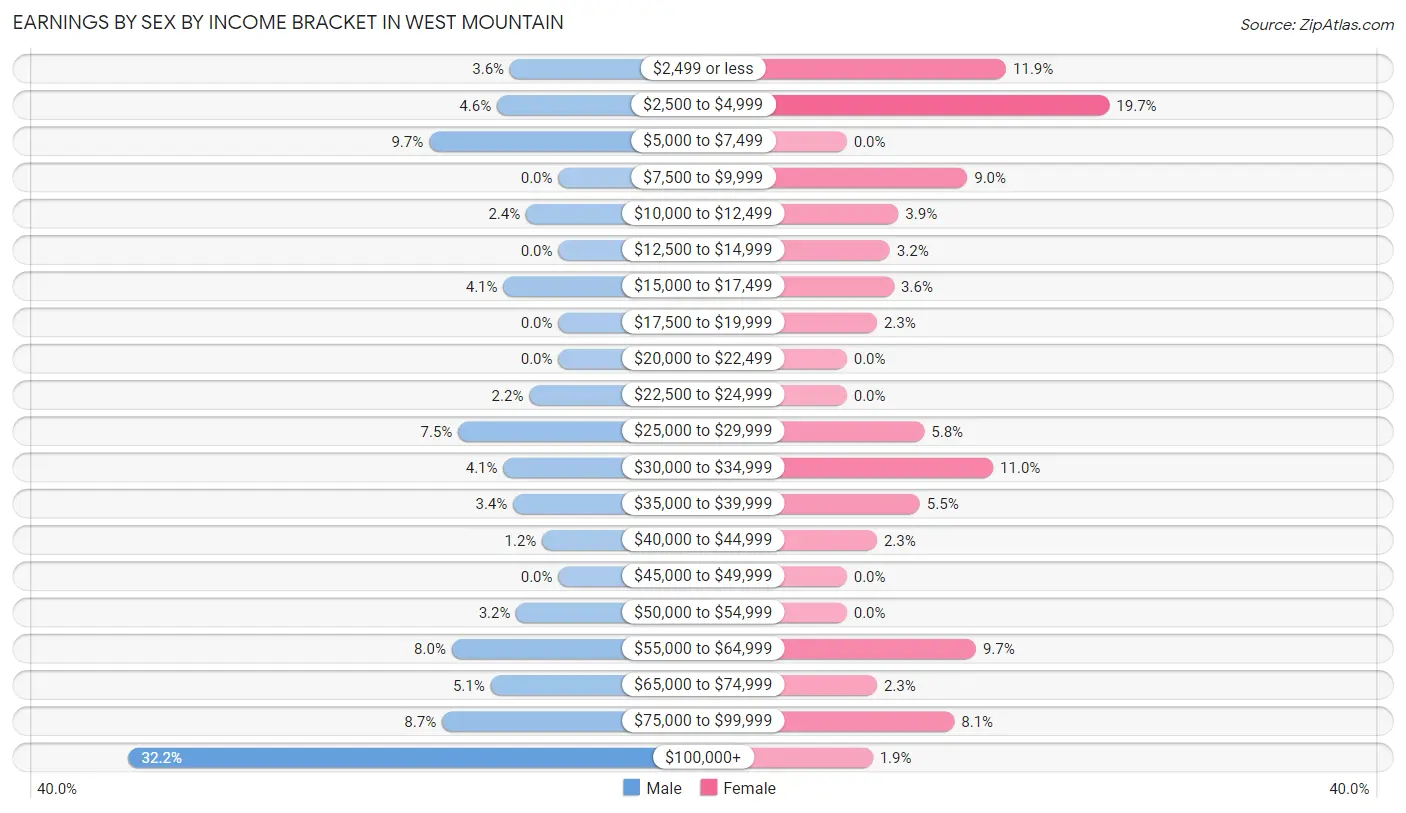
Earnings by Sex by Income Bracket in West Mountain
The most common earnings brackets in West Mountain are $100,000+ for men (133 | 32.2%) and $2,500 to $4,999 for women (61 | 19.7%).
| Income | Male | Female |
| $2,499 or less | 15 (3.6%) | 37 (11.9%) |
| $2,500 to $4,999 | 19 (4.6%) | 61 (19.7%) |
| $5,000 to $7,499 | 40 (9.7%) | 0 (0.0%) |
| $7,500 to $9,999 | 0 (0.0%) | 28 (9.0%) |
| $10,000 to $12,499 | 10 (2.4%) | 12 (3.9%) |
| $12,500 to $14,999 | 0 (0.0%) | 10 (3.2%) |
| $15,000 to $17,499 | 17 (4.1%) | 11 (3.5%) |
| $17,500 to $19,999 | 0 (0.0%) | 7 (2.3%) |
| $20,000 to $22,499 | 0 (0.0%) | 0 (0.0%) |
| $22,500 to $24,999 | 9 (2.2%) | 0 (0.0%) |
| $25,000 to $29,999 | 31 (7.5%) | 18 (5.8%) |
| $30,000 to $34,999 | 17 (4.1%) | 34 (11.0%) |
| $35,000 to $39,999 | 14 (3.4%) | 17 (5.5%) |
| $40,000 to $44,999 | 5 (1.2%) | 7 (2.3%) |
| $45,000 to $49,999 | 0 (0.0%) | 0 (0.0%) |
| $50,000 to $54,999 | 13 (3.2%) | 0 (0.0%) |
| $55,000 to $64,999 | 33 (8.0%) | 30 (9.7%) |
| $65,000 to $74,999 | 21 (5.1%) | 7 (2.3%) |
| $75,000 to $99,999 | 36 (8.7%) | 25 (8.1%) |
| $100,000+ | 133 (32.2%) | 6 (1.9%) |
| Total | 413 (100.0%) | 310 (100.0%) |
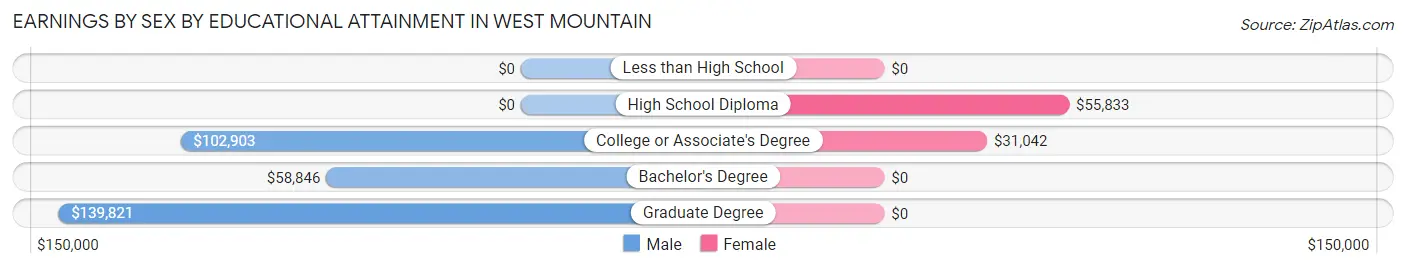
Earnings by Sex by Educational Attainment in West Mountain
Average earnings in West Mountain are $69,821 for men and $31,458 for women, a difference of 54.9%. Men with an educational attainment of graduate degree enjoy the highest average annual earnings of $139,821, while those with bachelor's degree education earn the least with $58,846. Women with an educational attainment of high school diploma earn the most with the average annual earnings of $55,833, while those with college or associate's degree education have the smallest earnings of $31,042.
| Educational Attainment | Male Income | Female Income |
| Less than High School | - | - |
| High School Diploma | - | - |
| College or Associate's Degree | $102,903 | $31,042 |
| Bachelor's Degree | $58,846 | $0 |
| Graduate Degree | $139,821 | $0 |
| Total | $69,821 | $31,458 |
Family Income in West Mountain
Family Income Brackets in West Mountain
According to the West Mountain family income data, there are 65 families falling into the $75,000 to $99,999 income range, which is the most common income bracket and makes up 24.2% of all families.
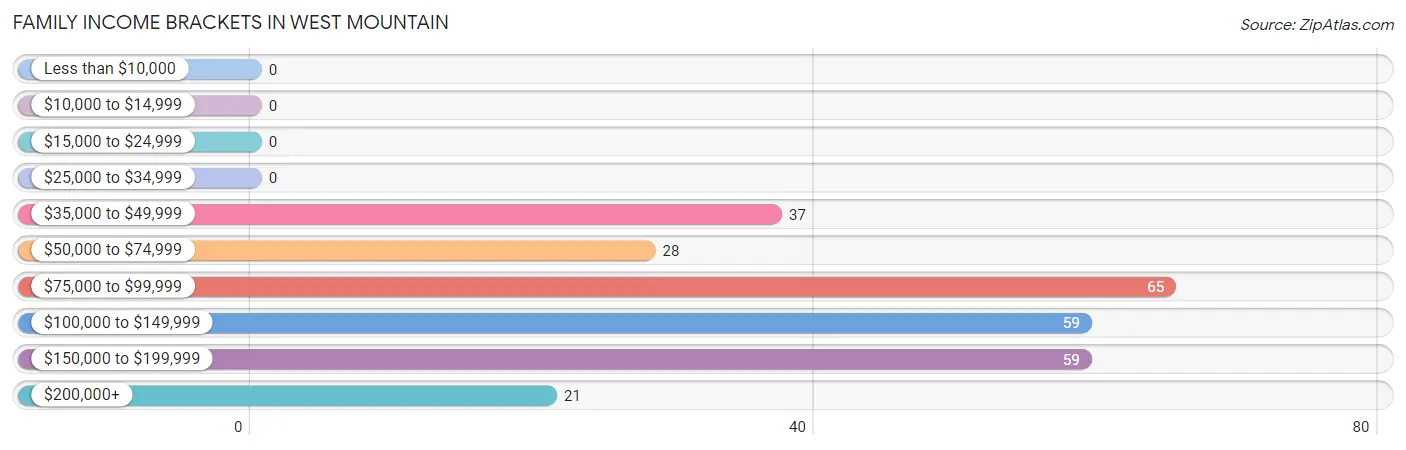
| Income Bracket | # Families | % Families |
| Less than $10,000 | 0 | 0.0% |
| $10,000 to $14,999 | 0 | 0.0% |
| $15,000 to $24,999 | 0 | 0.0% |
| $25,000 to $34,999 | 0 | 0.0% |
| $35,000 to $49,999 | 37 | 13.8% |
| $50,000 to $74,999 | 28 | 10.4% |
| $75,000 to $99,999 | 65 | 24.2% |
| $100,000 to $149,999 | 59 | 21.9% |
| $150,000 to $199,999 | 59 | 21.9% |
| $200,000+ | 21 | 7.8% |
Family Income by Famaliy Size in West Mountain
7+ person families (49 | 18.2%) account for the highest median family income in West Mountain with $145,592 per family, while 2-person families (51 | 19.0%) have the highest median income of $69,554 per family member.
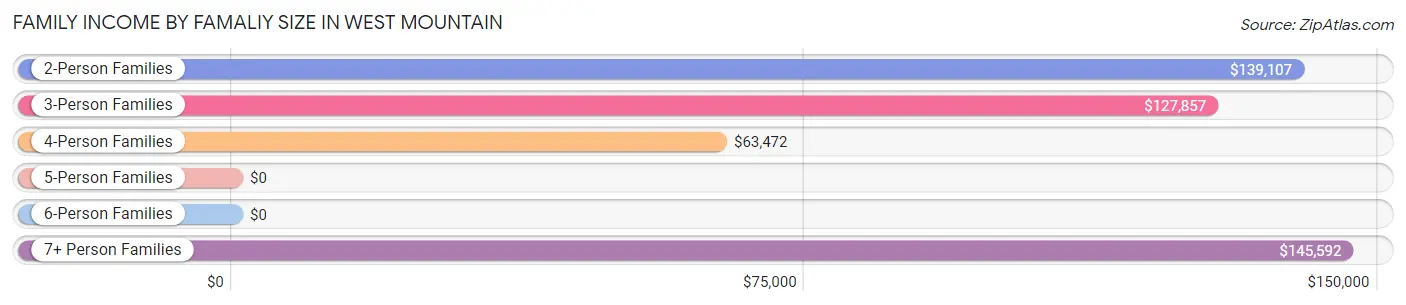
| Income Bracket | # Families | Median Income |
| 2-Person Families | 51 (19.0%) | $139,107 |
| 3-Person Families | 62 (23.1%) | $127,857 |
| 4-Person Families | 47 (17.5%) | $63,472 |
| 5-Person Families | 44 (16.4%) | $0 |
| 6-Person Families | 16 (5.9%) | $0 |
| 7+ Person Families | 49 (18.2%) | $145,592 |
| Total | 269 (100.0%) | $103,438 |
Family Income by Number of Earners in West Mountain

| Number of Earners | # Families | Median Income |
| No Earners | 13 (4.8%) | $0 |
| 1 Earner | 38 (14.1%) | $0 |
| 2 Earners | 102 (37.9%) | $146,842 |
| 3+ Earners | 116 (43.1%) | $92,396 |
| Total | 269 (100.0%) | $103,438 |
Household Income in West Mountain
Household Income Brackets in West Mountain
With 112 households falling in the category, the $100,000 to $149,999 income range is the most frequent in West Mountain, accounting for 33.0% of all households.
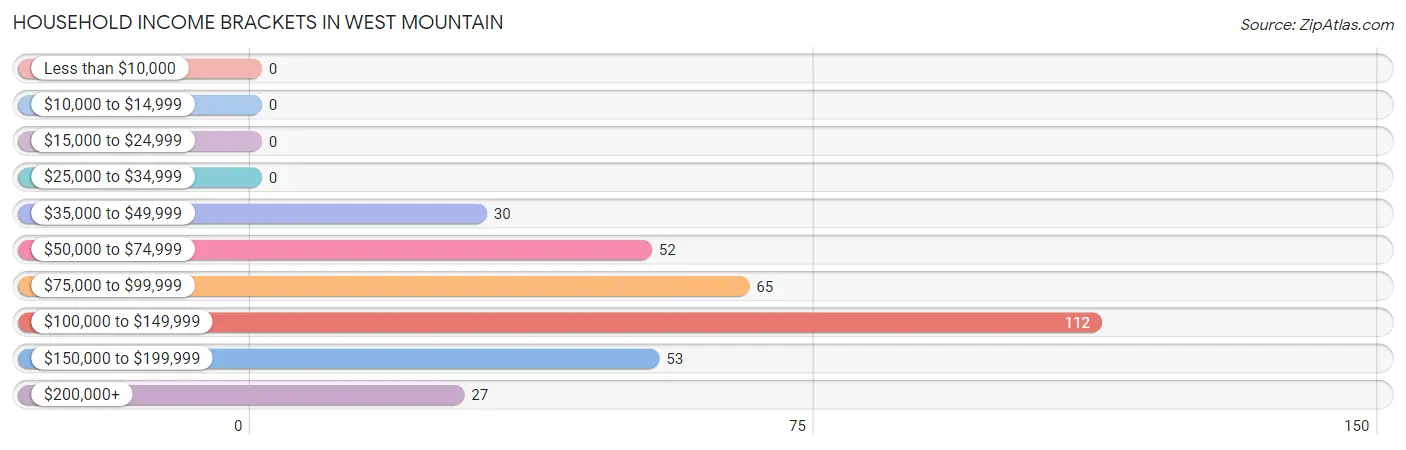
| Income Bracket | # Households | % Households |
| Less than $10,000 | 0 | 0.0% |
| $10,000 to $14,999 | 0 | 0.0% |
| $15,000 to $24,999 | 0 | 0.0% |
| $25,000 to $34,999 | 0 | 0.0% |
| $35,000 to $49,999 | 30 | 8.8% |
| $50,000 to $74,999 | 52 | 15.3% |
| $75,000 to $99,999 | 65 | 19.2% |
| $100,000 to $149,999 | 112 | 33.0% |
| $150,000 to $199,999 | 53 | 15.6% |
| $200,000+ | 27 | 8.0% |
Household Income by Householder Age in West Mountain
The median household income in West Mountain is $103,365, with the highest median household income of $121,250 found in the 45 to 64 years age bracket for the primary householder. A total of 158 households (46.6%) fall into this category.
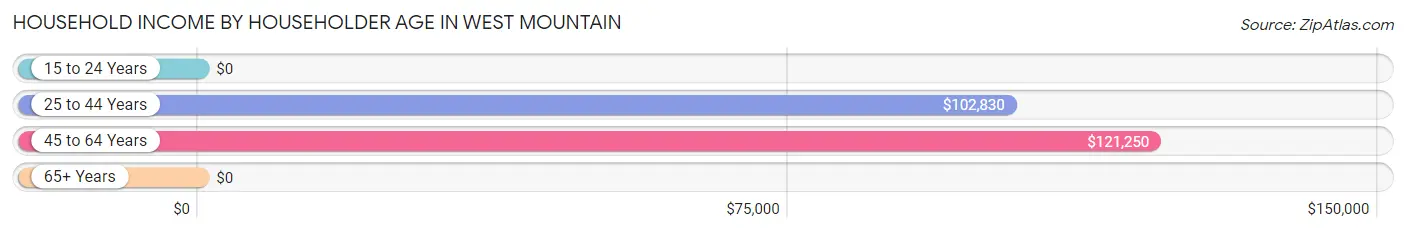
| Income Bracket | # Households | Median Income |
| 15 to 24 Years | 0 (0.0%) | $0 |
| 25 to 44 Years | 114 (33.6%) | $102,830 |
| 45 to 64 Years | 158 (46.6%) | $121,250 |
| 65+ Years | 67 (19.8%) | $0 |
| Total | 339 (100.0%) | $103,365 |
Poverty in West Mountain
Income Below Poverty by Sex and Age in West Mountain
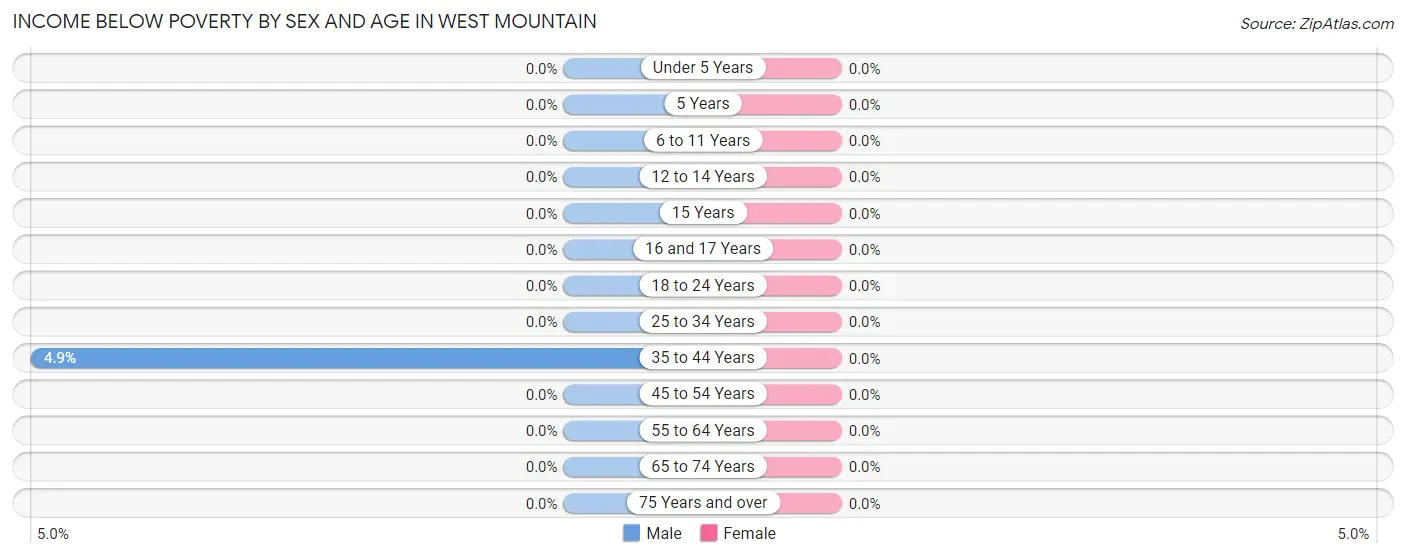
| Age Bracket | Male | Female |
| Under 5 Years | 0 (0.0%) | 0 (0.0%) |
| 5 Years | 0 (0.0%) | 0 (0.0%) |
| 6 to 11 Years | 0 (0.0%) | 0 (0.0%) |
| 12 to 14 Years | 0 (0.0%) | 0 (0.0%) |
| 15 Years | 0 (0.0%) | 0 (0.0%) |
| 16 and 17 Years | 0 (0.0%) | 0 (0.0%) |
| 18 to 24 Years | 0 (0.0%) | 0 (0.0%) |
| 25 to 34 Years | 0 (0.0%) | 0 (0.0%) |
| 35 to 44 Years | 8 (4.9%) | 0 (0.0%) |
| 45 to 54 Years | 0 (0.0%) | 0 (0.0%) |
| 55 to 64 Years | 0 (0.0%) | 0 (0.0%) |
| 65 to 74 Years | 0 (0.0%) | 0 (0.0%) |
| 75 Years and over | 0 (0.0%) | 0 (0.0%) |
| Total | 8 (1.2%) | 0 (0.0%) |
Income Above Poverty by Sex and Age in West Mountain
According to the poverty statistics in West Mountain, males aged under 5 years and females aged under 5 years are the age groups that are most secure financially, with 100.0% of males and 100.0% of females in these age groups living above the poverty line.
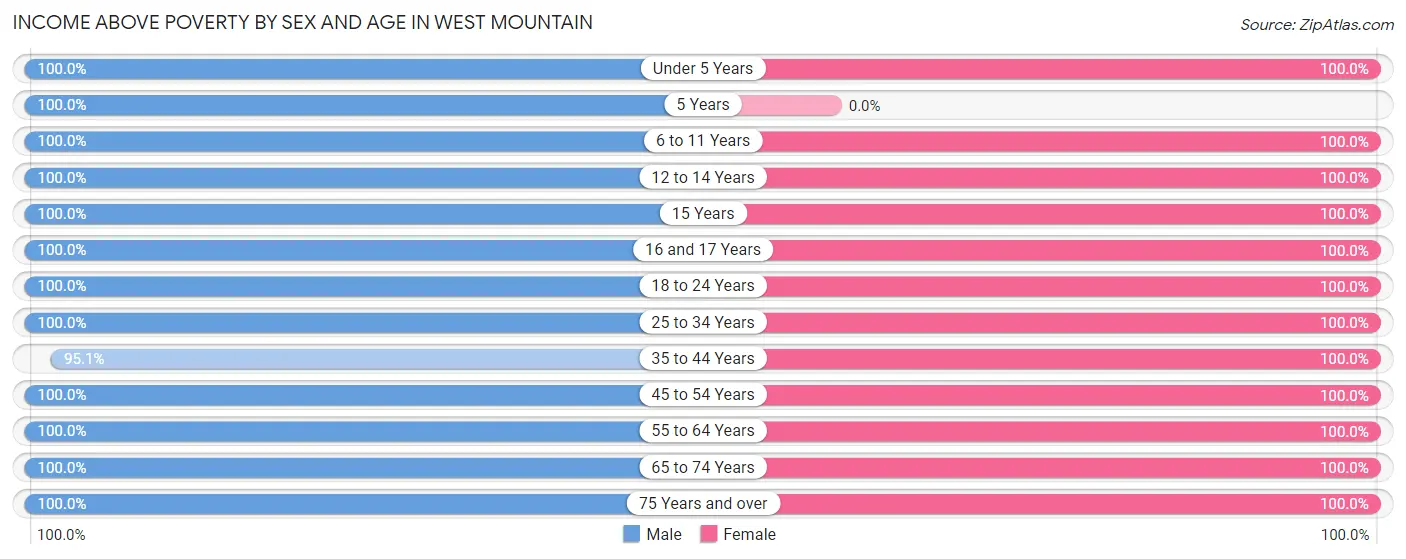
| Age Bracket | Male | Female |
| Under 5 Years | 13 (100.0%) | 22 (100.0%) |
| 5 Years | 19 (100.0%) | 0 (0.0%) |
| 6 to 11 Years | 62 (100.0%) | 88 (100.0%) |
| 12 to 14 Years | 56 (100.0%) | 69 (100.0%) |
| 15 Years | 14 (100.0%) | 14 (100.0%) |
| 16 and 17 Years | 75 (100.0%) | 17 (100.0%) |
| 18 to 24 Years | 32 (100.0%) | 82 (100.0%) |
| 25 to 34 Years | 19 (100.0%) | 33 (100.0%) |
| 35 to 44 Years | 154 (95.1%) | 87 (100.0%) |
| 45 to 54 Years | 79 (100.0%) | 88 (100.0%) |
| 55 to 64 Years | 70 (100.0%) | 58 (100.0%) |
| 65 to 74 Years | 39 (100.0%) | 44 (100.0%) |
| 75 Years and over | 13 (100.0%) | 12 (100.0%) |
| Total | 645 (98.8%) | 614 (100.0%) |
Income Below Poverty Among Married-Couple Families in West Mountain
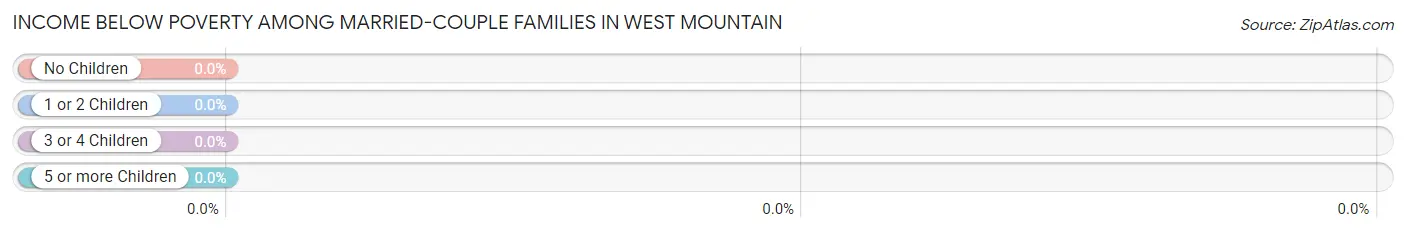
| Children | Above Poverty | Below Poverty |
| No Children | 77 (100.0%) | 0 (0.0%) |
| 1 or 2 Children | 90 (100.0%) | 0 (0.0%) |
| 3 or 4 Children | 80 (100.0%) | 0 (0.0%) |
| 5 or more Children | 3 (100.0%) | 0 (0.0%) |
| Total | 250 (100.0%) | 0 (0.0%) |
Income Below Poverty Among Single-Parent Households in West Mountain
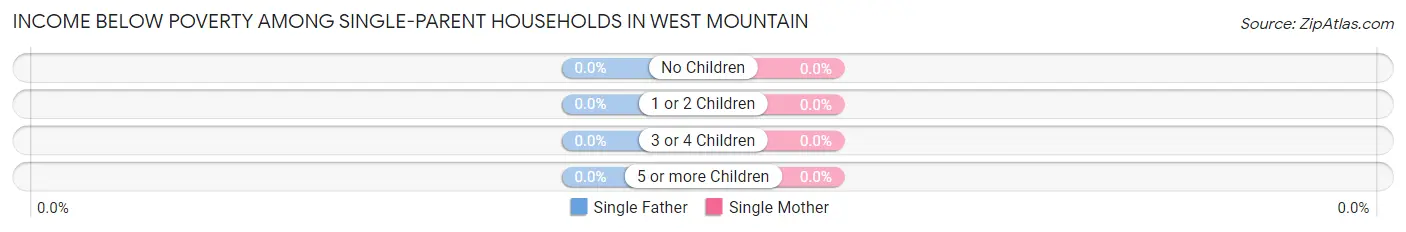
| Children | Single Father | Single Mother |
| No Children | 0 (0.0%) | 0 (0.0%) |
| 1 or 2 Children | 0 (0.0%) | 0 (0.0%) |
| 3 or 4 Children | 0 (0.0%) | 0 (0.0%) |
| 5 or more Children | 0 (0.0%) | 0 (0.0%) |
| Total | 0 (0.0%) | 0 (0.0%) |
Income Below Poverty Among Married-Couple vs Single-Parent Households in West Mountain
| Children | Married-Couple Families | Single-Parent Households |
| No Children | 0 (0.0%) | 0 (0.0%) |
| 1 or 2 Children | 0 (0.0%) | 0 (0.0%) |
| 3 or 4 Children | 0 (0.0%) | 0 (0.0%) |
| 5 or more Children | 0 (0.0%) | 0 (0.0%) |
| Total | 0 (0.0%) | 0 (0.0%) |
Race in West Mountain
The most populous races in West Mountain are White / Caucasian (1,142 | 90.1%), Two or more Races (125 | 9.9%), and Hispanic or Latino (100 | 7.9%).
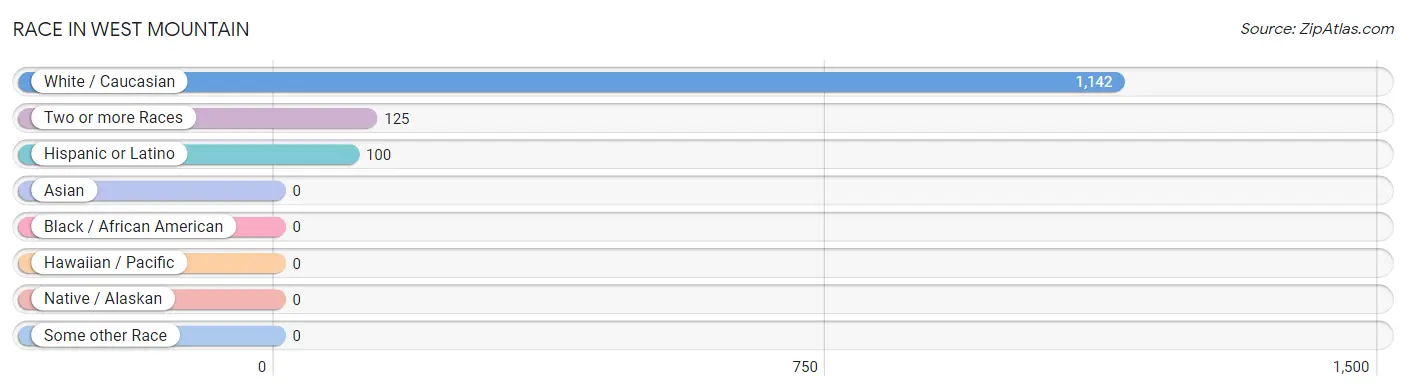
| Race | # Population | % Population |
| Asian | 0 | 0.0% |
| Black / African American | 0 | 0.0% |
| Hawaiian / Pacific | 0 | 0.0% |
| Hispanic or Latino | 100 | 7.9% |
| Native / Alaskan | 0 | 0.0% |
| White / Caucasian | 1,142 | 90.1% |
| Two or more Races | 125 | 9.9% |
| Some other Race | 0 | 0.0% |
| Total | 1,267 | 100.0% |
Ancestry in West Mountain
The most populous ancestries reported in West Mountain are English (624 | 49.2%), Scottish (157 | 12.4%), German (92 | 7.3%), Mexican (92 | 7.3%), and Norwegian (70 | 5.5%), together accounting for 81.7% of all West Mountain residents.
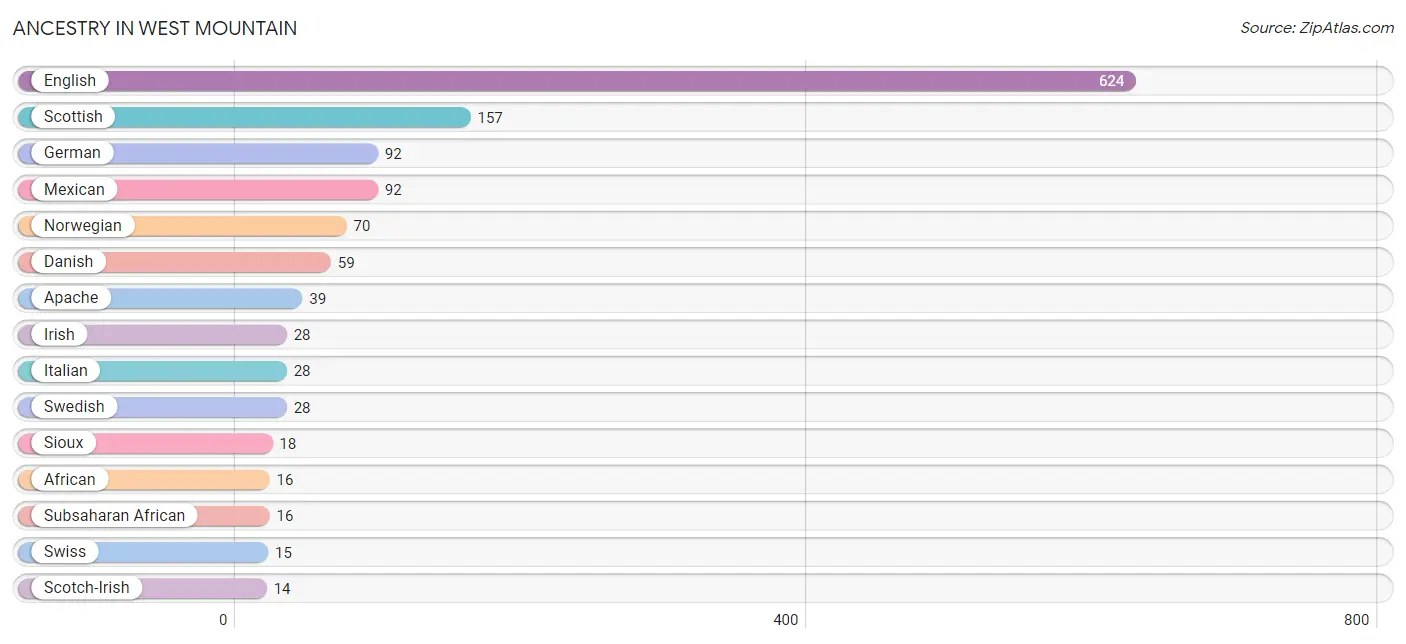
| Ancestry | # Population | % Population |
| African | 16 | 1.3% |
| American | 5 | 0.4% |
| Apache | 39 | 3.1% |
| British | 6 | 0.5% |
| Central American | 8 | 0.6% |
| Central American Indian | 8 | 0.6% |
| Danish | 59 | 4.7% |
| English | 624 | 49.2% |
| European | 8 | 0.6% |
| German | 92 | 7.3% |
| Honduran | 8 | 0.6% |
| Icelander | 7 | 0.5% |
| Indian (Asian) | 8 | 0.6% |
| Irish | 28 | 2.2% |
| Italian | 28 | 2.2% |
| Mexican | 92 | 7.3% |
| Norwegian | 70 | 5.5% |
| Scotch-Irish | 14 | 1.1% |
| Scottish | 157 | 12.4% |
| Sioux | 18 | 1.4% |
| Subsaharan African | 16 | 1.3% |
| Swedish | 28 | 2.2% |
| Swiss | 15 | 1.2% |
| Welsh | 14 | 1.1% | View All 24 Rows |
Immigrants in West Mountain
The most numerous immigrant groups reported in West Mountain came from Central America (36 | 2.8%), Latin America (36 | 2.8%), Mexico (28 | 2.2%), Honduras (8 | 0.6%), and Europe (7 | 0.5%), together accounting for 9.1% of all West Mountain residents.
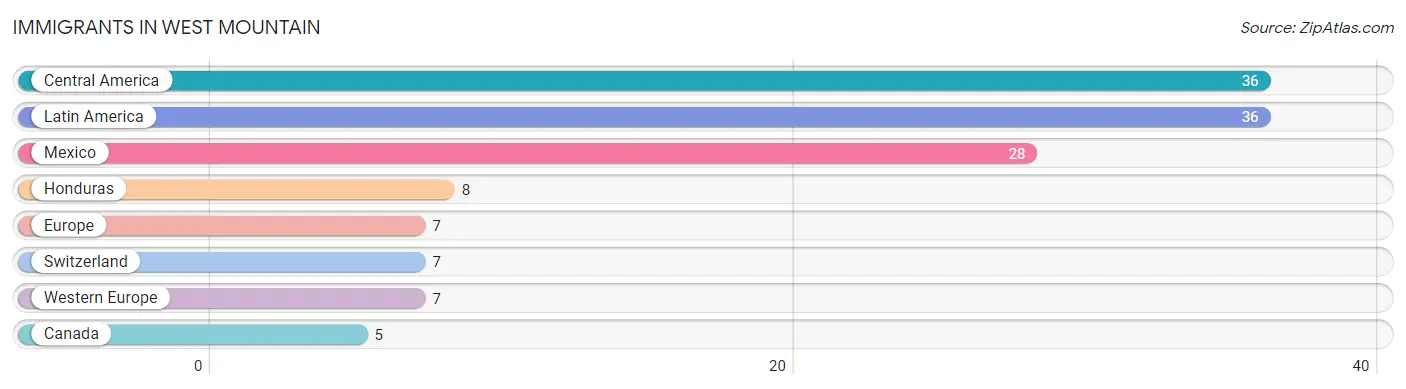
| Immigration Origin | # Population | % Population |
| Canada | 5 | 0.4% |
| Central America | 36 | 2.8% |
| Europe | 7 | 0.5% |
| Honduras | 8 | 0.6% |
| Latin America | 36 | 2.8% |
| Mexico | 28 | 2.2% |
| Switzerland | 7 | 0.5% |
| Western Europe | 7 | 0.5% | View All 8 Rows |
Sex and Age in West Mountain
Sex and Age in West Mountain
The most populous age groups in West Mountain are 35 to 39 Years (109 | 16.7%) for men and 10 to 14 Years (97 | 15.8%) for women.
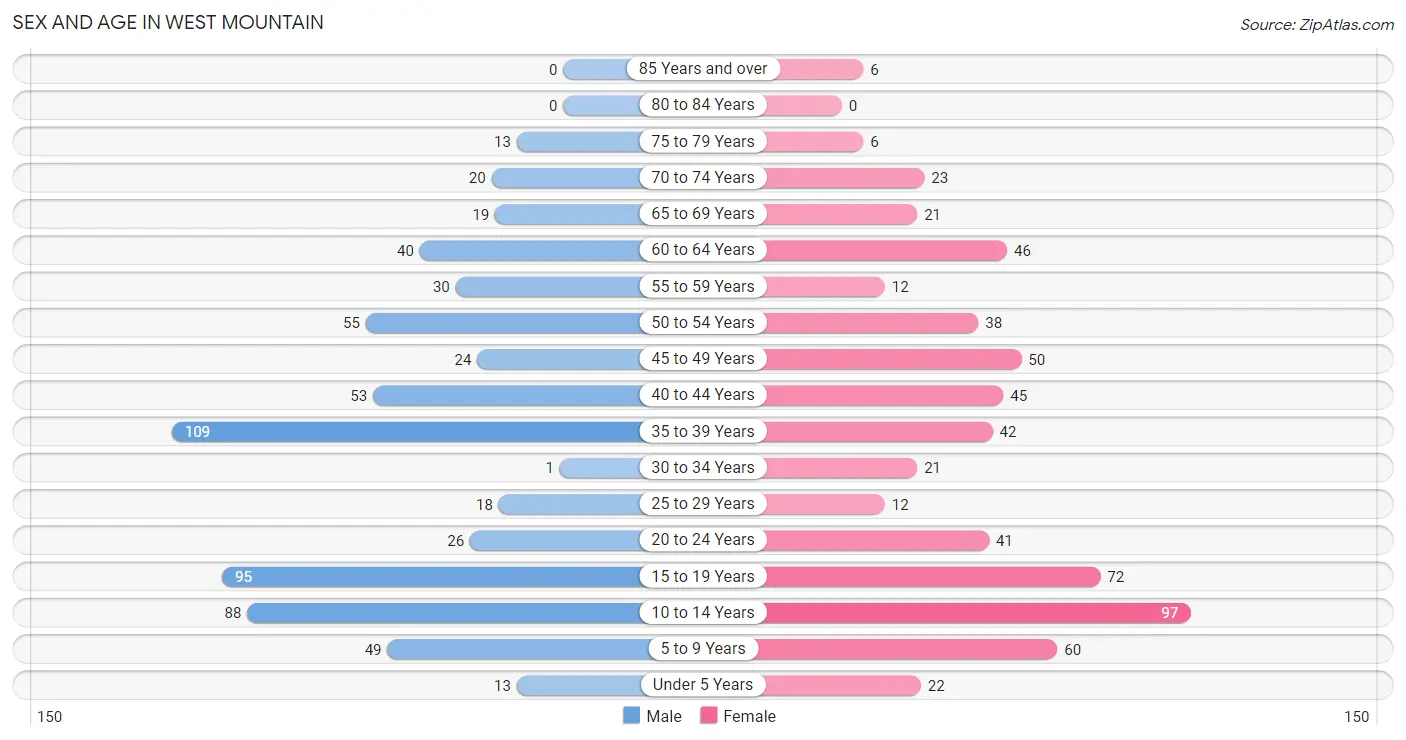
| Age Bracket | Male | Female |
| Under 5 Years | 13 (2.0%) | 22 (3.6%) |
| 5 to 9 Years | 49 (7.5%) | 60 (9.8%) |
| 10 to 14 Years | 88 (13.5%) | 97 (15.8%) |
| 15 to 19 Years | 95 (14.5%) | 72 (11.7%) |
| 20 to 24 Years | 26 (4.0%) | 41 (6.7%) |
| 25 to 29 Years | 18 (2.8%) | 12 (1.9%) |
| 30 to 34 Years | 1 (0.2%) | 21 (3.4%) |
| 35 to 39 Years | 109 (16.7%) | 42 (6.8%) |
| 40 to 44 Years | 53 (8.1%) | 45 (7.3%) |
| 45 to 49 Years | 24 (3.7%) | 50 (8.1%) |
| 50 to 54 Years | 55 (8.4%) | 38 (6.2%) |
| 55 to 59 Years | 30 (4.6%) | 12 (1.9%) |
| 60 to 64 Years | 40 (6.1%) | 46 (7.5%) |
| 65 to 69 Years | 19 (2.9%) | 21 (3.4%) |
| 70 to 74 Years | 20 (3.1%) | 23 (3.7%) |
| 75 to 79 Years | 13 (2.0%) | 6 (1.0%) |
| 80 to 84 Years | 0 (0.0%) | 0 (0.0%) |
| 85 Years and over | 0 (0.0%) | 6 (1.0%) |
| Total | 653 (100.0%) | 614 (100.0%) |
Families and Households in West Mountain
Median Family Size in West Mountain
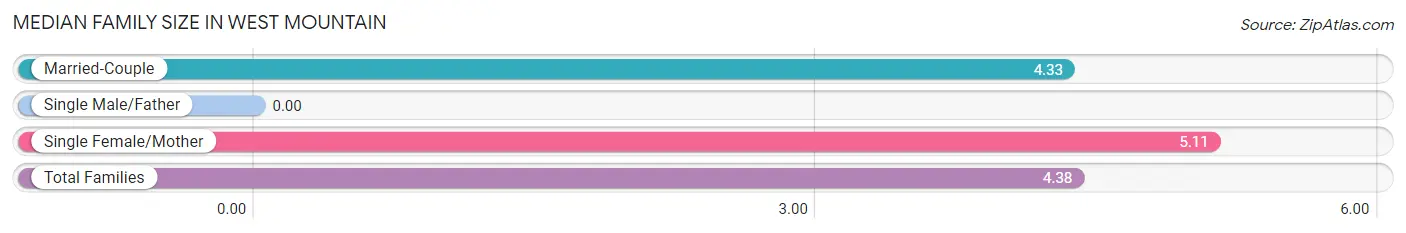
| Family Type | # Families | Family Size |
| Married-Couple | 250 (92.9%) | 4.33 |
| Single Male/Father | 0 (0.0%) | - |
| Single Female/Mother | 19 (7.1%) | 5.11 |
| Total Families | 269 (100.0%) | 4.38 |
Median Household Size in West Mountain
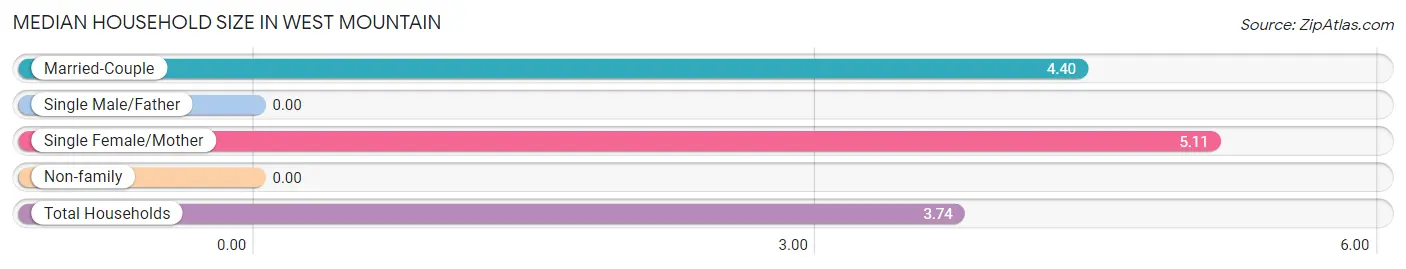
| Household Type | # Households | Household Size |
| Married-Couple | 250 (73.8%) | 4.40 |
| Single Male/Father | 0 (0.0%) | - |
| Single Female/Mother | 19 (5.6%) | 5.11 |
| Non-family | 70 (20.6%) | - |
| Total Households | 339 (100.0%) | 3.74 |
Household Size by Marriage Status in West Mountain
Out of a total of 339 households in West Mountain, 269 (79.3%) are family households, while 70 (20.6%) are nonfamily households. The most numerous type of family households are 3-person households, comprising 62, and the most common type of nonfamily households are 1-person households, comprising 70.
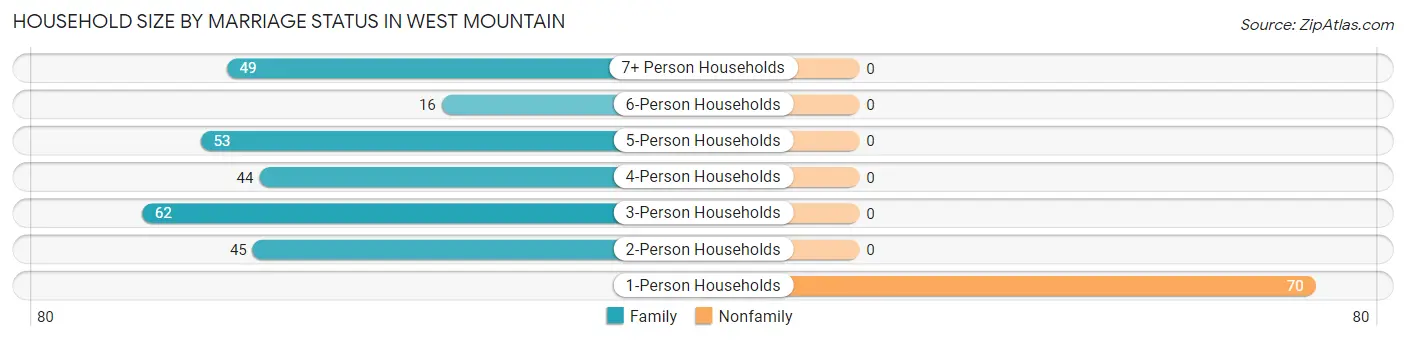
| Household Size | Family Households | Nonfamily Households |
| 1-Person Households | - | 70 (20.6%) |
| 2-Person Households | 45 (13.3%) | 0 (0.0%) |
| 3-Person Households | 62 (18.3%) | 0 (0.0%) |
| 4-Person Households | 44 (13.0%) | 0 (0.0%) |
| 5-Person Households | 53 (15.6%) | 0 (0.0%) |
| 6-Person Households | 16 (4.7%) | 0 (0.0%) |
| 7+ Person Households | 49 (14.4%) | 0 (0.0%) |
| Total | 269 (79.3%) | 70 (20.6%) |
Female Fertility in West Mountain
Fertility by Age in West Mountain
Average fertility rate in West Mountain is 32.0 births per 1,000 women. Women in the age bracket of 20 to 34 years have the highest fertility rate with 122.0 births per 1,000 women. Women in the age bracket of 20 to 34 years acount for 100.0% of all women with births.
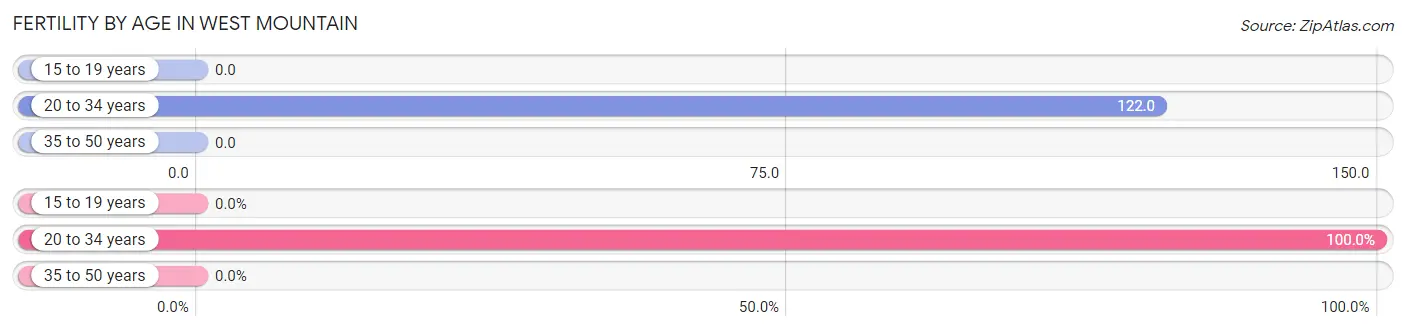
| Age Bracket | Women with Births | Births / 1,000 Women |
| 15 to 19 years | 0 (0.0%) | 0.0 |
| 20 to 34 years | 9 (100.0%) | 122.0 |
| 35 to 50 years | 0 (0.0%) | 0.0 |
| Total | 9 (100.0%) | 32.0 |
Fertility by Age by Marriage Status in West Mountain
66.7% of women with births (9) in West Mountain are married. The highest percentage of unmarried women with births falls into 20 to 34 years age bracket with 33.3% of them unmarried at the time of birth, while the lowest percentage of unmarried women with births belong to 20 to 34 years age bracket with 33.3% of them unmarried.
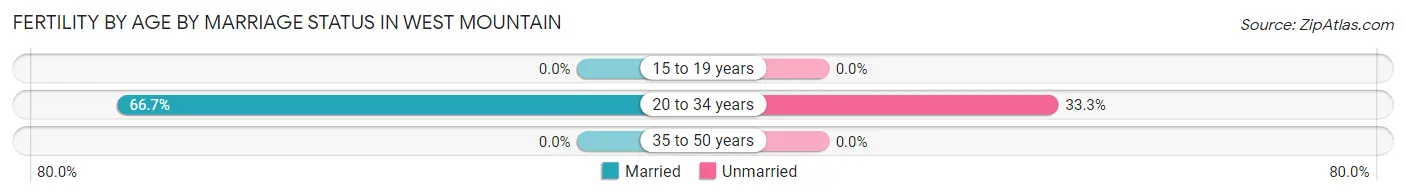
| Age Bracket | Married | Unmarried |
| 15 to 19 years | 0 (0.0%) | 0 (0.0%) |
| 20 to 34 years | 6 (66.7%) | 3 (33.3%) |
| 35 to 50 years | 0 (0.0%) | 0 (0.0%) |
| Total | 6 (66.7%) | 3 (33.3%) |
Fertility by Education in West Mountain
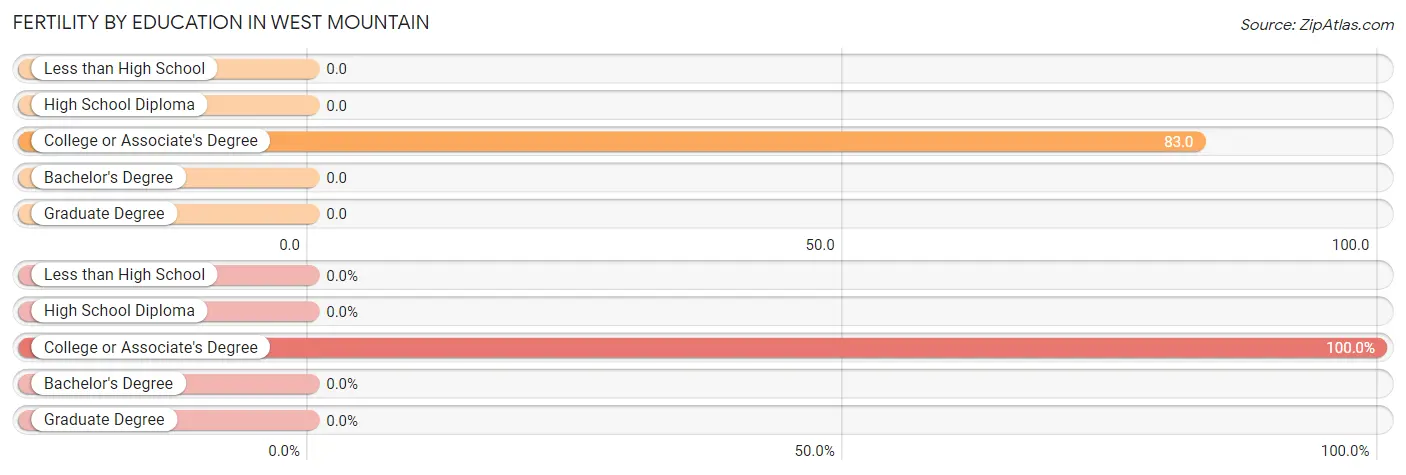
| Educational Attainment | Women with Births | Births / 1,000 Women |
| Less than High School | 0 (0.0%) | 0.0 |
| High School Diploma | 0 (0.0%) | 0.0 |
| College or Associate's Degree | 9 (100.0%) | 83.0 |
| Bachelor's Degree | 0 (0.0%) | 0.0 |
| Graduate Degree | 0 (0.0%) | 0.0 |
| Total | 9 (100.0%) | 32.0 |
Fertility by Education by Marriage Status in West Mountain
33.3% of women with births in West Mountain are unmarried. Women with the educational attainment of college or associate's degree are most likely to be married with 66.7% of them married at childbirth, while women with the educational attainment of college or associate's degree are least likely to be married with 33.3% of them unmarried at childbirth.
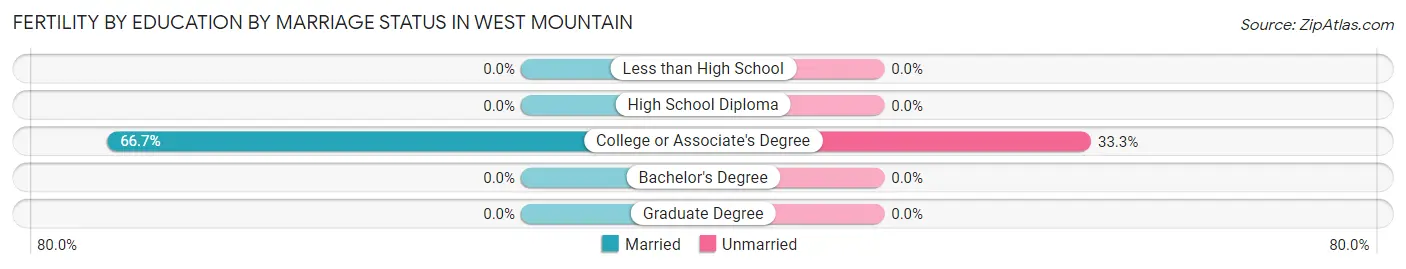
| Educational Attainment | Married | Unmarried |
| Less than High School | 0 (0.0%) | 0 (0.0%) |
| High School Diploma | 0 (0.0%) | 0 (0.0%) |
| College or Associate's Degree | 6 (66.7%) | 3 (33.3%) |
| Bachelor's Degree | 0 (0.0%) | 0 (0.0%) |
| Graduate Degree | 0 (0.0%) | 0 (0.0%) |
| Total | 6 (66.7%) | 3 (33.3%) |
Employment Characteristics in West Mountain
Employment by Class of Employer in West Mountain
Among the 642 employed individuals in West Mountain, private company employees (439 | 68.4%), local government employees (54 | 8.4%), and state government employees (53 | 8.3%) make up the most common classes of employment.
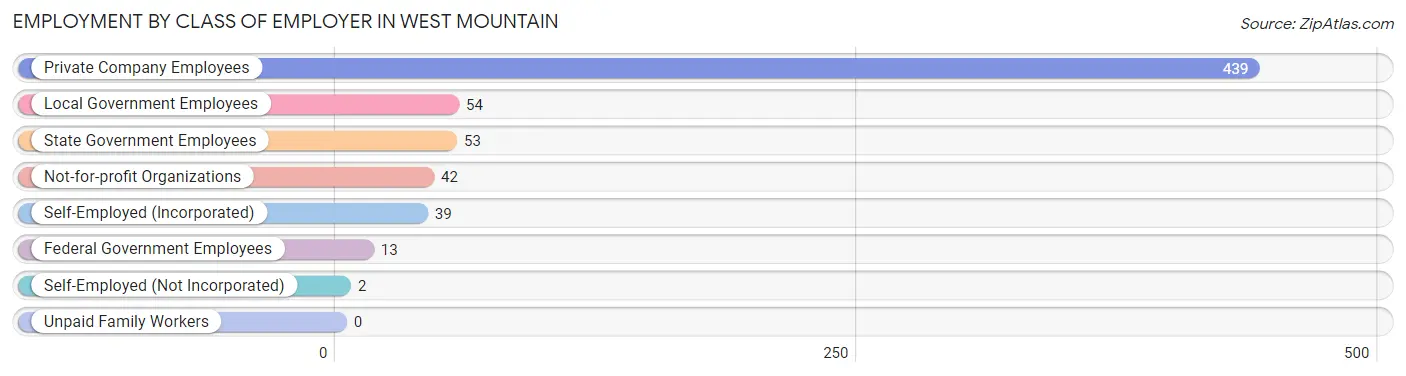
| Employer Class | # Employees | % Employees |
| Private Company Employees | 439 | 68.4% |
| Self-Employed (Incorporated) | 39 | 6.1% |
| Self-Employed (Not Incorporated) | 2 | 0.3% |
| Not-for-profit Organizations | 42 | 6.5% |
| Local Government Employees | 54 | 8.4% |
| State Government Employees | 53 | 8.3% |
| Federal Government Employees | 13 | 2.0% |
| Unpaid Family Workers | 0 | 0.0% |
| Total | 642 | 100.0% |
Employment Status by Age in West Mountain
According to the labor force statistics for West Mountain, out of the total population over 16 years of age (910), 74.6% or 679 individuals are in the labor force, with 4.9% or 33 of them unemployed. The age group with the highest labor force participation rate is 20 to 24 years, with 100.0% or 67 individuals in the labor force. Within the labor force, the 16 to 19 years age range has the highest percentage of unemployed individuals, with 12.5% or 8 of them being unemployed.
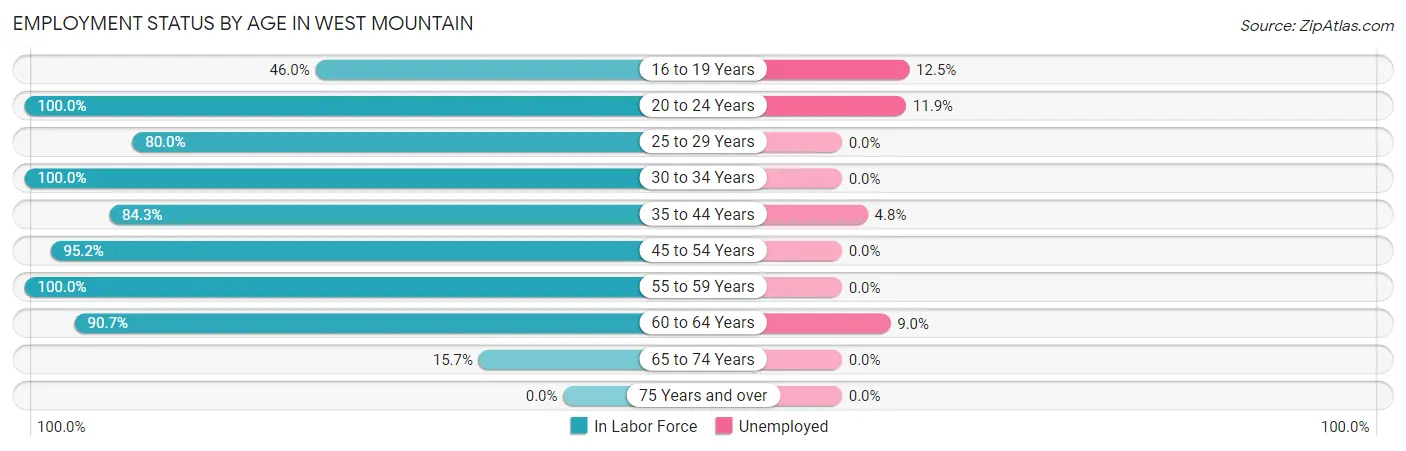
| Age Bracket | In Labor Force | Unemployed |
| 16 to 19 Years | 64 (46.0%) | 8 (12.5%) |
| 20 to 24 Years | 67 (100.0%) | 8 (11.9%) |
| 25 to 29 Years | 24 (80.0%) | 0 (0.0%) |
| 30 to 34 Years | 22 (100.0%) | 0 (0.0%) |
| 35 to 44 Years | 210 (84.3%) | 10 (4.8%) |
| 45 to 54 Years | 159 (95.2%) | 0 (0.0%) |
| 55 to 59 Years | 42 (100.0%) | 0 (0.0%) |
| 60 to 64 Years | 78 (90.7%) | 7 (9.0%) |
| 65 to 74 Years | 13 (15.7%) | 0 (0.0%) |
| 75 Years and over | 0 (0.0%) | 0 (0.0%) |
| Total | 679 (74.6%) | 33 (4.9%) |
Employment Status by Educational Attainment in West Mountain
According to labor force statistics for West Mountain, 89.8% of individuals (535) out of the total population between 25 and 64 years of age (596) are in the labor force, with 3.2% or 17 of them being unemployed. The group with the highest labor force participation rate are those with the educational attainment of high school diploma, with 94.0% or 171 individuals in the labor force. Within the labor force, individuals with high school diploma education have the highest percentage of unemployment, with 5.8% or 10 of them being unemployed.
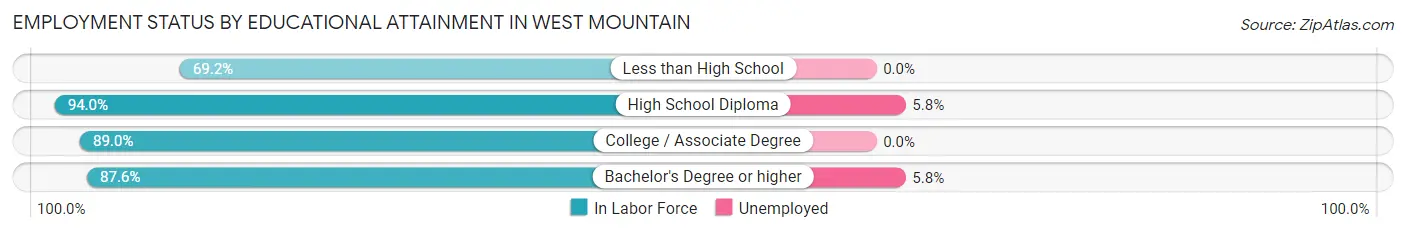
| Educational Attainment | In Labor Force | Unemployed |
| Less than High School | 9 (69.2%) | 0 (0.0%) |
| High School Diploma | 171 (94.0%) | 11 (5.8%) |
| College / Associate Degree | 235 (89.0%) | 0 (0.0%) |
| Bachelor's Degree or higher | 120 (87.6%) | 8 (5.8%) |
| Total | 535 (89.8%) | 19 (3.2%) |
Employment Occupations by Sex in West Mountain
Management, Business, Science and Arts Occupations
The most common Management, Business, Science and Arts occupations in West Mountain are Community & Social Service (63 | 9.8%), Education Instruction & Library (49 | 7.6%), Management (48 | 7.4%), Computers, Engineering & Science (34 | 5.3%), and Health Diagnosing & Treating (27 | 4.2%).
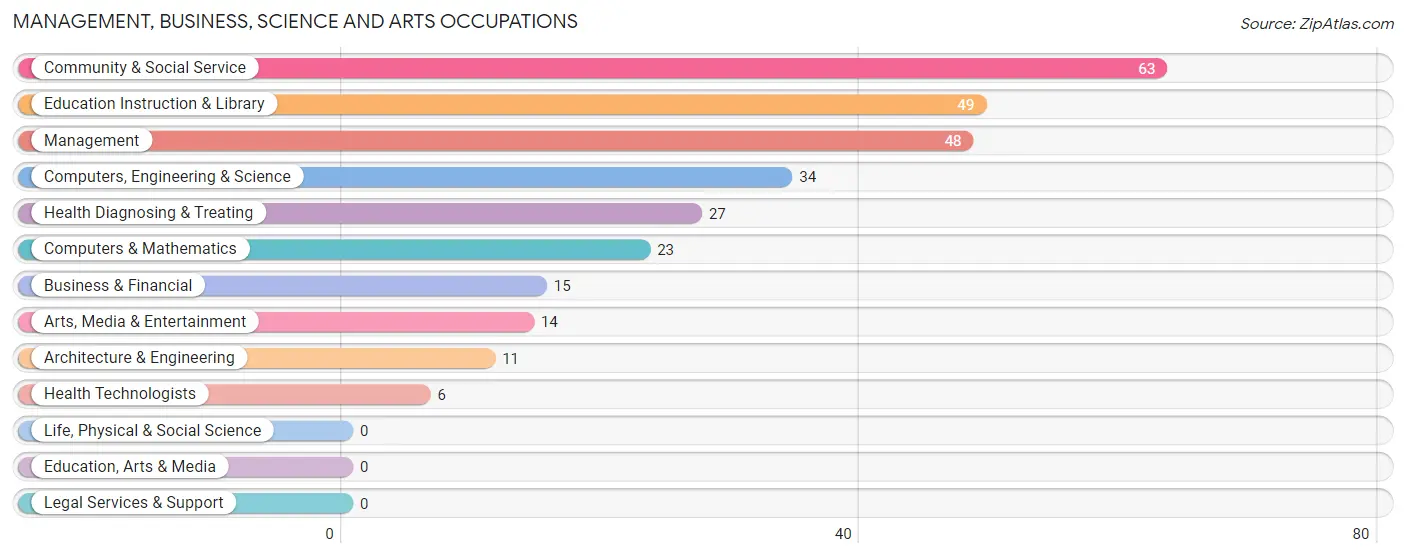
Management, Business, Science and Arts Occupations by Sex
Within the Management, Business, Science and Arts occupations in West Mountain, the most male-oriented occupations are Computers, Engineering & Science (100.0%), Computers & Mathematics (100.0%), and Architecture & Engineering (100.0%), while the most female-oriented occupations are Arts, Media & Entertainment (100.0%), Health Technologists (100.0%), and Community & Social Service (68.2%).
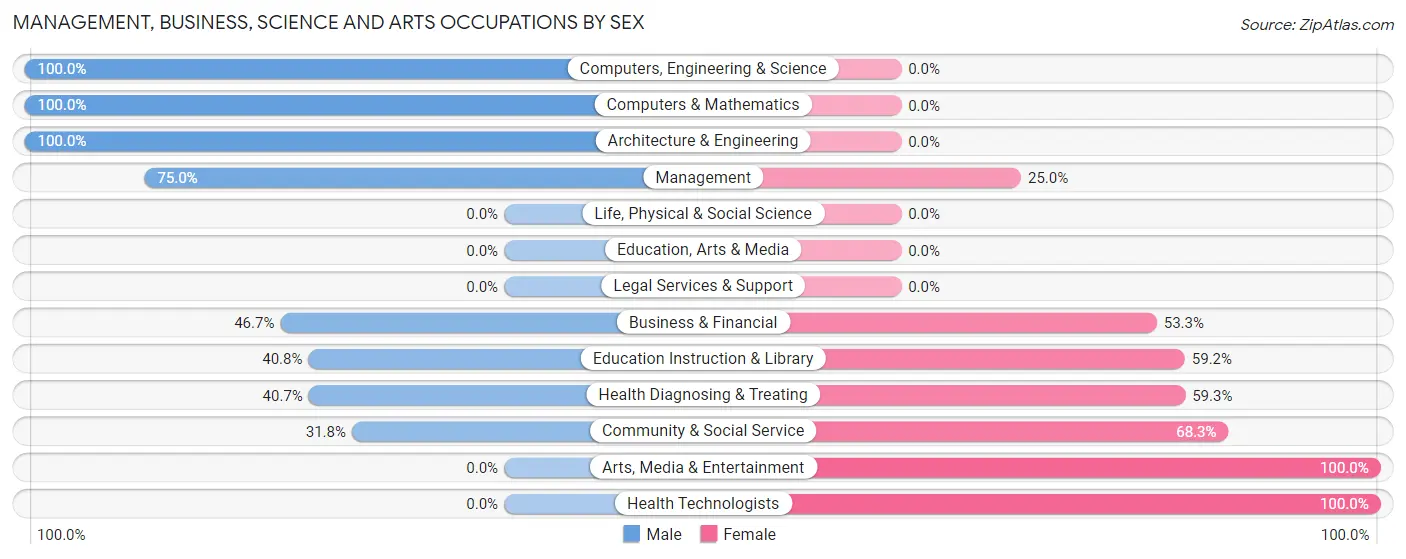
| Occupation | Male | Female |
| Management | 36 (75.0%) | 12 (25.0%) |
| Business & Financial | 7 (46.7%) | 8 (53.3%) |
| Computers, Engineering & Science | 34 (100.0%) | 0 (0.0%) |
| Computers & Mathematics | 23 (100.0%) | 0 (0.0%) |
| Architecture & Engineering | 11 (100.0%) | 0 (0.0%) |
| Life, Physical & Social Science | 0 (0.0%) | 0 (0.0%) |
| Community & Social Service | 20 (31.8%) | 43 (68.2%) |
| Education, Arts & Media | 0 (0.0%) | 0 (0.0%) |
| Legal Services & Support | 0 (0.0%) | 0 (0.0%) |
| Education Instruction & Library | 20 (40.8%) | 29 (59.2%) |
| Arts, Media & Entertainment | 0 (0.0%) | 14 (100.0%) |
| Health Diagnosing & Treating | 11 (40.7%) | 16 (59.3%) |
| Health Technologists | 0 (0.0%) | 6 (100.0%) |
| Total (Category) | 108 (57.8%) | 79 (42.2%) |
| Total (Overall) | 357 (55.3%) | 289 (44.7%) |
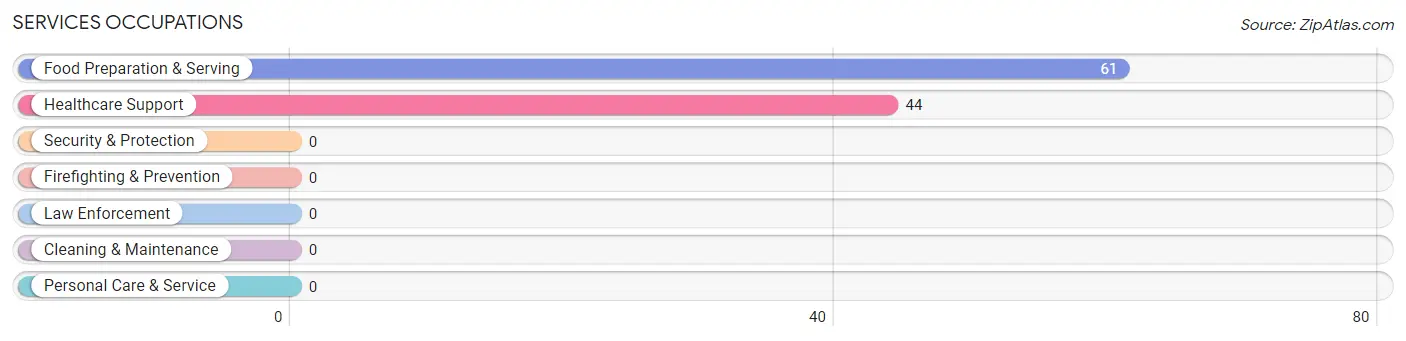
Services Occupations
The most common Services occupations in West Mountain are Food Preparation & Serving (61 | 9.4%), and Healthcare Support (44 | 6.8%).
Services Occupations by Sex
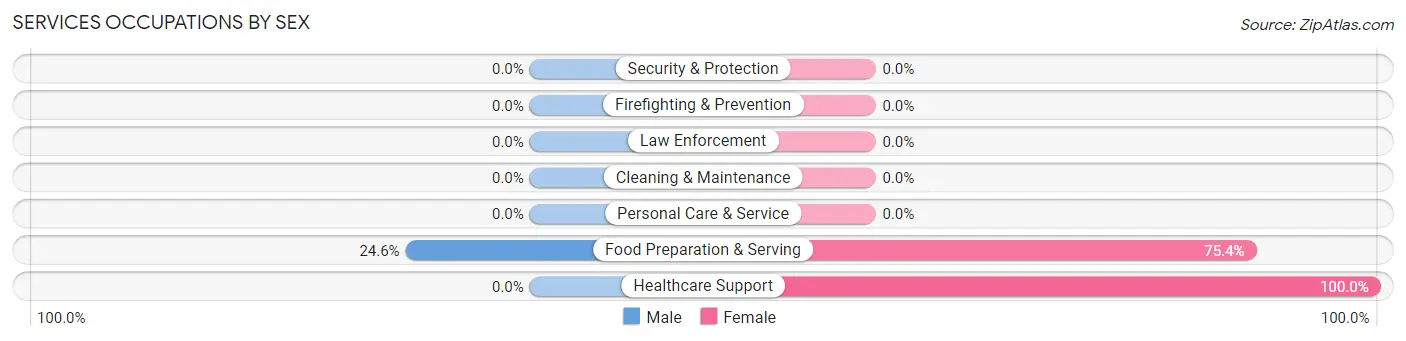
| Occupation | Male | Female |
| Healthcare Support | 0 (0.0%) | 44 (100.0%) |
| Security & Protection | 0 (0.0%) | 0 (0.0%) |
| Firefighting & Prevention | 0 (0.0%) | 0 (0.0%) |
| Law Enforcement | 0 (0.0%) | 0 (0.0%) |
| Food Preparation & Serving | 15 (24.6%) | 46 (75.4%) |
| Cleaning & Maintenance | 0 (0.0%) | 0 (0.0%) |
| Personal Care & Service | 0 (0.0%) | 0 (0.0%) |
| Total (Category) | 15 (14.3%) | 90 (85.7%) |
| Total (Overall) | 357 (55.3%) | 289 (44.7%) |
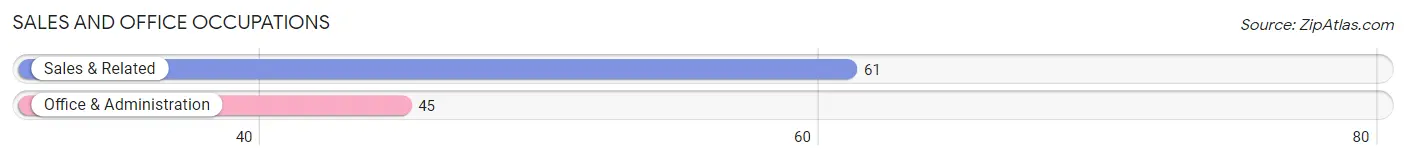
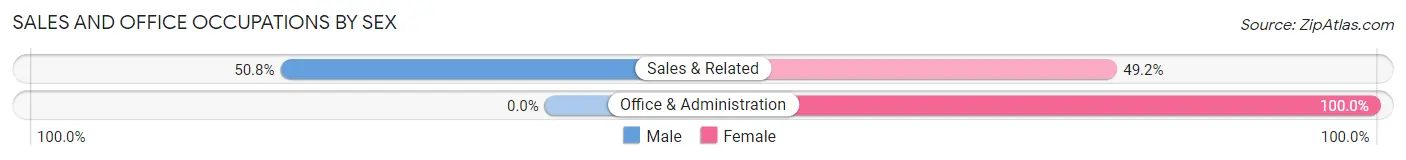
Sales and Office Occupations
The most common Sales and Office occupations in West Mountain are Sales & Related (61 | 9.4%), and Office & Administration (45 | 7.0%).
Sales and Office Occupations by Sex
| Occupation | Male | Female |
| Sales & Related | 31 (50.8%) | 30 (49.2%) |
| Office & Administration | 0 (0.0%) | 45 (100.0%) |
| Total (Category) | 31 (29.2%) | 75 (70.8%) |
| Total (Overall) | 357 (55.3%) | 289 (44.7%) |
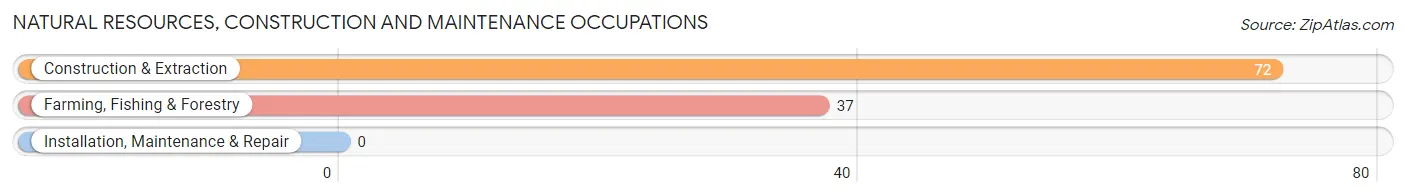
Natural Resources, Construction and Maintenance Occupations
The most common Natural Resources, Construction and Maintenance occupations in West Mountain are Construction & Extraction (72 | 11.2%), and Farming, Fishing & Forestry (37 | 5.7%).
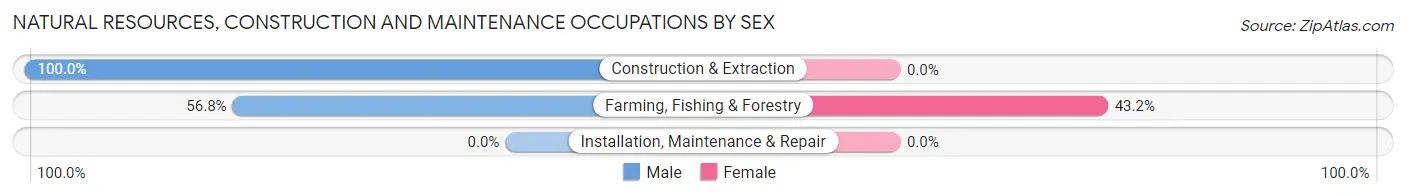
Natural Resources, Construction and Maintenance Occupations by Sex
| Occupation | Male | Female |
| Farming, Fishing & Forestry | 21 (56.8%) | 16 (43.2%) |
| Construction & Extraction | 72 (100.0%) | 0 (0.0%) |
| Installation, Maintenance & Repair | 0 (0.0%) | 0 (0.0%) |
| Total (Category) | 93 (85.3%) | 16 (14.7%) |
| Total (Overall) | 357 (55.3%) | 289 (44.7%) |
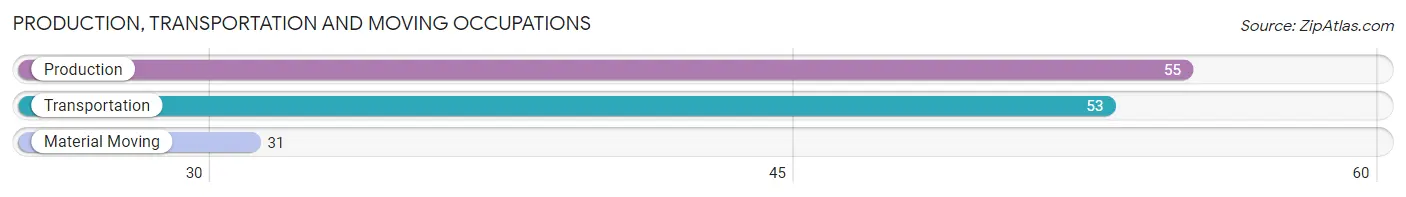
Production, Transportation and Moving Occupations
The most common Production, Transportation and Moving occupations in West Mountain are Production (55 | 8.5%), Transportation (53 | 8.2%), and Material Moving (31 | 4.8%).
Production, Transportation and Moving Occupations by Sex
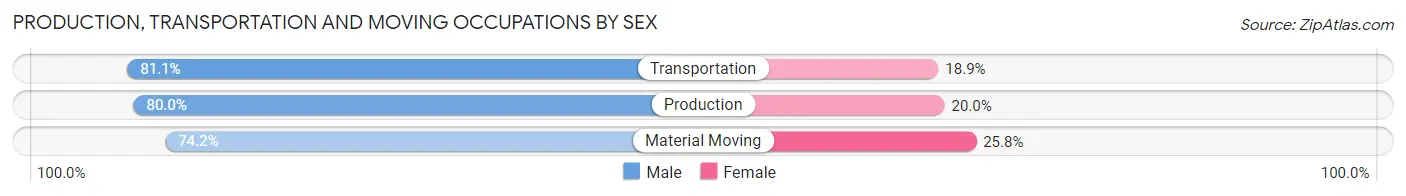
| Occupation | Male | Female |
| Production | 44 (80.0%) | 11 (20.0%) |
| Transportation | 43 (81.1%) | 10 (18.9%) |
| Material Moving | 23 (74.2%) | 8 (25.8%) |
| Total (Category) | 110 (79.1%) | 29 (20.9%) |
| Total (Overall) | 357 (55.3%) | 289 (44.7%) |
Employment Industries by Sex in West Mountain
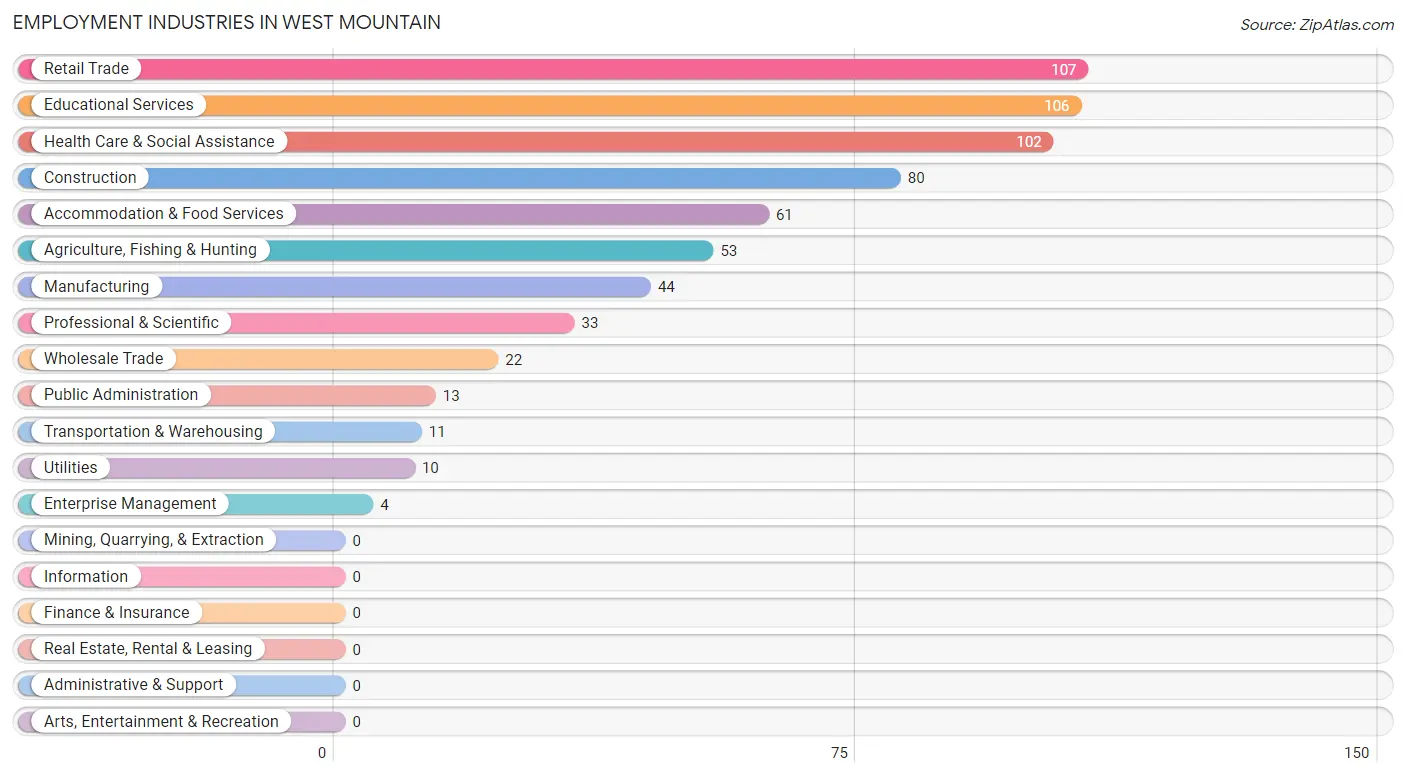
Employment Industries in West Mountain
The major employment industries in West Mountain include Retail Trade (107 | 16.6%), Educational Services (106 | 16.4%), Health Care & Social Assistance (102 | 15.8%), Construction (80 | 12.4%), and Accommodation & Food Services (61 | 9.4%).
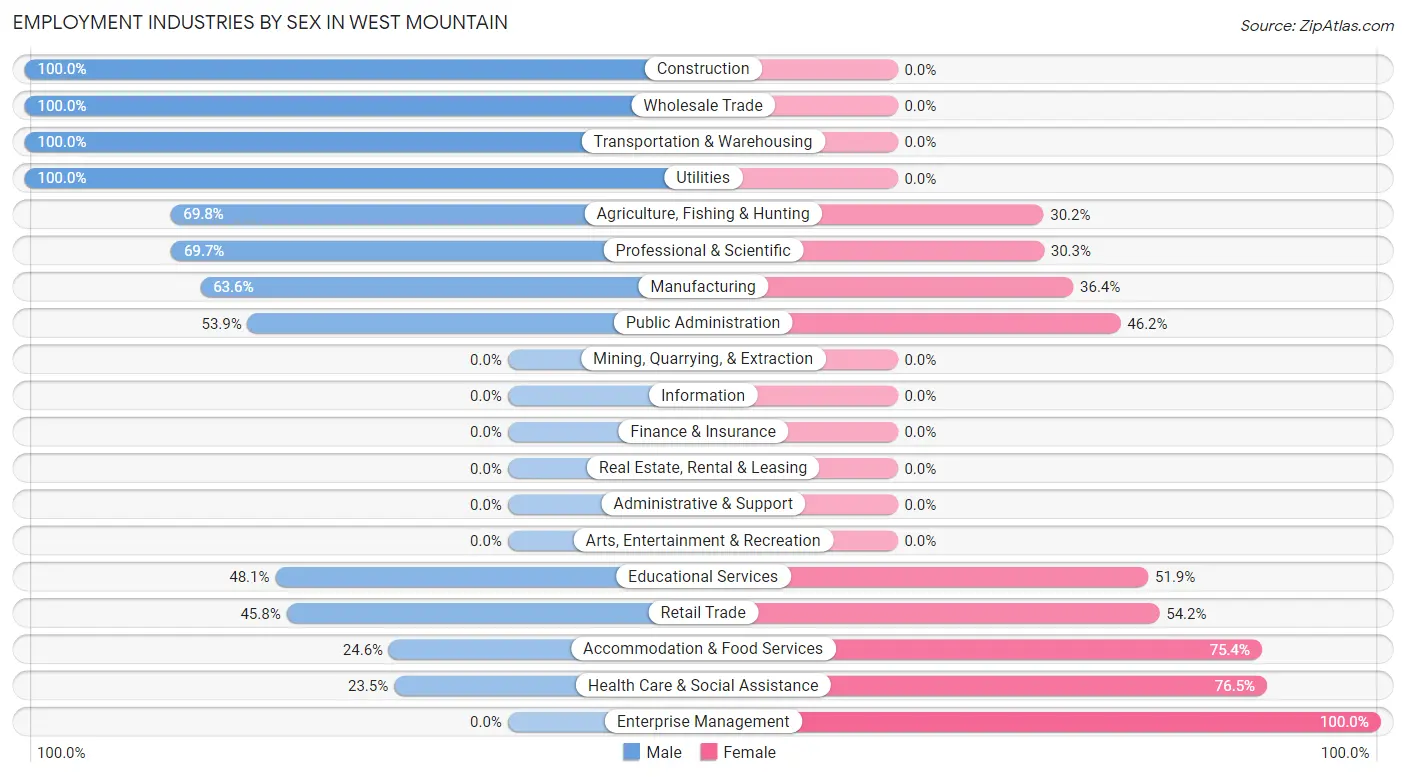
Employment Industries by Sex in West Mountain
The West Mountain industries that see more men than women are Construction (100.0%), Wholesale Trade (100.0%), and Transportation & Warehousing (100.0%), whereas the industries that tend to have a higher number of women are Enterprise Management (100.0%), Health Care & Social Assistance (76.5%), and Accommodation & Food Services (75.4%).
| Industry | Male | Female |
| Agriculture, Fishing & Hunting | 37 (69.8%) | 16 (30.2%) |
| Mining, Quarrying, & Extraction | 0 (0.0%) | 0 (0.0%) |
| Construction | 80 (100.0%) | 0 (0.0%) |
| Manufacturing | 28 (63.6%) | 16 (36.4%) |
| Wholesale Trade | 22 (100.0%) | 0 (0.0%) |
| Retail Trade | 49 (45.8%) | 58 (54.2%) |
| Transportation & Warehousing | 11 (100.0%) | 0 (0.0%) |
| Utilities | 10 (100.0%) | 0 (0.0%) |
| Information | 0 (0.0%) | 0 (0.0%) |
| Finance & Insurance | 0 (0.0%) | 0 (0.0%) |
| Real Estate, Rental & Leasing | 0 (0.0%) | 0 (0.0%) |
| Professional & Scientific | 23 (69.7%) | 10 (30.3%) |
| Enterprise Management | 0 (0.0%) | 4 (100.0%) |
| Administrative & Support | 0 (0.0%) | 0 (0.0%) |
| Educational Services | 51 (48.1%) | 55 (51.9%) |
| Health Care & Social Assistance | 24 (23.5%) | 78 (76.5%) |
| Arts, Entertainment & Recreation | 0 (0.0%) | 0 (0.0%) |
| Accommodation & Food Services | 15 (24.6%) | 46 (75.4%) |
| Public Administration | 7 (53.8%) | 6 (46.2%) |
| Total | 357 (55.3%) | 289 (44.7%) |
Education in West Mountain
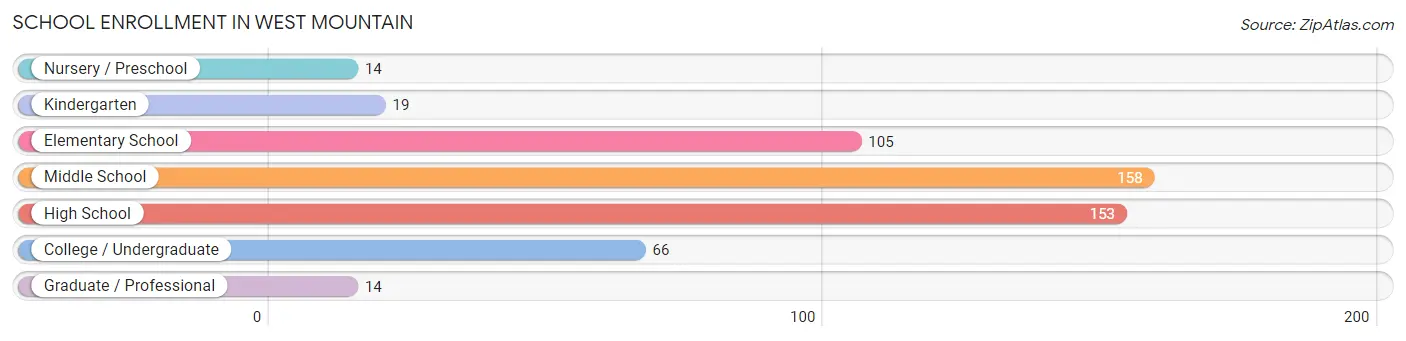
School Enrollment in West Mountain
The most common levels of schooling among the 529 students in West Mountain are middle school (158 | 29.9%), high school (153 | 28.9%), and elementary school (105 | 19.9%).
| School Level | # Students | % Students |
| Nursery / Preschool | 14 | 2.6% |
| Kindergarten | 19 | 3.6% |
| Elementary School | 105 | 19.9% |
| Middle School | 158 | 29.9% |
| High School | 153 | 28.9% |
| College / Undergraduate | 66 | 12.5% |
| Graduate / Professional | 14 | 2.6% |
| Total | 529 | 100.0% |
School Enrollment by Age by Funding Source in West Mountain
Out of a total of 529 students who are enrolled in schools in West Mountain, 51 (9.6%) attend a private institution, while the remaining 478 (90.4%) are enrolled in public schools. The age group of 25 to 34 year olds has the highest likelihood of being enrolled in private schools, with 7 (100.0% in the age bracket) enrolled. Conversely, the age group of 18 to 19 year olds has the lowest likelihood of being enrolled in a private school, with 41 (100.0% in the age bracket) attending a public institution.
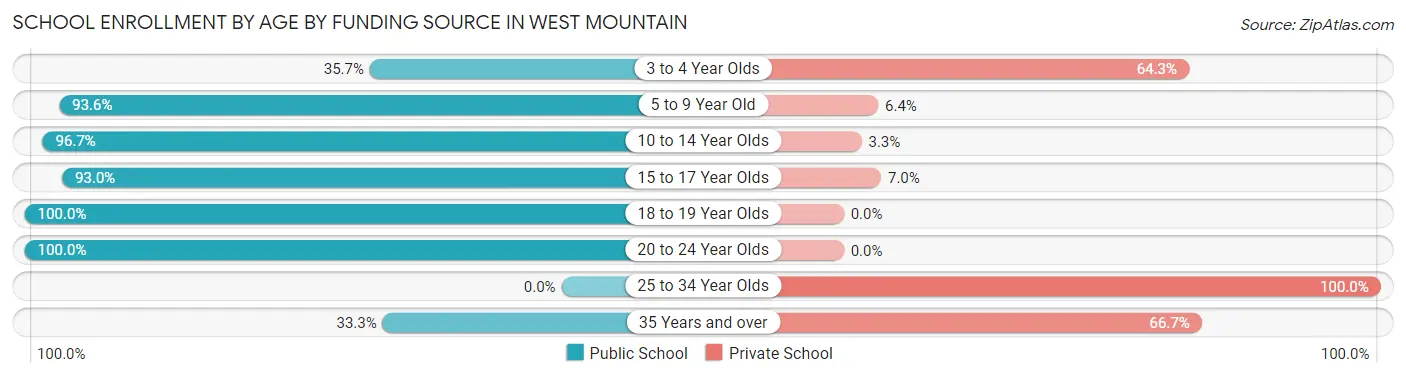
| Age Bracket | Public School | Private School |
| 3 to 4 Year Olds | 5 (35.7%) | 9 (64.3%) |
| 5 to 9 Year Old | 102 (93.6%) | 7 (6.4%) |
| 10 to 14 Year Olds | 174 (96.7%) | 6 (3.3%) |
| 15 to 17 Year Olds | 107 (93.0%) | 8 (7.0%) |
| 18 to 19 Year Olds | 41 (100.0%) | 0 (0.0%) |
| 20 to 24 Year Olds | 42 (100.0%) | 0 (0.0%) |
| 25 to 34 Year Olds | 0 (0.0%) | 7 (100.0%) |
| 35 Years and over | 7 (33.3%) | 14 (66.7%) |
| Total | 478 (90.4%) | 51 (9.6%) |
Educational Attainment by Field of Study in West Mountain
Education (61 | 32.5%), social sciences (49 | 26.1%), computers & mathematics (21 | 11.2%), science & technology (18 | 9.6%), and bio, nature & agricultural (14 | 7.4%) are the most common fields of study among 188 individuals in West Mountain who have obtained a bachelor's degree or higher.
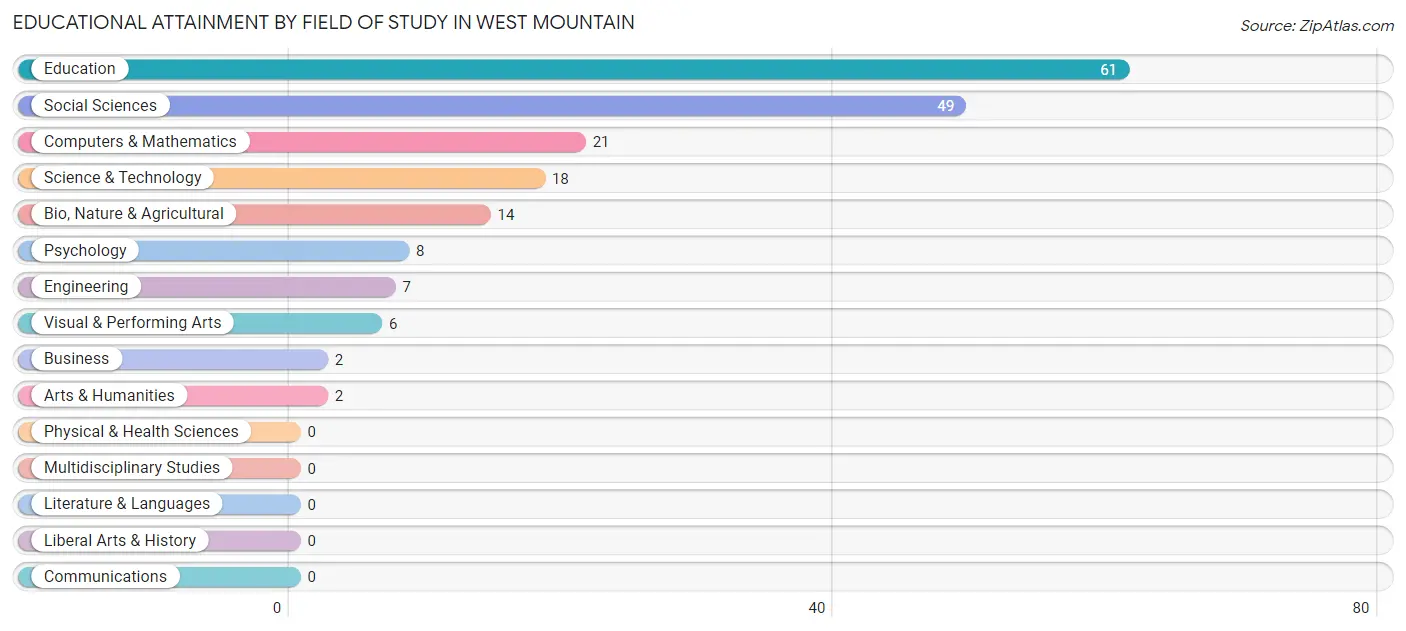
| Field of Study | # Graduates | % Graduates |
| Computers & Mathematics | 21 | 11.2% |
| Bio, Nature & Agricultural | 14 | 7.4% |
| Physical & Health Sciences | 0 | 0.0% |
| Psychology | 8 | 4.3% |
| Social Sciences | 49 | 26.1% |
| Engineering | 7 | 3.7% |
| Multidisciplinary Studies | 0 | 0.0% |
| Science & Technology | 18 | 9.6% |
| Business | 2 | 1.1% |
| Education | 61 | 32.5% |
| Literature & Languages | 0 | 0.0% |
| Liberal Arts & History | 0 | 0.0% |
| Visual & Performing Arts | 6 | 3.2% |
| Communications | 0 | 0.0% |
| Arts & Humanities | 2 | 1.1% |
| Total | 188 | 100.0% |
Transportation & Commute in West Mountain
Vehicle Availability by Sex in West Mountain
The most prevalent vehicle ownership categories in West Mountain are males with 3 vehicles (106, accounting for 29.7%) and females with 3 vehicles (99, making up 37.2%).
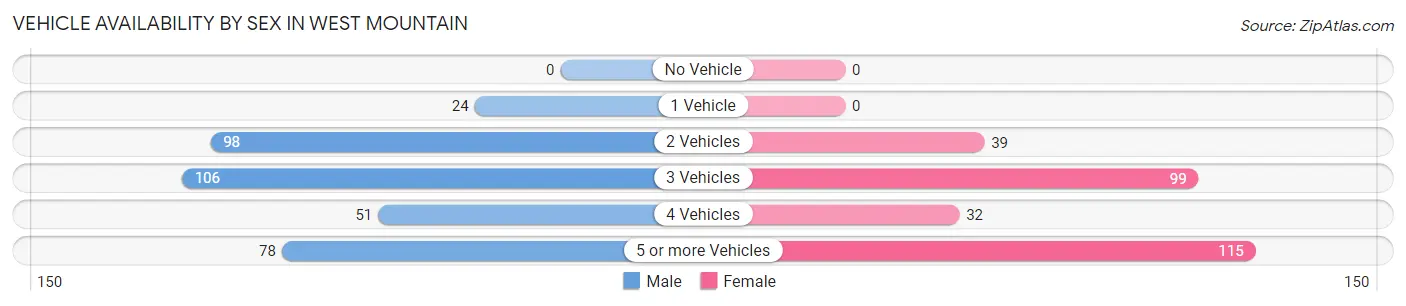
| Vehicles Available | Male | Female |
| No Vehicle | 0 (0.0%) | 0 (0.0%) |
| 1 Vehicle | 24 (6.7%) | 0 (0.0%) |
| 2 Vehicles | 98 (27.5%) | 39 (13.7%) |
| 3 Vehicles | 106 (29.7%) | 99 (34.7%) |
| 4 Vehicles | 51 (14.3%) | 32 (11.2%) |
| 5 or more Vehicles | 78 (21.8%) | 115 (40.4%) |
| Total | 357 (100.0%) | 285 (100.0%) |
Commute Time in West Mountain
The most frequently occuring commute durations in West Mountain are 15 to 19 minutes (160 commuters, 29.5%), 20 to 24 minutes (92 commuters, 16.9%), and 10 to 14 minutes (62 commuters, 11.4%).
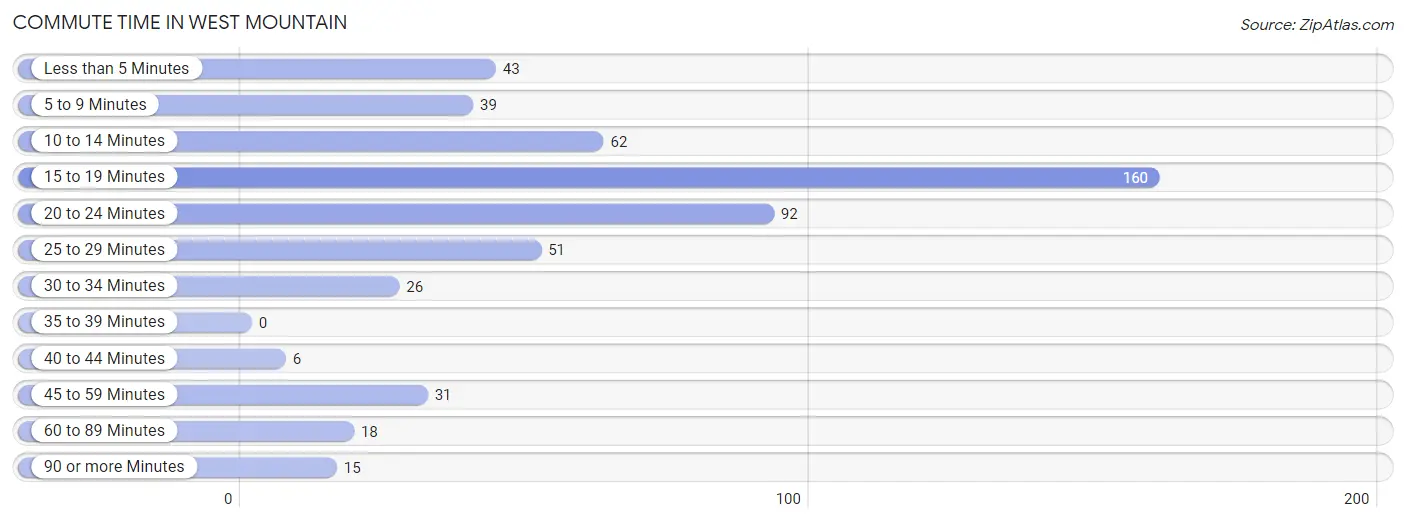
| Commute Time | # Commuters | % Commuters |
| Less than 5 Minutes | 43 | 7.9% |
| 5 to 9 Minutes | 39 | 7.2% |
| 10 to 14 Minutes | 62 | 11.4% |
| 15 to 19 Minutes | 160 | 29.5% |
| 20 to 24 Minutes | 92 | 16.9% |
| 25 to 29 Minutes | 51 | 9.4% |
| 30 to 34 Minutes | 26 | 4.8% |
| 35 to 39 Minutes | 0 | 0.0% |
| 40 to 44 Minutes | 6 | 1.1% |
| 45 to 59 Minutes | 31 | 5.7% |
| 60 to 89 Minutes | 18 | 3.3% |
| 90 or more Minutes | 15 | 2.8% |
Commute Time by Sex in West Mountain
The most common commute times in West Mountain are 20 to 24 minutes (54 commuters, 18.1%) for males and 15 to 19 minutes (121 commuters, 49.4%) for females.
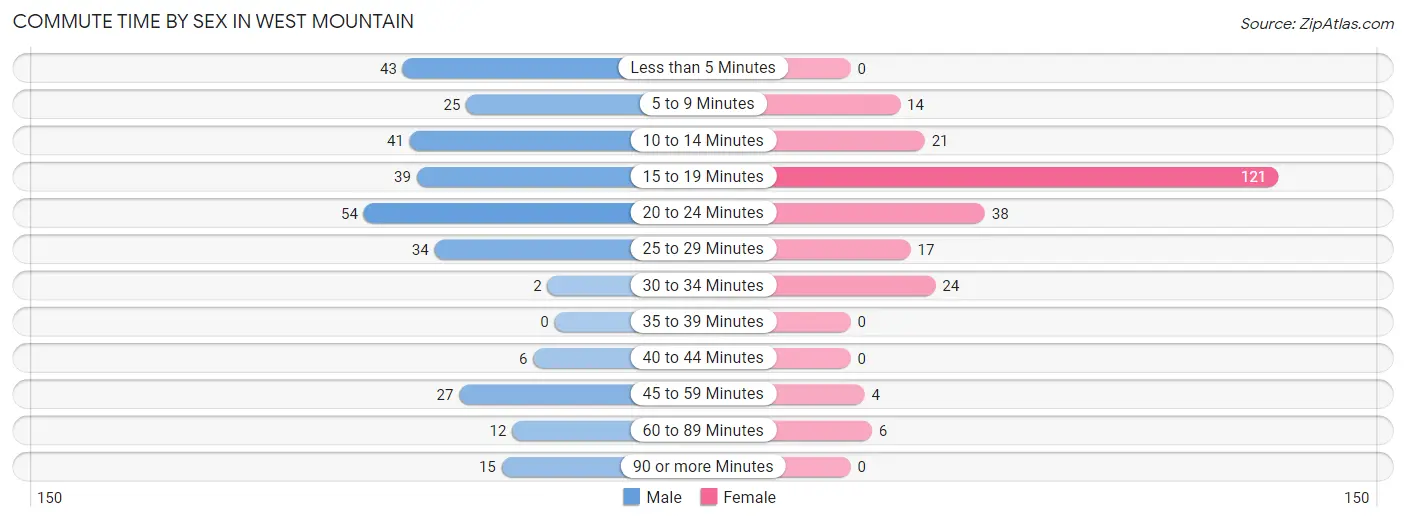
| Commute Time | Male | Female |
| Less than 5 Minutes | 43 (14.4%) | 0 (0.0%) |
| 5 to 9 Minutes | 25 (8.4%) | 14 (5.7%) |
| 10 to 14 Minutes | 41 (13.8%) | 21 (8.6%) |
| 15 to 19 Minutes | 39 (13.1%) | 121 (49.4%) |
| 20 to 24 Minutes | 54 (18.1%) | 38 (15.5%) |
| 25 to 29 Minutes | 34 (11.4%) | 17 (6.9%) |
| 30 to 34 Minutes | 2 (0.7%) | 24 (9.8%) |
| 35 to 39 Minutes | 0 (0.0%) | 0 (0.0%) |
| 40 to 44 Minutes | 6 (2.0%) | 0 (0.0%) |
| 45 to 59 Minutes | 27 (9.1%) | 4 (1.6%) |
| 60 to 89 Minutes | 12 (4.0%) | 6 (2.5%) |
| 90 or more Minutes | 15 (5.0%) | 0 (0.0%) |
Time of Departure to Work by Sex in West Mountain
The most frequent times of departure to work in West Mountain are 6:30 AM to 6:59 AM (65, 21.8%) for males and 6:30 AM to 6:59 AM (63, 25.7%) for females.
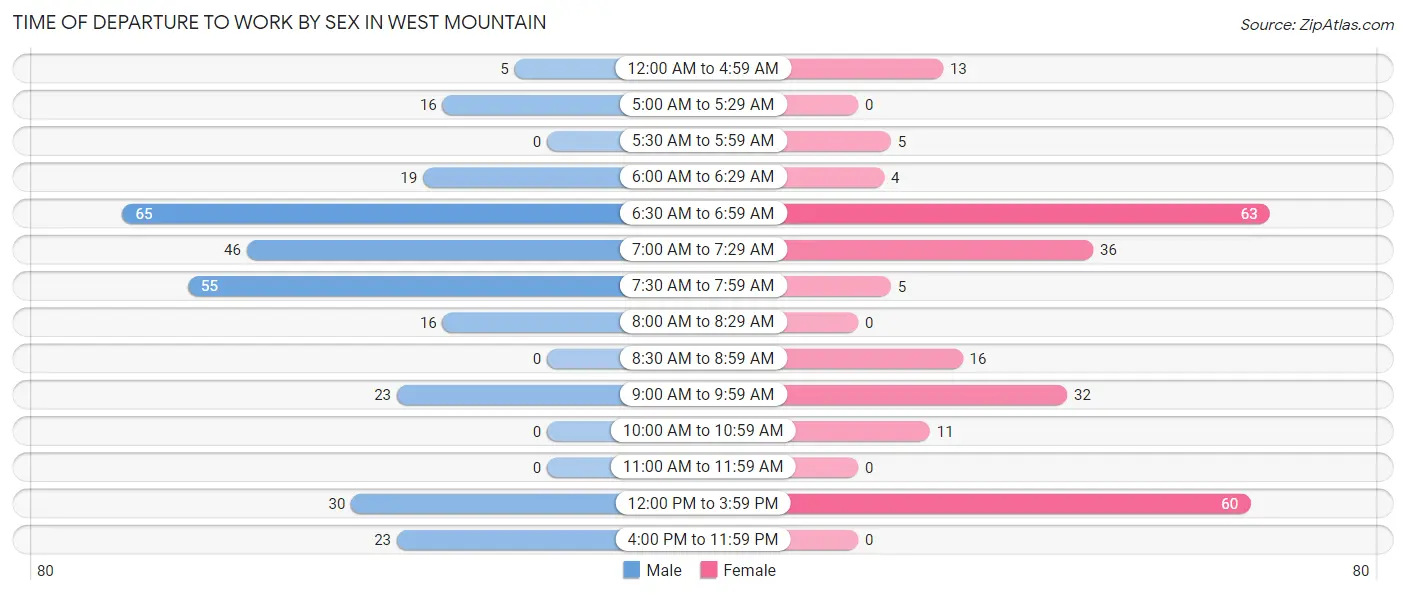
| Time of Departure | Male | Female |
| 12:00 AM to 4:59 AM | 5 (1.7%) | 13 (5.3%) |
| 5:00 AM to 5:29 AM | 16 (5.4%) | 0 (0.0%) |
| 5:30 AM to 5:59 AM | 0 (0.0%) | 5 (2.0%) |
| 6:00 AM to 6:29 AM | 19 (6.4%) | 4 (1.6%) |
| 6:30 AM to 6:59 AM | 65 (21.8%) | 63 (25.7%) |
| 7:00 AM to 7:29 AM | 46 (15.4%) | 36 (14.7%) |
| 7:30 AM to 7:59 AM | 55 (18.5%) | 5 (2.0%) |
| 8:00 AM to 8:29 AM | 16 (5.4%) | 0 (0.0%) |
| 8:30 AM to 8:59 AM | 0 (0.0%) | 16 (6.5%) |
| 9:00 AM to 9:59 AM | 23 (7.7%) | 32 (13.1%) |
| 10:00 AM to 10:59 AM | 0 (0.0%) | 11 (4.5%) |
| 11:00 AM to 11:59 AM | 0 (0.0%) | 0 (0.0%) |
| 12:00 PM to 3:59 PM | 30 (10.1%) | 60 (24.5%) |
| 4:00 PM to 11:59 PM | 23 (7.7%) | 0 (0.0%) |
| Total | 298 (100.0%) | 245 (100.0%) |
Housing Occupancy in West Mountain
Occupancy by Ownership in West Mountain
Of the total 339 dwellings in West Mountain, owner-occupied units account for 296 (87.3%), while renter-occupied units make up 43 (12.7%).
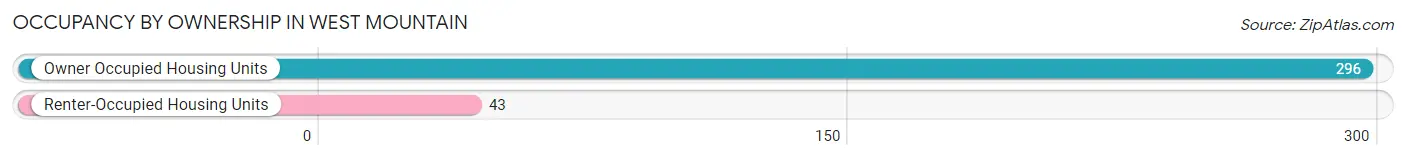
| Occupancy | # Housing Units | % Housing Units |
| Owner Occupied Housing Units | 296 | 87.3% |
| Renter-Occupied Housing Units | 43 | 12.7% |
| Total Occupied Housing Units | 339 | 100.0% |
Occupancy by Household Size in West Mountain
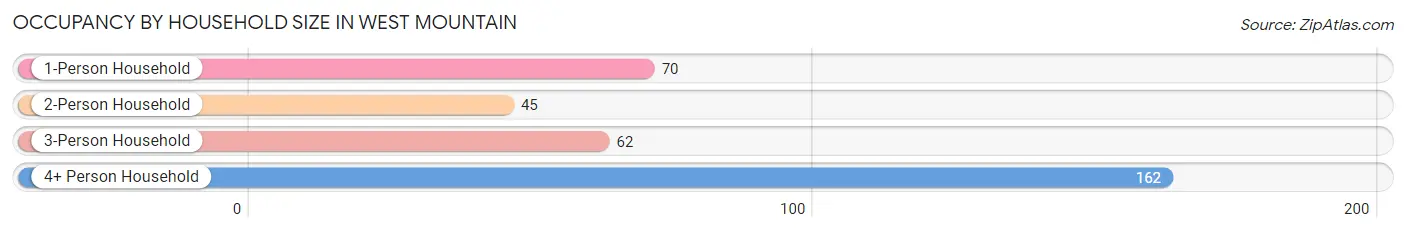
| Household Size | # Housing Units | % Housing Units |
| 1-Person Household | 70 | 20.6% |
| 2-Person Household | 45 | 13.3% |
| 3-Person Household | 62 | 18.3% |
| 4+ Person Household | 162 | 47.8% |
| Total Housing Units | 339 | 100.0% |
Occupancy by Ownership by Household Size in West Mountain
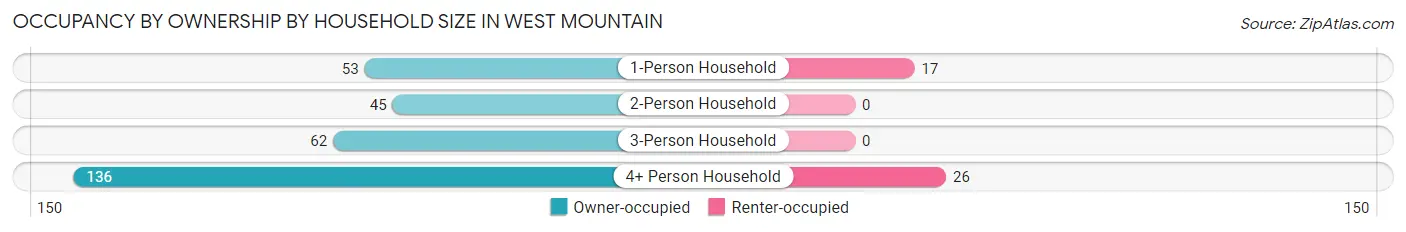
| Household Size | Owner-occupied | Renter-occupied |
| 1-Person Household | 53 (75.7%) | 17 (24.3%) |
| 2-Person Household | 45 (100.0%) | 0 (0.0%) |
| 3-Person Household | 62 (100.0%) | 0 (0.0%) |
| 4+ Person Household | 136 (84.0%) | 26 (16.1%) |
| Total Housing Units | 296 (87.3%) | 43 (12.7%) |
Occupancy by Educational Attainment in West Mountain
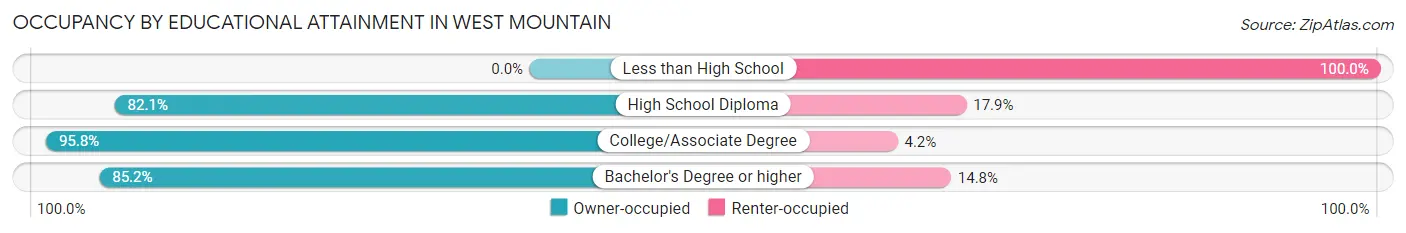
| Household Size | Owner-occupied | Renter-occupied |
| Less than High School | 0 (0.0%) | 9 (100.0%) |
| High School Diploma | 69 (82.1%) | 15 (17.9%) |
| College/Associate Degree | 158 (95.8%) | 7 (4.2%) |
| Bachelor's Degree or higher | 69 (85.2%) | 12 (14.8%) |
Occupancy by Age of Householder in West Mountain
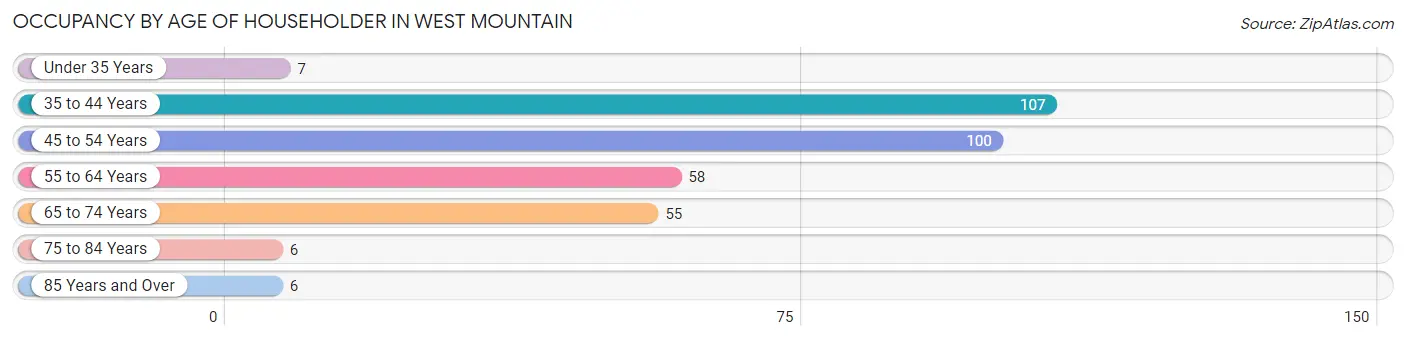
| Age Bracket | # Households | % Households |
| Under 35 Years | 7 | 2.1% |
| 35 to 44 Years | 107 | 31.6% |
| 45 to 54 Years | 100 | 29.5% |
| 55 to 64 Years | 58 | 17.1% |
| 65 to 74 Years | 55 | 16.2% |
| 75 to 84 Years | 6 | 1.8% |
| 85 Years and Over | 6 | 1.8% |
| Total | 339 | 100.0% |
Housing Finances in West Mountain
Median Income by Occupancy in West Mountain
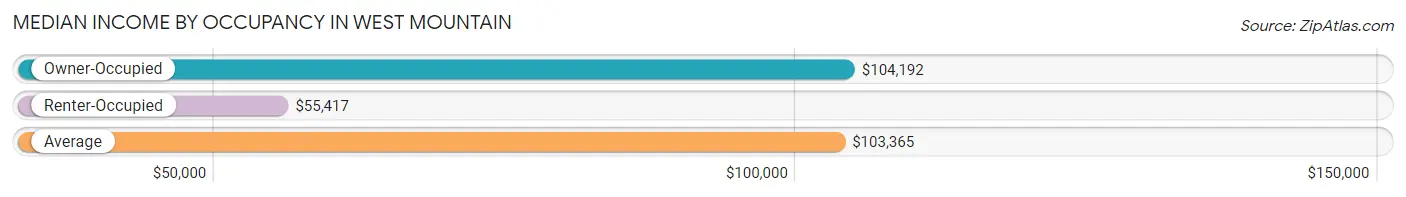
| Occupancy Type | # Households | Median Income |
| Owner-Occupied | 296 (87.3%) | $104,192 |
| Renter-Occupied | 43 (12.7%) | $55,417 |
| Average | 339 (100.0%) | $103,365 |
Occupancy by Householder Income Bracket in West Mountain
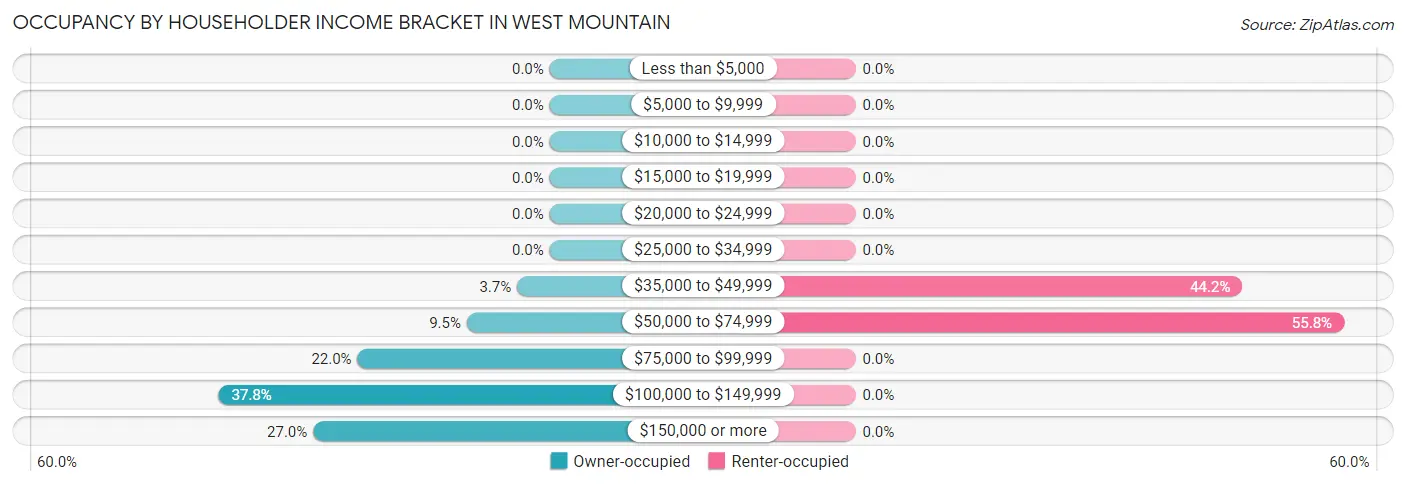
| Income Bracket | Owner-occupied | Renter-occupied |
| Less than $5,000 | 0 (0.0%) | 0 (0.0%) |
| $5,000 to $9,999 | 0 (0.0%) | 0 (0.0%) |
| $10,000 to $14,999 | 0 (0.0%) | 0 (0.0%) |
| $15,000 to $19,999 | 0 (0.0%) | 0 (0.0%) |
| $20,000 to $24,999 | 0 (0.0%) | 0 (0.0%) |
| $25,000 to $34,999 | 0 (0.0%) | 0 (0.0%) |
| $35,000 to $49,999 | 11 (3.7%) | 19 (44.2%) |
| $50,000 to $74,999 | 28 (9.5%) | 24 (55.8%) |
| $75,000 to $99,999 | 65 (22.0%) | 0 (0.0%) |
| $100,000 to $149,999 | 112 (37.8%) | 0 (0.0%) |
| $150,000 or more | 80 (27.0%) | 0 (0.0%) |
| Total | 296 (100.0%) | 43 (100.0%) |
Monthly Housing Cost Tiers in West Mountain
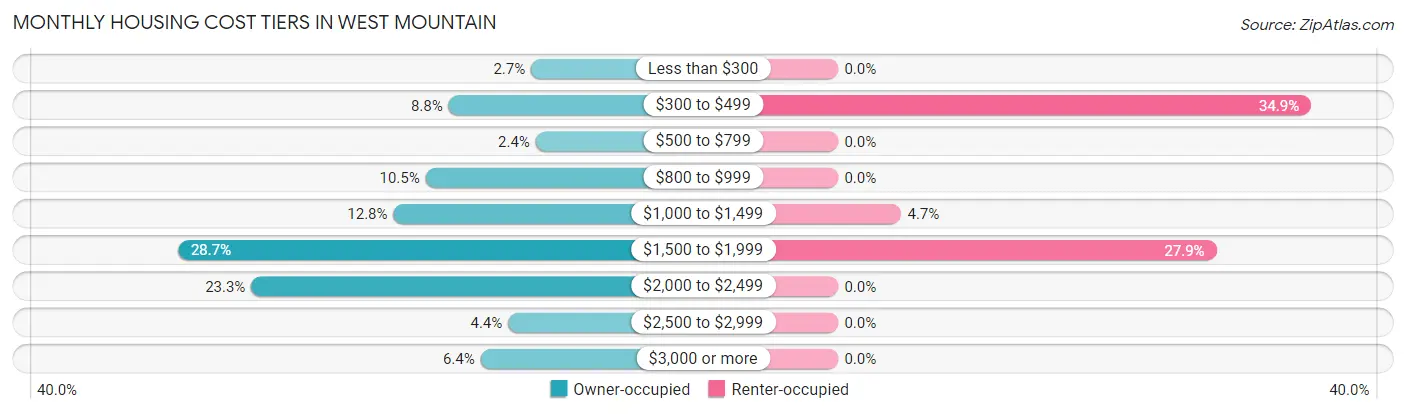
| Monthly Cost | Owner-occupied | Renter-occupied |
| Less than $300 | 8 (2.7%) | 0 (0.0%) |
| $300 to $499 | 26 (8.8%) | 15 (34.9%) |
| $500 to $799 | 7 (2.4%) | 0 (0.0%) |
| $800 to $999 | 31 (10.5%) | 0 (0.0%) |
| $1,000 to $1,499 | 38 (12.8%) | 2 (4.6%) |
| $1,500 to $1,999 | 85 (28.7%) | 12 (27.9%) |
| $2,000 to $2,499 | 69 (23.3%) | 0 (0.0%) |
| $2,500 to $2,999 | 13 (4.4%) | 0 (0.0%) |
| $3,000 or more | 19 (6.4%) | 0 (0.0%) |
| Total | 296 (100.0%) | 43 (100.0%) |
Physical Housing Characteristics in West Mountain
Housing Structures in West Mountain
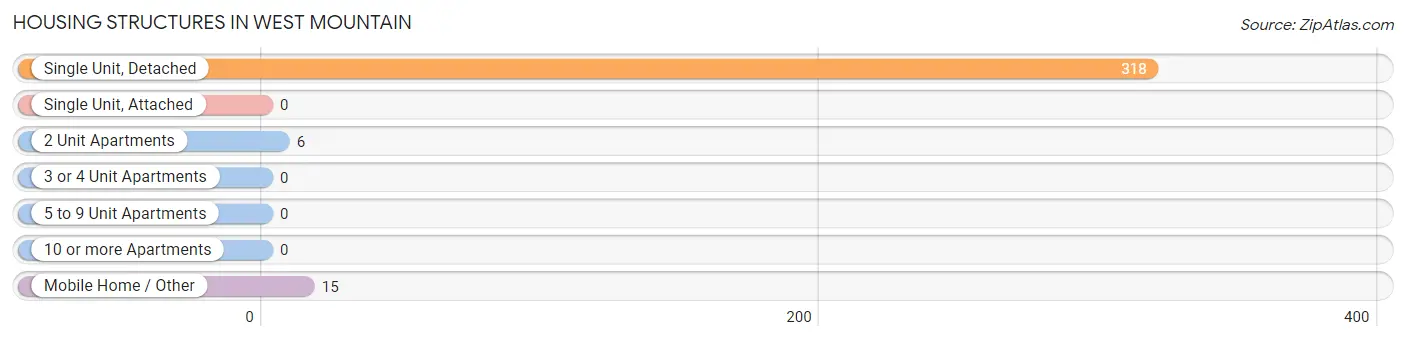
| Structure Type | # Housing Units | % Housing Units |
| Single Unit, Detached | 318 | 93.8% |
| Single Unit, Attached | 0 | 0.0% |
| 2 Unit Apartments | 6 | 1.8% |
| 3 or 4 Unit Apartments | 0 | 0.0% |
| 5 to 9 Unit Apartments | 0 | 0.0% |
| 10 or more Apartments | 0 | 0.0% |
| Mobile Home / Other | 15 | 4.4% |
| Total | 339 | 100.0% |
Housing Structures by Occupancy in West Mountain
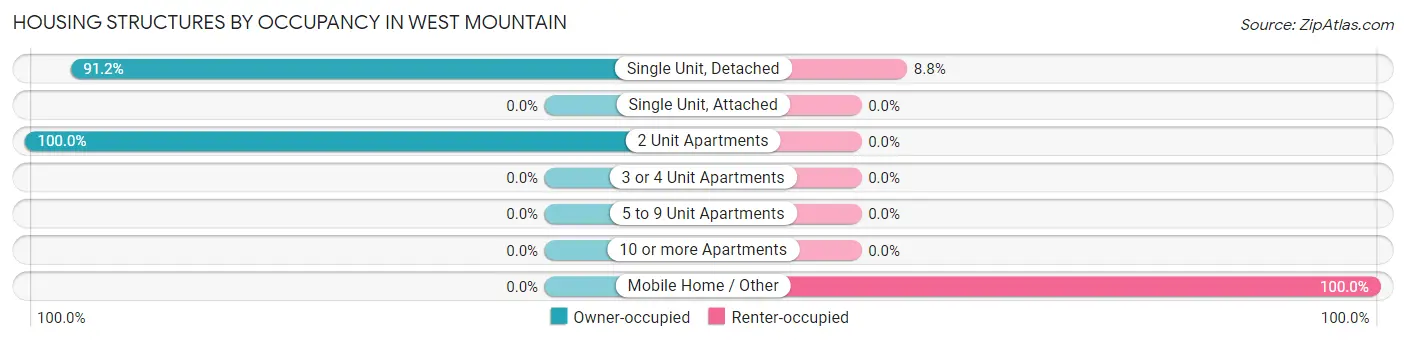
| Structure Type | Owner-occupied | Renter-occupied |
| Single Unit, Detached | 290 (91.2%) | 28 (8.8%) |
| Single Unit, Attached | 0 (0.0%) | 0 (0.0%) |
| 2 Unit Apartments | 6 (100.0%) | 0 (0.0%) |
| 3 or 4 Unit Apartments | 0 (0.0%) | 0 (0.0%) |
| 5 to 9 Unit Apartments | 0 (0.0%) | 0 (0.0%) |
| 10 or more Apartments | 0 (0.0%) | 0 (0.0%) |
| Mobile Home / Other | 0 (0.0%) | 15 (100.0%) |
| Total | 296 (87.3%) | 43 (12.7%) |
Housing Structures by Number of Rooms in West Mountain
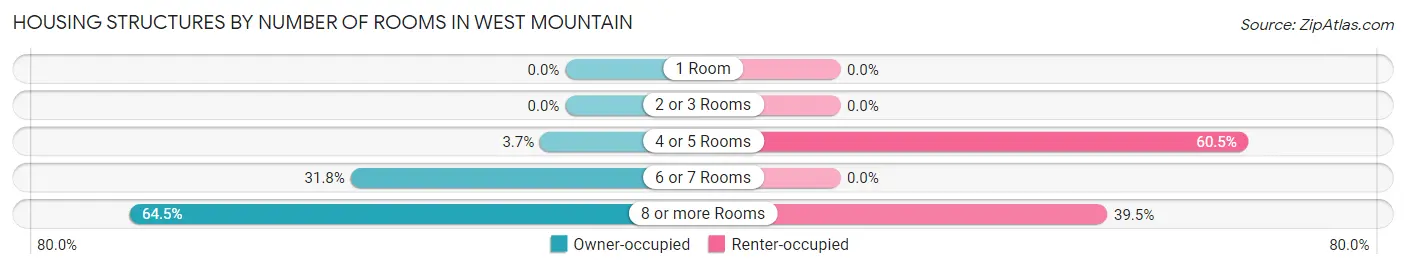
| Number of Rooms | Owner-occupied | Renter-occupied |
| 1 Room | 0 (0.0%) | 0 (0.0%) |
| 2 or 3 Rooms | 0 (0.0%) | 0 (0.0%) |
| 4 or 5 Rooms | 11 (3.7%) | 26 (60.5%) |
| 6 or 7 Rooms | 94 (31.8%) | 0 (0.0%) |
| 8 or more Rooms | 191 (64.5%) | 17 (39.5%) |
| Total | 296 (100.0%) | 43 (100.0%) |
Housing Structure by Heating Type in West Mountain
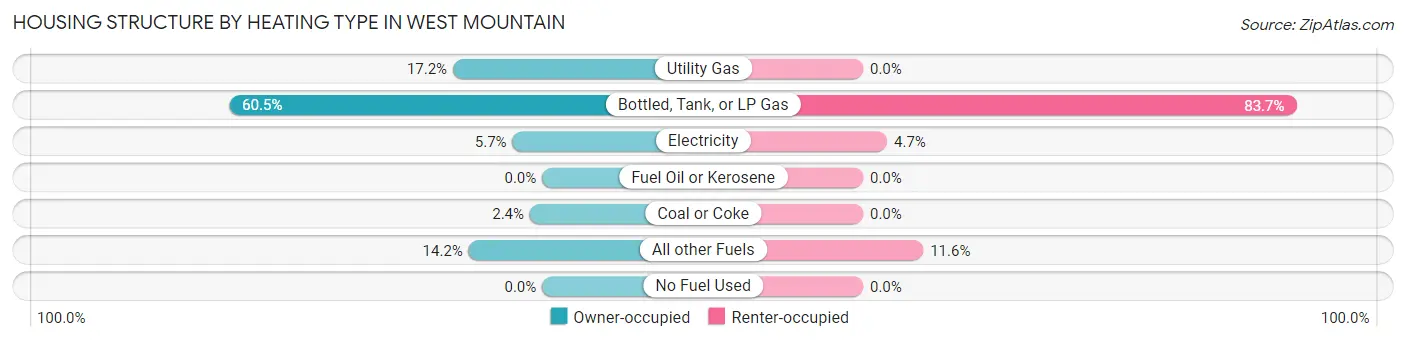
| Heating Type | Owner-occupied | Renter-occupied |
| Utility Gas | 51 (17.2%) | 0 (0.0%) |
| Bottled, Tank, or LP Gas | 179 (60.5%) | 36 (83.7%) |
| Electricity | 17 (5.7%) | 2 (4.6%) |
| Fuel Oil or Kerosene | 0 (0.0%) | 0 (0.0%) |
| Coal or Coke | 7 (2.4%) | 0 (0.0%) |
| All other Fuels | 42 (14.2%) | 5 (11.6%) |
| No Fuel Used | 0 (0.0%) | 0 (0.0%) |
| Total | 296 (100.0%) | 43 (100.0%) |
Household Vehicle Usage in West Mountain
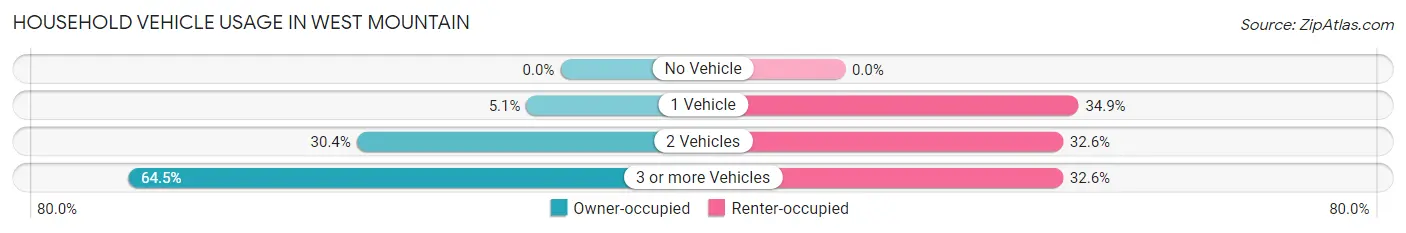
| Vehicles per Household | Owner-occupied | Renter-occupied |
| No Vehicle | 0 (0.0%) | 0 (0.0%) |
| 1 Vehicle | 15 (5.1%) | 15 (34.9%) |
| 2 Vehicles | 90 (30.4%) | 14 (32.6%) |
| 3 or more Vehicles | 191 (64.5%) | 14 (32.6%) |
| Total | 296 (100.0%) | 43 (100.0%) |
Real Estate & Mortgages in West Mountain
Real Estate and Mortgage Overview in West Mountain
| Characteristic | Without Mortgage | With Mortgage |
| Housing Units | 77 | 219 |
| Median Property Value | $803,600 | $517,600 |
| Median Household Income | $112,344 | $68 |
| Monthly Housing Costs | $664 | $19 |
| Real Estate Taxes | $2,431 | $0 |
Property Value by Mortgage Status in West Mountain
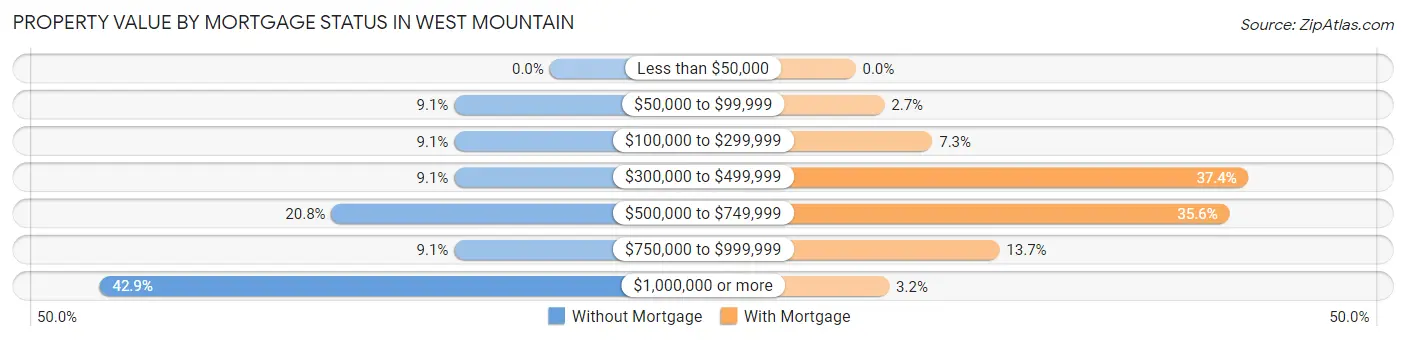
| Property Value | Without Mortgage | With Mortgage |
| Less than $50,000 | 0 (0.0%) | 0 (0.0%) |
| $50,000 to $99,999 | 7 (9.1%) | 6 (2.7%) |
| $100,000 to $299,999 | 7 (9.1%) | 16 (7.3%) |
| $300,000 to $499,999 | 7 (9.1%) | 82 (37.4%) |
| $500,000 to $749,999 | 16 (20.8%) | 78 (35.6%) |
| $750,000 to $999,999 | 7 (9.1%) | 30 (13.7%) |
| $1,000,000 or more | 33 (42.9%) | 7 (3.2%) |
| Total | 77 (100.0%) | 219 (100.0%) |
Household Income by Mortgage Status in West Mountain
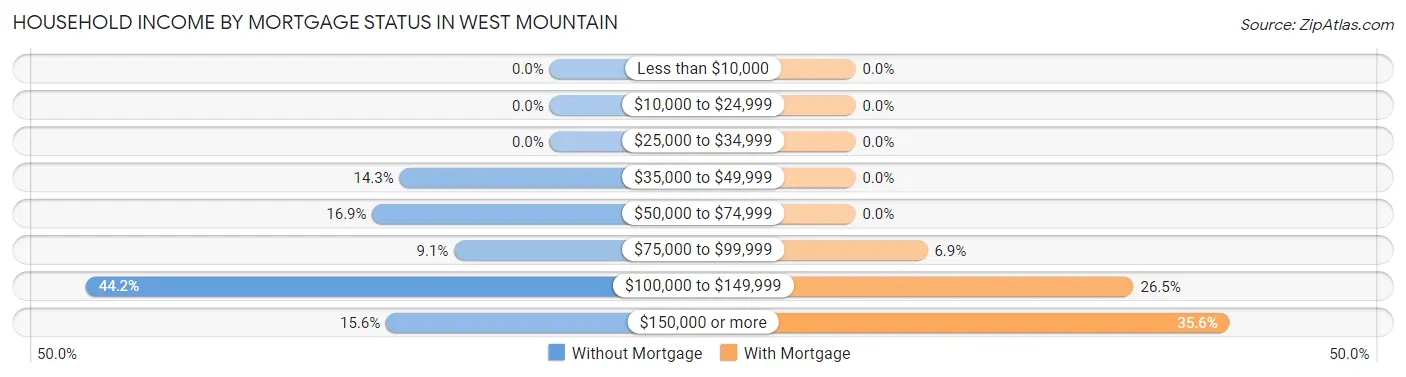
| Household Income | Without Mortgage | With Mortgage |
| Less than $10,000 | 0 (0.0%) | 0 (0.0%) |
| $10,000 to $24,999 | 0 (0.0%) | 0 (0.0%) |
| $25,000 to $34,999 | 0 (0.0%) | 0 (0.0%) |
| $35,000 to $49,999 | 11 (14.3%) | 0 (0.0%) |
| $50,000 to $74,999 | 13 (16.9%) | 0 (0.0%) |
| $75,000 to $99,999 | 7 (9.1%) | 15 (6.9%) |
| $100,000 to $149,999 | 34 (44.2%) | 58 (26.5%) |
| $150,000 or more | 12 (15.6%) | 78 (35.6%) |
| Total | 77 (100.0%) | 219 (100.0%) |
Property Value to Household Income Ratio in West Mountain
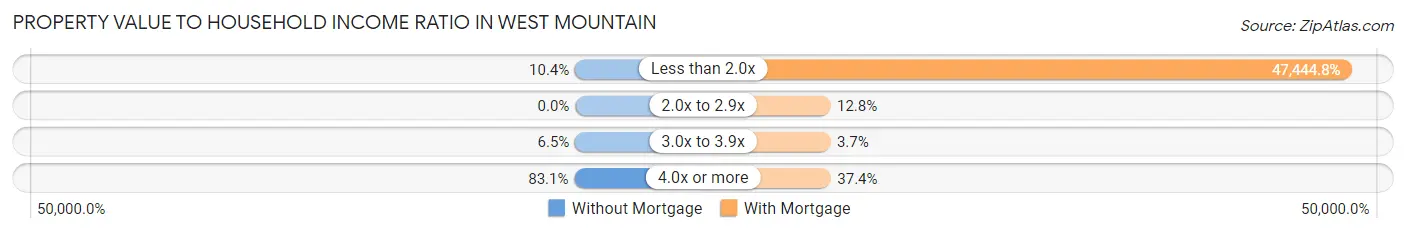
| Value-to-Income Ratio | Without Mortgage | With Mortgage |
| Less than 2.0x | 8 (10.4%) | 103,904 (47,444.7%) |
| 2.0x to 2.9x | 0 (0.0%) | 28 (12.8%) |
| 3.0x to 3.9x | 5 (6.5%) | 8 (3.6%) |
| 4.0x or more | 64 (83.1%) | 82 (37.4%) |
| Total | 77 (100.0%) | 219 (100.0%) |
Real Estate Taxes by Mortgage Status in West Mountain
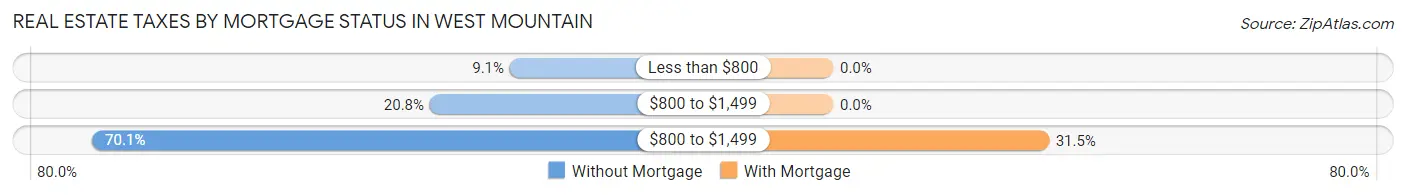
| Property Taxes | Without Mortgage | With Mortgage |
| Less than $800 | 7 (9.1%) | 0 (0.0%) |
| $800 to $1,499 | 16 (20.8%) | 0 (0.0%) |
| $800 to $1,499 | 54 (70.1%) | 69 (31.5%) |
| Total | 77 (100.0%) | 219 (100.0%) |
Health & Disability in West Mountain
Health Insurance Coverage by Age in West Mountain
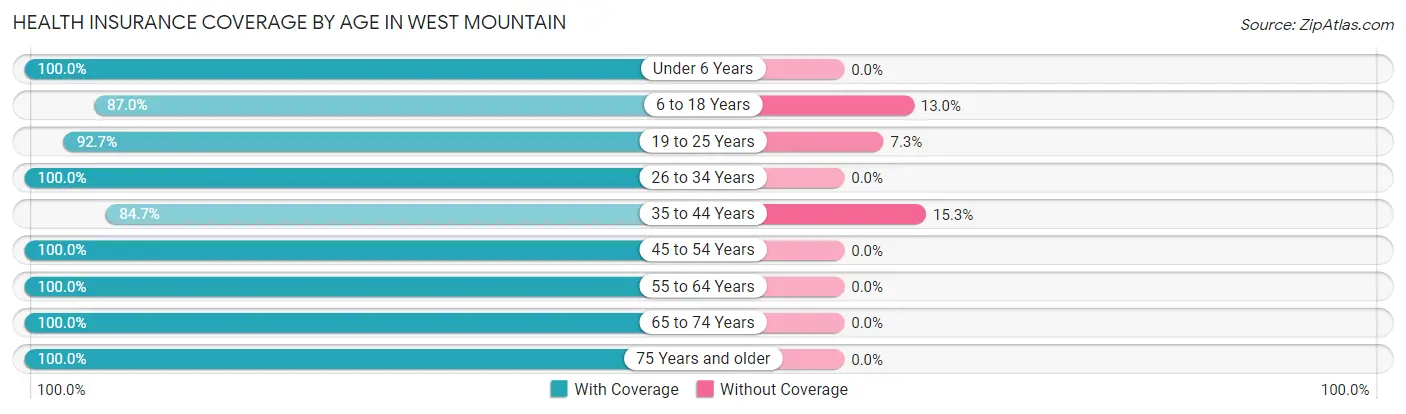
| Age Bracket | With Coverage | Without Coverage |
| Under 6 Years | 54 (100.0%) | 0 (0.0%) |
| 6 to 18 Years | 376 (87.0%) | 56 (13.0%) |
| 19 to 25 Years | 76 (92.7%) | 6 (7.3%) |
| 26 to 34 Years | 47 (100.0%) | 0 (0.0%) |
| 35 to 44 Years | 211 (84.7%) | 38 (15.3%) |
| 45 to 54 Years | 167 (100.0%) | 0 (0.0%) |
| 55 to 64 Years | 128 (100.0%) | 0 (0.0%) |
| 65 to 74 Years | 83 (100.0%) | 0 (0.0%) |
| 75 Years and older | 25 (100.0%) | 0 (0.0%) |
| Total | 1,167 (92.1%) | 100 (7.9%) |
Health Insurance Coverage by Citizenship Status in West Mountain
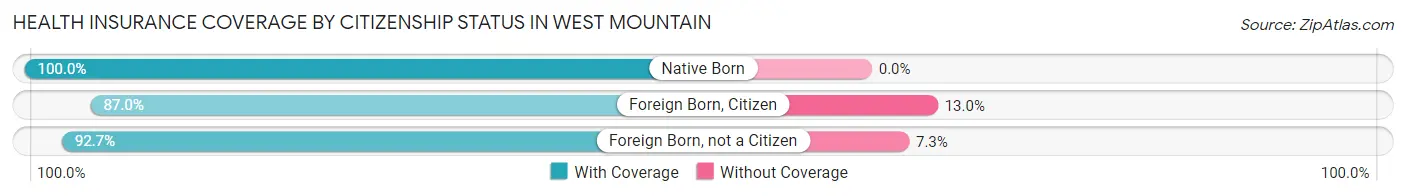
| Citizenship Status | With Coverage | Without Coverage |
| Native Born | 54 (100.0%) | 0 (0.0%) |
| Foreign Born, Citizen | 376 (87.0%) | 56 (13.0%) |
| Foreign Born, not a Citizen | 76 (92.7%) | 6 (7.3%) |
Health Insurance Coverage by Household Income in West Mountain
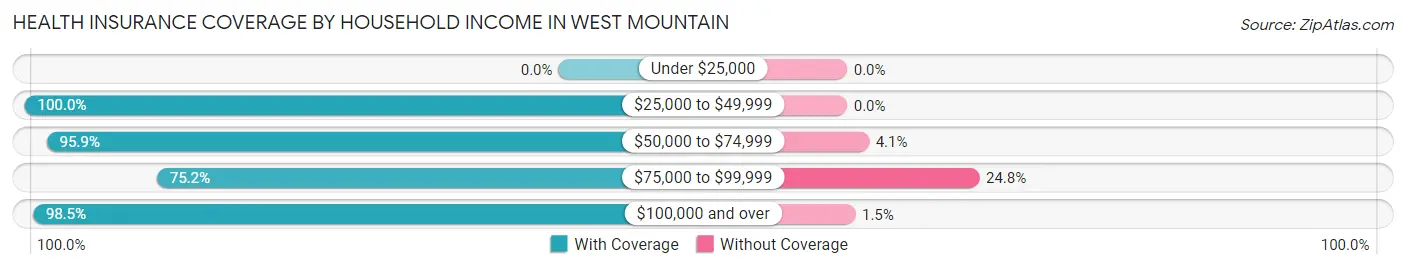
| Household Income | With Coverage | Without Coverage |
| Under $25,000 | 0 (0.0%) | 0 (0.0%) |
| $25,000 to $49,999 | 133 (100.0%) | 0 (0.0%) |
| $50,000 to $74,999 | 140 (95.9%) | 6 (4.1%) |
| $75,000 to $99,999 | 255 (75.2%) | 84 (24.8%) |
| $100,000 and over | 639 (98.5%) | 10 (1.5%) |
Public vs Private Health Insurance Coverage by Age in West Mountain
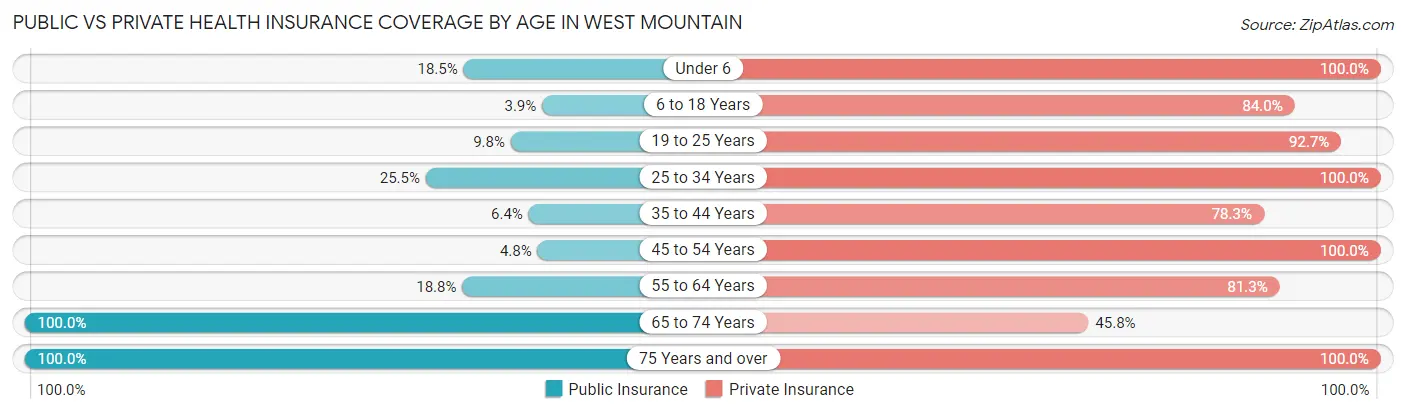
| Age Bracket | Public Insurance | Private Insurance |
| Under 6 | 10 (18.5%) | 54 (100.0%) |
| 6 to 18 Years | 17 (3.9%) | 363 (84.0%) |
| 19 to 25 Years | 8 (9.8%) | 76 (92.7%) |
| 25 to 34 Years | 12 (25.5%) | 47 (100.0%) |
| 35 to 44 Years | 16 (6.4%) | 195 (78.3%) |
| 45 to 54 Years | 8 (4.8%) | 167 (100.0%) |
| 55 to 64 Years | 24 (18.8%) | 104 (81.2%) |
| 65 to 74 Years | 83 (100.0%) | 38 (45.8%) |
| 75 Years and over | 25 (100.0%) | 25 (100.0%) |
| Total | 203 (16.0%) | 1,069 (84.4%) |
Disability Status by Sex by Age in West Mountain
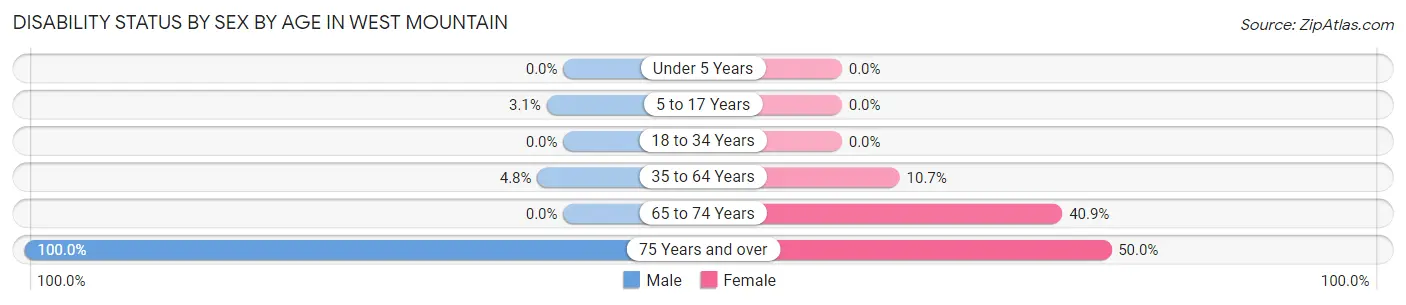
| Age Bracket | Male | Female |
| Under 5 Years | 0 (0.0%) | 0 (0.0%) |
| 5 to 17 Years | 7 (3.1%) | 0 (0.0%) |
| 18 to 34 Years | 0 (0.0%) | 0 (0.0%) |
| 35 to 64 Years | 15 (4.8%) | 25 (10.7%) |
| 65 to 74 Years | 0 (0.0%) | 18 (40.9%) |
| 75 Years and over | 13 (100.0%) | 6 (50.0%) |
Disability Class by Sex by Age in West Mountain
Disability Class: Hearing Difficulty
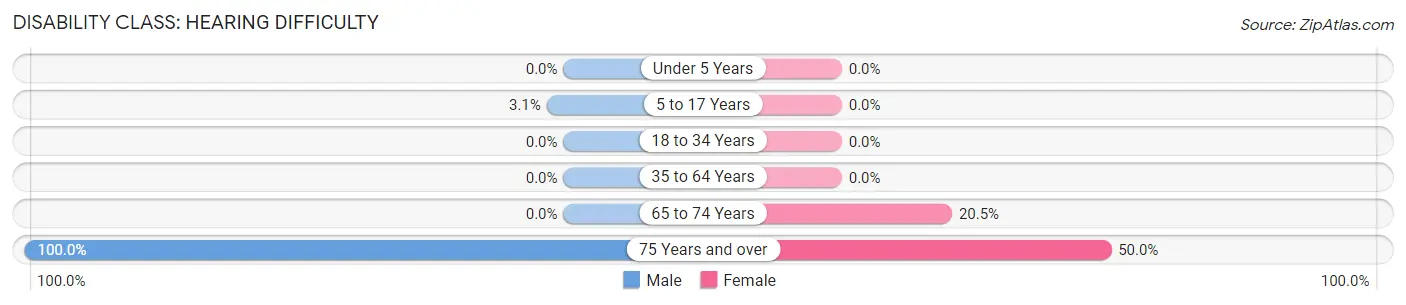
| Age Bracket | Male | Female |
| Under 5 Years | 0 (0.0%) | 0 (0.0%) |
| 5 to 17 Years | 7 (3.1%) | 0 (0.0%) |
| 18 to 34 Years | 0 (0.0%) | 0 (0.0%) |
| 35 to 64 Years | 0 (0.0%) | 0 (0.0%) |
| 65 to 74 Years | 0 (0.0%) | 9 (20.4%) |
| 75 Years and over | 13 (100.0%) | 6 (50.0%) |
Disability Class: Vision Difficulty
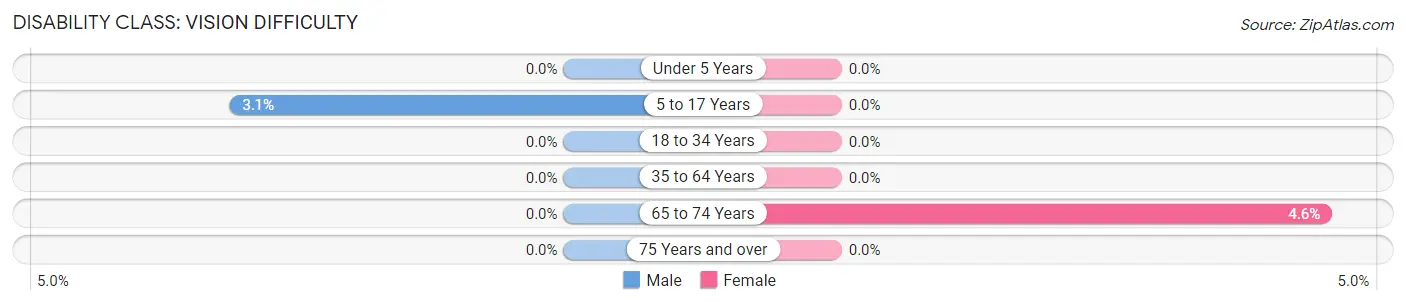
| Age Bracket | Male | Female |
| Under 5 Years | 0 (0.0%) | 0 (0.0%) |
| 5 to 17 Years | 7 (3.1%) | 0 (0.0%) |
| 18 to 34 Years | 0 (0.0%) | 0 (0.0%) |
| 35 to 64 Years | 0 (0.0%) | 0 (0.0%) |
| 65 to 74 Years | 0 (0.0%) | 2 (4.5%) |
| 75 Years and over | 0 (0.0%) | 0 (0.0%) |
Disability Class: Cognitive Difficulty
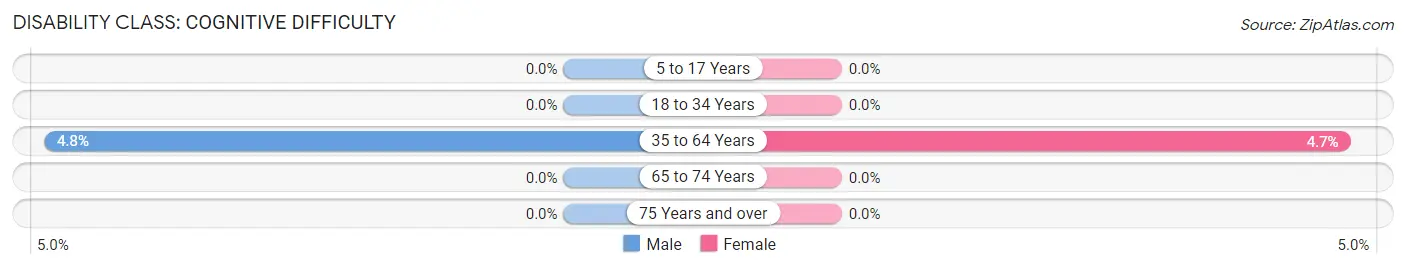
| Age Bracket | Male | Female |
| 5 to 17 Years | 0 (0.0%) | 0 (0.0%) |
| 18 to 34 Years | 0 (0.0%) | 0 (0.0%) |
| 35 to 64 Years | 15 (4.8%) | 11 (4.7%) |
| 65 to 74 Years | 0 (0.0%) | 0 (0.0%) |
| 75 Years and over | 0 (0.0%) | 0 (0.0%) |
Disability Class: Ambulatory Difficulty
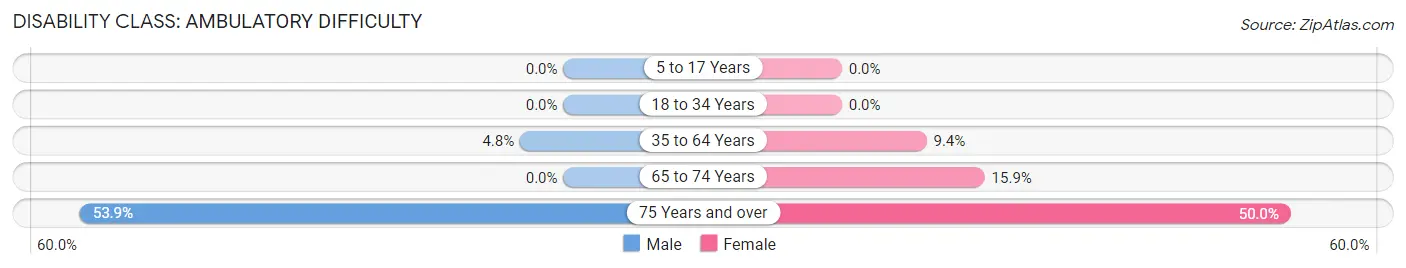
| Age Bracket | Male | Female |
| 5 to 17 Years | 0 (0.0%) | 0 (0.0%) |
| 18 to 34 Years | 0 (0.0%) | 0 (0.0%) |
| 35 to 64 Years | 15 (4.8%) | 22 (9.4%) |
| 65 to 74 Years | 0 (0.0%) | 7 (15.9%) |
| 75 Years and over | 7 (53.8%) | 6 (50.0%) |
Disability Class: Self-Care Difficulty
| Age Bracket | Male | Female |
| 5 to 17 Years | 0 (0.0%) | 0 (0.0%) |
| 18 to 34 Years | 0 (0.0%) | 0 (0.0%) |
| 35 to 64 Years | 0 (0.0%) | 0 (0.0%) |
| 65 to 74 Years | 0 (0.0%) | 0 (0.0%) |
| 75 Years and over | 0 (0.0%) | 0 (0.0%) |
Technology Access in West Mountain
Computing Device Access in West Mountain
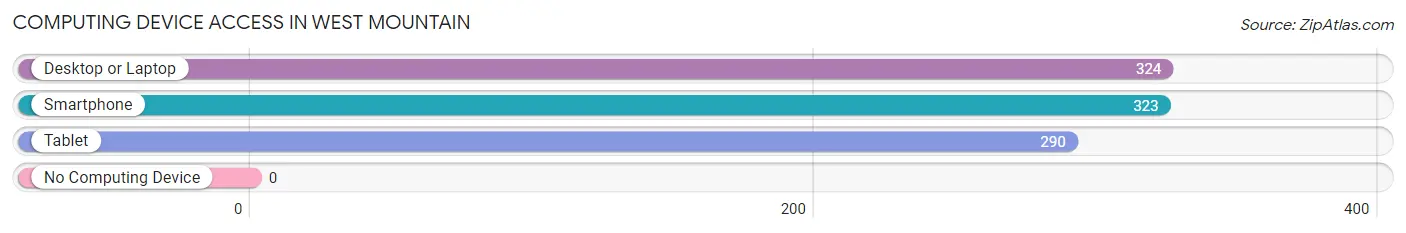
| Device Type | # Households | % Households |
| Desktop or Laptop | 324 | 95.6% |
| Smartphone | 323 | 95.3% |
| Tablet | 290 | 85.6% |
| No Computing Device | 0 | 0.0% |
| Total | 339 | 100.0% |
Internet Access in West Mountain
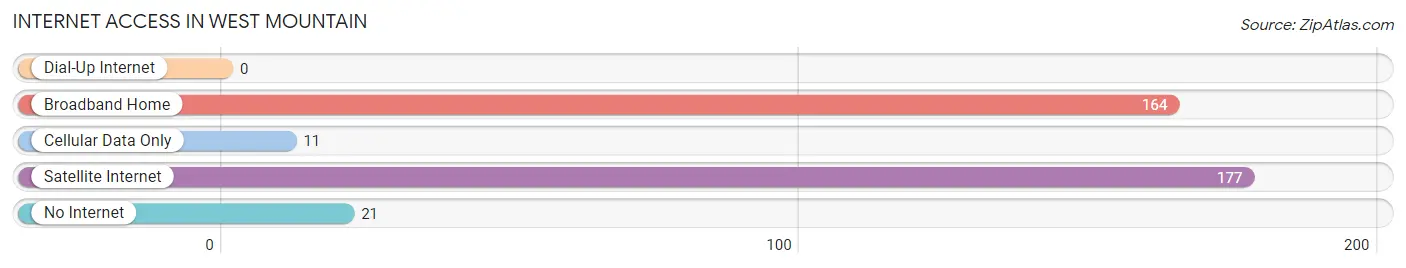
| Internet Type | # Households | % Households |
| Dial-Up Internet | 0 | 0.0% |
| Broadband Home | 164 | 48.4% |
| Cellular Data Only | 11 | 3.2% |
| Satellite Internet | 177 | 52.2% |
| No Internet | 21 | 6.2% |
| Total | 339 | 100.0% |
West Mountain Summary
West Mountain is a small unincorporated community located in the southeastern corner of Utah, United States. It is situated in the foothills of the Wasatch Mountains, approximately 20 miles south of Salt Lake City. The community is located in the Wasatch County, and is part of the Provo-Orem Metropolitan Statistical Area.
History
West Mountain was first settled in the late 1800s by Mormon pioneers. The area was originally known as “West Mountain Settlement” and was home to a number of small farms and ranches. The settlement was later renamed West Mountain in the early 1900s.
In the early 1900s, the area was home to a number of small businesses, including a general store, a blacksmith shop, and a post office. The post office was established in 1906 and operated until it was closed in the late 1950s.
In the late 1950s, the area began to experience rapid growth due to the development of the nearby ski resorts. The area was also home to a number of summer camps, which attracted visitors from all over the country.
Geography
West Mountain is located in the southeastern corner of Utah, approximately 20 miles south of Salt Lake City. The community is situated in the foothills of the Wasatch Mountains, at an elevation of 5,400 feet.
The area is characterized by rolling hills and valleys, with a number of small streams and creeks running through the area. The climate is semi-arid, with hot summers and cold winters.
Economy
The economy of West Mountain is largely based on tourism. The area is home to a number of ski resorts, which attract visitors from all over the country. The area is also home to a number of summer camps, which attract visitors from all over the country.
In addition to tourism, the area is also home to a number of small businesses, including restaurants, retail stores, and service providers. The area is also home to a number of small farms and ranches, which produce a variety of crops and livestock.
Demographics
As of the 2010 census, the population of West Mountain was 1,845. The population is largely white (94.3%), with a small percentage of Hispanic (2.2%) and Native American (1.2%) residents. The median household income is $50,000, and the median age is 37.
Conclusion
West Mountain is a small unincorporated community located in the southeastern corner of Utah, United States. It is situated in the foothills of the Wasatch Mountains, approximately 20 miles south of Salt Lake City. The community is home to a number of ski resorts and summer camps, which attract visitors from all over the country. The economy of West Mountain is largely based on tourism, with a number of small businesses and farms also operating in the area. The population of West Mountain is largely white, with a small percentage of Hispanic and Native American residents.
Common Questions
What is Per Capita Income in West Mountain?
Per Capita income in West Mountain is $29,663.
What is the Median Family Income in West Mountain?
Median Family Income in West Mountain is $103,438.
What is the Median Household income in West Mountain?
Median Household Income in West Mountain is $103,365.
What is Inequality or Gini Index in West Mountain?
Inequality or Gini Index in West Mountain is 0.25.
What is the Total Population of West Mountain?
Total Population of West Mountain is 1,267.
What is the Total Male Population of West Mountain?
Total Male Population of West Mountain is 653.
What is the Total Female Population of West Mountain?
Total Female Population of West Mountain is 614.
What is the Ratio of Males per 100 Females in West Mountain?
There are 106.35 Males per 100 Females in West Mountain.
What is the Ratio of Females per 100 Males in West Mountain?
There are 94.03 Females per 100 Males in West Mountain.
What is the Median Population Age in West Mountain?
Median Population Age in West Mountain is 35.3 Years.
What is the Average Family Size in West Mountain
Average Family Size in West Mountain is 4.4 People.
What is the Average Household Size in West Mountain
Average Household Size in West Mountain is 3.7 People.
How Large is the Labor Force in West Mountain?
There are 679 People in the Labor Forcein in West Mountain.
What is the Percentage of People in the Labor Force in West Mountain?
74.6% of People are in the Labor Force in West Mountain.
What is the Unemployment Rate in West Mountain?
Unemployment Rate in West Mountain is 4.9%.