Tooele, UT Map & Demographics
Tooele Map
Tooele Overview
$30,710
PER CAPITA INCOME
$91,706
AVG FAMILY INCOME
$84,225
AVG HOUSEHOLD INCOME
49.7%
WAGE / INCOME GAP [ % ]
50.3¢/ $1
WAGE / INCOME GAP [ $ ]
0.34
INEQUALITY / GINI INDEX
36,315
TOTAL POPULATION
18,619
MALE POPULATION
17,696
FEMALE POPULATION
105.22
MALES / 100 FEMALES
95.04
FEMALES / 100 MALES
32.0
MEDIAN AGE
3.6
AVG FAMILY SIZE
3.1
AVG HOUSEHOLD SIZE
18,913
LABOR FORCE [ PEOPLE ]
71.2%
PERCENT IN LABOR FORCE
3.9%
UNEMPLOYMENT RATE
Tooele Zip Codes
Tooele Area Codes
Income in Tooele
Income Overview in Tooele
Per Capita Income in Tooele is $30,710, while median incomes of families and households are $91,706 and $84,225 respectively.
| Characteristic | Number | Measure |
| Per Capita Income | 36,315 | $30,710 |
| Median Family Income | 8,808 | $91,706 |
| Mean Family Income | 8,808 | $101,574 |
| Median Household Income | 11,673 | $84,225 |
| Mean Household Income | 11,673 | $93,082 |
| Income Deficit | 8,808 | $0 |
| Wage / Income Gap (%) | 36,315 | 49.69% |
| Wage / Income Gap ($) | 36,315 | 50.31¢ per $1 |
| Gini / Inequality Index | 36,315 | 0.34 |
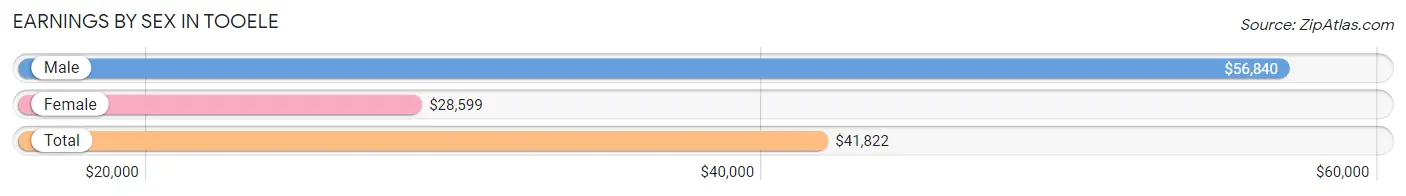
Earnings by Sex in Tooele
Average Earnings in Tooele are $41,822, $56,840 for men and $28,599 for women, a difference of 49.7%.
| Sex | Number | Average Earnings |
| Male | 11,001 (56.8%) | $56,840 |
| Female | 8,358 (43.2%) | $28,599 |
| Total | 19,359 (100.0%) | $41,822 |
Earnings by Sex by Income Bracket in Tooele
The most common earnings brackets in Tooele are $75,000 to $99,999 for men (1,731 | 15.7%) and $25,000 to $29,999 for women (849 | 10.2%).
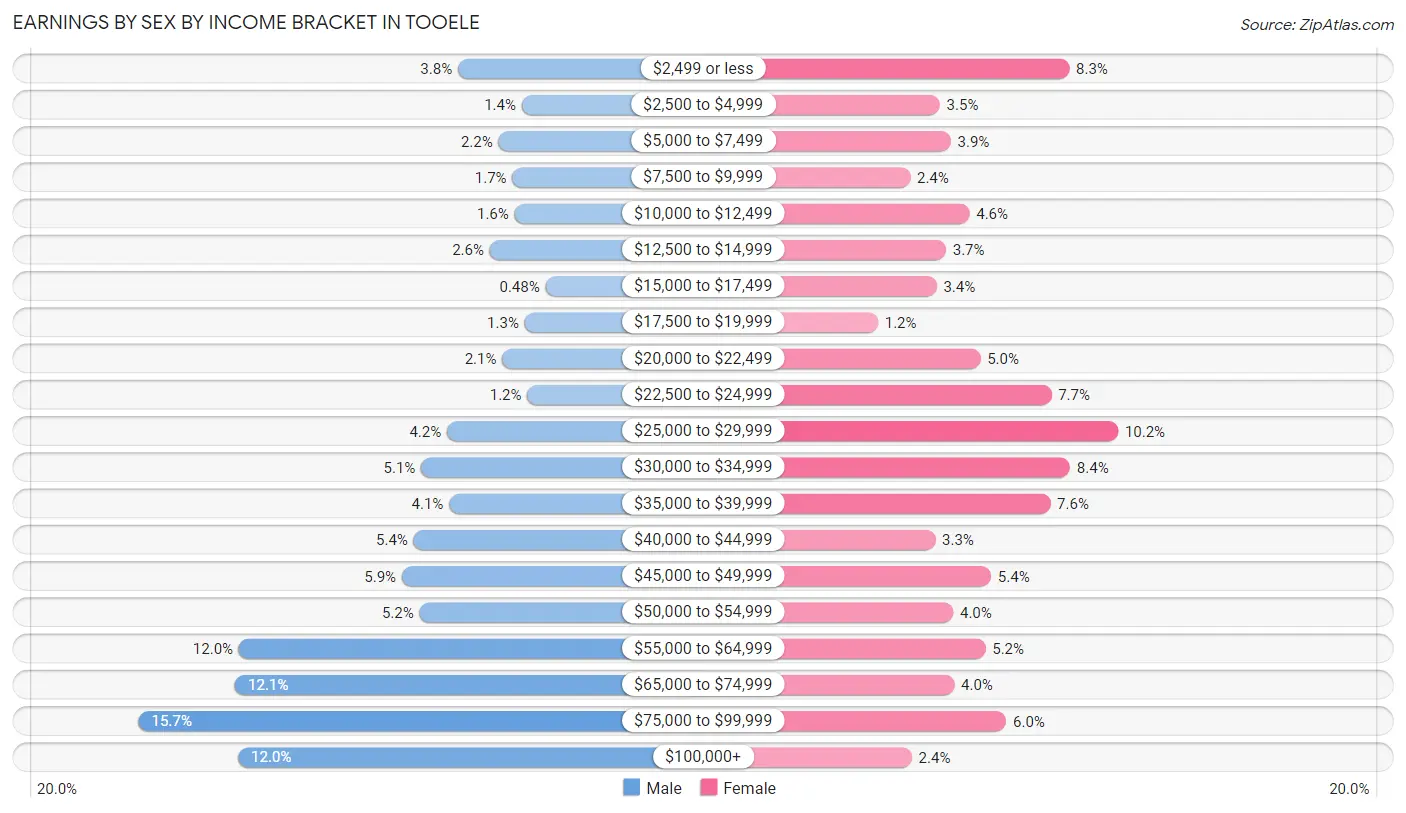
| Income | Male | Female |
| $2,499 or less | 414 (3.8%) | 696 (8.3%) |
| $2,500 to $4,999 | 151 (1.4%) | 291 (3.5%) |
| $5,000 to $7,499 | 246 (2.2%) | 325 (3.9%) |
| $7,500 to $9,999 | 189 (1.7%) | 198 (2.4%) |
| $10,000 to $12,499 | 180 (1.6%) | 384 (4.6%) |
| $12,500 to $14,999 | 283 (2.6%) | 310 (3.7%) |
| $15,000 to $17,499 | 53 (0.5%) | 281 (3.4%) |
| $17,500 to $19,999 | 139 (1.3%) | 97 (1.2%) |
| $20,000 to $22,499 | 231 (2.1%) | 418 (5.0%) |
| $22,500 to $24,999 | 128 (1.2%) | 640 (7.7%) |
| $25,000 to $29,999 | 459 (4.2%) | 849 (10.2%) |
| $30,000 to $34,999 | 565 (5.1%) | 699 (8.4%) |
| $35,000 to $39,999 | 450 (4.1%) | 637 (7.6%) |
| $40,000 to $44,999 | 596 (5.4%) | 277 (3.3%) |
| $45,000 to $49,999 | 645 (5.9%) | 451 (5.4%) |
| $50,000 to $54,999 | 572 (5.2%) | 333 (4.0%) |
| $55,000 to $64,999 | 1,317 (12.0%) | 434 (5.2%) |
| $65,000 to $74,999 | 1,332 (12.1%) | 336 (4.0%) |
| $75,000 to $99,999 | 1,731 (15.7%) | 499 (6.0%) |
| $100,000+ | 1,320 (12.0%) | 203 (2.4%) |
| Total | 11,001 (100.0%) | 8,358 (100.0%) |
Earnings by Sex by Educational Attainment in Tooele
Average earnings in Tooele are $64,373 for men and $33,486 for women, a difference of 48.0%. Men with an educational attainment of graduate degree enjoy the highest average annual earnings of $95,345, while those with less than high school education earn the least with $51,982. Women with an educational attainment of graduate degree earn the most with the average annual earnings of $52,125, while those with less than high school education have the smallest earnings of $24,149.
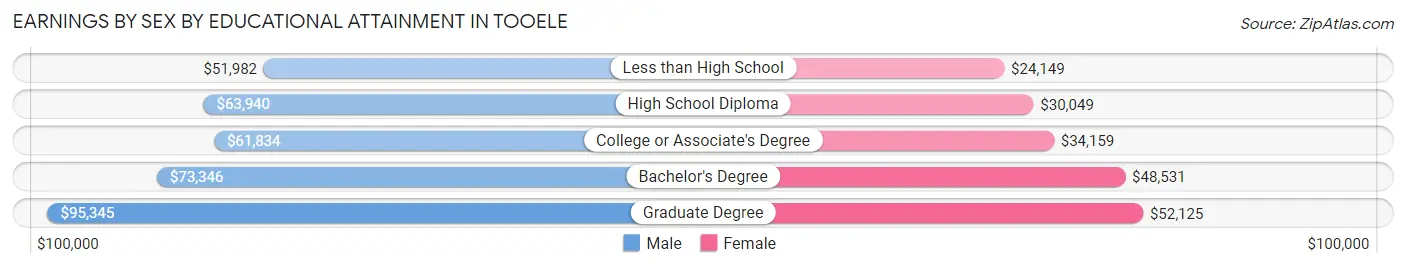
| Educational Attainment | Male Income | Female Income |
| Less than High School | $51,982 | $24,149 |
| High School Diploma | $63,940 | $30,049 |
| College or Associate's Degree | $61,834 | $34,159 |
| Bachelor's Degree | $73,346 | $48,531 |
| Graduate Degree | $95,345 | $52,125 |
| Total | $64,373 | $33,486 |
Family Income in Tooele
Family Income Brackets in Tooele
According to the Tooele family income data, there are 2,713 families falling into the $100,000 to $149,999 income range, which is the most common income bracket and makes up 30.8% of all families. Conversely, the less than $10,000 income bracket is the least frequent group with only 62 families (0.7%) belonging to this category.
| Income Bracket | # Families | % Families |
| Less than $10,000 | 62 | 0.7% |
| $10,000 to $14,999 | 62 | 0.7% |
| $15,000 to $24,999 | 123 | 1.4% |
| $25,000 to $34,999 | 414 | 4.7% |
| $35,000 to $49,999 | 564 | 6.4% |
| $50,000 to $74,999 | 1,709 | 19.4% |
| $75,000 to $99,999 | 1,814 | 20.6% |
| $100,000 to $149,999 | 2,713 | 30.8% |
| $150,000 to $199,999 | 969 | 11.0% |
| $200,000+ | 388 | 4.4% |
Family Income by Famaliy Size in Tooele
6-person families (446 | 5.1%) account for the highest median family income in Tooele with $113,056 per family, while 2-person families (3,189 | 36.2%) have the highest median income of $40,116 per family member.
| Income Bracket | # Families | Median Income |
| 2-Person Families | 3,189 (36.2%) | $80,233 |
| 3-Person Families | 1,763 (20.0%) | $102,464 |
| 4-Person Families | 1,809 (20.5%) | $110,650 |
| 5-Person Families | 1,140 (12.9%) | $99,500 |
| 6-Person Families | 446 (5.1%) | $113,056 |
| 7+ Person Families | 461 (5.2%) | $99,125 |
| Total | 8,808 (100.0%) | $91,706 |
Family Income by Number of Earners in Tooele
The median family income in Tooele is $91,706, with families comprising 3+ earners (1,789) having the highest median family income of $132,219, while families with no earners (861) have the lowest median family income of $52,152, accounting for 20.3% and 9.8% of families, respectively.
| Number of Earners | # Families | Median Income |
| No Earners | 861 (9.8%) | $52,152 |
| 1 Earner | 2,565 (29.1%) | $72,152 |
| 2 Earners | 3,593 (40.8%) | $110,789 |
| 3+ Earners | 1,789 (20.3%) | $132,219 |
| Total | 8,808 (100.0%) | $91,706 |
Household Income in Tooele
Household Income Brackets in Tooele
With 3,058 households falling in the category, the $100,000 to $149,999 income range is the most frequent in Tooele, accounting for 26.2% of all households. In contrast, only 233 households (2.0%) fall into the less than $10,000 income bracket, making it the least populous group.
| Income Bracket | # Households | % Households |
| Less than $10,000 | 233 | 2.0% |
| $10,000 to $14,999 | 374 | 3.2% |
| $15,000 to $24,999 | 455 | 3.9% |
| $25,000 to $34,999 | 677 | 5.8% |
| $35,000 to $49,999 | 1,016 | 8.7% |
| $50,000 to $74,999 | 2,113 | 18.1% |
| $75,000 to $99,999 | 2,054 | 17.6% |
| $100,000 to $149,999 | 3,058 | 26.2% |
| $150,000 to $199,999 | 1,191 | 10.2% |
| $200,000+ | 502 | 4.3% |
Household Income by Householder Age in Tooele
The median household income in Tooele is $84,225, with the highest median household income of $106,173 found in the 45 to 64 years age bracket for the primary householder. A total of 3,777 households (32.4%) fall into this category. Meanwhile, the 15 to 24 years age bracket for the primary householder has the lowest median household income of $40,337, with 449 households (3.8%) in this group.
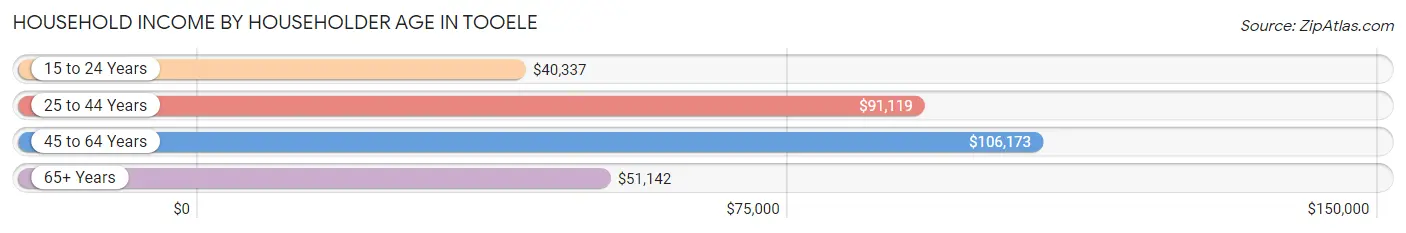
| Income Bracket | # Households | Median Income |
| 15 to 24 Years | 449 (3.8%) | $40,337 |
| 25 to 44 Years | 5,174 (44.3%) | $91,119 |
| 45 to 64 Years | 3,777 (32.4%) | $106,173 |
| 65+ Years | 2,273 (19.5%) | $51,142 |
| Total | 11,673 (100.0%) | $84,225 |
Poverty in Tooele
Income Below Poverty by Sex and Age in Tooele
With 3.9% poverty level for males and 4.6% for females among the residents of Tooele, 65 to 74 year old males and 18 to 24 year old females are the most vulnerable to poverty, with 124 males (12.4%) and 263 females (15.9%) in their respective age groups living below the poverty level.
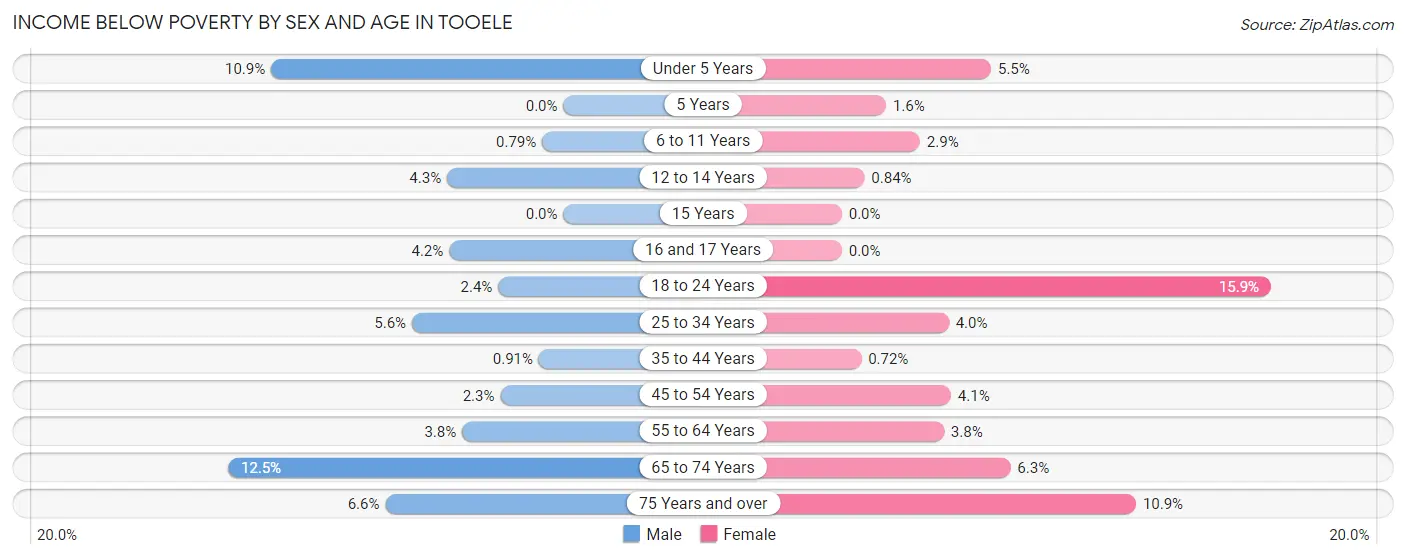
| Age Bracket | Male | Female |
| Under 5 Years | 129 (10.8%) | 78 (5.5%) |
| 5 Years | 0 (0.0%) | 6 (1.6%) |
| 6 to 11 Years | 15 (0.8%) | 40 (2.9%) |
| 12 to 14 Years | 48 (4.3%) | 10 (0.8%) |
| 15 Years | 0 (0.0%) | 0 (0.0%) |
| 16 and 17 Years | 27 (4.2%) | 0 (0.0%) |
| 18 to 24 Years | 50 (2.4%) | 263 (15.9%) |
| 25 to 34 Years | 141 (5.6%) | 89 (4.0%) |
| 35 to 44 Years | 27 (0.9%) | 22 (0.7%) |
| 45 to 54 Years | 53 (2.3%) | 68 (4.1%) |
| 55 to 64 Years | 57 (3.8%) | 59 (3.8%) |
| 65 to 74 Years | 124 (12.4%) | 79 (6.3%) |
| 75 Years and over | 39 (6.6%) | 90 (10.9%) |
| Total | 710 (3.9%) | 804 (4.6%) |
Income Above Poverty by Sex and Age in Tooele
According to the poverty statistics in Tooele, males aged 5 years and females aged 15 years are the age groups that are most secure financially, with 100.0% of males and 100.0% of females in these age groups living above the poverty line.
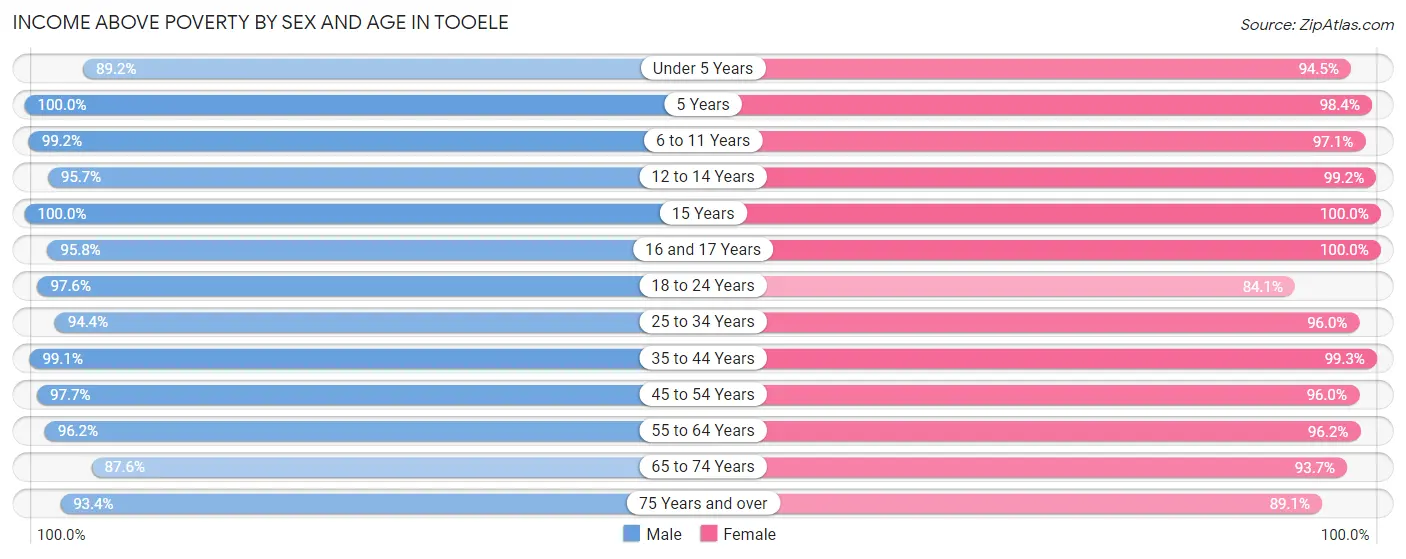
| Age Bracket | Male | Female |
| Under 5 Years | 1,060 (89.1%) | 1,329 (94.5%) |
| 5 Years | 358 (100.0%) | 360 (98.4%) |
| 6 to 11 Years | 1,892 (99.2%) | 1,340 (97.1%) |
| 12 to 14 Years | 1,063 (95.7%) | 1,178 (99.2%) |
| 15 Years | 207 (100.0%) | 503 (100.0%) |
| 16 and 17 Years | 610 (95.8%) | 493 (100.0%) |
| 18 to 24 Years | 2,017 (97.6%) | 1,388 (84.1%) |
| 25 to 34 Years | 2,367 (94.4%) | 2,155 (96.0%) |
| 35 to 44 Years | 2,932 (99.1%) | 3,041 (99.3%) |
| 45 to 54 Years | 2,215 (97.7%) | 1,611 (96.0%) |
| 55 to 64 Years | 1,457 (96.2%) | 1,497 (96.2%) |
| 65 to 74 Years | 872 (87.5%) | 1,182 (93.7%) |
| 75 Years and over | 551 (93.4%) | 734 (89.1%) |
| Total | 17,601 (96.1%) | 16,811 (95.4%) |
Income Below Poverty Among Married-Couple Families in Tooele
The poverty statistics for married-couple families in Tooele show that 1.0% or 73 of the total 7,013 families live below the poverty line. Families with 5 or more children have the highest poverty rate of 1.8%, comprising of 3 families. On the other hand, families with 3 or 4 children have the lowest poverty rate of 0.0%, which includes 0 families.
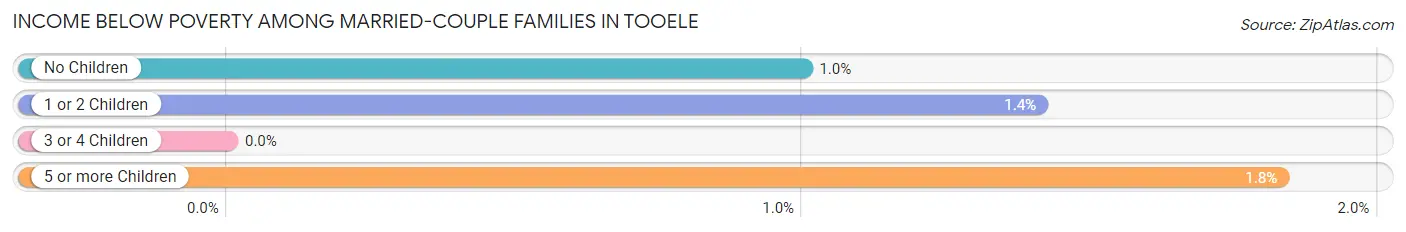
| Children | Above Poverty | Below Poverty |
| No Children | 3,165 (99.0%) | 32 (1.0%) |
| 1 or 2 Children | 2,653 (98.6%) | 38 (1.4%) |
| 3 or 4 Children | 961 (100.0%) | 0 (0.0%) |
| 5 or more Children | 161 (98.2%) | 3 (1.8%) |
| Total | 6,940 (99.0%) | 73 (1.0%) |
Income Below Poverty Among Single-Parent Households in Tooele
According to the poverty data in Tooele, 5.9% or 39 single-father households and 5.1% or 58 single-mother households are living below the poverty line. Among single-father households, those with 1 or 2 children have the highest poverty rate, with 39 households (11.8%) experiencing poverty. Likewise, among single-mother households, those with 5 or more children have the highest poverty rate, with 9 households (27.3%) falling below the poverty line.
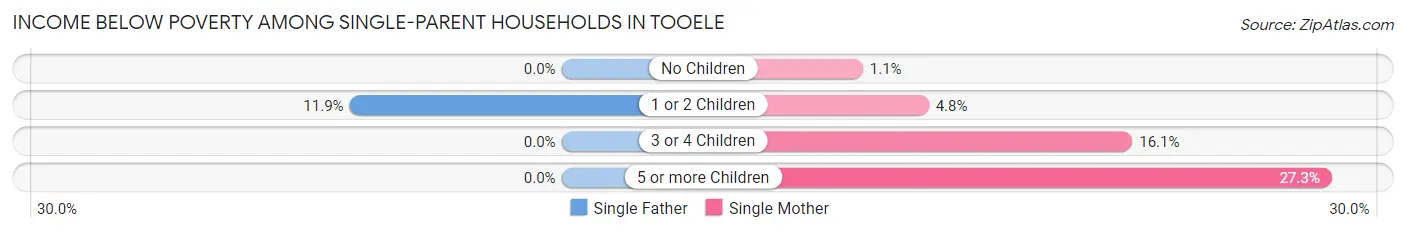
| Children | Single Father | Single Mother |
| No Children | 0 (0.0%) | 4 (1.1%) |
| 1 or 2 Children | 39 (11.8%) | 30 (4.8%) |
| 3 or 4 Children | 0 (0.0%) | 15 (16.1%) |
| 5 or more Children | 0 (0.0%) | 9 (27.3%) |
| Total | 39 (5.9%) | 58 (5.1%) |
Income Below Poverty Among Married-Couple vs Single-Parent Households in Tooele
The poverty data for Tooele shows that 73 of the married-couple family households (1.0%) and 97 of the single-parent households (5.4%) are living below the poverty level. Within the married-couple family households, those with 5 or more children have the highest poverty rate, with 3 households (1.8%) falling below the poverty line. Among the single-parent households, those with 3 or 4 children have the highest poverty rate, with 15 household (14.6%) living below poverty.
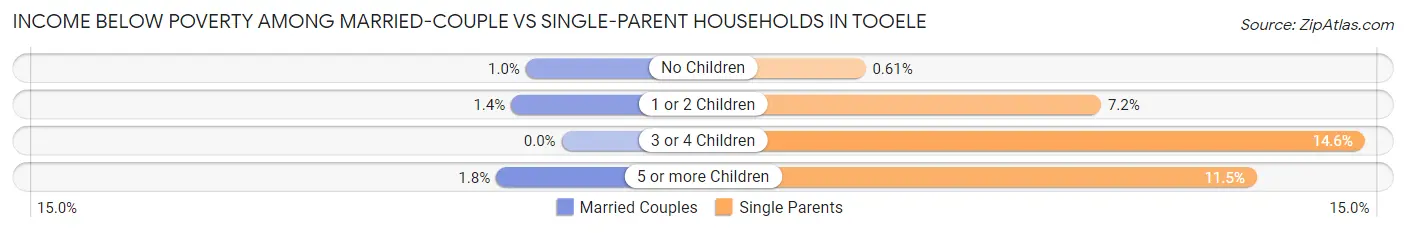
| Children | Married-Couple Families | Single-Parent Households |
| No Children | 32 (1.0%) | 4 (0.6%) |
| 1 or 2 Children | 38 (1.4%) | 69 (7.2%) |
| 3 or 4 Children | 0 (0.0%) | 15 (14.6%) |
| 5 or more Children | 3 (1.8%) | 9 (11.5%) |
| Total | 73 (1.0%) | 97 (5.4%) |
Race in Tooele
The most populous races in Tooele are White / Caucasian (30,959 | 85.3%), Hispanic or Latino (5,475 | 15.1%), and Two or more Races (2,980 | 8.2%).
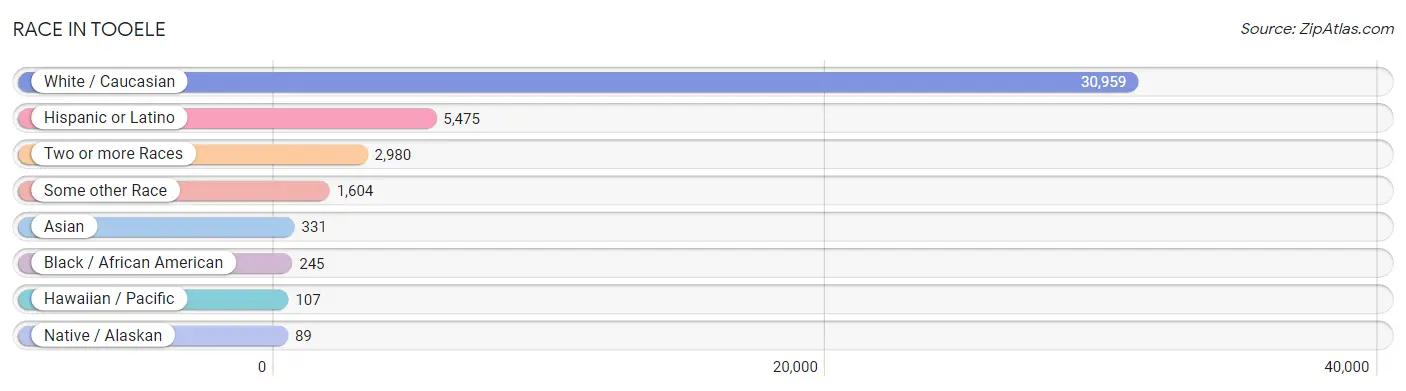
| Race | # Population | % Population |
| Asian | 331 | 0.9% |
| Black / African American | 245 | 0.7% |
| Hawaiian / Pacific | 107 | 0.3% |
| Hispanic or Latino | 5,475 | 15.1% |
| Native / Alaskan | 89 | 0.3% |
| White / Caucasian | 30,959 | 85.3% |
| Two or more Races | 2,980 | 8.2% |
| Some other Race | 1,604 | 4.4% |
| Total | 36,315 | 100.0% |
Ancestry in Tooele
The most populous ancestries reported in Tooele are English (8,732 | 24.0%), Mexican (4,014 | 11.1%), German (3,641 | 10.0%), American (1,589 | 4.4%), and Irish (1,561 | 4.3%), together accounting for 53.8% of all Tooele residents.
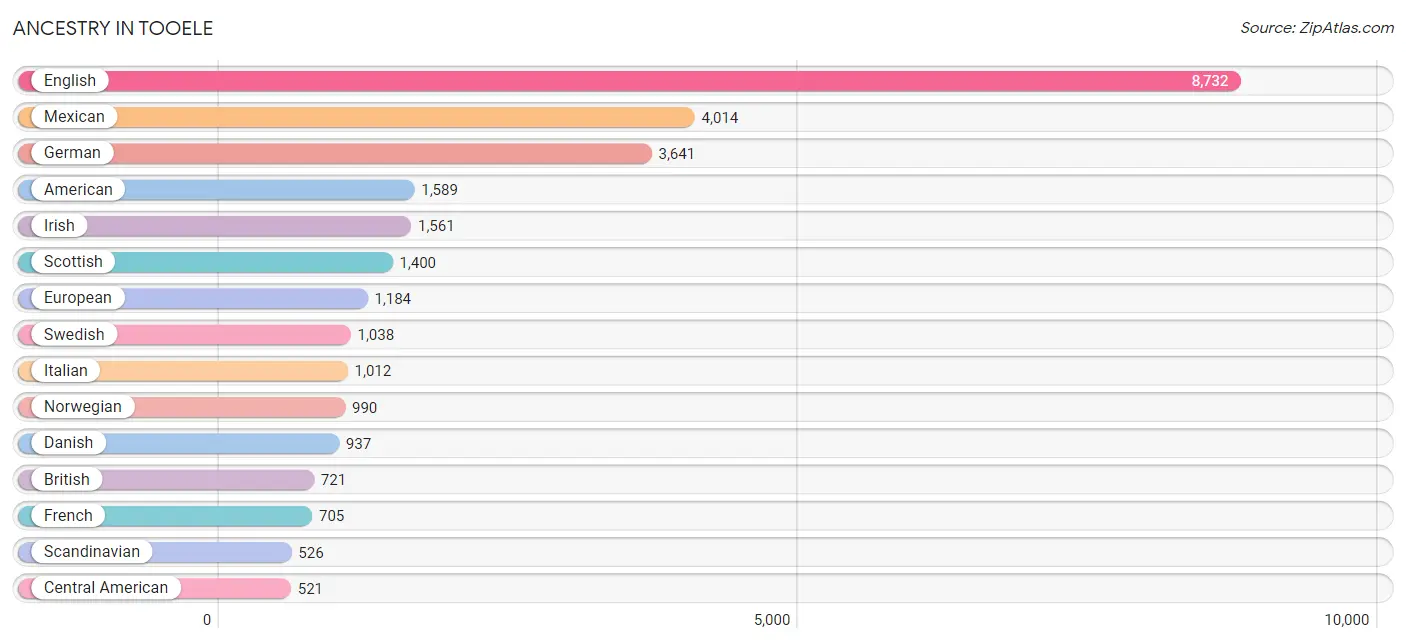
| Ancestry | # Population | % Population |
| American | 1,589 | 4.4% |
| Apache | 40 | 0.1% |
| Arab | 7 | 0.0% |
| Argentinean | 73 | 0.2% |
| Austrian | 29 | 0.1% |
| Basque | 3 | 0.0% |
| Bhutanese | 44 | 0.1% |
| Brazilian | 67 | 0.2% |
| British | 721 | 2.0% |
| Burmese | 14 | 0.0% |
| Canadian | 32 | 0.1% |
| Central American | 521 | 1.4% |
| Central American Indian | 57 | 0.2% |
| Cherokee | 66 | 0.2% |
| Chickasaw | 23 | 0.1% |
| Chilean | 23 | 0.1% |
| Chippewa | 11 | 0.0% |
| Colombian | 18 | 0.1% |
| Costa Rican | 4 | 0.0% |
| Cuban | 3 | 0.0% |
| Czech | 81 | 0.2% |
| Czechoslovakian | 11 | 0.0% |
| Danish | 937 | 2.6% |
| Dominican | 87 | 0.2% |
| Dutch | 299 | 0.8% |
| Eastern European | 16 | 0.0% |
| English | 8,732 | 24.0% |
| European | 1,184 | 3.3% |
| Filipino | 14 | 0.0% |
| Finnish | 50 | 0.1% |
| French | 705 | 1.9% |
| French Canadian | 85 | 0.2% |
| German | 3,641 | 10.0% |
| Greek | 213 | 0.6% |
| Guatemalan | 388 | 1.1% |
| Honduran | 46 | 0.1% |
| Hungarian | 77 | 0.2% |
| Indian (Asian) | 62 | 0.2% |
| Iranian | 57 | 0.2% |
| Irish | 1,561 | 4.3% |
| Italian | 1,012 | 2.8% |
| Korean | 445 | 1.2% |
| Lebanese | 7 | 0.0% |
| Mexican | 4,014 | 11.1% |
| Mexican American Indian | 21 | 0.1% |
| Native Hawaiian | 7 | 0.0% |
| Navajo | 51 | 0.1% |
| Nicaraguan | 19 | 0.1% |
| Nigerian | 39 | 0.1% |
| Northern European | 244 | 0.7% |
| Norwegian | 990 | 2.7% |
| Pennsylvania German | 38 | 0.1% |
| Peruvian | 9 | 0.0% |
| Polish | 122 | 0.3% |
| Portuguese | 41 | 0.1% |
| Puerto Rican | 23 | 0.1% |
| Russian | 69 | 0.2% |
| Salvadoran | 64 | 0.2% |
| Samoan | 210 | 0.6% |
| Scandinavian | 526 | 1.5% |
| Scotch-Irish | 318 | 0.9% |
| Scottish | 1,400 | 3.9% |
| Shoshone | 43 | 0.1% |
| Slovene | 43 | 0.1% |
| Somali | 32 | 0.1% |
| South American | 180 | 0.5% |
| Spaniard | 444 | 1.2% |
| Spanish | 100 | 0.3% |
| Sri Lankan | 43 | 0.1% |
| Subsaharan African | 71 | 0.2% |
| Swedish | 1,038 | 2.9% |
| Swiss | 114 | 0.3% |
| Thai | 57 | 0.2% |
| Tongan | 28 | 0.1% |
| Uruguayan | 34 | 0.1% |
| Venezuelan | 23 | 0.1% |
| Welsh | 491 | 1.3% |
| Yugoslavian | 143 | 0.4% |
| Yup'ik | 22 | 0.1% | View All 79 Rows |
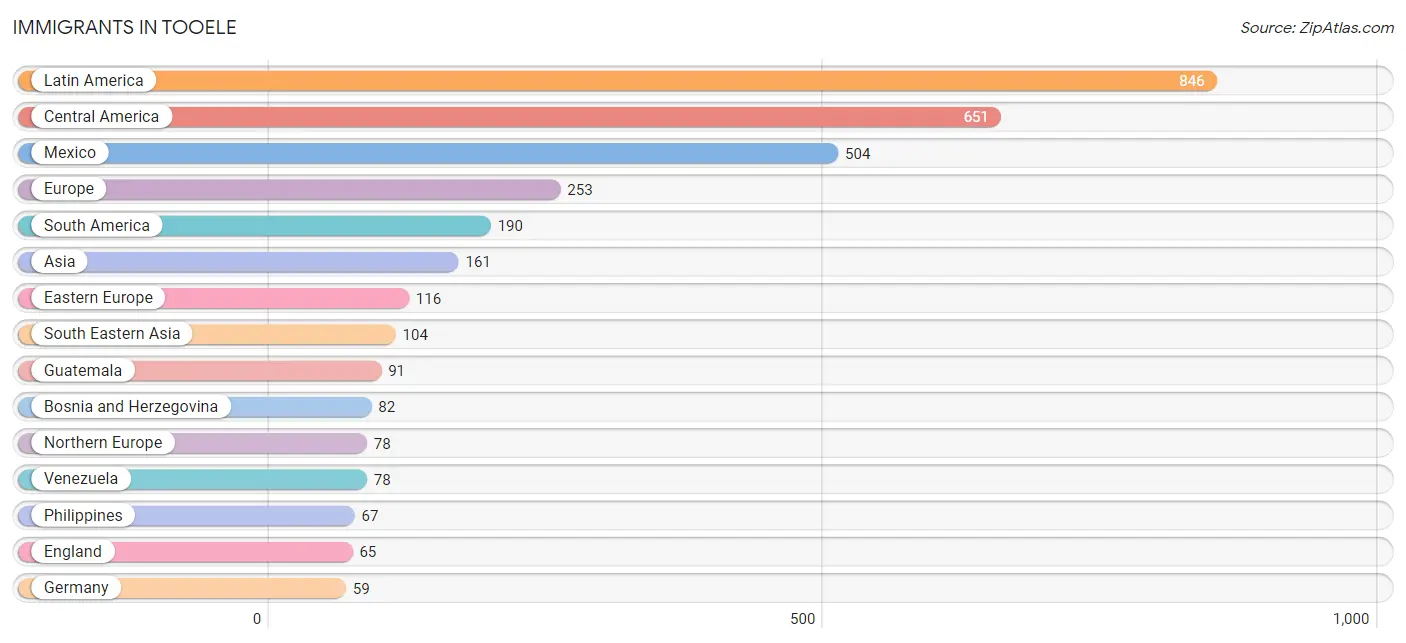
Immigrants in Tooele
The most numerous immigrant groups reported in Tooele came from Latin America (846 | 2.3%), Central America (651 | 1.8%), Mexico (504 | 1.4%), Europe (253 | 0.7%), and South America (190 | 0.5%), together accounting for 6.7% of all Tooele residents.
| Immigration Origin | # Population | % Population |
| Argentina | 18 | 0.1% |
| Asia | 161 | 0.4% |
| Bosnia and Herzegovina | 82 | 0.2% |
| Brazil | 22 | 0.1% |
| Canada | 4 | 0.0% |
| Caribbean | 5 | 0.0% |
| Central America | 651 | 1.8% |
| Chile | 23 | 0.1% |
| China | 43 | 0.1% |
| Cuba | 3 | 0.0% |
| Denmark | 13 | 0.0% |
| Dominican Republic | 2 | 0.0% |
| Eastern Asia | 57 | 0.2% |
| Eastern Europe | 116 | 0.3% |
| Ecuador | 22 | 0.1% |
| El Salvador | 17 | 0.1% |
| England | 65 | 0.2% |
| Europe | 253 | 0.7% |
| Germany | 59 | 0.2% |
| Guatemala | 91 | 0.3% |
| Honduras | 32 | 0.1% |
| Korea | 14 | 0.0% |
| Latin America | 846 | 2.3% |
| Mexico | 504 | 1.4% |
| Nicaragua | 7 | 0.0% |
| Northern Europe | 78 | 0.2% |
| Oceania | 40 | 0.1% |
| Peru | 12 | 0.0% |
| Philippines | 67 | 0.2% |
| Russia | 34 | 0.1% |
| South America | 190 | 0.5% |
| South Eastern Asia | 104 | 0.3% |
| Taiwan | 6 | 0.0% |
| Uruguay | 15 | 0.0% |
| Venezuela | 78 | 0.2% |
| Vietnam | 37 | 0.1% |
| Western Europe | 59 | 0.2% | View All 37 Rows |
Sex and Age in Tooele
Sex and Age in Tooele
The most populous age groups in Tooele are 10 to 14 Years (1,804 | 9.7%) for men and 35 to 39 Years (1,632 | 9.2%) for women.
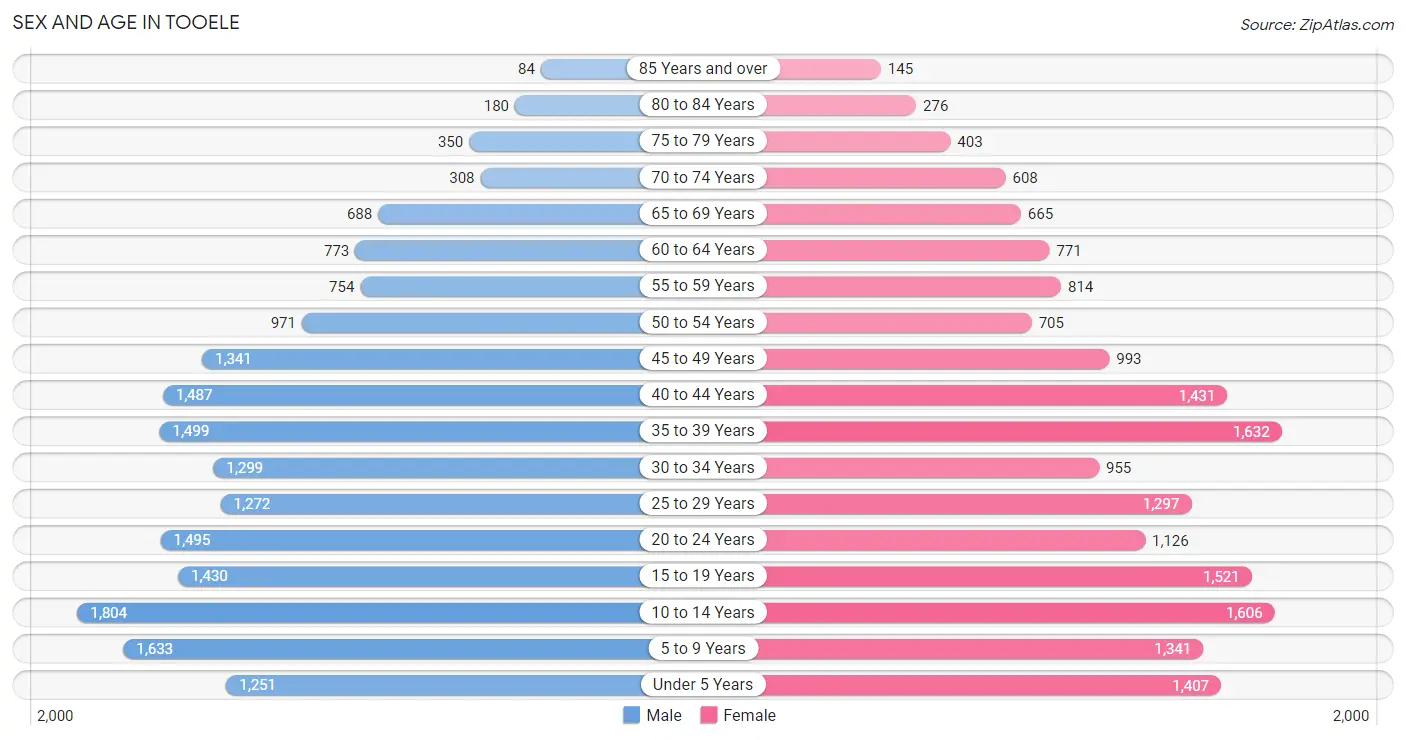
| Age Bracket | Male | Female |
| Under 5 Years | 1,251 (6.7%) | 1,407 (8.0%) |
| 5 to 9 Years | 1,633 (8.8%) | 1,341 (7.6%) |
| 10 to 14 Years | 1,804 (9.7%) | 1,606 (9.1%) |
| 15 to 19 Years | 1,430 (7.7%) | 1,521 (8.6%) |
| 20 to 24 Years | 1,495 (8.0%) | 1,126 (6.4%) |
| 25 to 29 Years | 1,272 (6.8%) | 1,297 (7.3%) |
| 30 to 34 Years | 1,299 (7.0%) | 955 (5.4%) |
| 35 to 39 Years | 1,499 (8.1%) | 1,632 (9.2%) |
| 40 to 44 Years | 1,487 (8.0%) | 1,431 (8.1%) |
| 45 to 49 Years | 1,341 (7.2%) | 993 (5.6%) |
| 50 to 54 Years | 971 (5.2%) | 705 (4.0%) |
| 55 to 59 Years | 754 (4.1%) | 814 (4.6%) |
| 60 to 64 Years | 773 (4.2%) | 771 (4.4%) |
| 65 to 69 Years | 688 (3.7%) | 665 (3.8%) |
| 70 to 74 Years | 308 (1.7%) | 608 (3.4%) |
| 75 to 79 Years | 350 (1.9%) | 403 (2.3%) |
| 80 to 84 Years | 180 (1.0%) | 276 (1.6%) |
| 85 Years and over | 84 (0.4%) | 145 (0.8%) |
| Total | 18,619 (100.0%) | 17,696 (100.0%) |
Families and Households in Tooele
Median Family Size in Tooele
The median family size in Tooele is 3.57 persons per family, with married-couple families (7,013 | 79.6%) accounting for the largest median family size of 3.66 persons per family. On the other hand, single male/father families (665 | 7.5%) represent the smallest median family size with 3.14 persons per family.
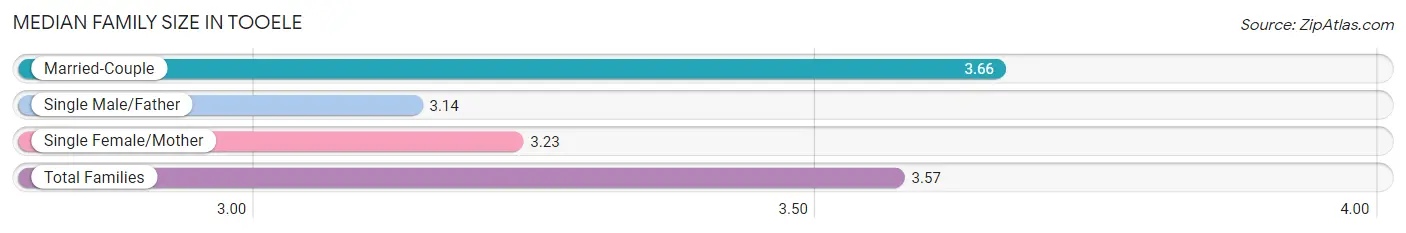
| Family Type | # Families | Family Size |
| Married-Couple | 7,013 (79.6%) | 3.66 |
| Single Male/Father | 665 (7.5%) | 3.14 |
| Single Female/Mother | 1,130 (12.8%) | 3.23 |
| Total Families | 8,808 (100.0%) | 3.57 |
Median Household Size in Tooele
The median household size in Tooele is 3.09 persons per household, with married-couple households (7,013 | 60.1%) accounting for the largest median household size of 3.71 persons per household. non-family households (2,865 | 24.5%) represent the smallest median household size with 1.30 persons per household.
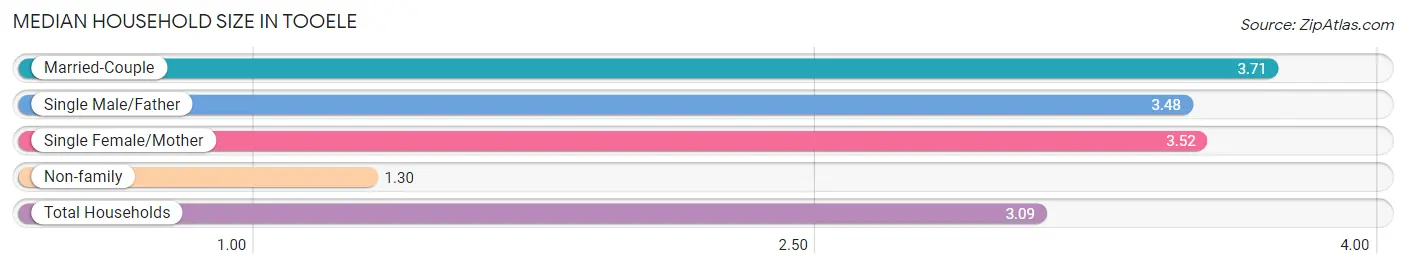
| Household Type | # Households | Household Size |
| Married-Couple | 7,013 (60.1%) | 3.71 |
| Single Male/Father | 665 (5.7%) | 3.48 |
| Single Female/Mother | 1,130 (9.7%) | 3.52 |
| Non-family | 2,865 (24.5%) | 1.30 |
| Total Households | 11,673 (100.0%) | 3.09 |
Household Size by Marriage Status in Tooele
Out of a total of 11,673 households in Tooele, 8,808 (75.5%) are family households, while 2,865 (24.5%) are nonfamily households. The most numerous type of family households are 2-person households, comprising 3,008, and the most common type of nonfamily households are 1-person households, comprising 2,314.
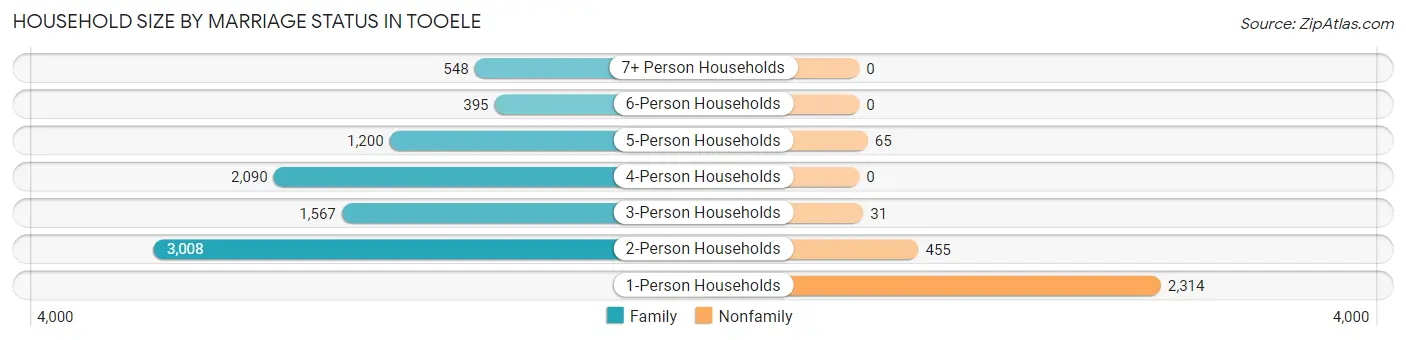
| Household Size | Family Households | Nonfamily Households |
| 1-Person Households | - | 2,314 (19.8%) |
| 2-Person Households | 3,008 (25.8%) | 455 (3.9%) |
| 3-Person Households | 1,567 (13.4%) | 31 (0.3%) |
| 4-Person Households | 2,090 (17.9%) | 0 (0.0%) |
| 5-Person Households | 1,200 (10.3%) | 65 (0.6%) |
| 6-Person Households | 395 (3.4%) | 0 (0.0%) |
| 7+ Person Households | 548 (4.7%) | 0 (0.0%) |
| Total | 8,808 (75.5%) | 2,865 (24.5%) |
Female Fertility in Tooele
Fertility by Age in Tooele
Average fertility rate in Tooele is 61.0 births per 1,000 women. Women in the age bracket of 20 to 34 years have the highest fertility rate with 142.0 births per 1,000 women. Women in the age bracket of 20 to 34 years acount for 85.7% of all women with births.
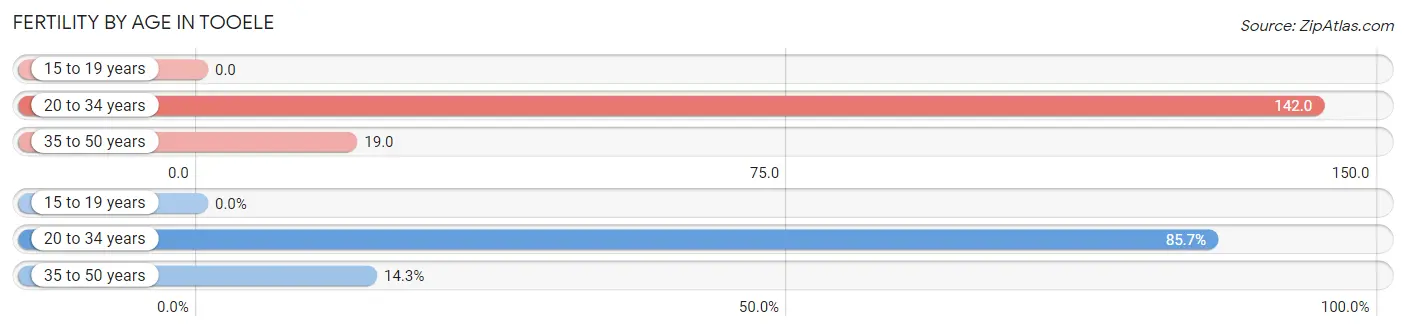
| Age Bracket | Women with Births | Births / 1,000 Women |
| 15 to 19 years | 0 (0.0%) | 0.0 |
| 20 to 34 years | 478 (85.7%) | 142.0 |
| 35 to 50 years | 80 (14.3%) | 19.0 |
| Total | 558 (100.0%) | 61.0 |
Fertility by Age by Marriage Status in Tooele
73.1% of women with births (558) in Tooele are married. The highest percentage of unmarried women with births falls into 20 to 34 years age bracket with 31.4% of them unmarried at the time of birth, while the lowest percentage of unmarried women with births belong to 35 to 50 years age bracket with 0.0% of them unmarried.
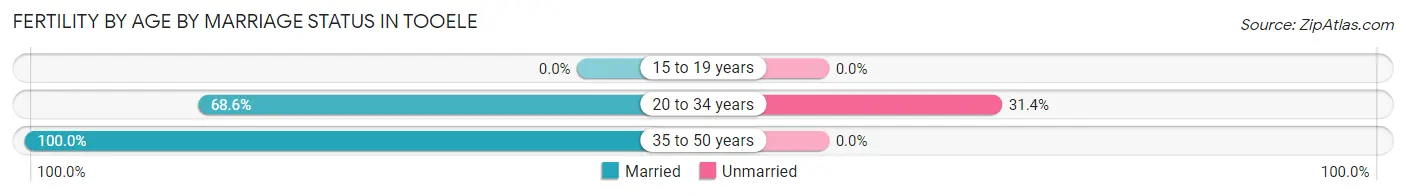
| Age Bracket | Married | Unmarried |
| 15 to 19 years | 0 (0.0%) | 0 (0.0%) |
| 20 to 34 years | 328 (68.6%) | 150 (31.4%) |
| 35 to 50 years | 80 (100.0%) | 0 (0.0%) |
| Total | 408 (73.1%) | 150 (26.9%) |
Fertility by Education in Tooele
Average fertility rate in Tooele is 61.0 births per 1,000 women. Women with the education attainment of bachelor's degree have the highest fertility rate of 161.0 births per 1,000 women, while women with the education attainment of graduate degree have the lowest fertility at 15.0 births per 1,000 women. Women with the education attainment of college or associate's degree represent 40.0% of all women with births.
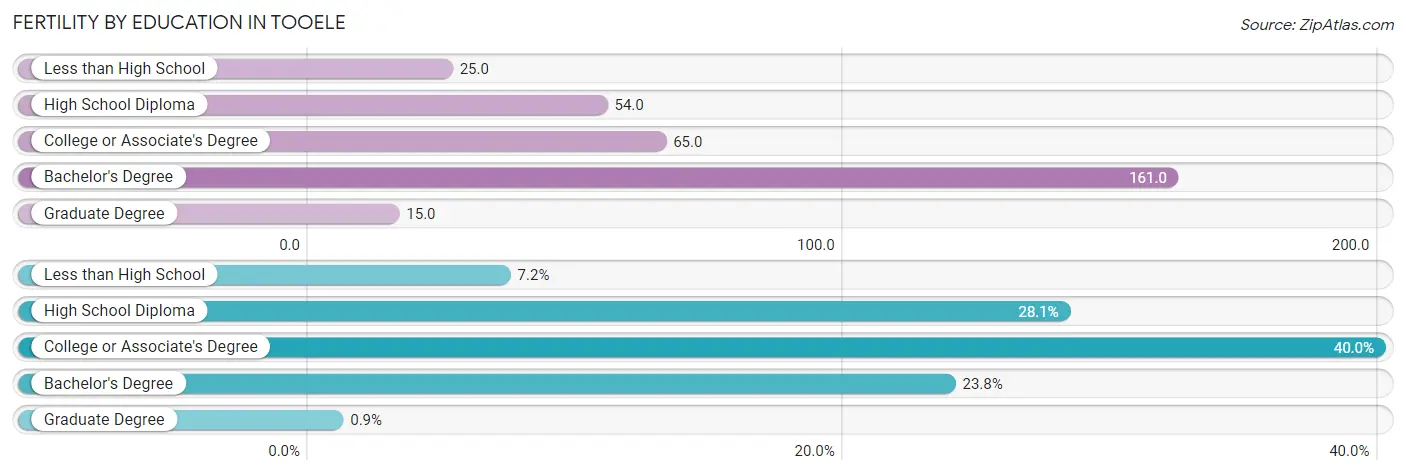
| Educational Attainment | Women with Births | Births / 1,000 Women |
| Less than High School | 40 (7.2%) | 25.0 |
| High School Diploma | 157 (28.1%) | 54.0 |
| College or Associate's Degree | 223 (40.0%) | 65.0 |
| Bachelor's Degree | 133 (23.8%) | 161.0 |
| Graduate Degree | 5 (0.9%) | 15.0 |
| Total | 558 (100.0%) | 61.0 |
Fertility by Education by Marriage Status in Tooele
26.9% of women with births in Tooele are unmarried. Women with the educational attainment of college or associate's degree are most likely to be married with 100.0% of them married at childbirth, while women with the educational attainment of high school diploma are least likely to be married with 83.4% of them unmarried at childbirth.
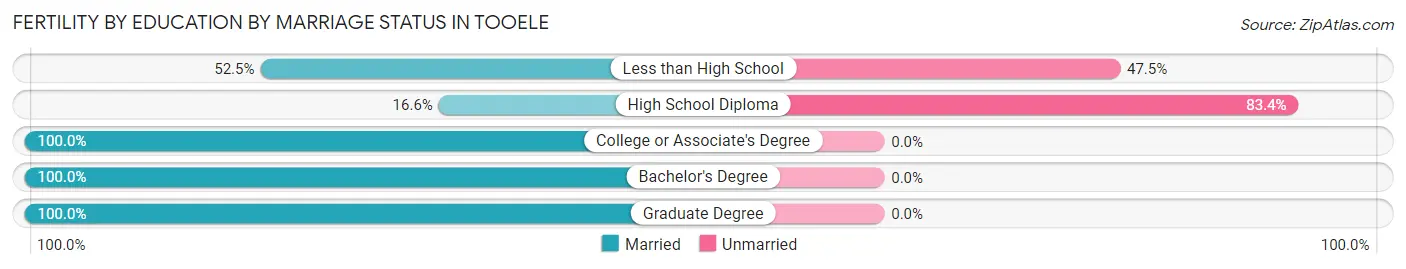
| Educational Attainment | Married | Unmarried |
| Less than High School | 21 (52.5%) | 19 (47.5%) |
| High School Diploma | 26 (16.6%) | 131 (83.4%) |
| College or Associate's Degree | 223 (100.0%) | 0 (0.0%) |
| Bachelor's Degree | 133 (100.0%) | 0 (0.0%) |
| Graduate Degree | 5 (100.0%) | 0 (0.0%) |
| Total | 408 (73.1%) | 150 (26.9%) |
Employment Characteristics in Tooele
Employment by Class of Employer in Tooele
Among the 17,989 employed individuals in Tooele, private company employees (13,534 | 75.2%), local government employees (1,134 | 6.3%), and federal government employees (795 | 4.4%) make up the most common classes of employment.
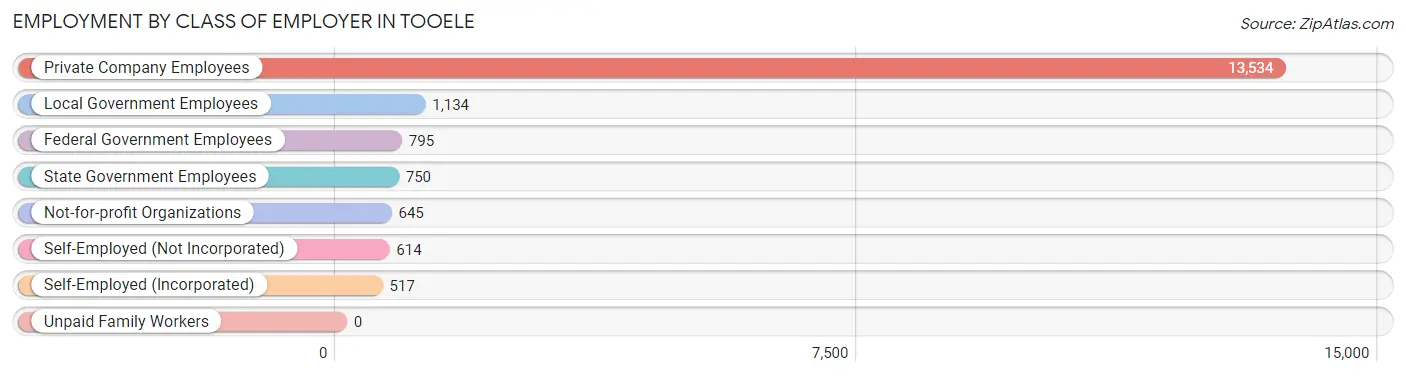
| Employer Class | # Employees | % Employees |
| Private Company Employees | 13,534 | 75.2% |
| Self-Employed (Incorporated) | 517 | 2.9% |
| Self-Employed (Not Incorporated) | 614 | 3.4% |
| Not-for-profit Organizations | 645 | 3.6% |
| Local Government Employees | 1,134 | 6.3% |
| State Government Employees | 750 | 4.2% |
| Federal Government Employees | 795 | 4.4% |
| Unpaid Family Workers | 0 | 0.0% |
| Total | 17,989 | 100.0% |
Employment Status by Age in Tooele
According to the labor force statistics for Tooele, out of the total population over 16 years of age (26,563), 71.2% or 18,913 individuals are in the labor force, with 3.9% or 738 of them unemployed. The age group with the highest labor force participation rate is 20 to 24 years, with 92.4% or 2,422 individuals in the labor force. Within the labor force, the 16 to 19 years age range has the highest percentage of unemployed individuals, with 10.0% or 134 of them being unemployed.
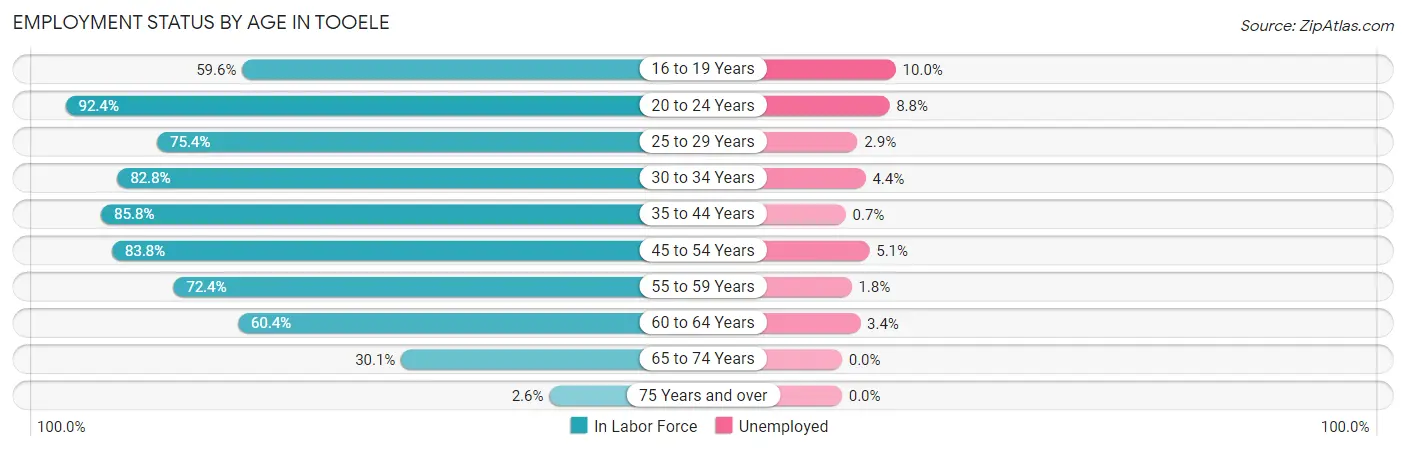
| Age Bracket | In Labor Force | Unemployed |
| 16 to 19 Years | 1,336 (59.6%) | 134 (10.0%) |
| 20 to 24 Years | 2,422 (92.4%) | 213 (8.8%) |
| 25 to 29 Years | 1,937 (75.4%) | 56 (2.9%) |
| 30 to 34 Years | 1,866 (82.8%) | 82 (4.4%) |
| 35 to 44 Years | 5,190 (85.8%) | 36 (0.7%) |
| 45 to 54 Years | 3,360 (83.8%) | 171 (5.1%) |
| 55 to 59 Years | 1,135 (72.4%) | 20 (1.8%) |
| 60 to 64 Years | 933 (60.4%) | 32 (3.4%) |
| 65 to 74 Years | 683 (30.1%) | 0 (0.0%) |
| 75 Years and over | 37 (2.6%) | 0 (0.0%) |
| Total | 18,913 (71.2%) | 738 (3.9%) |
Employment Status by Educational Attainment in Tooele
According to labor force statistics for Tooele, 80.1% of individuals (14,413) out of the total population between 25 and 64 years of age (17,994) are in the labor force, with 2.7% or 389 of them being unemployed. The group with the highest labor force participation rate are those with the educational attainment of bachelor's degree or higher, with 88.2% or 2,622 individuals in the labor force. Within the labor force, individuals with less than high school education have the highest percentage of unemployment, with 4.8% or 51 of them being unemployed.
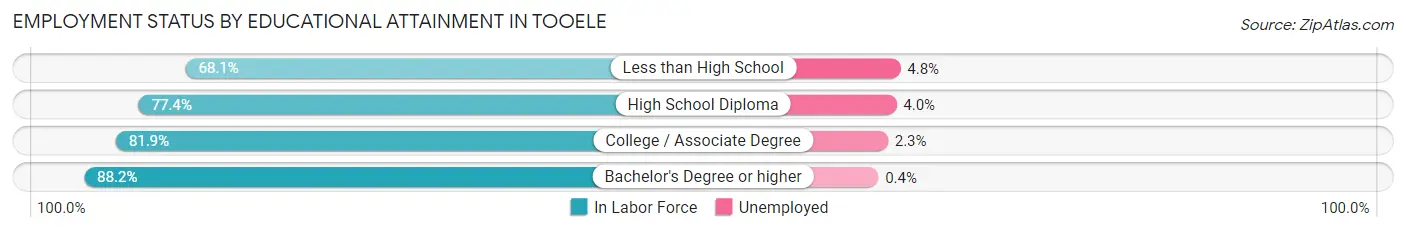
| Educational Attainment | In Labor Force | Unemployed |
| Less than High School | 1,055 (68.1%) | 74 (4.8%) |
| High School Diploma | 5,005 (77.4%) | 259 (4.0%) |
| College / Associate Degree | 5,738 (81.9%) | 161 (2.3%) |
| Bachelor's Degree or higher | 2,622 (88.2%) | 12 (0.4%) |
| Total | 14,413 (80.1%) | 486 (2.7%) |
Employment Occupations by Sex in Tooele
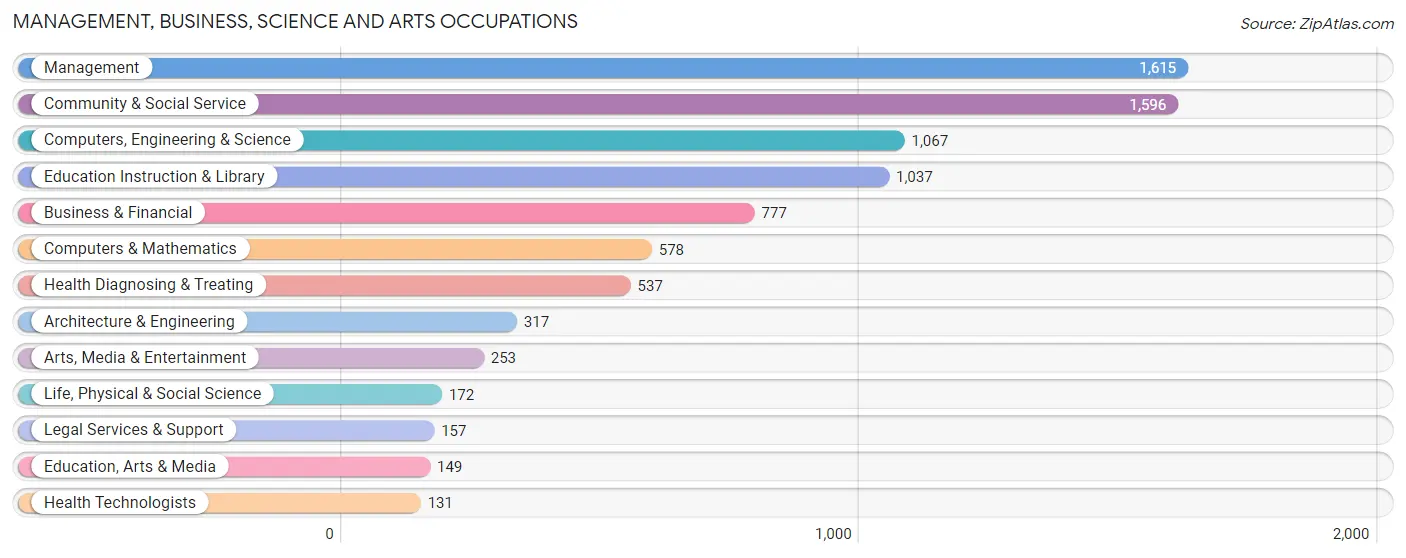
Management, Business, Science and Arts Occupations
The most common Management, Business, Science and Arts occupations in Tooele are Management (1,615 | 8.9%), Community & Social Service (1,596 | 8.8%), Computers, Engineering & Science (1,067 | 5.9%), Education Instruction & Library (1,037 | 5.7%), and Business & Financial (777 | 4.3%).
Management, Business, Science and Arts Occupations by Sex
Within the Management, Business, Science and Arts occupations in Tooele, the most male-oriented occupations are Architecture & Engineering (91.8%), Life, Physical & Social Science (91.3%), and Computers, Engineering & Science (84.8%), while the most female-oriented occupations are Health Diagnosing & Treating (86.2%), Health Technologists (78.6%), and Education Instruction & Library (71.6%).
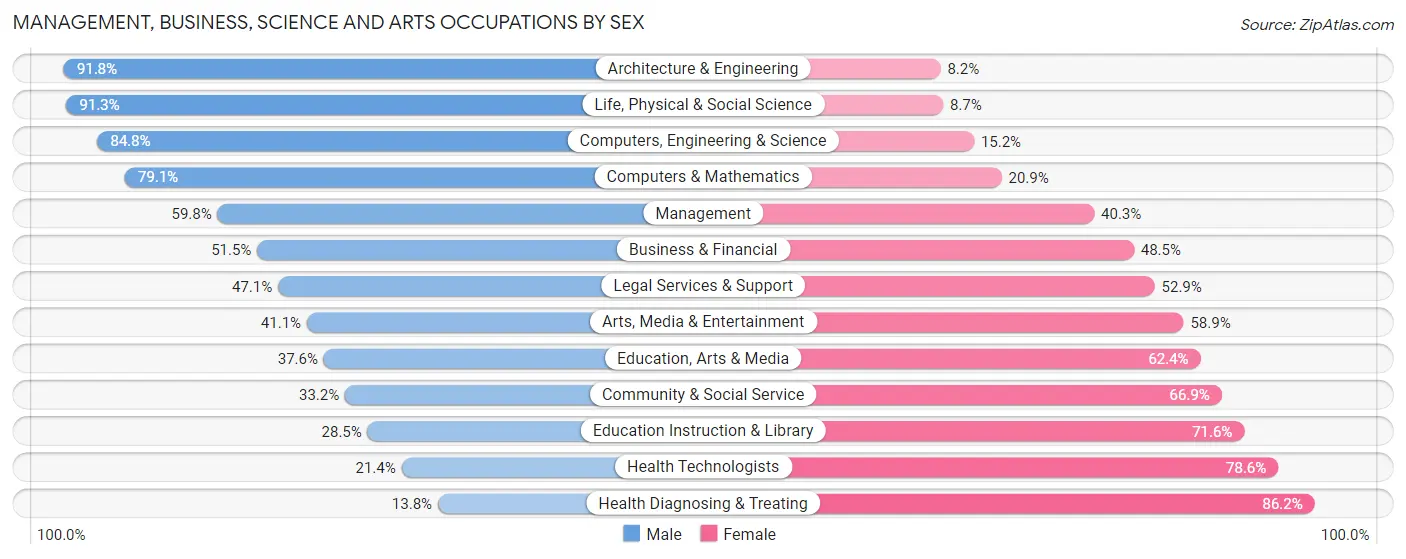
| Occupation | Male | Female |
| Management | 965 (59.8%) | 650 (40.3%) |
| Business & Financial | 400 (51.5%) | 377 (48.5%) |
| Computers, Engineering & Science | 905 (84.8%) | 162 (15.2%) |
| Computers & Mathematics | 457 (79.1%) | 121 (20.9%) |
| Architecture & Engineering | 291 (91.8%) | 26 (8.2%) |
| Life, Physical & Social Science | 157 (91.3%) | 15 (8.7%) |
| Community & Social Service | 529 (33.2%) | 1,067 (66.8%) |
| Education, Arts & Media | 56 (37.6%) | 93 (62.4%) |
| Legal Services & Support | 74 (47.1%) | 83 (52.9%) |
| Education Instruction & Library | 295 (28.4%) | 742 (71.6%) |
| Arts, Media & Entertainment | 104 (41.1%) | 149 (58.9%) |
| Health Diagnosing & Treating | 74 (13.8%) | 463 (86.2%) |
| Health Technologists | 28 (21.4%) | 103 (78.6%) |
| Total (Category) | 2,873 (51.4%) | 2,719 (48.6%) |
| Total (Overall) | 10,311 (57.0%) | 7,765 (43.0%) |
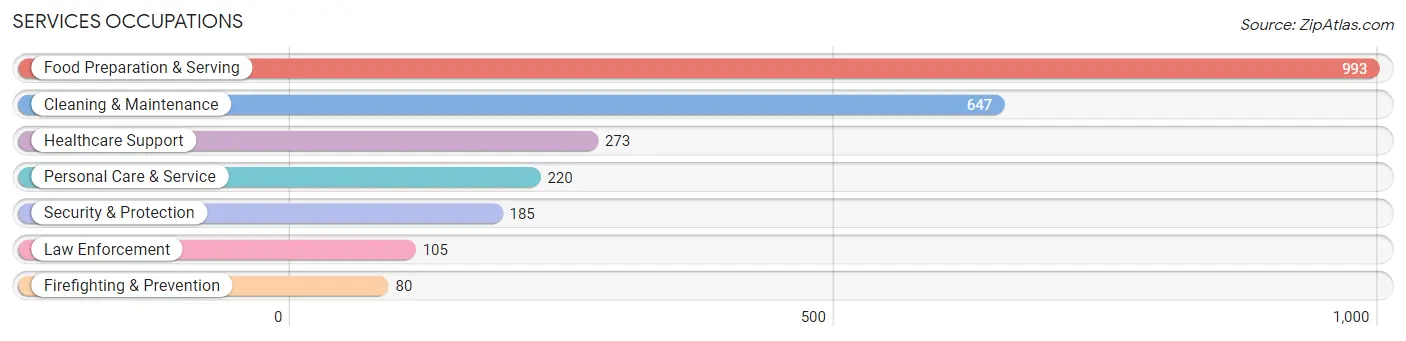
Services Occupations
The most common Services occupations in Tooele are Food Preparation & Serving (993 | 5.5%), Cleaning & Maintenance (647 | 3.6%), Healthcare Support (273 | 1.5%), Personal Care & Service (220 | 1.2%), and Security & Protection (185 | 1.0%).
Services Occupations by Sex
Within the Services occupations in Tooele, the most male-oriented occupations are Cleaning & Maintenance (84.2%), Law Enforcement (68.6%), and Security & Protection (67.0%), while the most female-oriented occupations are Healthcare Support (86.5%), Personal Care & Service (82.7%), and Food Preparation & Serving (69.1%).
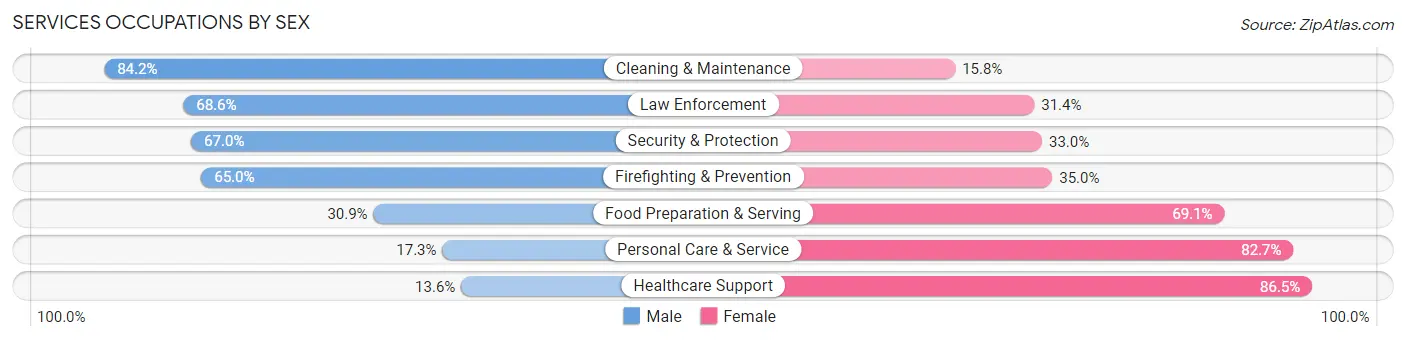
| Occupation | Male | Female |
| Healthcare Support | 37 (13.6%) | 236 (86.5%) |
| Security & Protection | 124 (67.0%) | 61 (33.0%) |
| Firefighting & Prevention | 52 (65.0%) | 28 (35.0%) |
| Law Enforcement | 72 (68.6%) | 33 (31.4%) |
| Food Preparation & Serving | 307 (30.9%) | 686 (69.1%) |
| Cleaning & Maintenance | 545 (84.2%) | 102 (15.8%) |
| Personal Care & Service | 38 (17.3%) | 182 (82.7%) |
| Total (Category) | 1,051 (45.3%) | 1,267 (54.7%) |
| Total (Overall) | 10,311 (57.0%) | 7,765 (43.0%) |
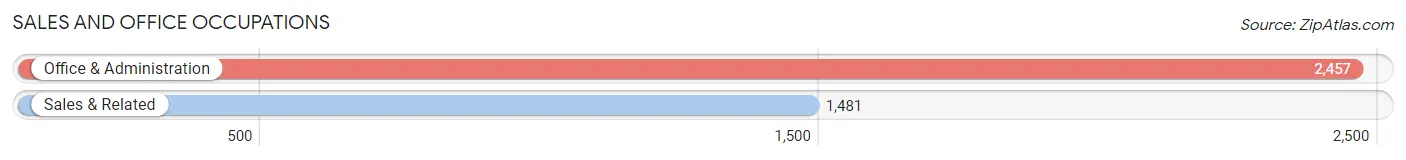
Sales and Office Occupations
The most common Sales and Office occupations in Tooele are Office & Administration (2,457 | 13.6%), and Sales & Related (1,481 | 8.2%).
Sales and Office Occupations by Sex
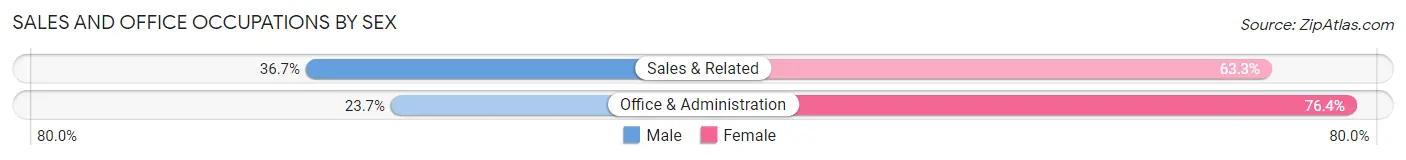
| Occupation | Male | Female |
| Sales & Related | 544 (36.7%) | 937 (63.3%) |
| Office & Administration | 581 (23.6%) | 1,876 (76.3%) |
| Total (Category) | 1,125 (28.6%) | 2,813 (71.4%) |
| Total (Overall) | 10,311 (57.0%) | 7,765 (43.0%) |
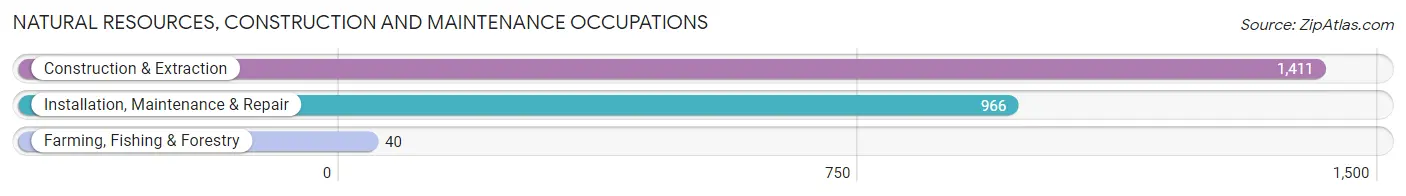
Natural Resources, Construction and Maintenance Occupations
The most common Natural Resources, Construction and Maintenance occupations in Tooele are Construction & Extraction (1,411 | 7.8%), Installation, Maintenance & Repair (966 | 5.3%), and Farming, Fishing & Forestry (40 | 0.2%).
Natural Resources, Construction and Maintenance Occupations by Sex
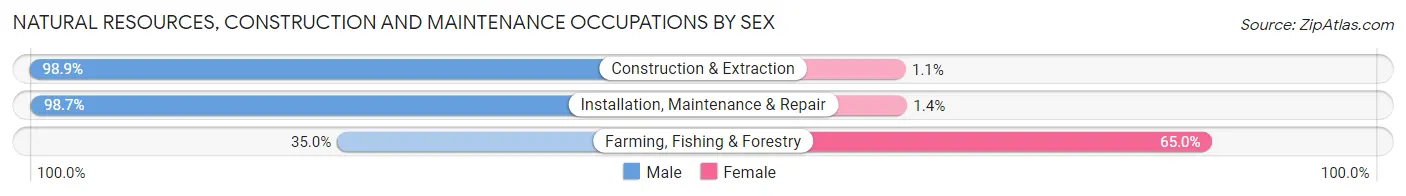
| Occupation | Male | Female |
| Farming, Fishing & Forestry | 14 (35.0%) | 26 (65.0%) |
| Construction & Extraction | 1,396 (98.9%) | 15 (1.1%) |
| Installation, Maintenance & Repair | 953 (98.7%) | 13 (1.3%) |
| Total (Category) | 2,363 (97.8%) | 54 (2.2%) |
| Total (Overall) | 10,311 (57.0%) | 7,765 (43.0%) |
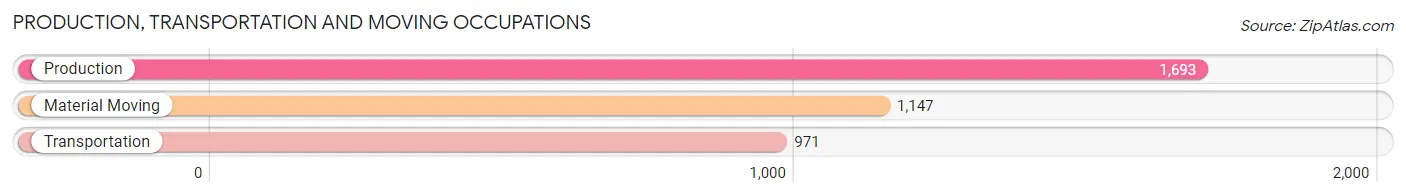
Production, Transportation and Moving Occupations
The most common Production, Transportation and Moving occupations in Tooele are Production (1,693 | 9.4%), Material Moving (1,147 | 6.4%), and Transportation (971 | 5.4%).
Production, Transportation and Moving Occupations by Sex
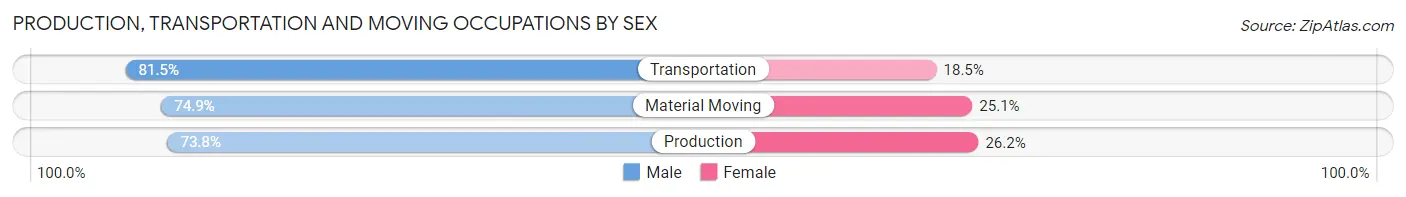
| Occupation | Male | Female |
| Production | 1,249 (73.8%) | 444 (26.2%) |
| Transportation | 791 (81.5%) | 180 (18.5%) |
| Material Moving | 859 (74.9%) | 288 (25.1%) |
| Total (Category) | 2,899 (76.1%) | 912 (23.9%) |
| Total (Overall) | 10,311 (57.0%) | 7,765 (43.0%) |
Employment Industries by Sex in Tooele
Employment Industries in Tooele
The major employment industries in Tooele include Retail Trade (2,618 | 14.5%), Manufacturing (2,311 | 12.8%), Construction (1,918 | 10.6%), Educational Services (1,477 | 8.2%), and Transportation & Warehousing (1,342 | 7.4%).
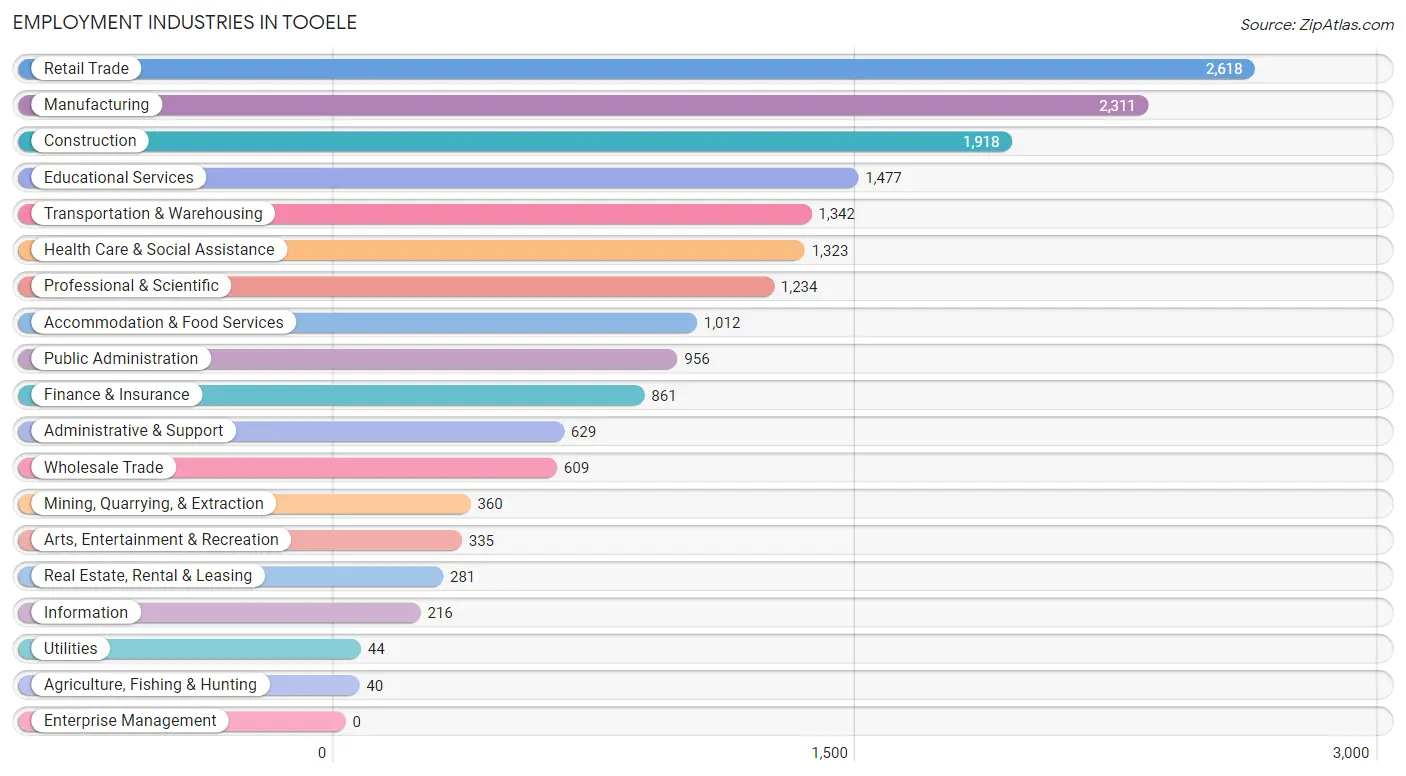
Employment Industries by Sex in Tooele
The Tooele industries that see more men than women are Mining, Quarrying, & Extraction (98.6%), Construction (96.0%), and Manufacturing (77.3%), whereas the industries that tend to have a higher number of women are Finance & Insurance (74.9%), Educational Services (74.1%), and Health Care & Social Assistance (70.5%).
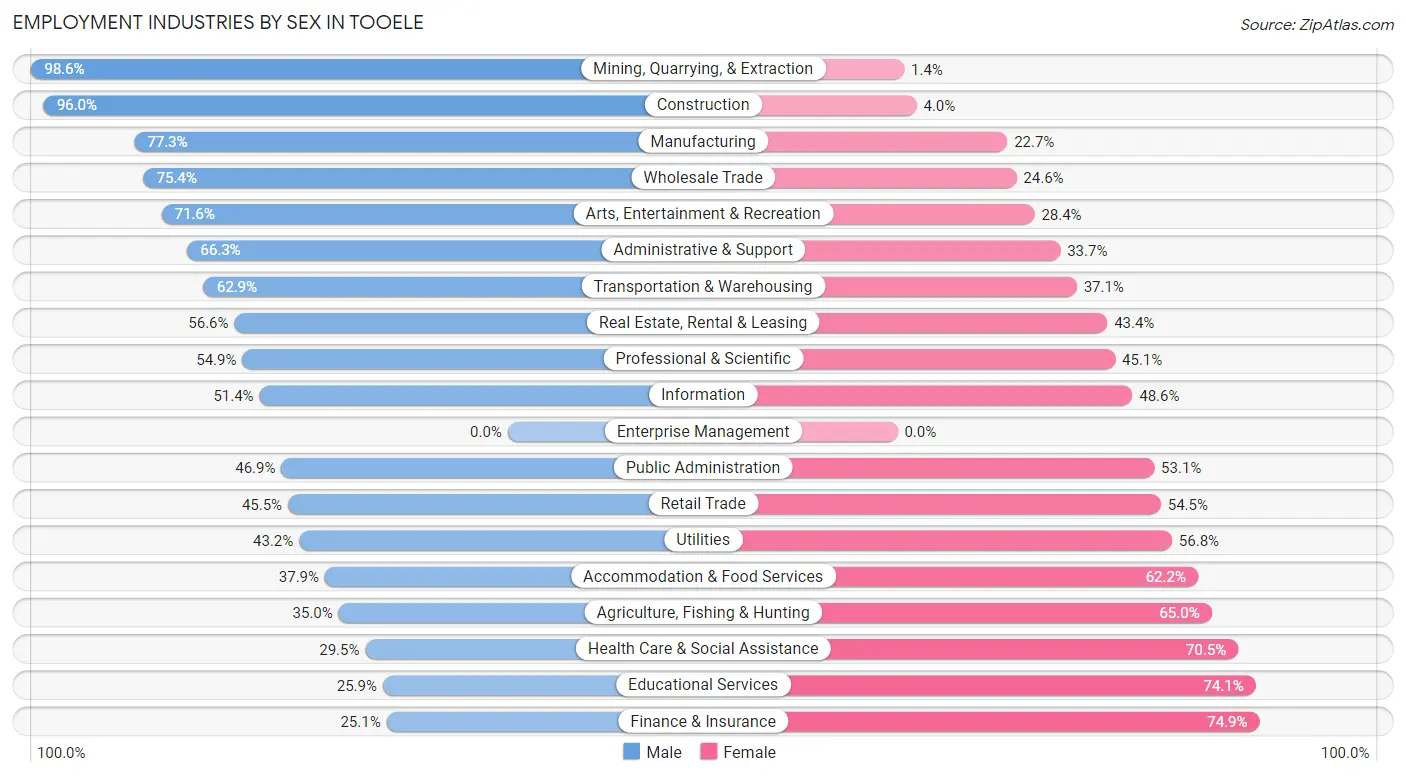
| Industry | Male | Female |
| Agriculture, Fishing & Hunting | 14 (35.0%) | 26 (65.0%) |
| Mining, Quarrying, & Extraction | 355 (98.6%) | 5 (1.4%) |
| Construction | 1,842 (96.0%) | 76 (4.0%) |
| Manufacturing | 1,786 (77.3%) | 525 (22.7%) |
| Wholesale Trade | 459 (75.4%) | 150 (24.6%) |
| Retail Trade | 1,191 (45.5%) | 1,427 (54.5%) |
| Transportation & Warehousing | 844 (62.9%) | 498 (37.1%) |
| Utilities | 19 (43.2%) | 25 (56.8%) |
| Information | 111 (51.4%) | 105 (48.6%) |
| Finance & Insurance | 216 (25.1%) | 645 (74.9%) |
| Real Estate, Rental & Leasing | 159 (56.6%) | 122 (43.4%) |
| Professional & Scientific | 678 (54.9%) | 556 (45.1%) |
| Enterprise Management | 0 (0.0%) | 0 (0.0%) |
| Administrative & Support | 417 (66.3%) | 212 (33.7%) |
| Educational Services | 382 (25.9%) | 1,095 (74.1%) |
| Health Care & Social Assistance | 390 (29.5%) | 933 (70.5%) |
| Arts, Entertainment & Recreation | 240 (71.6%) | 95 (28.4%) |
| Accommodation & Food Services | 383 (37.9%) | 629 (62.2%) |
| Public Administration | 448 (46.9%) | 508 (53.1%) |
| Total | 10,311 (57.0%) | 7,765 (43.0%) |
Education in Tooele
School Enrollment in Tooele
The most common levels of schooling among the 10,164 students in Tooele are high school (2,688 | 26.5%), middle school (2,448 | 24.1%), and elementary school (2,112 | 20.8%).
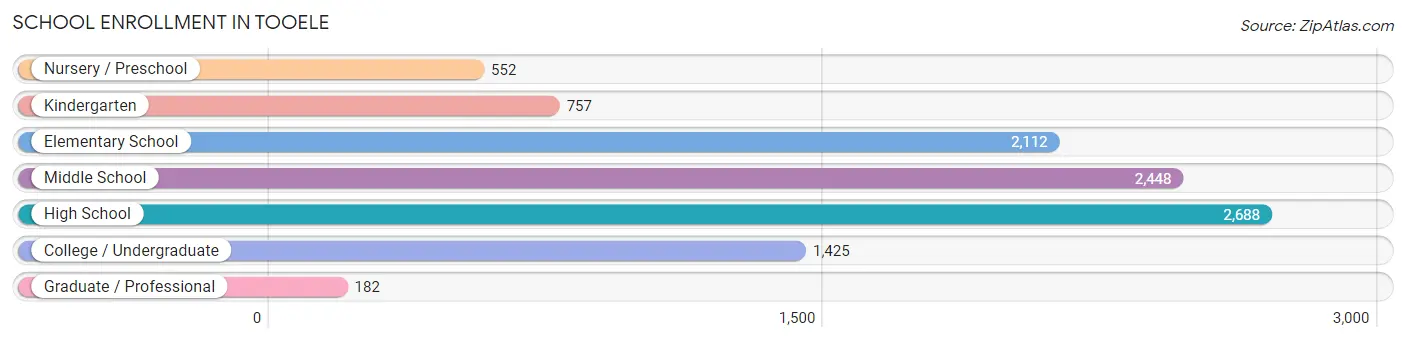
| School Level | # Students | % Students |
| Nursery / Preschool | 552 | 5.4% |
| Kindergarten | 757 | 7.4% |
| Elementary School | 2,112 | 20.8% |
| Middle School | 2,448 | 24.1% |
| High School | 2,688 | 26.5% |
| College / Undergraduate | 1,425 | 14.0% |
| Graduate / Professional | 182 | 1.8% |
| Total | 10,164 | 100.0% |
School Enrollment by Age by Funding Source in Tooele
Out of a total of 10,164 students who are enrolled in schools in Tooele, 1,453 (14.3%) attend a private institution, while the remaining 8,711 (85.7%) are enrolled in public schools. The age group of 3 to 4 year olds has the highest likelihood of being enrolled in private schools, with 121 (39.2% in the age bracket) enrolled. Conversely, the age group of 15 to 17 year olds has the lowest likelihood of being enrolled in a private school, with 1,726 (96.9% in the age bracket) attending a public institution.
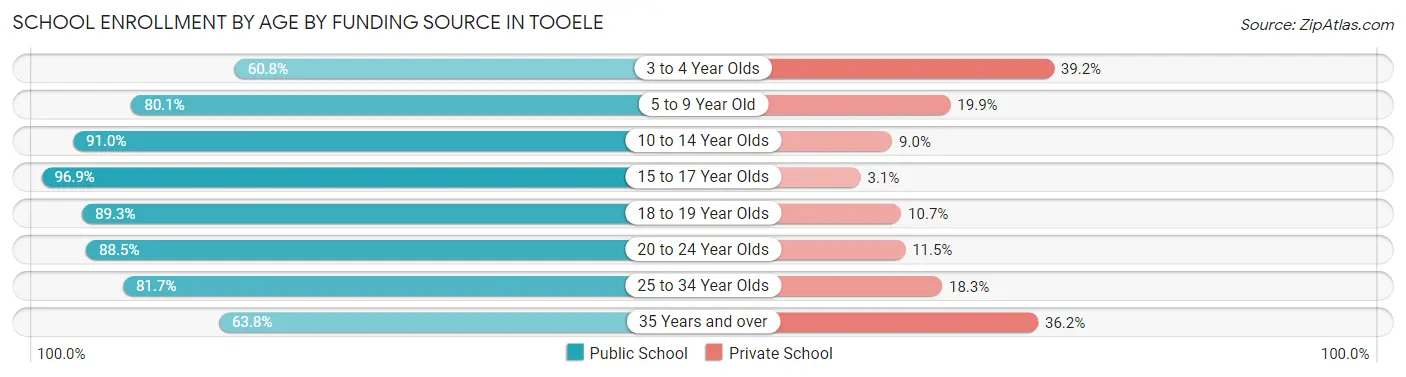
| Age Bracket | Public School | Private School |
| 3 to 4 Year Olds | 188 (60.8%) | 121 (39.2%) |
| 5 to 9 Year Old | 2,229 (80.1%) | 553 (19.9%) |
| 10 to 14 Year Olds | 2,971 (91.0%) | 295 (9.0%) |
| 15 to 17 Year Olds | 1,726 (96.9%) | 56 (3.1%) |
| 18 to 19 Year Olds | 525 (89.3%) | 63 (10.7%) |
| 20 to 24 Year Olds | 255 (88.5%) | 33 (11.5%) |
| 25 to 34 Year Olds | 361 (81.7%) | 81 (18.3%) |
| 35 Years and over | 451 (63.8%) | 256 (36.2%) |
| Total | 8,711 (85.7%) | 1,453 (14.3%) |
Educational Attainment by Field of Study in Tooele
Business (864 | 22.6%), education (631 | 16.5%), science & technology (384 | 10.0%), social sciences (285 | 7.4%), and computers & mathematics (279 | 7.3%) are the most common fields of study among 3,829 individuals in Tooele who have obtained a bachelor's degree or higher.
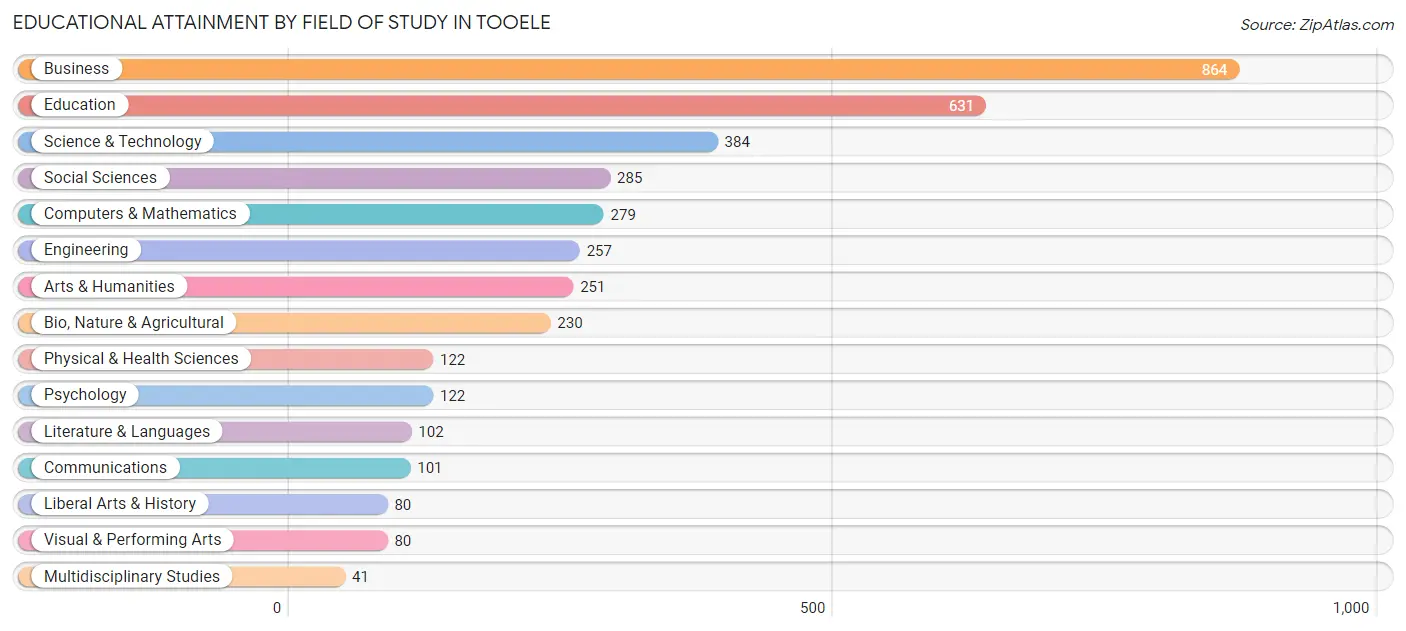
| Field of Study | # Graduates | % Graduates |
| Computers & Mathematics | 279 | 7.3% |
| Bio, Nature & Agricultural | 230 | 6.0% |
| Physical & Health Sciences | 122 | 3.2% |
| Psychology | 122 | 3.2% |
| Social Sciences | 285 | 7.4% |
| Engineering | 257 | 6.7% |
| Multidisciplinary Studies | 41 | 1.1% |
| Science & Technology | 384 | 10.0% |
| Business | 864 | 22.6% |
| Education | 631 | 16.5% |
| Literature & Languages | 102 | 2.7% |
| Liberal Arts & History | 80 | 2.1% |
| Visual & Performing Arts | 80 | 2.1% |
| Communications | 101 | 2.6% |
| Arts & Humanities | 251 | 6.6% |
| Total | 3,829 | 100.0% |
Transportation & Commute in Tooele
Vehicle Availability by Sex in Tooele
The most prevalent vehicle ownership categories in Tooele are males with 3 vehicles (3,427, accounting for 33.2%) and females with 3 vehicles (2,498, making up 44.7%).
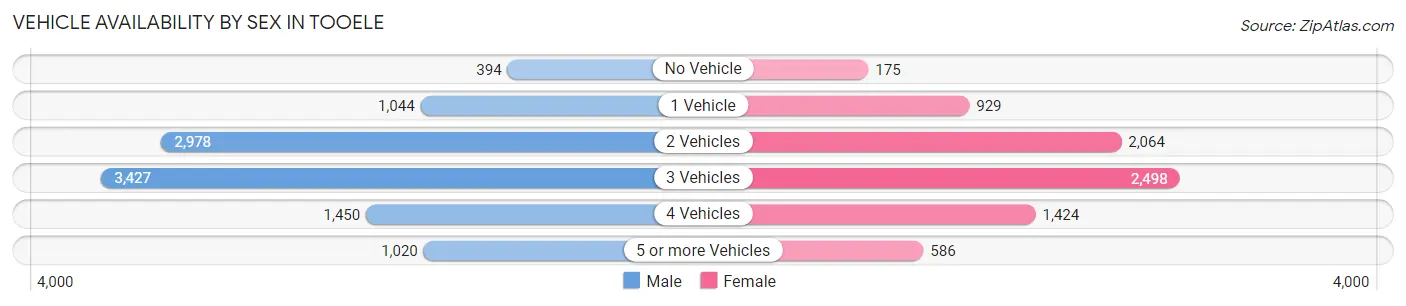
| Vehicles Available | Male | Female |
| No Vehicle | 394 (3.8%) | 175 (2.3%) |
| 1 Vehicle | 1,044 (10.1%) | 929 (12.1%) |
| 2 Vehicles | 2,978 (28.9%) | 2,064 (26.9%) |
| 3 Vehicles | 3,427 (33.2%) | 2,498 (32.5%) |
| 4 Vehicles | 1,450 (14.1%) | 1,424 (18.5%) |
| 5 or more Vehicles | 1,020 (9.9%) | 586 (7.6%) |
| Total | 10,313 (100.0%) | 7,676 (100.0%) |
Commute Time in Tooele
The most frequently occuring commute durations in Tooele are 45 to 59 minutes (3,242 commuters, 19.8%), 60 to 89 minutes (2,183 commuters, 13.3%), and 5 to 9 minutes (1,895 commuters, 11.6%).
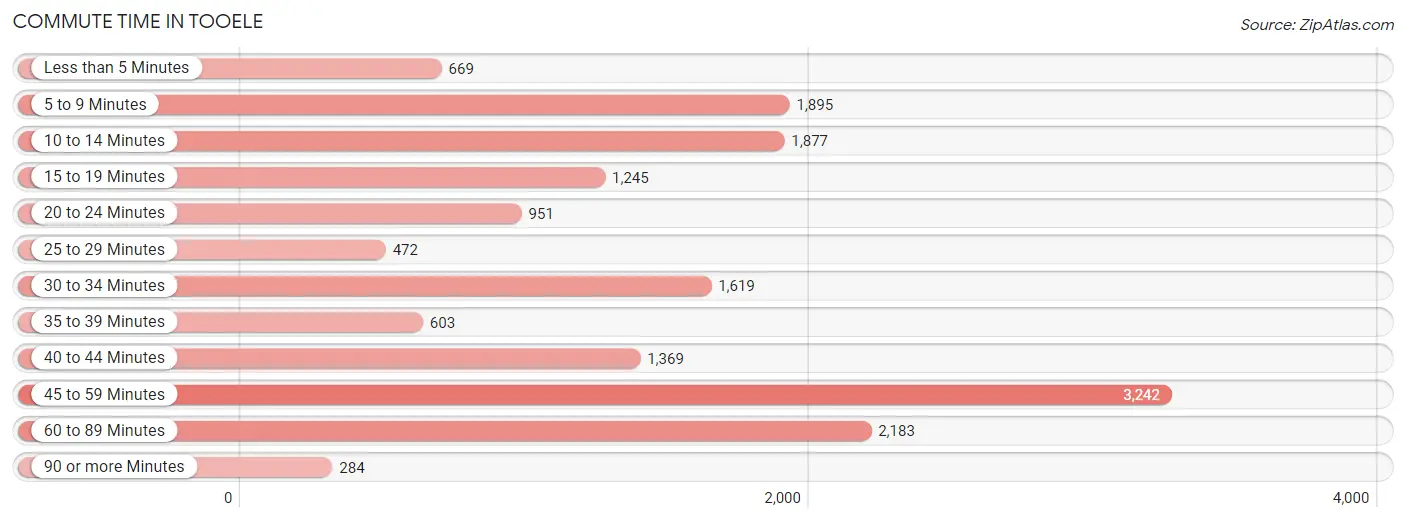
| Commute Time | # Commuters | % Commuters |
| Less than 5 Minutes | 669 | 4.1% |
| 5 to 9 Minutes | 1,895 | 11.6% |
| 10 to 14 Minutes | 1,877 | 11.4% |
| 15 to 19 Minutes | 1,245 | 7.6% |
| 20 to 24 Minutes | 951 | 5.8% |
| 25 to 29 Minutes | 472 | 2.9% |
| 30 to 34 Minutes | 1,619 | 9.9% |
| 35 to 39 Minutes | 603 | 3.7% |
| 40 to 44 Minutes | 1,369 | 8.3% |
| 45 to 59 Minutes | 3,242 | 19.8% |
| 60 to 89 Minutes | 2,183 | 13.3% |
| 90 or more Minutes | 284 | 1.7% |
Commute Time by Sex in Tooele
The most common commute times in Tooele are 45 to 59 minutes (1,856 commuters, 19.2%) for males and 45 to 59 minutes (1,386 commuters, 20.6%) for females.
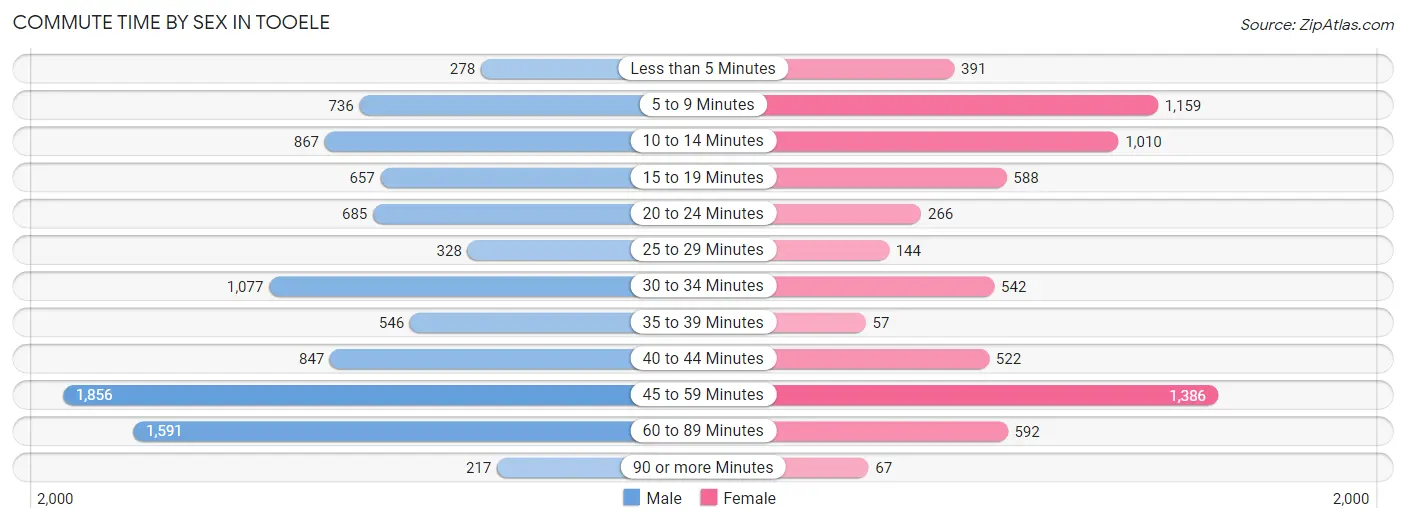
| Commute Time | Male | Female |
| Less than 5 Minutes | 278 (2.9%) | 391 (5.8%) |
| 5 to 9 Minutes | 736 (7.6%) | 1,159 (17.2%) |
| 10 to 14 Minutes | 867 (8.9%) | 1,010 (15.0%) |
| 15 to 19 Minutes | 657 (6.8%) | 588 (8.7%) |
| 20 to 24 Minutes | 685 (7.1%) | 266 (4.0%) |
| 25 to 29 Minutes | 328 (3.4%) | 144 (2.1%) |
| 30 to 34 Minutes | 1,077 (11.1%) | 542 (8.1%) |
| 35 to 39 Minutes | 546 (5.6%) | 57 (0.9%) |
| 40 to 44 Minutes | 847 (8.7%) | 522 (7.8%) |
| 45 to 59 Minutes | 1,856 (19.2%) | 1,386 (20.6%) |
| 60 to 89 Minutes | 1,591 (16.4%) | 592 (8.8%) |
| 90 or more Minutes | 217 (2.2%) | 67 (1.0%) |
Time of Departure to Work by Sex in Tooele
The most frequent times of departure to work in Tooele are 6:00 AM to 6:29 AM (1,402, 14.5%) for males and 7:00 AM to 7:29 AM (1,106, 16.5%) for females.
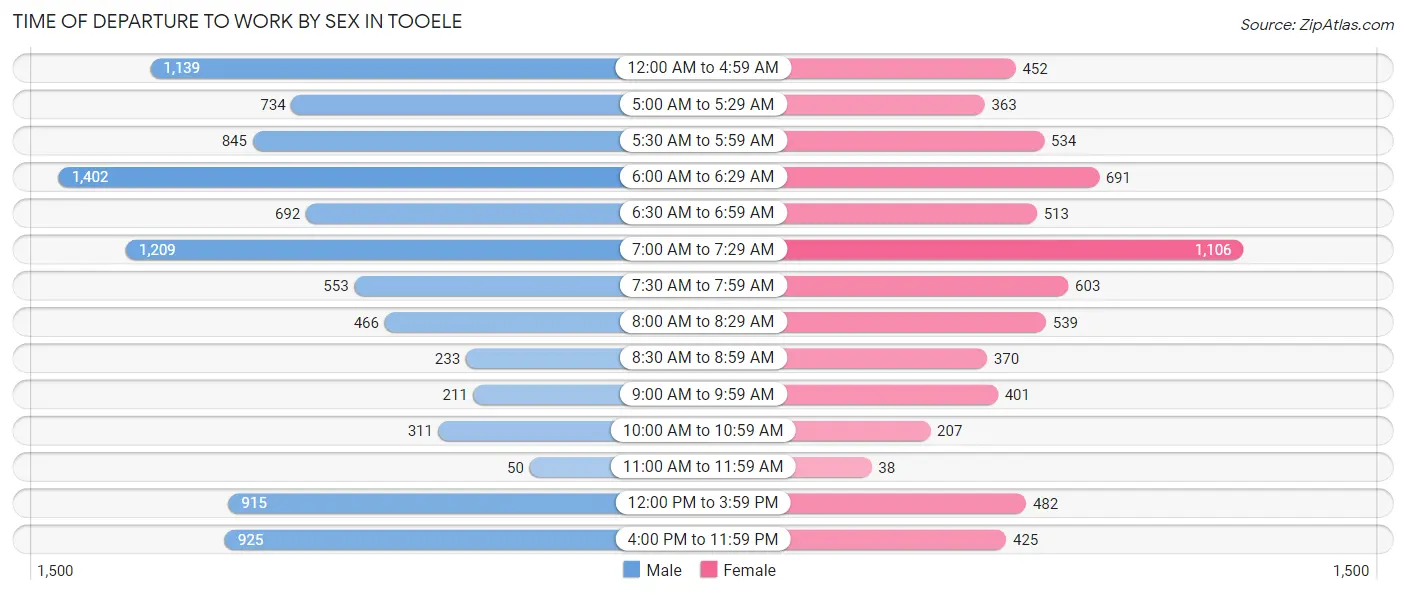
| Time of Departure | Male | Female |
| 12:00 AM to 4:59 AM | 1,139 (11.8%) | 452 (6.7%) |
| 5:00 AM to 5:29 AM | 734 (7.6%) | 363 (5.4%) |
| 5:30 AM to 5:59 AM | 845 (8.7%) | 534 (7.9%) |
| 6:00 AM to 6:29 AM | 1,402 (14.5%) | 691 (10.3%) |
| 6:30 AM to 6:59 AM | 692 (7.1%) | 513 (7.6%) |
| 7:00 AM to 7:29 AM | 1,209 (12.5%) | 1,106 (16.5%) |
| 7:30 AM to 7:59 AM | 553 (5.7%) | 603 (9.0%) |
| 8:00 AM to 8:29 AM | 466 (4.8%) | 539 (8.0%) |
| 8:30 AM to 8:59 AM | 233 (2.4%) | 370 (5.5%) |
| 9:00 AM to 9:59 AM | 211 (2.2%) | 401 (6.0%) |
| 10:00 AM to 10:59 AM | 311 (3.2%) | 207 (3.1%) |
| 11:00 AM to 11:59 AM | 50 (0.5%) | 38 (0.6%) |
| 12:00 PM to 3:59 PM | 915 (9.5%) | 482 (7.2%) |
| 4:00 PM to 11:59 PM | 925 (9.6%) | 425 (6.3%) |
| Total | 9,685 (100.0%) | 6,724 (100.0%) |
Housing Occupancy in Tooele
Occupancy by Ownership in Tooele
Of the total 11,673 dwellings in Tooele, owner-occupied units account for 9,438 (80.8%), while renter-occupied units make up 2,235 (19.2%).
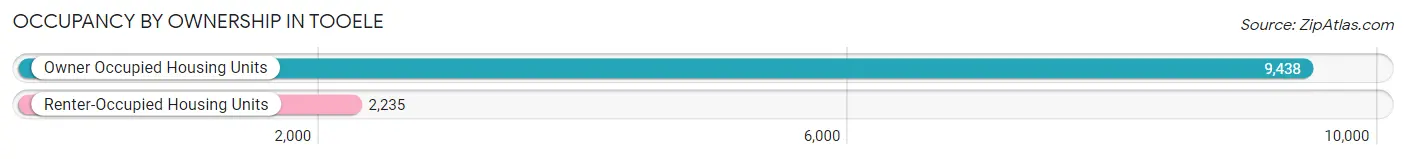
| Occupancy | # Housing Units | % Housing Units |
| Owner Occupied Housing Units | 9,438 | 80.8% |
| Renter-Occupied Housing Units | 2,235 | 19.2% |
| Total Occupied Housing Units | 11,673 | 100.0% |
Occupancy by Household Size in Tooele
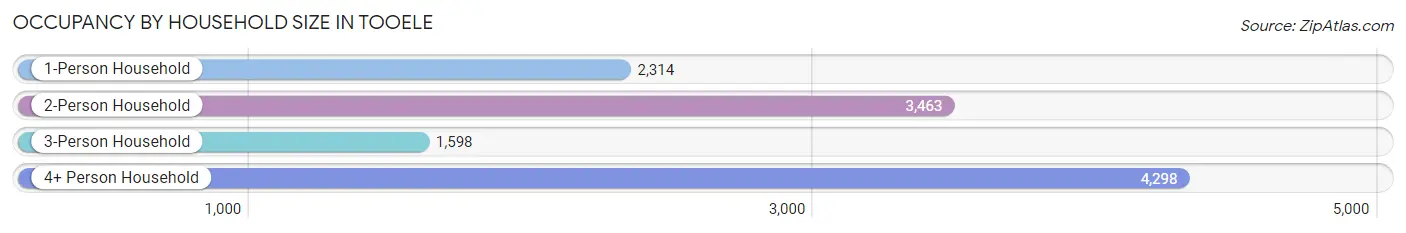
| Household Size | # Housing Units | % Housing Units |
| 1-Person Household | 2,314 | 19.8% |
| 2-Person Household | 3,463 | 29.7% |
| 3-Person Household | 1,598 | 13.7% |
| 4+ Person Household | 4,298 | 36.8% |
| Total Housing Units | 11,673 | 100.0% |
Occupancy by Ownership by Household Size in Tooele
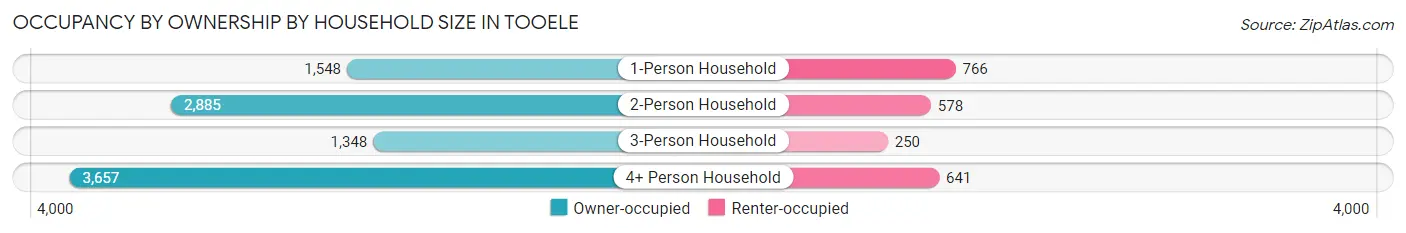
| Household Size | Owner-occupied | Renter-occupied |
| 1-Person Household | 1,548 (66.9%) | 766 (33.1%) |
| 2-Person Household | 2,885 (83.3%) | 578 (16.7%) |
| 3-Person Household | 1,348 (84.4%) | 250 (15.6%) |
| 4+ Person Household | 3,657 (85.1%) | 641 (14.9%) |
| Total Housing Units | 9,438 (80.8%) | 2,235 (19.2%) |
Occupancy by Educational Attainment in Tooele
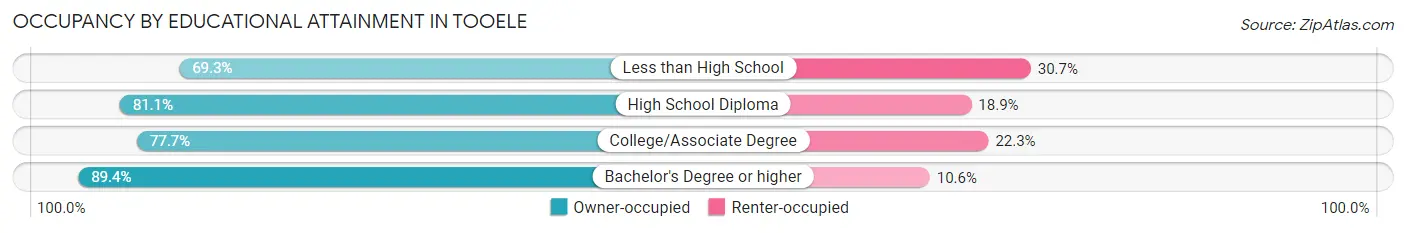
| Household Size | Owner-occupied | Renter-occupied |
| Less than High School | 355 (69.3%) | 157 (30.7%) |
| High School Diploma | 3,846 (81.1%) | 895 (18.9%) |
| College/Associate Degree | 3,346 (77.7%) | 958 (22.3%) |
| Bachelor's Degree or higher | 1,891 (89.4%) | 225 (10.6%) |
Occupancy by Age of Householder in Tooele
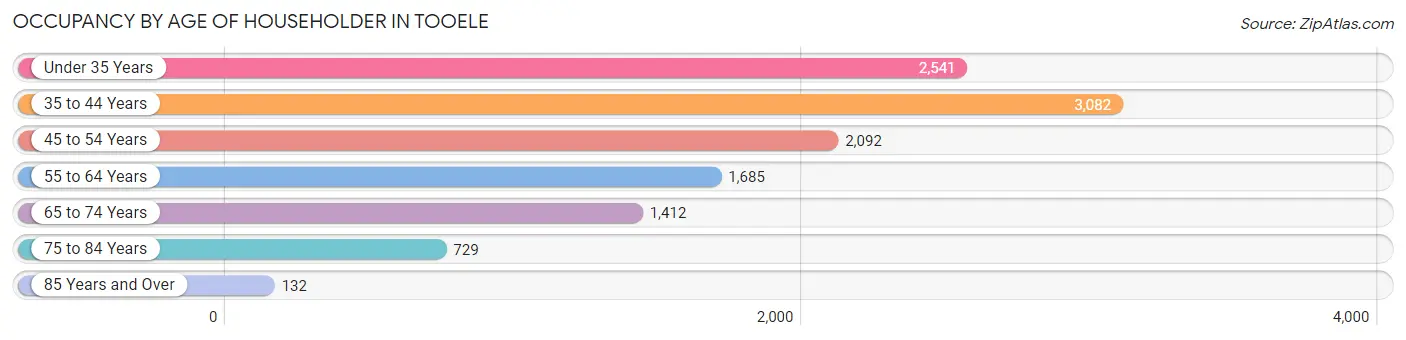
| Age Bracket | # Households | % Households |
| Under 35 Years | 2,541 | 21.8% |
| 35 to 44 Years | 3,082 | 26.4% |
| 45 to 54 Years | 2,092 | 17.9% |
| 55 to 64 Years | 1,685 | 14.4% |
| 65 to 74 Years | 1,412 | 12.1% |
| 75 to 84 Years | 729 | 6.2% |
| 85 Years and Over | 132 | 1.1% |
| Total | 11,673 | 100.0% |
Housing Finances in Tooele
Median Income by Occupancy in Tooele
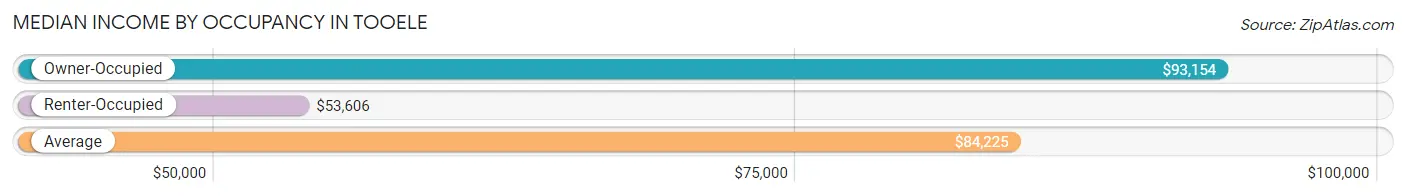
| Occupancy Type | # Households | Median Income |
| Owner-Occupied | 9,438 (80.8%) | $93,154 |
| Renter-Occupied | 2,235 (19.2%) | $53,606 |
| Average | 11,673 (100.0%) | $84,225 |
Occupancy by Householder Income Bracket in Tooele
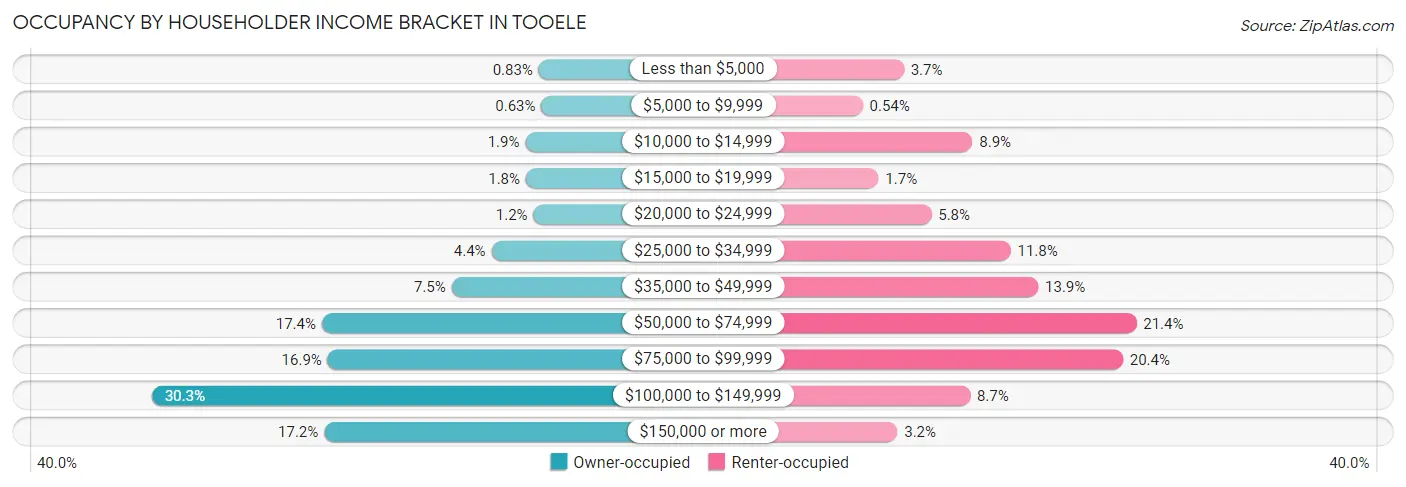
| Income Bracket | Owner-occupied | Renter-occupied |
| Less than $5,000 | 78 (0.8%) | 82 (3.7%) |
| $5,000 to $9,999 | 59 (0.6%) | 12 (0.5%) |
| $10,000 to $14,999 | 175 (1.8%) | 199 (8.9%) |
| $15,000 to $19,999 | 171 (1.8%) | 39 (1.7%) |
| $20,000 to $24,999 | 116 (1.2%) | 129 (5.8%) |
| $25,000 to $34,999 | 418 (4.4%) | 264 (11.8%) |
| $35,000 to $49,999 | 705 (7.5%) | 311 (13.9%) |
| $50,000 to $74,999 | 1,638 (17.4%) | 478 (21.4%) |
| $75,000 to $99,999 | 1,596 (16.9%) | 455 (20.4%) |
| $100,000 to $149,999 | 2,861 (30.3%) | 195 (8.7%) |
| $150,000 or more | 1,621 (17.2%) | 71 (3.2%) |
| Total | 9,438 (100.0%) | 2,235 (100.0%) |
Monthly Housing Cost Tiers in Tooele
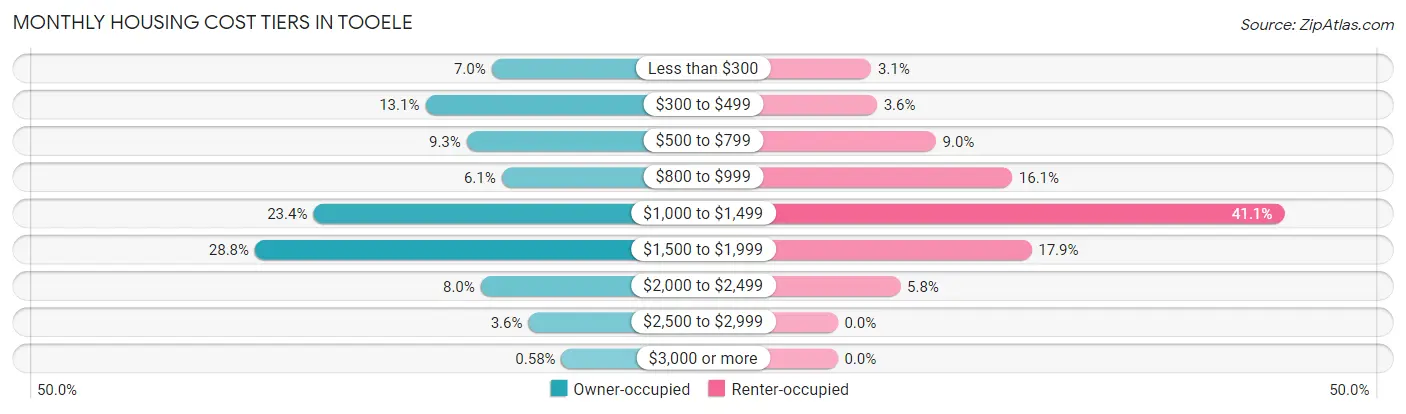
| Monthly Cost | Owner-occupied | Renter-occupied |
| Less than $300 | 662 (7.0%) | 69 (3.1%) |
| $300 to $499 | 1,238 (13.1%) | 81 (3.6%) |
| $500 to $799 | 879 (9.3%) | 202 (9.0%) |
| $800 to $999 | 575 (6.1%) | 359 (16.1%) |
| $1,000 to $1,499 | 2,211 (23.4%) | 919 (41.1%) |
| $1,500 to $1,999 | 2,718 (28.8%) | 399 (17.8%) |
| $2,000 to $2,499 | 757 (8.0%) | 129 (5.8%) |
| $2,500 to $2,999 | 343 (3.6%) | 0 (0.0%) |
| $3,000 or more | 55 (0.6%) | 0 (0.0%) |
| Total | 9,438 (100.0%) | 2,235 (100.0%) |
Physical Housing Characteristics in Tooele
Housing Structures in Tooele
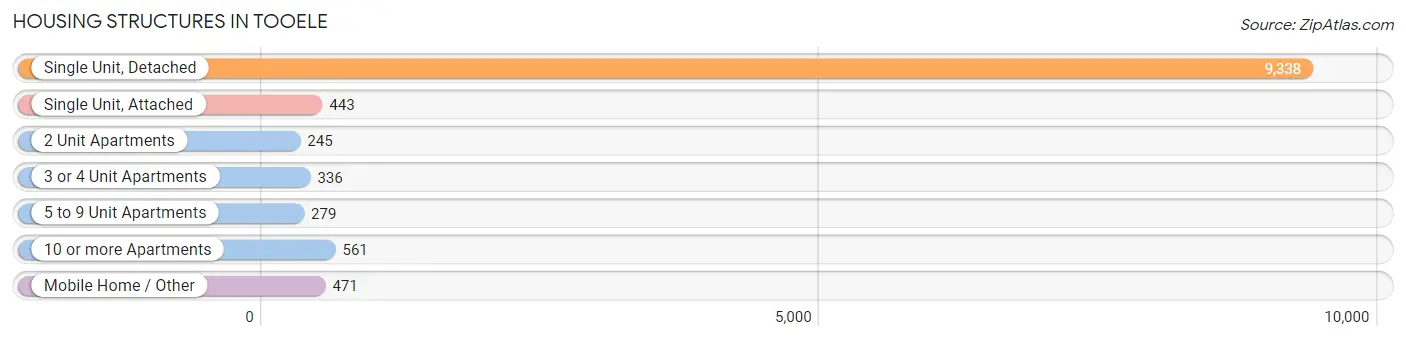
| Structure Type | # Housing Units | % Housing Units |
| Single Unit, Detached | 9,338 | 80.0% |
| Single Unit, Attached | 443 | 3.8% |
| 2 Unit Apartments | 245 | 2.1% |
| 3 or 4 Unit Apartments | 336 | 2.9% |
| 5 to 9 Unit Apartments | 279 | 2.4% |
| 10 or more Apartments | 561 | 4.8% |
| Mobile Home / Other | 471 | 4.0% |
| Total | 11,673 | 100.0% |
Housing Structures by Occupancy in Tooele
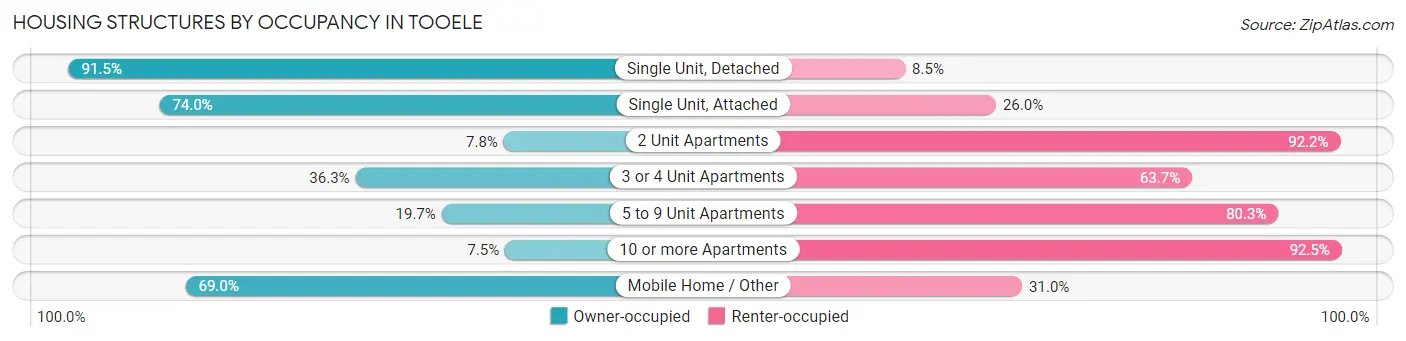
| Structure Type | Owner-occupied | Renter-occupied |
| Single Unit, Detached | 8,547 (91.5%) | 791 (8.5%) |
| Single Unit, Attached | 328 (74.0%) | 115 (26.0%) |
| 2 Unit Apartments | 19 (7.8%) | 226 (92.2%) |
| 3 or 4 Unit Apartments | 122 (36.3%) | 214 (63.7%) |
| 5 to 9 Unit Apartments | 55 (19.7%) | 224 (80.3%) |
| 10 or more Apartments | 42 (7.5%) | 519 (92.5%) |
| Mobile Home / Other | 325 (69.0%) | 146 (31.0%) |
| Total | 9,438 (80.8%) | 2,235 (19.2%) |
Housing Structures by Number of Rooms in Tooele
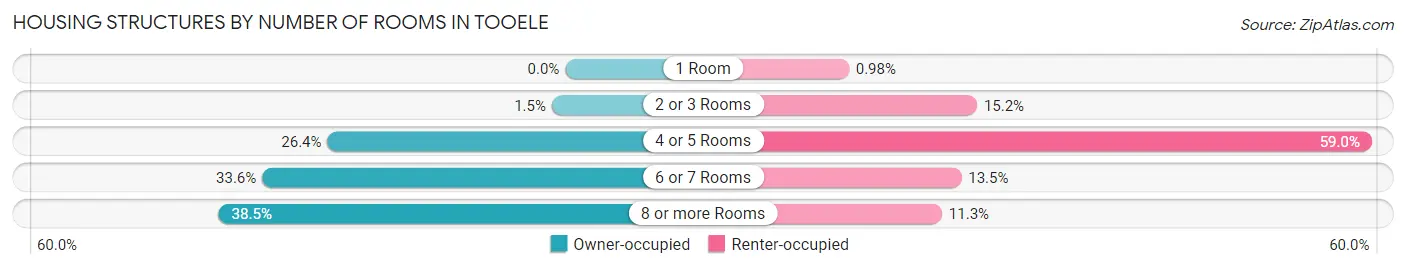
| Number of Rooms | Owner-occupied | Renter-occupied |
| 1 Room | 0 (0.0%) | 22 (1.0%) |
| 2 or 3 Rooms | 141 (1.5%) | 340 (15.2%) |
| 4 or 5 Rooms | 2,492 (26.4%) | 1,319 (59.0%) |
| 6 or 7 Rooms | 3,175 (33.6%) | 301 (13.5%) |
| 8 or more Rooms | 3,630 (38.5%) | 253 (11.3%) |
| Total | 9,438 (100.0%) | 2,235 (100.0%) |
Housing Structure by Heating Type in Tooele
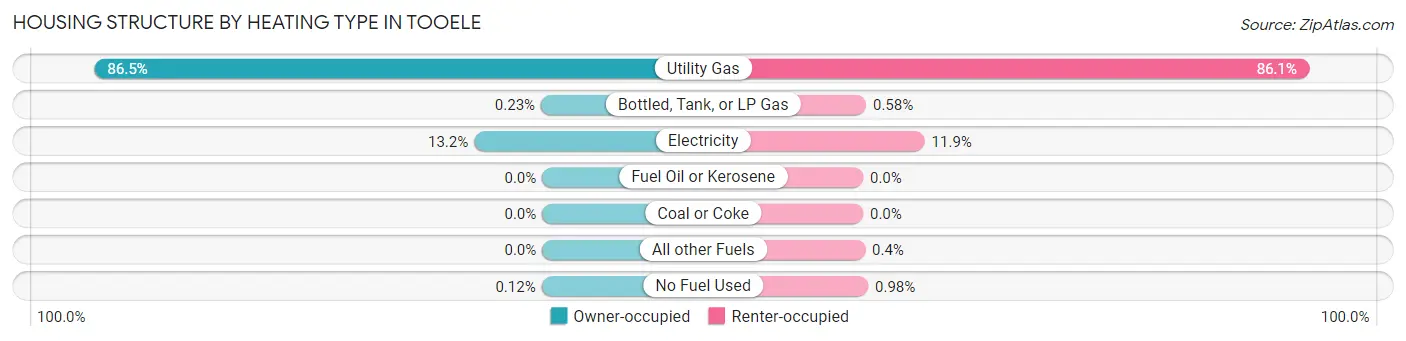
| Heating Type | Owner-occupied | Renter-occupied |
| Utility Gas | 8,164 (86.5%) | 1,925 (86.1%) |
| Bottled, Tank, or LP Gas | 22 (0.2%) | 13 (0.6%) |
| Electricity | 1,241 (13.2%) | 266 (11.9%) |
| Fuel Oil or Kerosene | 0 (0.0%) | 0 (0.0%) |
| Coal or Coke | 0 (0.0%) | 0 (0.0%) |
| All other Fuels | 0 (0.0%) | 9 (0.4%) |
| No Fuel Used | 11 (0.1%) | 22 (1.0%) |
| Total | 9,438 (100.0%) | 2,235 (100.0%) |
Household Vehicle Usage in Tooele
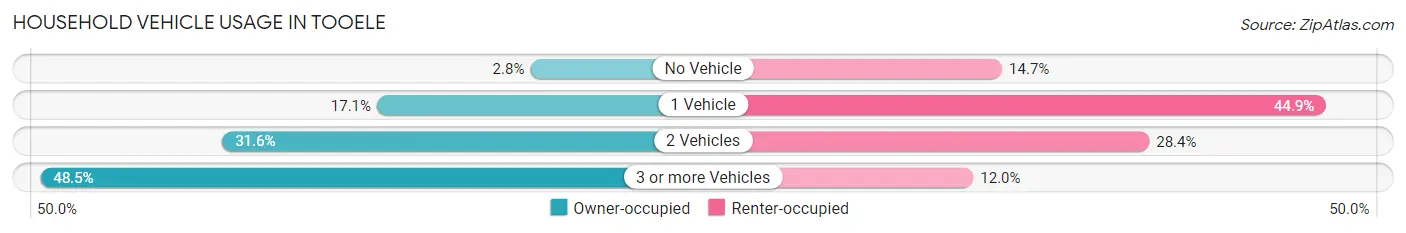
| Vehicles per Household | Owner-occupied | Renter-occupied |
| No Vehicle | 264 (2.8%) | 328 (14.7%) |
| 1 Vehicle | 1,616 (17.1%) | 1,004 (44.9%) |
| 2 Vehicles | 2,978 (31.6%) | 635 (28.4%) |
| 3 or more Vehicles | 4,580 (48.5%) | 268 (12.0%) |
| Total | 9,438 (100.0%) | 2,235 (100.0%) |
Real Estate & Mortgages in Tooele
Real Estate and Mortgage Overview in Tooele
| Characteristic | Without Mortgage | With Mortgage |
| Housing Units | 2,397 | 7,041 |
| Median Property Value | $254,700 | $303,200 |
| Median Household Income | $67,473 | $1,241 |
| Monthly Housing Costs | $381 | $55 |
| Real Estate Taxes | $1,493 | $167 |
Property Value by Mortgage Status in Tooele
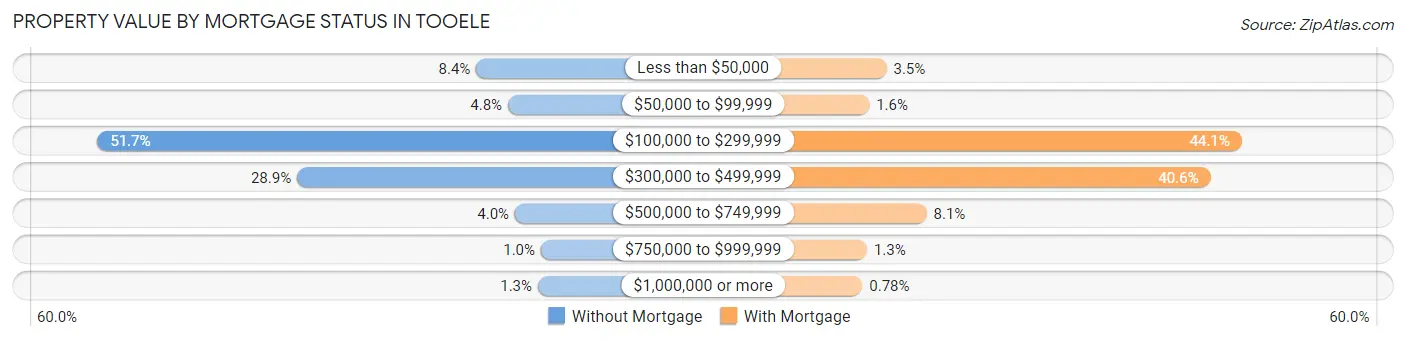
| Property Value | Without Mortgage | With Mortgage |
| Less than $50,000 | 201 (8.4%) | 249 (3.5%) |
| $50,000 to $99,999 | 114 (4.8%) | 110 (1.6%) |
| $100,000 to $299,999 | 1,239 (51.7%) | 3,107 (44.1%) |
| $300,000 to $499,999 | 692 (28.9%) | 2,856 (40.6%) |
| $500,000 to $749,999 | 95 (4.0%) | 572 (8.1%) |
| $750,000 to $999,999 | 24 (1.0%) | 92 (1.3%) |
| $1,000,000 or more | 32 (1.3%) | 55 (0.8%) |
| Total | 2,397 (100.0%) | 7,041 (100.0%) |
Household Income by Mortgage Status in Tooele
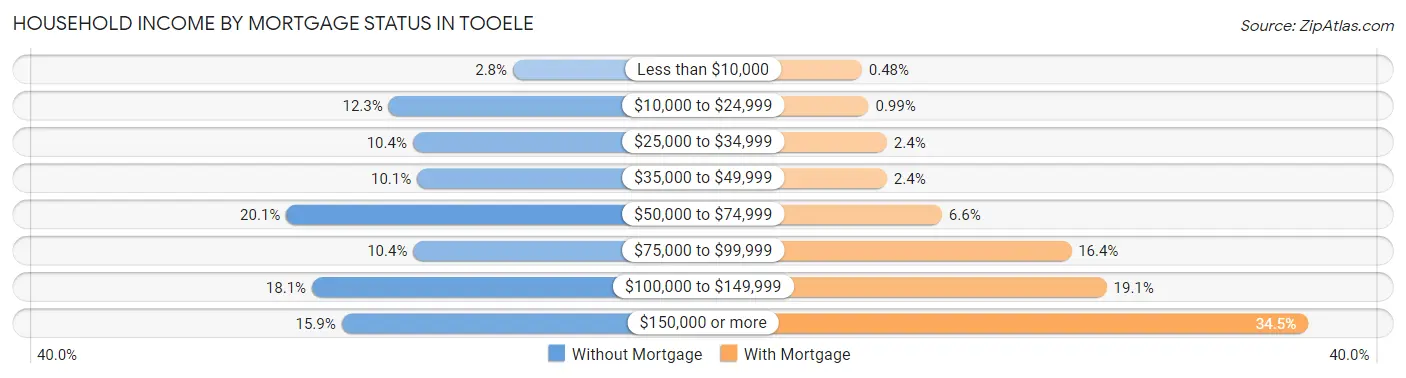
| Household Income | Without Mortgage | With Mortgage |
| Less than $10,000 | 67 (2.8%) | 34 (0.5%) |
| $10,000 to $24,999 | 294 (12.3%) | 70 (1.0%) |
| $25,000 to $34,999 | 250 (10.4%) | 168 (2.4%) |
| $35,000 to $49,999 | 242 (10.1%) | 168 (2.4%) |
| $50,000 to $74,999 | 481 (20.1%) | 463 (6.6%) |
| $75,000 to $99,999 | 249 (10.4%) | 1,157 (16.4%) |
| $100,000 to $149,999 | 434 (18.1%) | 1,347 (19.1%) |
| $150,000 or more | 380 (15.9%) | 2,427 (34.5%) |
| Total | 2,397 (100.0%) | 7,041 (100.0%) |
Property Value to Household Income Ratio in Tooele
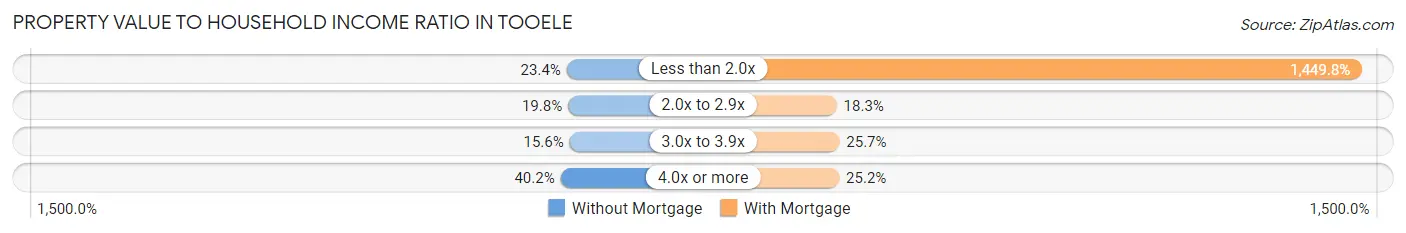
| Value-to-Income Ratio | Without Mortgage | With Mortgage |
| Less than 2.0x | 561 (23.4%) | 102,083 (1,449.8%) |
| 2.0x to 2.9x | 474 (19.8%) | 1,290 (18.3%) |
| 3.0x to 3.9x | 373 (15.6%) | 1,809 (25.7%) |
| 4.0x or more | 963 (40.2%) | 1,775 (25.2%) |
| Total | 2,397 (100.0%) | 7,041 (100.0%) |
Real Estate Taxes by Mortgage Status in Tooele
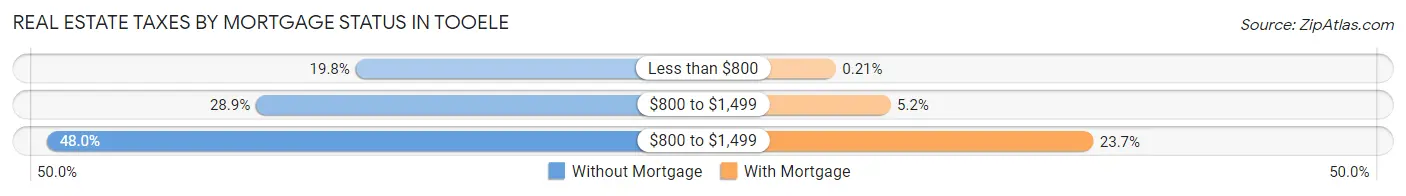
| Property Taxes | Without Mortgage | With Mortgage |
| Less than $800 | 474 (19.8%) | 15 (0.2%) |
| $800 to $1,499 | 692 (28.9%) | 367 (5.2%) |
| $800 to $1,499 | 1,150 (48.0%) | 1,671 (23.7%) |
| Total | 2,397 (100.0%) | 7,041 (100.0%) |
Health & Disability in Tooele
Health Insurance Coverage by Age in Tooele
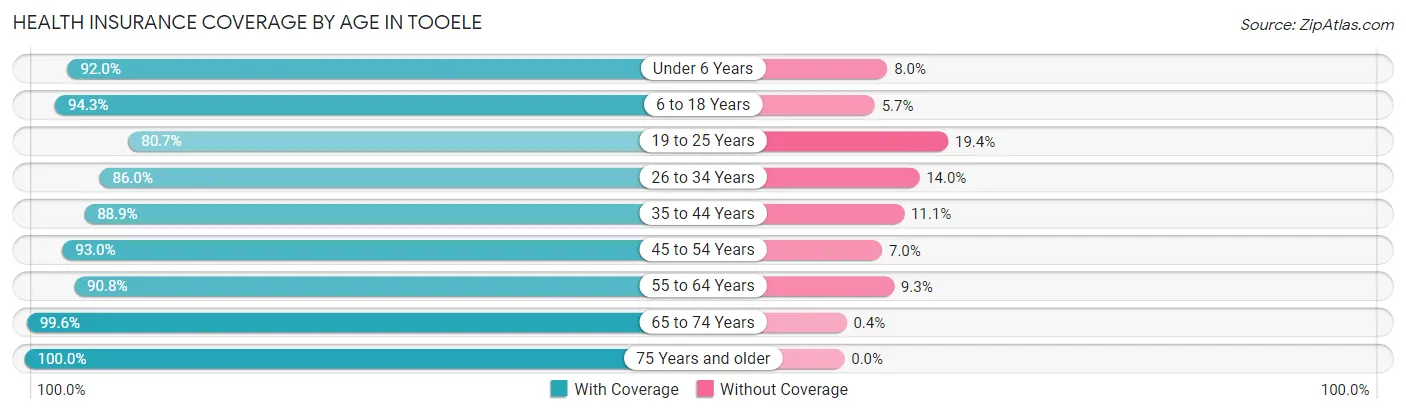
| Age Bracket | With Coverage | Without Coverage |
| Under 6 Years | 3,151 (92.0%) | 274 (8.0%) |
| 6 to 18 Years | 7,721 (94.3%) | 465 (5.7%) |
| 19 to 25 Years | 2,776 (80.6%) | 666 (19.4%) |
| 26 to 34 Years | 3,647 (86.0%) | 592 (14.0%) |
| 35 to 44 Years | 5,326 (88.9%) | 667 (11.1%) |
| 45 to 54 Years | 3,669 (93.0%) | 278 (7.0%) |
| 55 to 64 Years | 2,786 (90.7%) | 284 (9.2%) |
| 65 to 74 Years | 2,248 (99.6%) | 9 (0.4%) |
| 75 Years and older | 1,414 (100.0%) | 0 (0.0%) |
| Total | 32,738 (91.0%) | 3,235 (9.0%) |
Health Insurance Coverage by Citizenship Status in Tooele
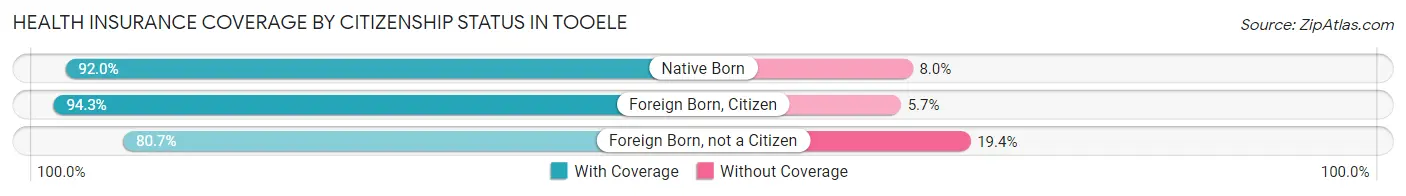
| Citizenship Status | With Coverage | Without Coverage |
| Native Born | 3,151 (92.0%) | 274 (8.0%) |
| Foreign Born, Citizen | 7,721 (94.3%) | 465 (5.7%) |
| Foreign Born, not a Citizen | 2,776 (80.6%) | 666 (19.4%) |
Health Insurance Coverage by Household Income in Tooele
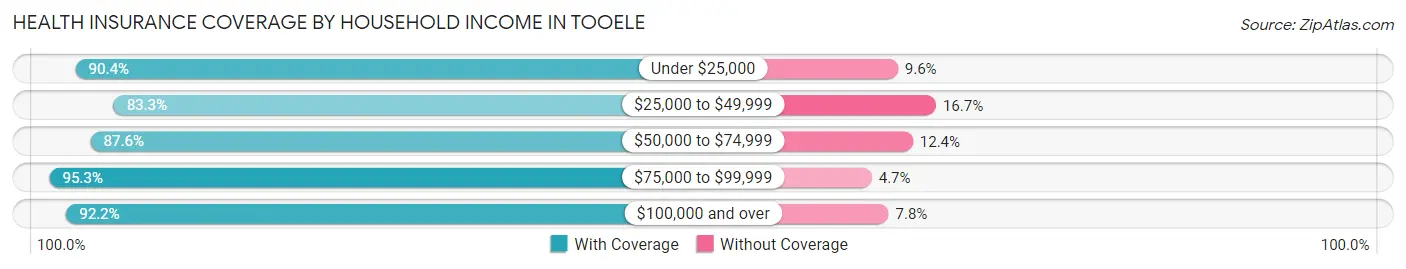
| Household Income | With Coverage | Without Coverage |
| Under $25,000 | 1,380 (90.4%) | 146 (9.6%) |
| $25,000 to $49,999 | 2,920 (83.3%) | 586 (16.7%) |
| $50,000 to $74,999 | 5,605 (87.6%) | 792 (12.4%) |
| $75,000 to $99,999 | 6,375 (95.3%) | 313 (4.7%) |
| $100,000 and over | 16,458 (92.2%) | 1,398 (7.8%) |
Public vs Private Health Insurance Coverage by Age in Tooele
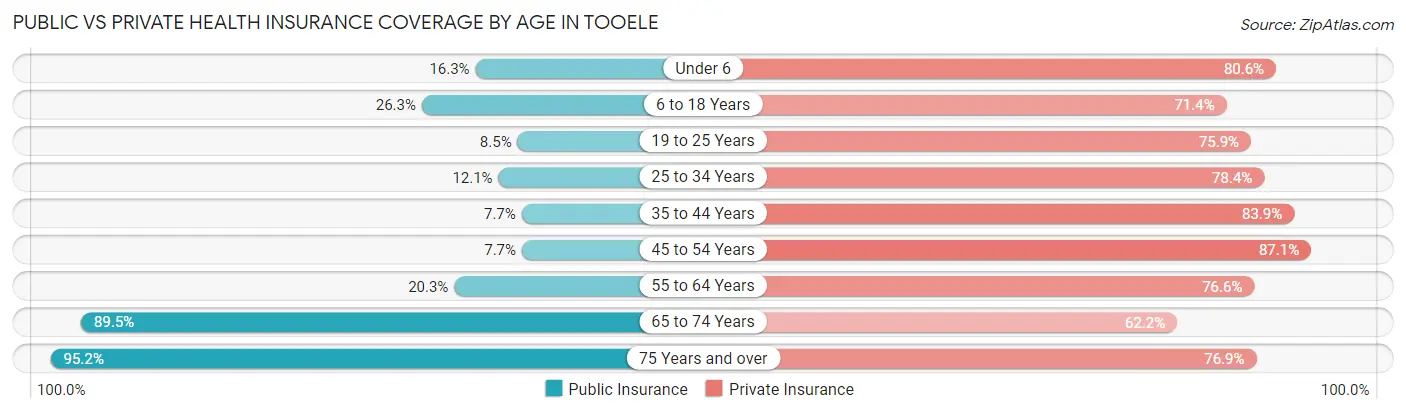
| Age Bracket | Public Insurance | Private Insurance |
| Under 6 | 559 (16.3%) | 2,760 (80.6%) |
| 6 to 18 Years | 2,151 (26.3%) | 5,845 (71.4%) |
| 19 to 25 Years | 293 (8.5%) | 2,614 (75.9%) |
| 25 to 34 Years | 511 (12.0%) | 3,323 (78.4%) |
| 35 to 44 Years | 464 (7.7%) | 5,030 (83.9%) |
| 45 to 54 Years | 304 (7.7%) | 3,437 (87.1%) |
| 55 to 64 Years | 622 (20.3%) | 2,350 (76.5%) |
| 65 to 74 Years | 2,021 (89.5%) | 1,404 (62.2%) |
| 75 Years and over | 1,346 (95.2%) | 1,088 (76.9%) |
| Total | 8,271 (23.0%) | 27,851 (77.4%) |
Disability Status by Sex by Age in Tooele
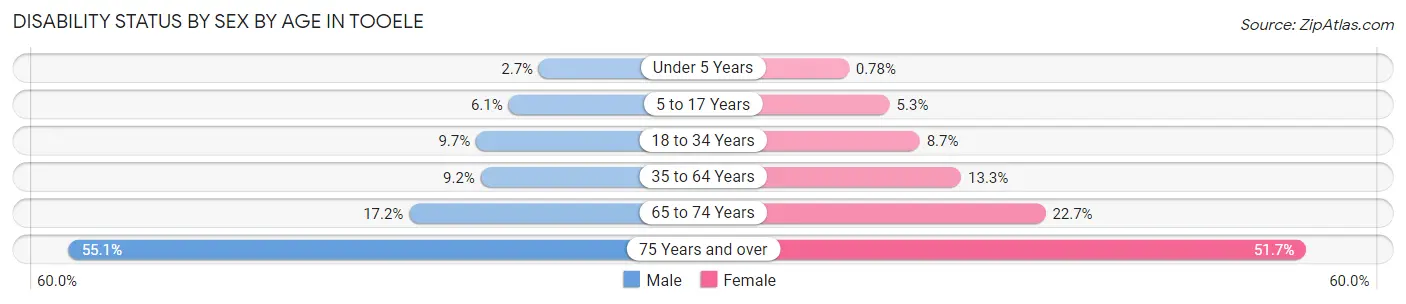
| Age Bracket | Male | Female |
| Under 5 Years | 34 (2.7%) | 11 (0.8%) |
| 5 to 17 Years | 261 (6.1%) | 210 (5.3%) |
| 18 to 34 Years | 439 (9.7%) | 338 (8.7%) |
| 35 to 64 Years | 618 (9.2%) | 837 (13.3%) |
| 65 to 74 Years | 171 (17.2%) | 286 (22.7%) |
| 75 Years and over | 325 (55.1%) | 426 (51.7%) |
Disability Class by Sex by Age in Tooele
Disability Class: Hearing Difficulty
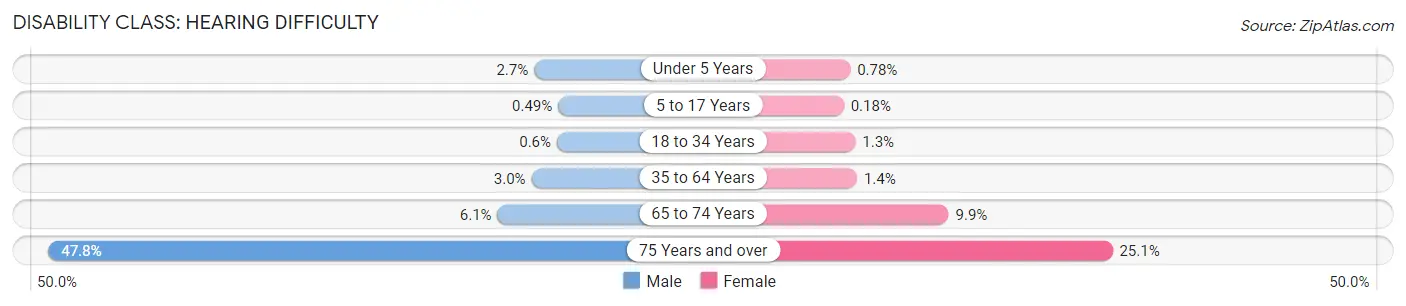
| Age Bracket | Male | Female |
| Under 5 Years | 34 (2.7%) | 11 (0.8%) |
| 5 to 17 Years | 21 (0.5%) | 7 (0.2%) |
| 18 to 34 Years | 27 (0.6%) | 49 (1.3%) |
| 35 to 64 Years | 199 (3.0%) | 89 (1.4%) |
| 65 to 74 Years | 61 (6.1%) | 125 (9.9%) |
| 75 Years and over | 282 (47.8%) | 207 (25.1%) |
Disability Class: Vision Difficulty
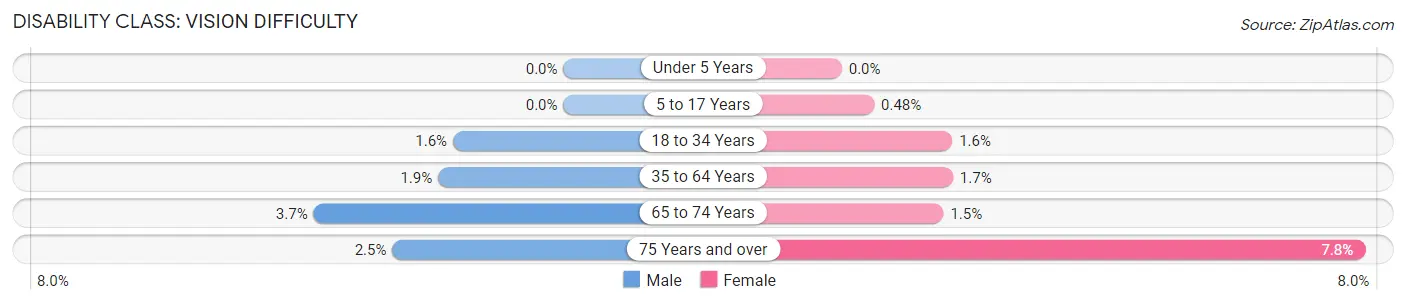
| Age Bracket | Male | Female |
| Under 5 Years | 0 (0.0%) | 0 (0.0%) |
| 5 to 17 Years | 0 (0.0%) | 19 (0.5%) |
| 18 to 34 Years | 74 (1.6%) | 64 (1.6%) |
| 35 to 64 Years | 125 (1.9%) | 104 (1.7%) |
| 65 to 74 Years | 37 (3.7%) | 19 (1.5%) |
| 75 Years and over | 15 (2.5%) | 64 (7.8%) |
Disability Class: Cognitive Difficulty
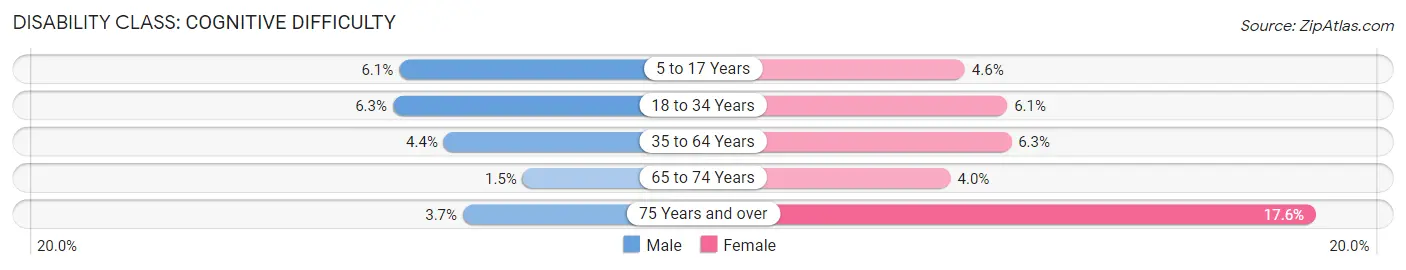
| Age Bracket | Male | Female |
| 5 to 17 Years | 261 (6.1%) | 180 (4.6%) |
| 18 to 34 Years | 286 (6.3%) | 239 (6.1%) |
| 35 to 64 Years | 298 (4.4%) | 396 (6.3%) |
| 65 to 74 Years | 15 (1.5%) | 51 (4.0%) |
| 75 Years and over | 22 (3.7%) | 145 (17.6%) |
Disability Class: Ambulatory Difficulty
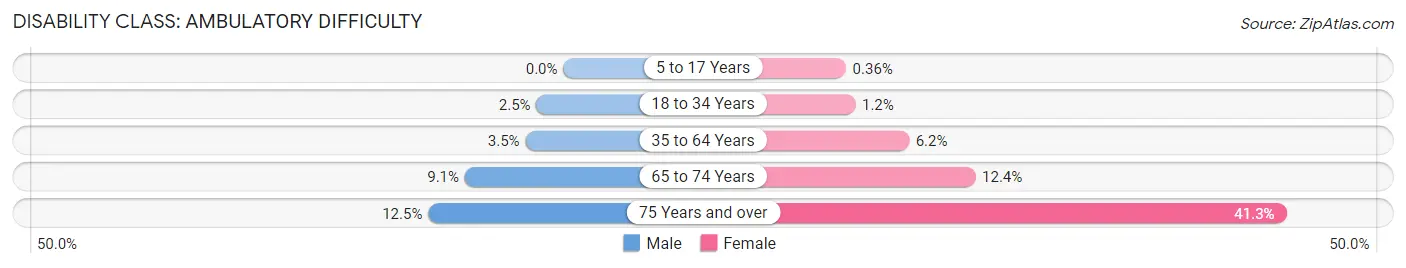
| Age Bracket | Male | Female |
| 5 to 17 Years | 0 (0.0%) | 14 (0.4%) |
| 18 to 34 Years | 113 (2.5%) | 48 (1.2%) |
| 35 to 64 Years | 236 (3.5%) | 391 (6.2%) |
| 65 to 74 Years | 91 (9.1%) | 156 (12.4%) |
| 75 Years and over | 74 (12.5%) | 340 (41.3%) |
Disability Class: Self-Care Difficulty
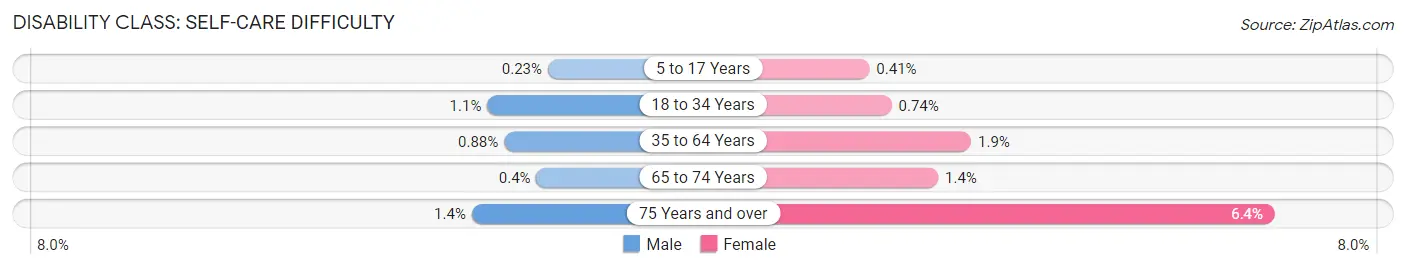
| Age Bracket | Male | Female |
| 5 to 17 Years | 10 (0.2%) | 16 (0.4%) |
| 18 to 34 Years | 51 (1.1%) | 29 (0.7%) |
| 35 to 64 Years | 59 (0.9%) | 121 (1.9%) |
| 65 to 74 Years | 4 (0.4%) | 18 (1.4%) |
| 75 Years and over | 8 (1.4%) | 53 (6.4%) |
Technology Access in Tooele
Computing Device Access in Tooele
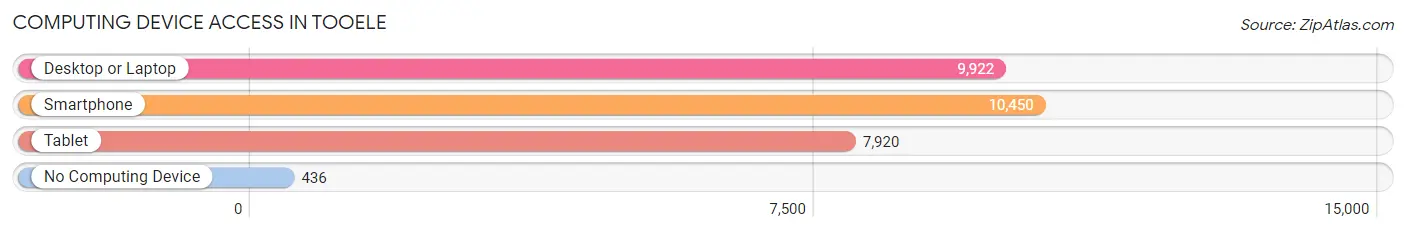
| Device Type | # Households | % Households |
| Desktop or Laptop | 9,922 | 85.0% |
| Smartphone | 10,450 | 89.5% |
| Tablet | 7,920 | 67.8% |
| No Computing Device | 436 | 3.7% |
| Total | 11,673 | 100.0% |
Internet Access in Tooele
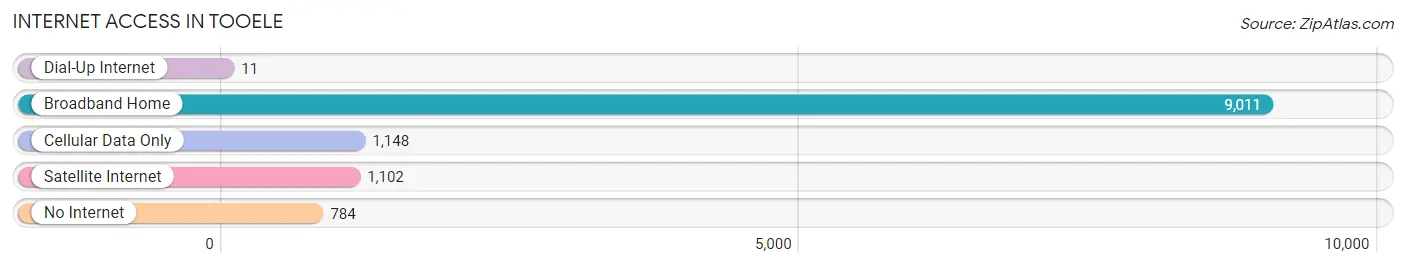
| Internet Type | # Households | % Households |
| Dial-Up Internet | 11 | 0.1% |
| Broadband Home | 9,011 | 77.2% |
| Cellular Data Only | 1,148 | 9.8% |
| Satellite Internet | 1,102 | 9.4% |
| No Internet | 784 | 6.7% |
| Total | 11,673 | 100.0% |
Tooele Summary
Tooele, Utah is a city located in Tooele County, Utah, United States. It is the county seat of Tooele County and is located about 30 miles southwest of Salt Lake City. The city has a population of approximately 33,000 people and is the largest city in Tooele County.
History
The area that is now Tooele was first inhabited by the Goshute Indians, who were nomadic hunter-gatherers. The first European settlers arrived in the area in 1849, and the city was officially incorporated in 1853. The city was named after Chief Tooele, a leader of the Goshute tribe.
In the late 19th century, Tooele became an important center for mining and smelting. The Tooele Valley Railway was built in 1869 to transport ore from the mines to the smelters. The city also became an important center for the production of military supplies during World War II.
Geography
Tooele is located in the western part of Tooele County, at the base of the Oquirrh Mountains. The city is situated at an elevation of 4,330 feet above sea level. The city covers an area of approximately 16 square miles and is bordered by the cities of Grantsville, Stansbury Park, and Lake Point.
The climate in Tooele is semi-arid, with hot summers and cold winters. The average annual temperature is approximately 50 degrees Fahrenheit. The average annual precipitation is approximately 11 inches.
Economy
The economy of Tooele is largely based on manufacturing, retail, and services. The city is home to several large manufacturing companies, including ATK, a manufacturer of aerospace and defense products, and Tooele Army Depot, a military supply depot.
The city is also home to several retail stores, including Walmart, Smith's Food and Drug, and Kmart. The city is also home to several restaurants, including McDonald's, Burger King, and Subway.
Demographics
As of the 2010 census, the population of Tooele was 33,000. The racial makeup of the city was 87.3% White, 1.3% African American, 0.7% Native American, 1.3% Asian, 0.2% Pacific Islander, 6.2% from other races, and 3.2% from two or more races. Hispanic or Latino of any race were 11.3% of the population.
The median household income in Tooele was $50,000, and the median family income was $56,000. The per capita income was $21,000. About 11.3% of the population was below the poverty line.
Conclusion
Tooele, Utah is a city located in Tooele County, Utah, United States. It is the county seat of Tooele County and is located about 30 miles southwest of Salt Lake City. The city has a population of approximately 33,000 people and is the largest city in Tooele County. The economy of Tooele is largely based on manufacturing, retail, and services. The racial makeup of the city was 87.3% White, 1.3% African American, 0.7% Native American, 1.3% Asian, 0.2% Pacific Islander, 6.2% from other races, and 3.2% from two or more races. The median household income in Tooele was $50,000, and the median family income was $56,000. The per capita income was $21,000. About 11.3% of the population was below the poverty line.
Common Questions
What is Per Capita Income in Tooele?
Per Capita income in Tooele is $30,710.
What is the Median Family Income in Tooele?
Median Family Income in Tooele is $91,706.
What is the Median Household income in Tooele?
Median Household Income in Tooele is $84,225.
What is Income or Wage Gap in Tooele?
Income or Wage Gap in Tooele is 49.7%.
Women in Tooele earn 50.3 cents for every dollar earned by a man.
What is Inequality or Gini Index in Tooele?
Inequality or Gini Index in Tooele is 0.34.
What is the Total Population of Tooele?
Total Population of Tooele is 36,315.
What is the Total Male Population of Tooele?
Total Male Population of Tooele is 18,619.
What is the Total Female Population of Tooele?
Total Female Population of Tooele is 17,696.
What is the Ratio of Males per 100 Females in Tooele?
There are 105.22 Males per 100 Females in Tooele.
What is the Ratio of Females per 100 Males in Tooele?
There are 95.04 Females per 100 Males in Tooele.
What is the Median Population Age in Tooele?
Median Population Age in Tooele is 32.0 Years.
What is the Average Family Size in Tooele
Average Family Size in Tooele is 3.6 People.
What is the Average Household Size in Tooele
Average Household Size in Tooele is 3.1 People.
How Large is the Labor Force in Tooele?
There are 18,913 People in the Labor Forcein in Tooele.
What is the Percentage of People in the Labor Force in Tooele?
71.2% of People are in the Labor Force in Tooele.
What is the Unemployment Rate in Tooele?
Unemployment Rate in Tooele is 3.9%.