Harrisville, UT Map & Demographics
Harrisville Map
Harrisville Overview
$32,111
PER CAPITA INCOME
$89,050
AVG FAMILY INCOME
$82,232
AVG HOUSEHOLD INCOME
19.0%
WAGE / INCOME GAP [ % ]
81.0¢/ $1
WAGE / INCOME GAP [ $ ]
$4,252
FAMILY INCOME DEFICIT
0.36
INEQUALITY / GINI INDEX
6,909
TOTAL POPULATION
3,447
MALE POPULATION
3,462
FEMALE POPULATION
99.57
MALES / 100 FEMALES
100.44
FEMALES / 100 MALES
28.3
MEDIAN AGE
3.5
AVG FAMILY SIZE
3.1
AVG HOUSEHOLD SIZE
3,727
LABOR FORCE [ PEOPLE ]
75.7%
PERCENT IN LABOR FORCE
2.6%
UNEMPLOYMENT RATE
Income in Harrisville
Income Overview in Harrisville
Per Capita Income in Harrisville is $32,111, while median incomes of families and households are $89,050 and $82,232 respectively.
| Characteristic | Number | Measure |
| Per Capita Income | 6,909 | $32,111 |
| Median Family Income | 1,727 | $89,050 |
| Mean Family Income | 1,727 | $101,509 |
| Median Household Income | 2,193 | $82,232 |
| Mean Household Income | 2,193 | $97,354 |
| Income Deficit | 1,727 | $4,252 |
| Wage / Income Gap (%) | 6,909 | 19.04% |
| Wage / Income Gap ($) | 6,909 | 80.96¢ per $1 |
| Gini / Inequality Index | 6,909 | 0.36 |
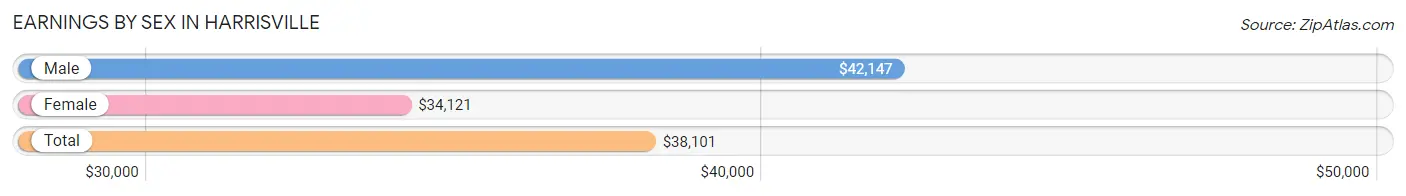
Earnings by Sex in Harrisville
Average Earnings in Harrisville are $38,101, $42,147 for men and $34,121 for women, a difference of 19.0%.
| Sex | Number | Average Earnings |
| Male | 2,146 (54.2%) | $42,147 |
| Female | 1,816 (45.8%) | $34,121 |
| Total | 3,962 (100.0%) | $38,101 |
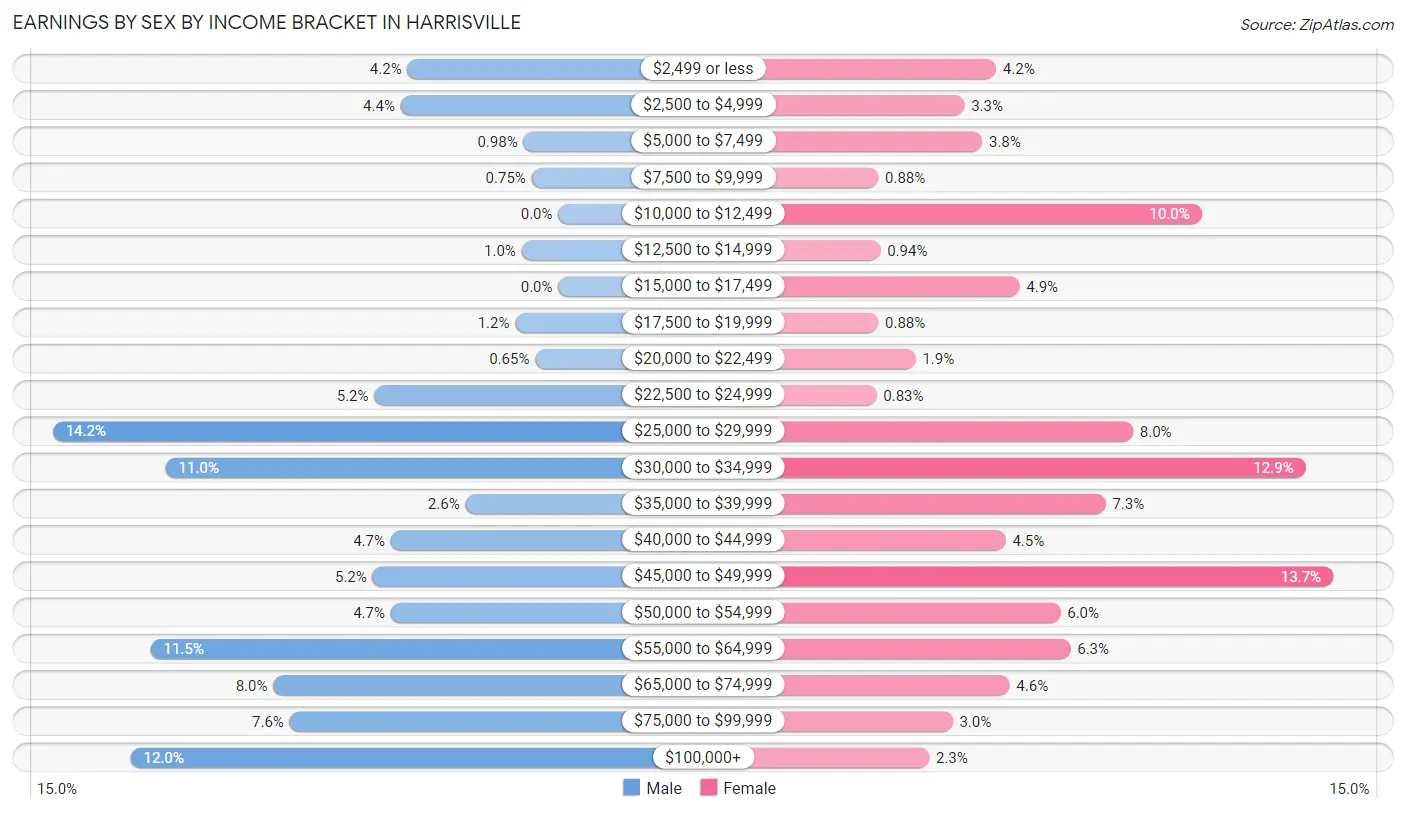
Earnings by Sex by Income Bracket in Harrisville
The most common earnings brackets in Harrisville are $25,000 to $29,999 for men (305 | 14.2%) and $45,000 to $49,999 for women (248 | 13.7%).
| Income | Male | Female |
| $2,499 or less | 91 (4.2%) | 76 (4.2%) |
| $2,500 to $4,999 | 95 (4.4%) | 60 (3.3%) |
| $5,000 to $7,499 | 21 (1.0%) | 69 (3.8%) |
| $7,500 to $9,999 | 16 (0.7%) | 16 (0.9%) |
| $10,000 to $12,499 | 0 (0.0%) | 181 (10.0%) |
| $12,500 to $14,999 | 22 (1.0%) | 17 (0.9%) |
| $15,000 to $17,499 | 0 (0.0%) | 88 (4.9%) |
| $17,500 to $19,999 | 26 (1.2%) | 16 (0.9%) |
| $20,000 to $22,499 | 14 (0.6%) | 35 (1.9%) |
| $22,500 to $24,999 | 111 (5.2%) | 15 (0.8%) |
| $25,000 to $29,999 | 305 (14.2%) | 146 (8.0%) |
| $30,000 to $34,999 | 237 (11.0%) | 234 (12.9%) |
| $35,000 to $39,999 | 56 (2.6%) | 132 (7.3%) |
| $40,000 to $44,999 | 101 (4.7%) | 81 (4.5%) |
| $45,000 to $49,999 | 112 (5.2%) | 248 (13.7%) |
| $50,000 to $54,999 | 101 (4.7%) | 109 (6.0%) |
| $55,000 to $64,999 | 246 (11.5%) | 114 (6.3%) |
| $65,000 to $74,999 | 172 (8.0%) | 83 (4.6%) |
| $75,000 to $99,999 | 162 (7.5%) | 54 (3.0%) |
| $100,000+ | 258 (12.0%) | 42 (2.3%) |
| Total | 2,146 (100.0%) | 1,816 (100.0%) |
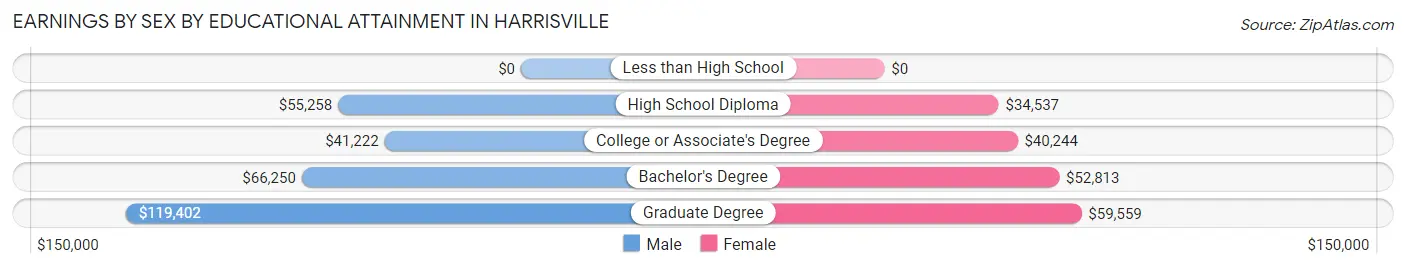
Earnings by Sex by Educational Attainment in Harrisville
Average earnings in Harrisville are $53,958 for men and $39,624 for women, a difference of 26.6%. Men with an educational attainment of graduate degree enjoy the highest average annual earnings of $119,402, while those with college or associate's degree education earn the least with $41,222. Women with an educational attainment of graduate degree earn the most with the average annual earnings of $59,559, while those with high school diploma education have the smallest earnings of $34,537.
| Educational Attainment | Male Income | Female Income |
| Less than High School | - | - |
| High School Diploma | $55,258 | $34,537 |
| College or Associate's Degree | $41,222 | $40,244 |
| Bachelor's Degree | $66,250 | $52,813 |
| Graduate Degree | $119,402 | $59,559 |
| Total | $53,958 | $39,624 |
Family Income in Harrisville
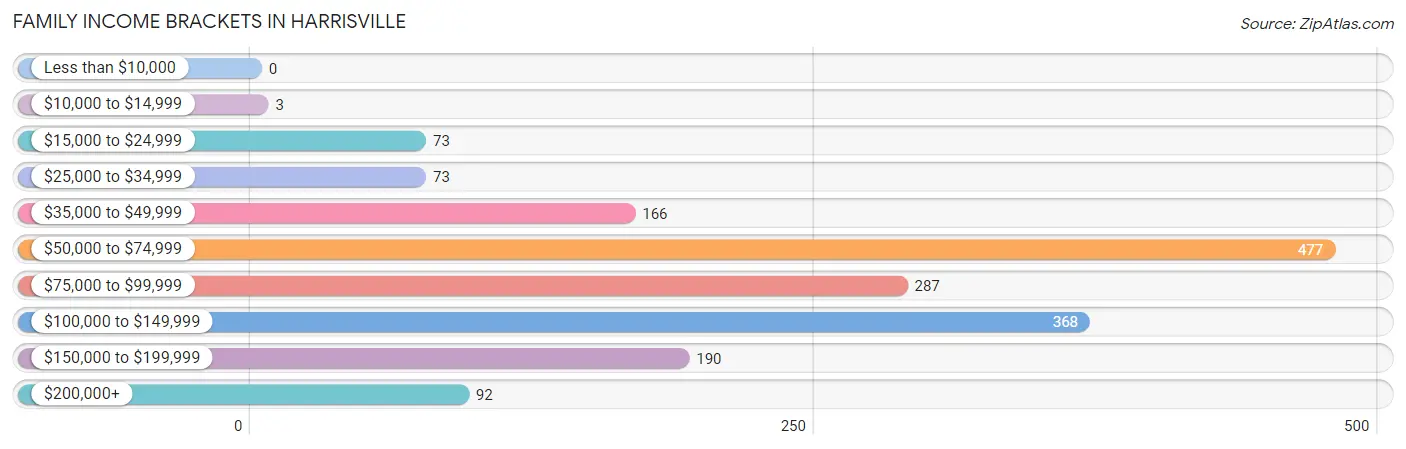
Family Income Brackets in Harrisville
According to the Harrisville family income data, there are 477 families falling into the $50,000 to $74,999 income range, which is the most common income bracket and makes up 27.6% of all families.
| Income Bracket | # Families | % Families |
| Less than $10,000 | 0 | 0.0% |
| $10,000 to $14,999 | 3 | 0.2% |
| $15,000 to $24,999 | 73 | 4.2% |
| $25,000 to $34,999 | 73 | 4.2% |
| $35,000 to $49,999 | 166 | 9.6% |
| $50,000 to $74,999 | 477 | 27.6% |
| $75,000 to $99,999 | 287 | 16.6% |
| $100,000 to $149,999 | 368 | 21.3% |
| $150,000 to $199,999 | 190 | 11.0% |
| $200,000+ | 92 | 5.3% |
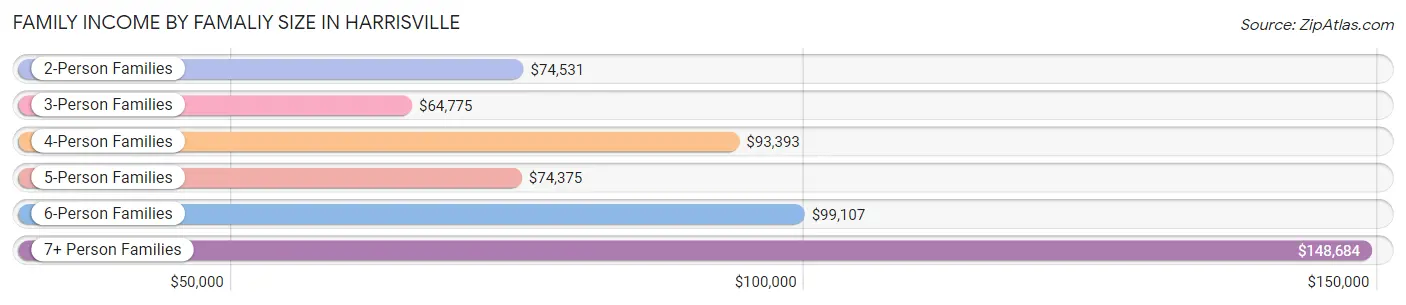
Family Income by Famaliy Size in Harrisville
7+ person families (102 | 5.9%) account for the highest median family income in Harrisville with $148,684 per family, while 2-person families (507 | 29.4%) have the highest median income of $37,266 per family member.
| Income Bracket | # Families | Median Income |
| 2-Person Families | 507 (29.4%) | $74,531 |
| 3-Person Families | 553 (32.0%) | $64,775 |
| 4-Person Families | 310 (17.9%) | $93,393 |
| 5-Person Families | 166 (9.6%) | $74,375 |
| 6-Person Families | 89 (5.1%) | $99,107 |
| 7+ Person Families | 102 (5.9%) | $148,684 |
| Total | 1,727 (100.0%) | $89,050 |
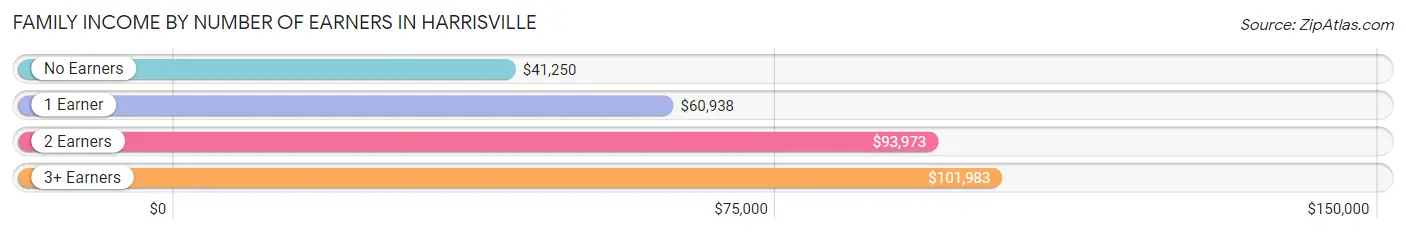
Family Income by Number of Earners in Harrisville
The median family income in Harrisville is $89,050, with families comprising 3+ earners (375) having the highest median family income of $101,983, while families with no earners (104) have the lowest median family income of $41,250, accounting for 21.7% and 6.0% of families, respectively.
| Number of Earners | # Families | Median Income |
| No Earners | 104 (6.0%) | $41,250 |
| 1 Earner | 585 (33.9%) | $60,938 |
| 2 Earners | 663 (38.4%) | $93,973 |
| 3+ Earners | 375 (21.7%) | $101,983 |
| Total | 1,727 (100.0%) | $89,050 |
Household Income in Harrisville
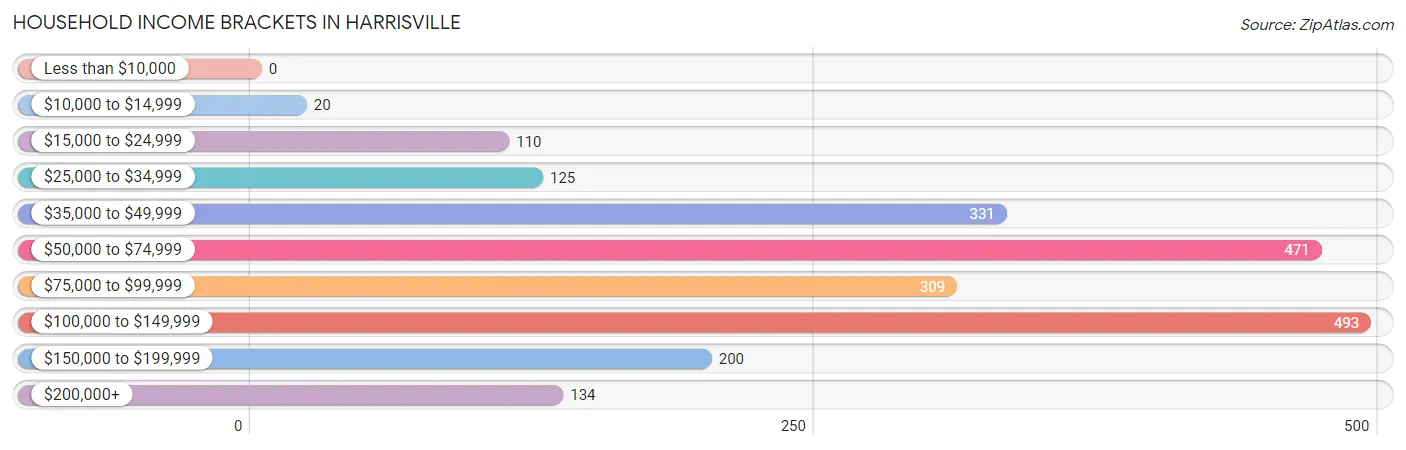
Household Income Brackets in Harrisville
With 493 households falling in the category, the $100,000 to $149,999 income range is the most frequent in Harrisville, accounting for 22.5% of all households.
| Income Bracket | # Households | % Households |
| Less than $10,000 | 0 | 0.0% |
| $10,000 to $14,999 | 20 | 0.9% |
| $15,000 to $24,999 | 110 | 5.0% |
| $25,000 to $34,999 | 125 | 5.7% |
| $35,000 to $49,999 | 331 | 15.1% |
| $50,000 to $74,999 | 471 | 21.5% |
| $75,000 to $99,999 | 309 | 14.1% |
| $100,000 to $149,999 | 493 | 22.5% |
| $150,000 to $199,999 | 200 | 9.1% |
| $200,000+ | 134 | 6.1% |
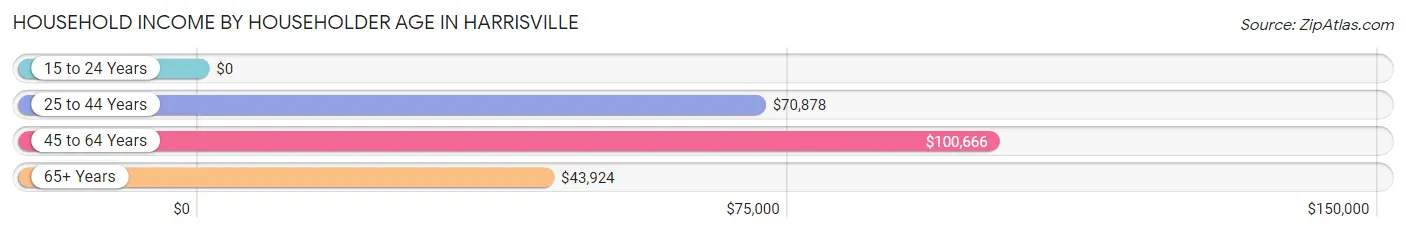
Household Income by Householder Age in Harrisville
The median household income in Harrisville is $82,232, with the highest median household income of $100,666 found in the 45 to 64 years age bracket for the primary householder. A total of 769 households (35.1%) fall into this category. Meanwhile, the 15 to 24 years age bracket for the primary householder has the lowest median household income of $0, with 22 households (1.0%) in this group.
| Income Bracket | # Households | Median Income |
| 15 to 24 Years | 22 (1.0%) | $0 |
| 25 to 44 Years | 1,039 (47.4%) | $70,878 |
| 45 to 64 Years | 769 (35.1%) | $100,666 |
| 65+ Years | 363 (16.6%) | $43,924 |
| Total | 2,193 (100.0%) | $82,232 |
Poverty in Harrisville
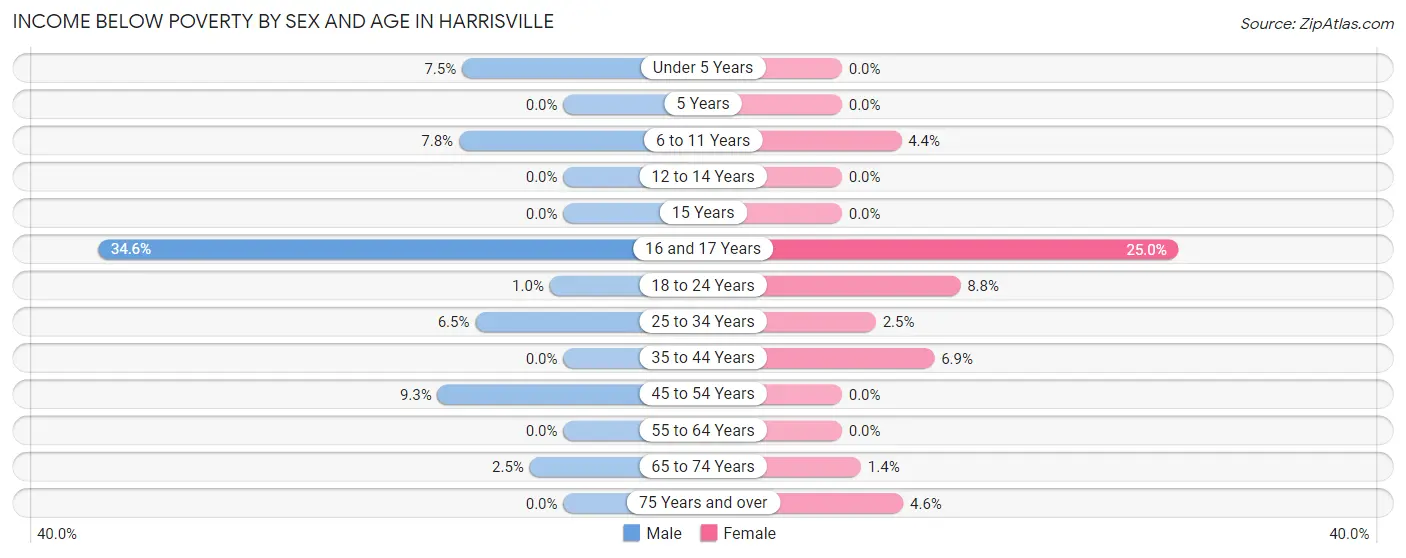
Income Below Poverty by Sex and Age in Harrisville
With 5.4% poverty level for males and 4.3% for females among the residents of Harrisville, 16 and 17 year old males and 16 and 17 year old females are the most vulnerable to poverty, with 47 males (34.6%) and 41 females (25.0%) in their respective age groups living below the poverty level.
| Age Bracket | Male | Female |
| Under 5 Years | 30 (7.5%) | 0 (0.0%) |
| 5 Years | 0 (0.0%) | 0 (0.0%) |
| 6 to 11 Years | 30 (7.7%) | 24 (4.4%) |
| 12 to 14 Years | 0 (0.0%) | 0 (0.0%) |
| 15 Years | 0 (0.0%) | 0 (0.0%) |
| 16 and 17 Years | 47 (34.6%) | 41 (25.0%) |
| 18 to 24 Years | 4 (1.0%) | 27 (8.8%) |
| 25 to 34 Years | 41 (6.5%) | 15 (2.5%) |
| 35 to 44 Years | 0 (0.0%) | 30 (6.9%) |
| 45 to 54 Years | 31 (9.3%) | 0 (0.0%) |
| 55 to 64 Years | 0 (0.0%) | 0 (0.0%) |
| 65 to 74 Years | 3 (2.5%) | 3 (1.4%) |
| 75 Years and over | 0 (0.0%) | 8 (4.5%) |
| Total | 186 (5.4%) | 148 (4.3%) |
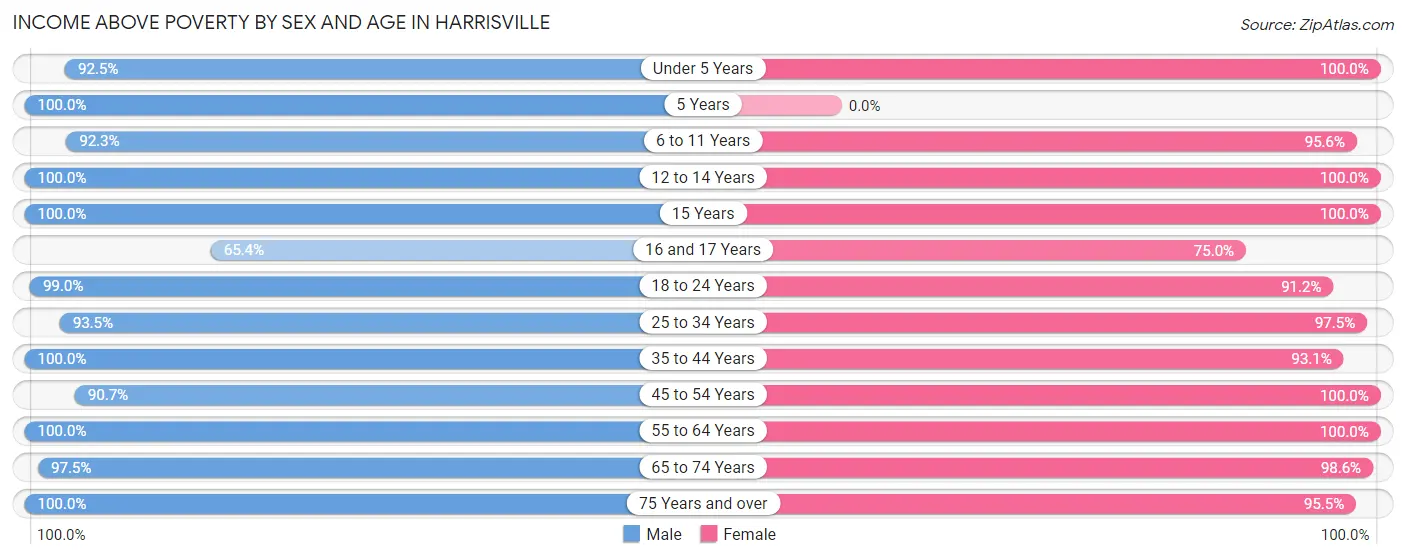
Income Above Poverty by Sex and Age in Harrisville
According to the poverty statistics in Harrisville, males aged 5 years and females aged under 5 years are the age groups that are most secure financially, with 100.0% of males and 100.0% of females in these age groups living above the poverty line.
| Age Bracket | Male | Female |
| Under 5 Years | 369 (92.5%) | 167 (100.0%) |
| 5 Years | 91 (100.0%) | 0 (0.0%) |
| 6 to 11 Years | 357 (92.2%) | 520 (95.6%) |
| 12 to 14 Years | 136 (100.0%) | 175 (100.0%) |
| 15 Years | 37 (100.0%) | 50 (100.0%) |
| 16 and 17 Years | 89 (65.4%) | 123 (75.0%) |
| 18 to 24 Years | 394 (99.0%) | 280 (91.2%) |
| 25 to 34 Years | 586 (93.5%) | 581 (97.5%) |
| 35 to 44 Years | 464 (100.0%) | 407 (93.1%) |
| 45 to 54 Years | 301 (90.7%) | 428 (100.0%) |
| 55 to 64 Years | 237 (100.0%) | 206 (100.0%) |
| 65 to 74 Years | 117 (97.5%) | 209 (98.6%) |
| 75 Years and over | 83 (100.0%) | 168 (95.5%) |
| Total | 3,261 (94.6%) | 3,314 (95.7%) |
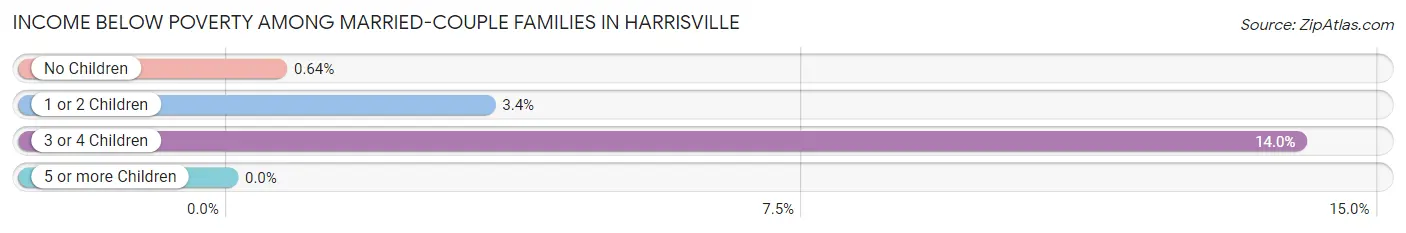
Income Below Poverty Among Married-Couple Families in Harrisville
The poverty statistics for married-couple families in Harrisville show that 4.3% or 48 of the total 1,107 families live below the poverty line. Families with 3 or 4 children have the highest poverty rate of 14.0%, comprising of 31 families. On the other hand, families with no children have the lowest poverty rate of 0.6%, which includes 3 families.
| Children | Above Poverty | Below Poverty |
| No Children | 465 (99.4%) | 3 (0.6%) |
| 1 or 2 Children | 403 (96.6%) | 14 (3.4%) |
| 3 or 4 Children | 191 (86.0%) | 31 (14.0%) |
| 5 or more Children | 0 (0.0%) | 0 (0.0%) |
| Total | 1,059 (95.7%) | 48 (4.3%) |
Income Below Poverty Among Single-Parent Households in Harrisville
| Children | Single Father | Single Mother |
| No Children | 0 (0.0%) | 0 (0.0%) |
| 1 or 2 Children | 0 (0.0%) | 0 (0.0%) |
| 3 or 4 Children | 0 (0.0%) | 0 (0.0%) |
| 5 or more Children | 0 (0.0%) | 0 (0.0%) |
| Total | 0 (0.0%) | 0 (0.0%) |
Income Below Poverty Among Married-Couple vs Single-Parent Households in Harrisville
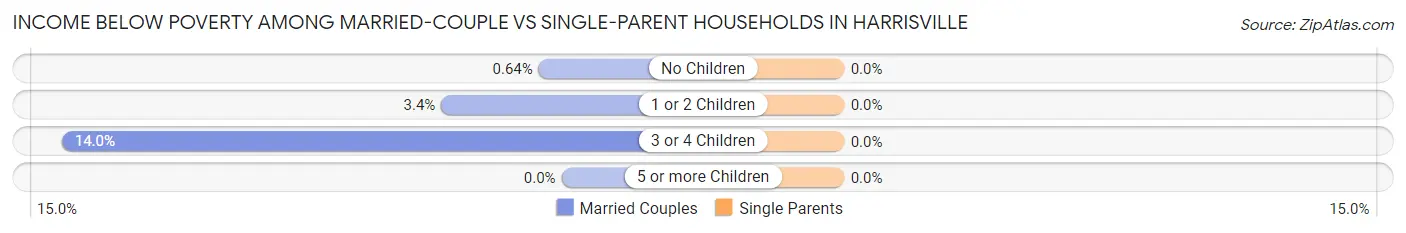
| Children | Married-Couple Families | Single-Parent Households |
| No Children | 3 (0.6%) | 0 (0.0%) |
| 1 or 2 Children | 14 (3.4%) | 0 (0.0%) |
| 3 or 4 Children | 31 (14.0%) | 0 (0.0%) |
| 5 or more Children | 0 (0.0%) | 0 (0.0%) |
| Total | 48 (4.3%) | 0 (0.0%) |
Race in Harrisville
The most populous races in Harrisville are White / Caucasian (5,617 | 81.3%), Hispanic or Latino (1,199 | 17.3%), and Two or more Races (746 | 10.8%).
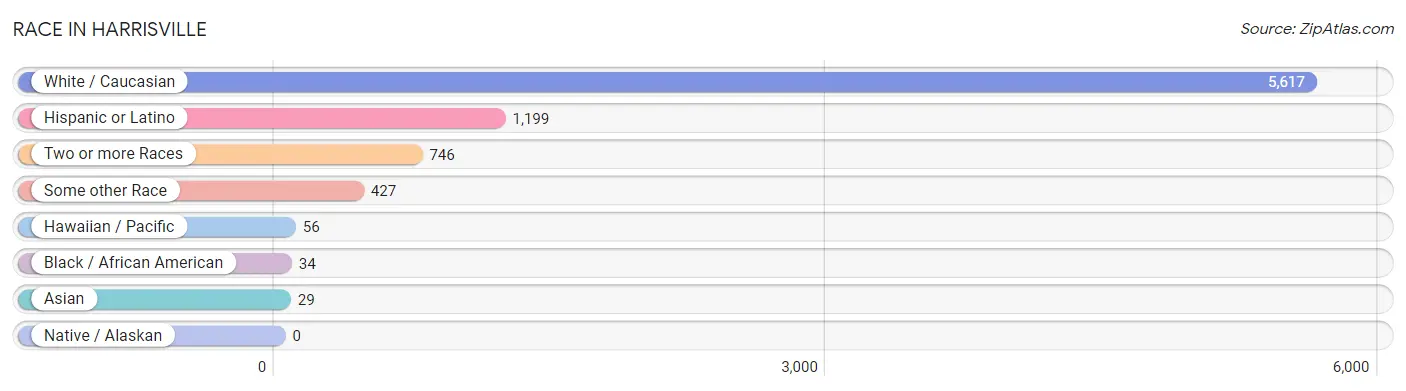
| Race | # Population | % Population |
| Asian | 29 | 0.4% |
| Black / African American | 34 | 0.5% |
| Hawaiian / Pacific | 56 | 0.8% |
| Hispanic or Latino | 1,199 | 17.3% |
| Native / Alaskan | 0 | 0.0% |
| White / Caucasian | 5,617 | 81.3% |
| Two or more Races | 746 | 10.8% |
| Some other Race | 427 | 6.2% |
| Total | 6,909 | 100.0% |
Ancestry in Harrisville
The most populous ancestries reported in Harrisville are English (1,495 | 21.6%), Mexican (788 | 11.4%), German (609 | 8.8%), Norwegian (478 | 6.9%), and Swedish (458 | 6.6%), together accounting for 55.4% of all Harrisville residents.
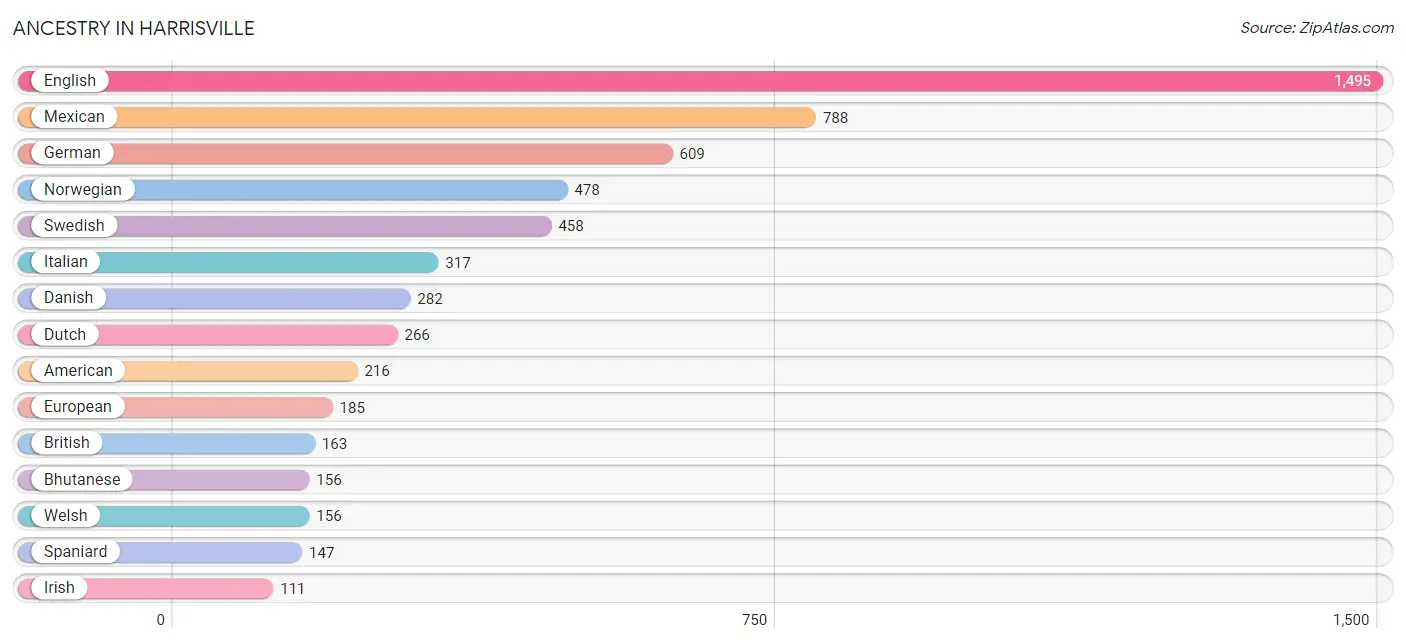
| Ancestry | # Population | % Population |
| African | 4 | 0.1% |
| American | 216 | 3.1% |
| Bhutanese | 156 | 2.3% |
| Brazilian | 22 | 0.3% |
| British | 163 | 2.4% |
| Burmese | 45 | 0.6% |
| Central American | 64 | 0.9% |
| Costa Rican | 19 | 0.3% |
| Danish | 282 | 4.1% |
| Dominican | 43 | 0.6% |
| Dutch | 266 | 3.8% |
| English | 1,495 | 21.6% |
| European | 185 | 2.7% |
| Finnish | 37 | 0.5% |
| French | 85 | 1.2% |
| French Canadian | 42 | 0.6% |
| German | 609 | 8.8% |
| Greek | 28 | 0.4% |
| Irish | 111 | 1.6% |
| Italian | 317 | 4.6% |
| Korean | 96 | 1.4% |
| Mexican | 788 | 11.4% |
| Nigerian | 9 | 0.1% |
| Northern European | 66 | 1.0% |
| Norwegian | 478 | 6.9% |
| Polish | 15 | 0.2% |
| Puerto Rican | 56 | 0.8% |
| Russian | 10 | 0.1% |
| Salvadoran | 45 | 0.6% |
| Scandinavian | 28 | 0.4% |
| Scotch-Irish | 90 | 1.3% |
| Scottish | 70 | 1.0% |
| Slovak | 13 | 0.2% |
| Spaniard | 147 | 2.1% |
| Spanish | 16 | 0.2% |
| Subsaharan African | 13 | 0.2% |
| Swedish | 458 | 6.6% |
| Swiss | 30 | 0.4% |
| Tongan | 72 | 1.0% |
| Welsh | 156 | 2.3% | View All 40 Rows |
Immigrants in Harrisville
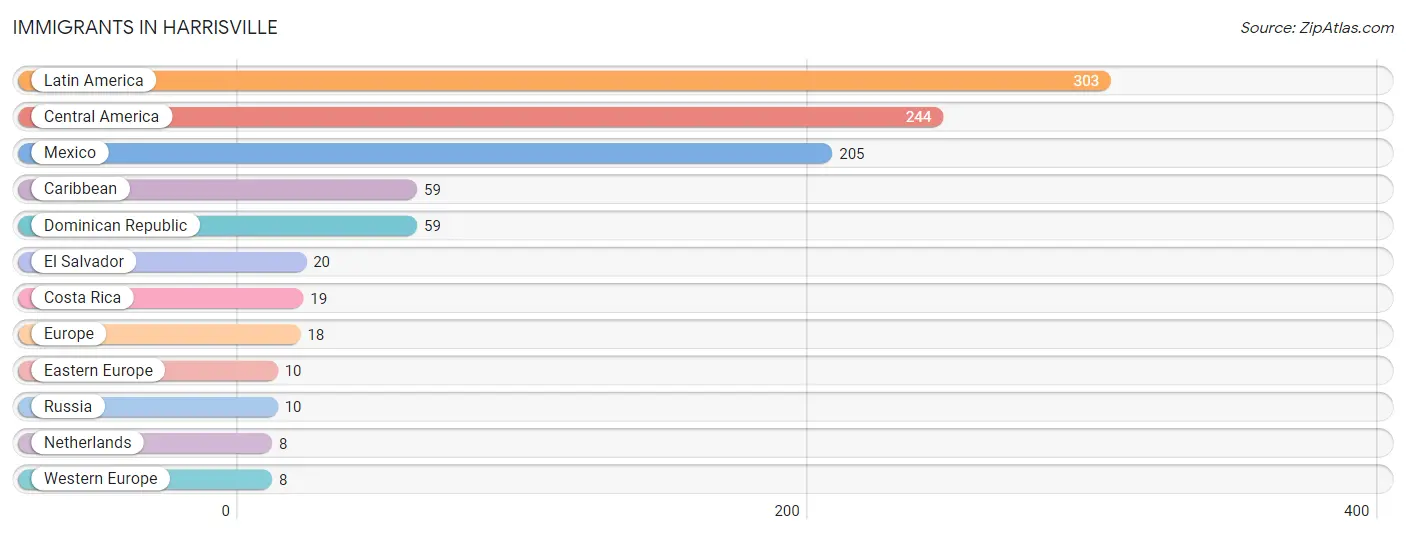
The most numerous immigrant groups reported in Harrisville came from Latin America (303 | 4.4%), Central America (244 | 3.5%), Mexico (205 | 3.0%), Caribbean (59 | 0.9%), and Dominican Republic (59 | 0.9%), together accounting for 12.6% of all Harrisville residents.
| Immigration Origin | # Population | % Population |
| Caribbean | 59 | 0.9% |
| Central America | 244 | 3.5% |
| Costa Rica | 19 | 0.3% |
| Dominican Republic | 59 | 0.9% |
| Eastern Europe | 10 | 0.1% |
| El Salvador | 20 | 0.3% |
| Europe | 18 | 0.3% |
| Latin America | 303 | 4.4% |
| Mexico | 205 | 3.0% |
| Netherlands | 8 | 0.1% |
| Russia | 10 | 0.1% |
| Western Europe | 8 | 0.1% | View All 12 Rows |
Sex and Age in Harrisville
Sex and Age in Harrisville
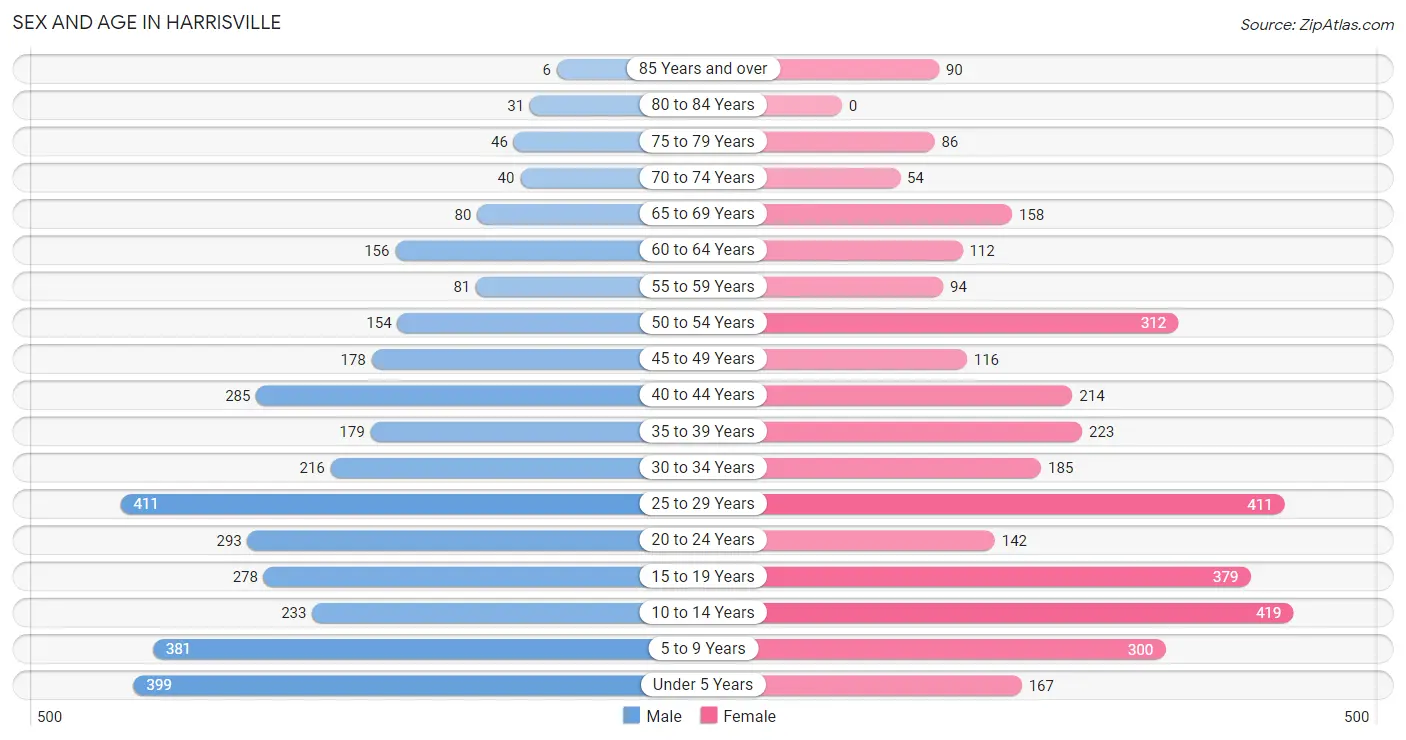
The most populous age groups in Harrisville are 25 to 29 Years (411 | 11.9%) for men and 10 to 14 Years (419 | 12.1%) for women.
| Age Bracket | Male | Female |
| Under 5 Years | 399 (11.6%) | 167 (4.8%) |
| 5 to 9 Years | 381 (11.1%) | 300 (8.7%) |
| 10 to 14 Years | 233 (6.8%) | 419 (12.1%) |
| 15 to 19 Years | 278 (8.1%) | 379 (11.0%) |
| 20 to 24 Years | 293 (8.5%) | 142 (4.1%) |
| 25 to 29 Years | 411 (11.9%) | 411 (11.9%) |
| 30 to 34 Years | 216 (6.3%) | 185 (5.3%) |
| 35 to 39 Years | 179 (5.2%) | 223 (6.4%) |
| 40 to 44 Years | 285 (8.3%) | 214 (6.2%) |
| 45 to 49 Years | 178 (5.2%) | 116 (3.4%) |
| 50 to 54 Years | 154 (4.5%) | 312 (9.0%) |
| 55 to 59 Years | 81 (2.4%) | 94 (2.7%) |
| 60 to 64 Years | 156 (4.5%) | 112 (3.2%) |
| 65 to 69 Years | 80 (2.3%) | 158 (4.6%) |
| 70 to 74 Years | 40 (1.2%) | 54 (1.6%) |
| 75 to 79 Years | 46 (1.3%) | 86 (2.5%) |
| 80 to 84 Years | 31 (0.9%) | 0 (0.0%) |
| 85 Years and over | 6 (0.2%) | 90 (2.6%) |
| Total | 3,447 (100.0%) | 3,462 (100.0%) |
Families and Households in Harrisville
Median Family Size in Harrisville
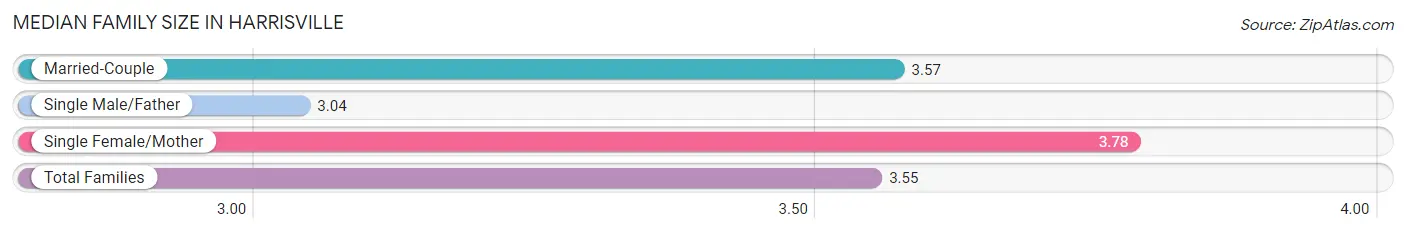
The median family size in Harrisville is 3.55 persons per family, with single female/mother families (400 | 23.2%) accounting for the largest median family size of 3.78 persons per family. On the other hand, single male/father families (220 | 12.7%) represent the smallest median family size with 3.04 persons per family.
| Family Type | # Families | Family Size |
| Married-Couple | 1,107 (64.1%) | 3.57 |
| Single Male/Father | 220 (12.7%) | 3.04 |
| Single Female/Mother | 400 (23.2%) | 3.78 |
| Total Families | 1,727 (100.0%) | 3.55 |
Median Household Size in Harrisville
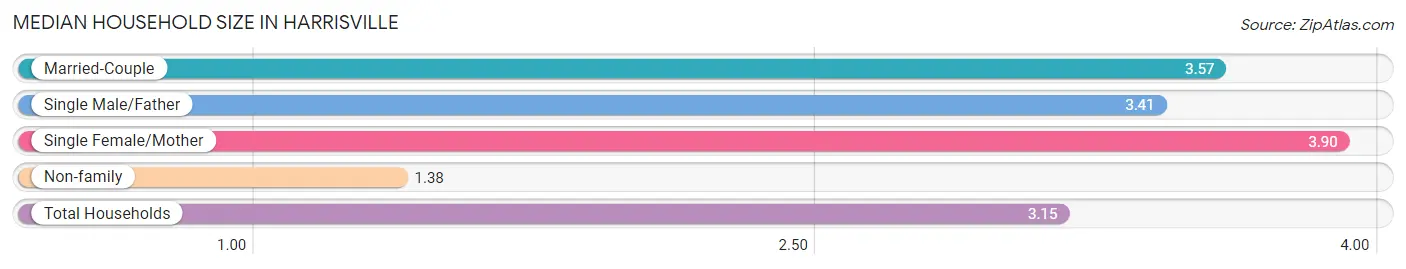
The median household size in Harrisville is 3.15 persons per household, with single female/mother households (400 | 18.2%) accounting for the largest median household size of 3.9 persons per household. non-family households (466 | 21.2%) represent the smallest median household size with 1.38 persons per household.
| Household Type | # Households | Household Size |
| Married-Couple | 1,107 (50.5%) | 3.57 |
| Single Male/Father | 220 (10.0%) | 3.41 |
| Single Female/Mother | 400 (18.2%) | 3.90 |
| Non-family | 466 (21.2%) | 1.38 |
| Total Households | 2,193 (100.0%) | 3.15 |
Household Size by Marriage Status in Harrisville
Out of a total of 2,193 households in Harrisville, 1,727 (78.7%) are family households, while 466 (21.2%) are nonfamily households. The most numerous type of family households are 3-person households, comprising 536, and the most common type of nonfamily households are 1-person households, comprising 389.
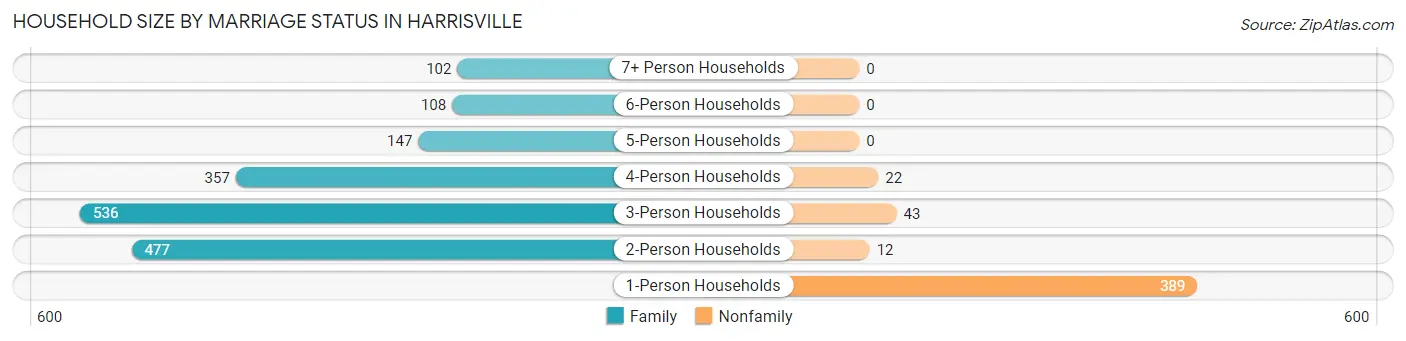
| Household Size | Family Households | Nonfamily Households |
| 1-Person Households | - | 389 (17.7%) |
| 2-Person Households | 477 (21.7%) | 12 (0.5%) |
| 3-Person Households | 536 (24.4%) | 43 (2.0%) |
| 4-Person Households | 357 (16.3%) | 22 (1.0%) |
| 5-Person Households | 147 (6.7%) | 0 (0.0%) |
| 6-Person Households | 108 (4.9%) | 0 (0.0%) |
| 7+ Person Households | 102 (4.6%) | 0 (0.0%) |
| Total | 1,727 (78.7%) | 466 (21.2%) |
Female Fertility in Harrisville
Fertility by Age in Harrisville
Average fertility rate in Harrisville is 81.0 births per 1,000 women. Women in the age bracket of 20 to 34 years have the highest fertility rate with 169.0 births per 1,000 women. Women in the age bracket of 20 to 34 years acount for 87.4% of all women with births.
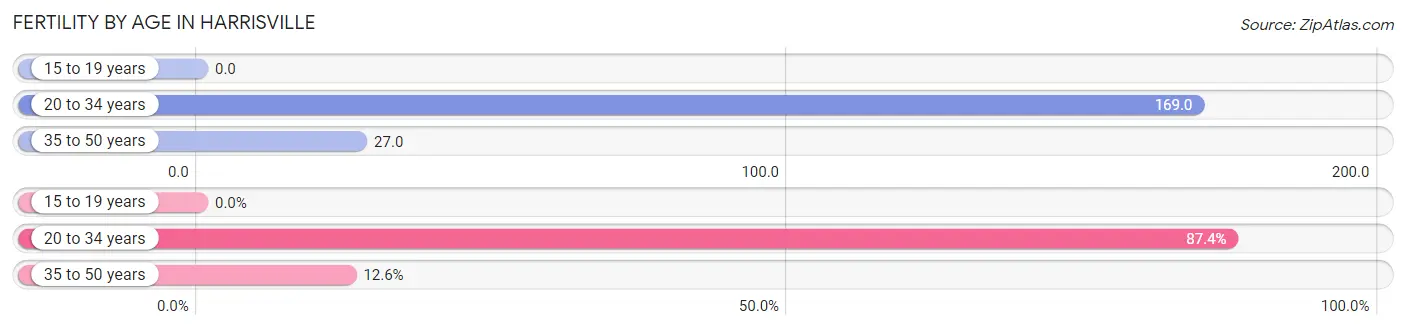
| Age Bracket | Women with Births | Births / 1,000 Women |
| 15 to 19 years | 0 (0.0%) | 0.0 |
| 20 to 34 years | 125 (87.4%) | 169.0 |
| 35 to 50 years | 18 (12.6%) | 27.0 |
| Total | 143 (100.0%) | 81.0 |
Fertility by Age by Marriage Status in Harrisville
80.4% of women with births (143) in Harrisville are married. The highest percentage of unmarried women with births falls into 20 to 34 years age bracket with 22.4% of them unmarried at the time of birth, while the lowest percentage of unmarried women with births belong to 35 to 50 years age bracket with 0.0% of them unmarried.
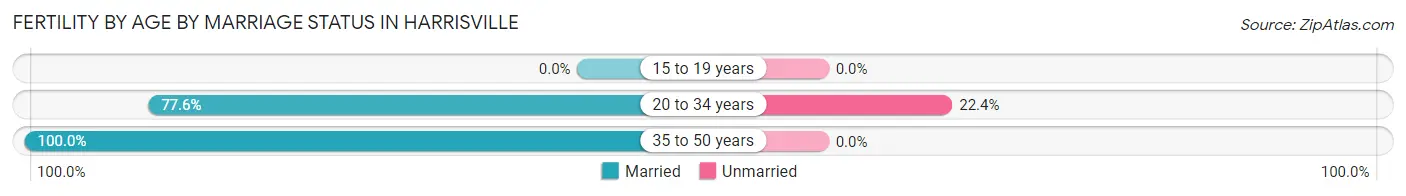
| Age Bracket | Married | Unmarried |
| 15 to 19 years | 0 (0.0%) | 0 (0.0%) |
| 20 to 34 years | 97 (77.6%) | 28 (22.4%) |
| 35 to 50 years | 18 (100.0%) | 0 (0.0%) |
| Total | 115 (80.4%) | 28 (19.6%) |
Fertility by Education in Harrisville
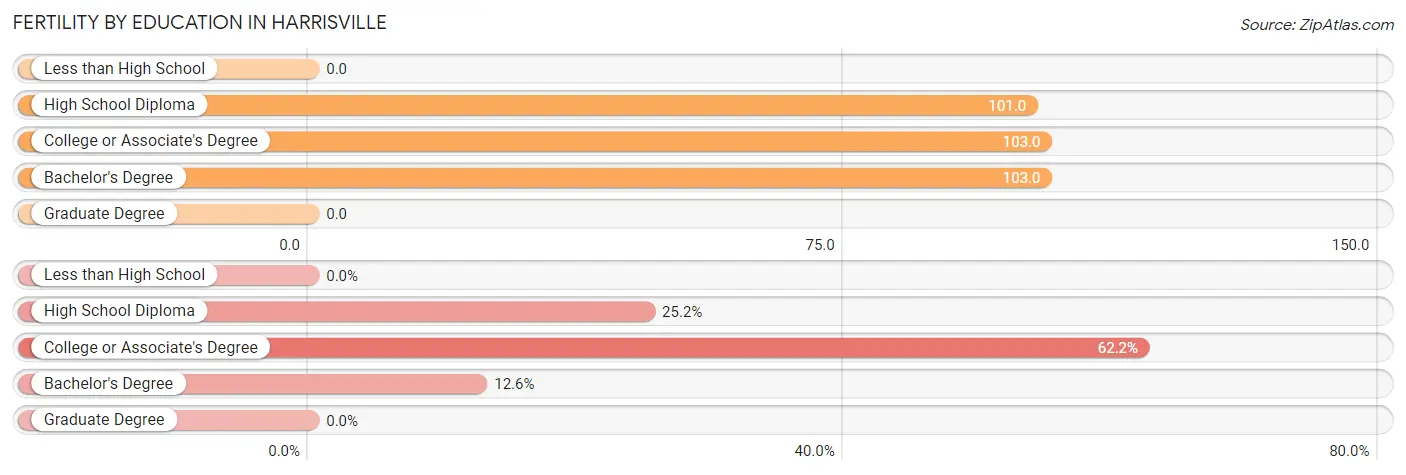
| Educational Attainment | Women with Births | Births / 1,000 Women |
| Less than High School | 0 (0.0%) | 0.0 |
| High School Diploma | 36 (25.2%) | 101.0 |
| College or Associate's Degree | 89 (62.2%) | 103.0 |
| Bachelor's Degree | 18 (12.6%) | 103.0 |
| Graduate Degree | 0 (0.0%) | 0.0 |
| Total | 143 (100.0%) | 81.0 |
Fertility by Education by Marriage Status in Harrisville
19.6% of women with births in Harrisville are unmarried. Women with the educational attainment of college or associate's degree are most likely to be married with 100.0% of them married at childbirth, while women with the educational attainment of high school diploma are least likely to be married with 77.8% of them unmarried at childbirth.
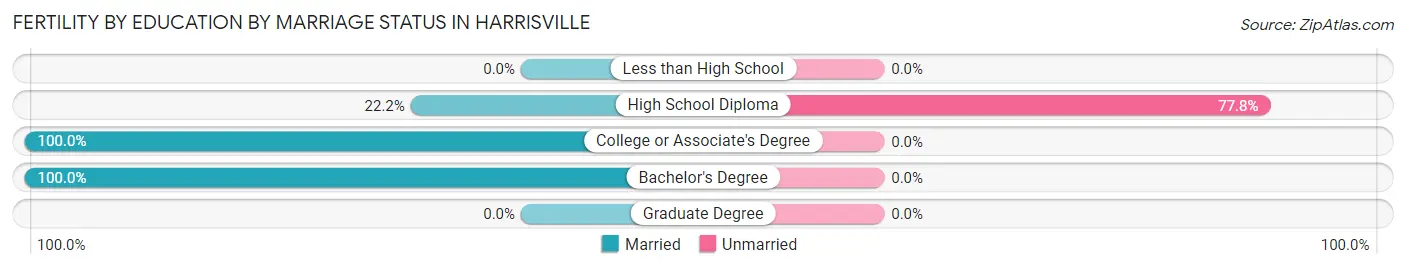
| Educational Attainment | Married | Unmarried |
| Less than High School | 0 (0.0%) | 0 (0.0%) |
| High School Diploma | 8 (22.2%) | 28 (77.8%) |
| College or Associate's Degree | 89 (100.0%) | 0 (0.0%) |
| Bachelor's Degree | 18 (100.0%) | 0 (0.0%) |
| Graduate Degree | 0 (0.0%) | 0 (0.0%) |
| Total | 115 (80.4%) | 28 (19.6%) |
Employment Characteristics in Harrisville
Employment by Class of Employer in Harrisville
Among the 3,594 employed individuals in Harrisville, private company employees (2,524 | 70.2%), state government employees (323 | 9.0%), and federal government employees (266 | 7.4%) make up the most common classes of employment.
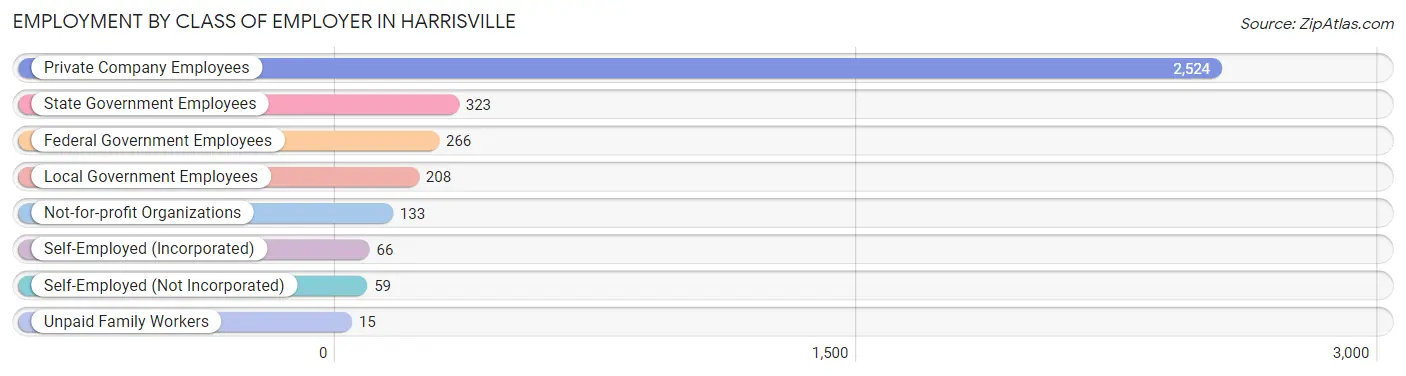
| Employer Class | # Employees | % Employees |
| Private Company Employees | 2,524 | 70.2% |
| Self-Employed (Incorporated) | 66 | 1.8% |
| Self-Employed (Not Incorporated) | 59 | 1.6% |
| Not-for-profit Organizations | 133 | 3.7% |
| Local Government Employees | 208 | 5.8% |
| State Government Employees | 323 | 9.0% |
| Federal Government Employees | 266 | 7.4% |
| Unpaid Family Workers | 15 | 0.4% |
| Total | 3,594 | 100.0% |
Employment Status by Age in Harrisville
According to the labor force statistics for Harrisville, out of the total population over 16 years of age (4,923), 75.7% or 3,727 individuals are in the labor force, with 2.6% or 97 of them unemployed. The age group with the highest labor force participation rate is 20 to 24 years, with 97.2% or 423 individuals in the labor force. Within the labor force, the 25 to 29 years age range has the highest percentage of unemployed individuals, with 12.0% or 90 of them being unemployed.
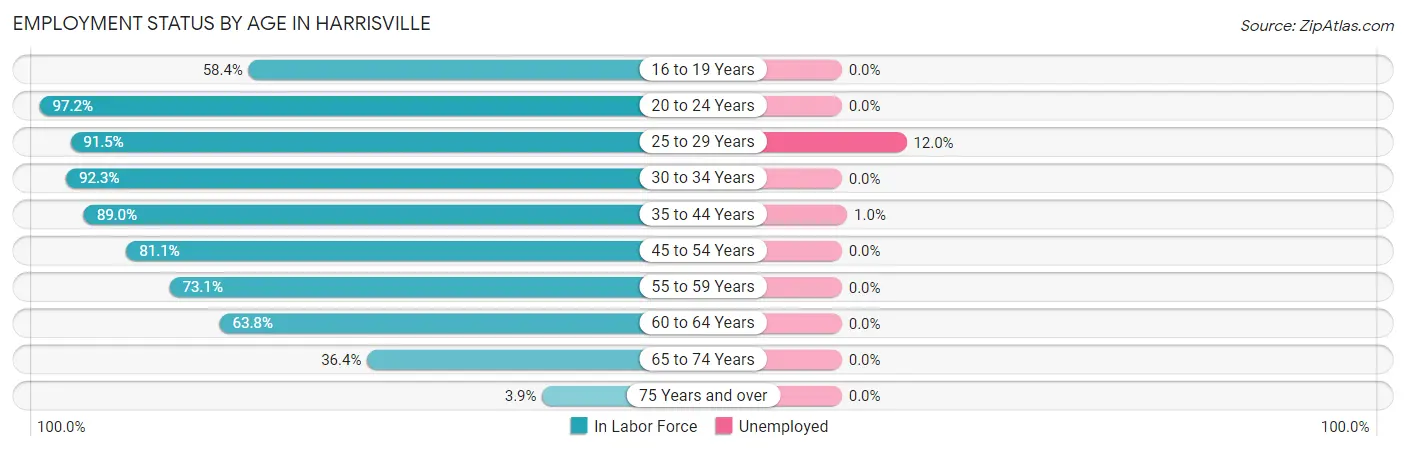
| Age Bracket | In Labor Force | Unemployed |
| 16 to 19 Years | 333 (58.4%) | 0 (0.0%) |
| 20 to 24 Years | 423 (97.2%) | 0 (0.0%) |
| 25 to 29 Years | 752 (91.5%) | 90 (12.0%) |
| 30 to 34 Years | 370 (92.3%) | 0 (0.0%) |
| 35 to 44 Years | 802 (89.0%) | 8 (1.0%) |
| 45 to 54 Years | 616 (81.1%) | 0 (0.0%) |
| 55 to 59 Years | 128 (73.1%) | 0 (0.0%) |
| 60 to 64 Years | 171 (63.8%) | 0 (0.0%) |
| 65 to 74 Years | 121 (36.4%) | 0 (0.0%) |
| 75 Years and over | 10 (3.9%) | 0 (0.0%) |
| Total | 3,727 (75.7%) | 97 (2.6%) |
Employment Status by Educational Attainment in Harrisville
According to labor force statistics for Harrisville, 85.3% of individuals (2,838) out of the total population between 25 and 64 years of age (3,327) are in the labor force, with 3.5% or 99 of them being unemployed. The group with the highest labor force participation rate are those with the educational attainment of college / associate degree, with 87.6% or 1,275 individuals in the labor force. Within the labor force, individuals with high school diploma education have the highest percentage of unemployment, with 5.8% or 50 of them being unemployed.
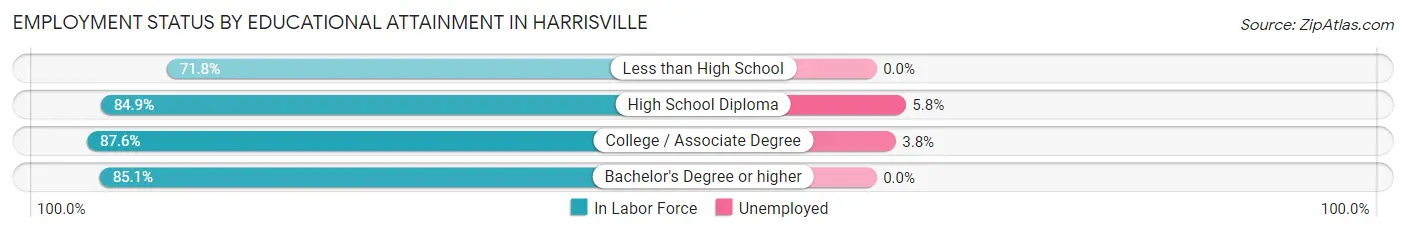
| Educational Attainment | In Labor Force | Unemployed |
| Less than High School | 140 (71.8%) | 0 (0.0%) |
| High School Diploma | 857 (84.9%) | 59 (5.8%) |
| College / Associate Degree | 1,275 (87.6%) | 55 (3.8%) |
| Bachelor's Degree or higher | 567 (85.1%) | 0 (0.0%) |
| Total | 2,838 (85.3%) | 116 (3.5%) |
Employment Occupations by Sex in Harrisville
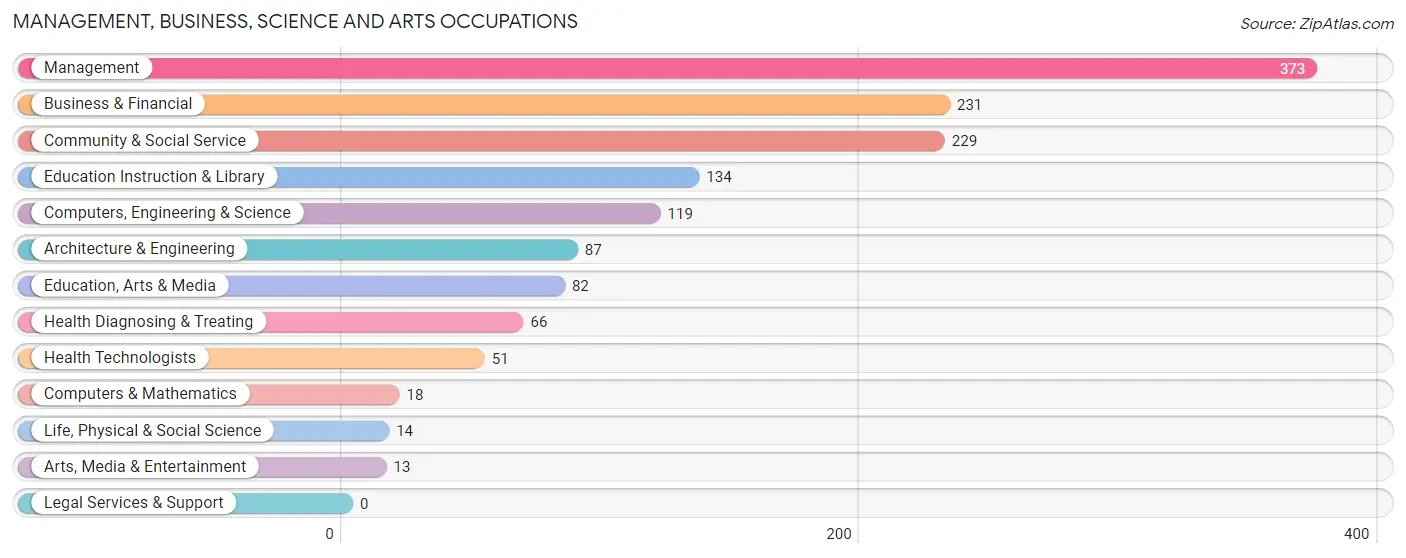
Management, Business, Science and Arts Occupations
The most common Management, Business, Science and Arts occupations in Harrisville are Management (373 | 10.3%), Business & Financial (231 | 6.4%), Community & Social Service (229 | 6.3%), Education Instruction & Library (134 | 3.7%), and Computers, Engineering & Science (119 | 3.3%).
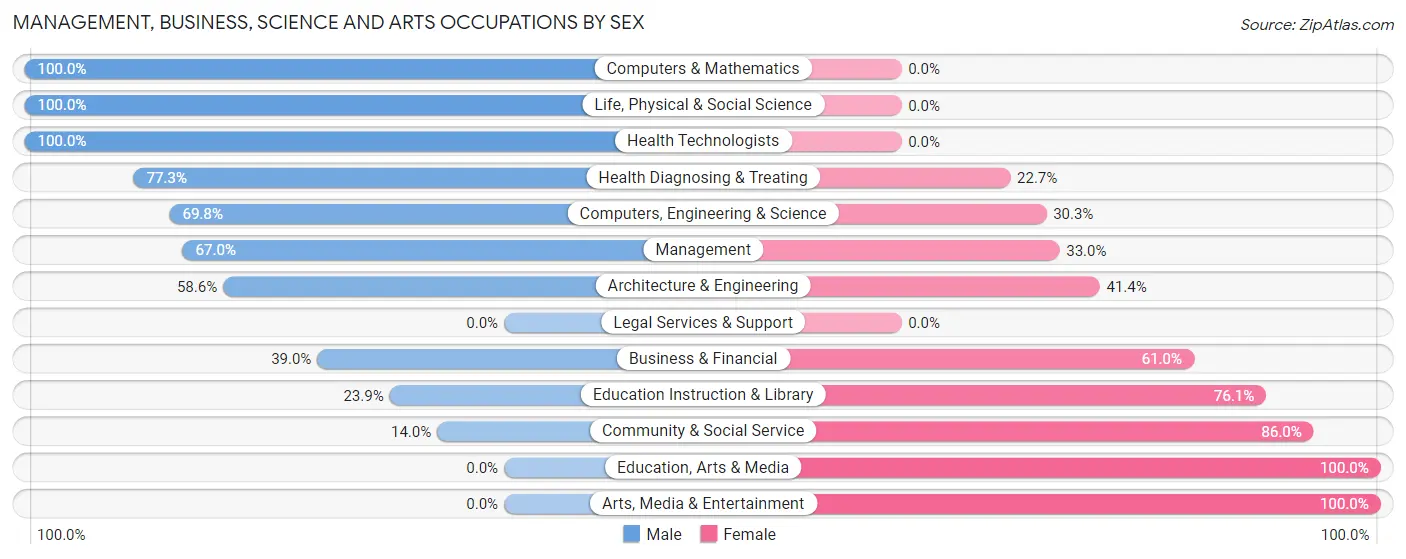
Management, Business, Science and Arts Occupations by Sex
Within the Management, Business, Science and Arts occupations in Harrisville, the most male-oriented occupations are Computers & Mathematics (100.0%), Life, Physical & Social Science (100.0%), and Health Technologists (100.0%), while the most female-oriented occupations are Education, Arts & Media (100.0%), Arts, Media & Entertainment (100.0%), and Community & Social Service (86.0%).
| Occupation | Male | Female |
| Management | 250 (67.0%) | 123 (33.0%) |
| Business & Financial | 90 (39.0%) | 141 (61.0%) |
| Computers, Engineering & Science | 83 (69.8%) | 36 (30.2%) |
| Computers & Mathematics | 18 (100.0%) | 0 (0.0%) |
| Architecture & Engineering | 51 (58.6%) | 36 (41.4%) |
| Life, Physical & Social Science | 14 (100.0%) | 0 (0.0%) |
| Community & Social Service | 32 (14.0%) | 197 (86.0%) |
| Education, Arts & Media | 0 (0.0%) | 82 (100.0%) |
| Legal Services & Support | 0 (0.0%) | 0 (0.0%) |
| Education Instruction & Library | 32 (23.9%) | 102 (76.1%) |
| Arts, Media & Entertainment | 0 (0.0%) | 13 (100.0%) |
| Health Diagnosing & Treating | 51 (77.3%) | 15 (22.7%) |
| Health Technologists | 51 (100.0%) | 0 (0.0%) |
| Total (Category) | 506 (49.7%) | 512 (50.3%) |
| Total (Overall) | 1,928 (53.1%) | 1,700 (46.9%) |
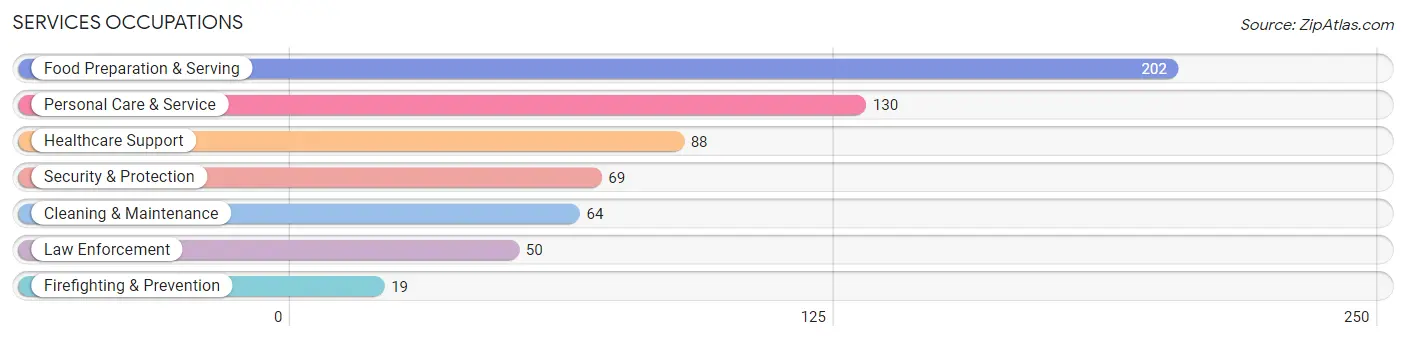
Services Occupations
The most common Services occupations in Harrisville are Food Preparation & Serving (202 | 5.6%), Personal Care & Service (130 | 3.6%), Healthcare Support (88 | 2.4%), Security & Protection (69 | 1.9%), and Cleaning & Maintenance (64 | 1.8%).
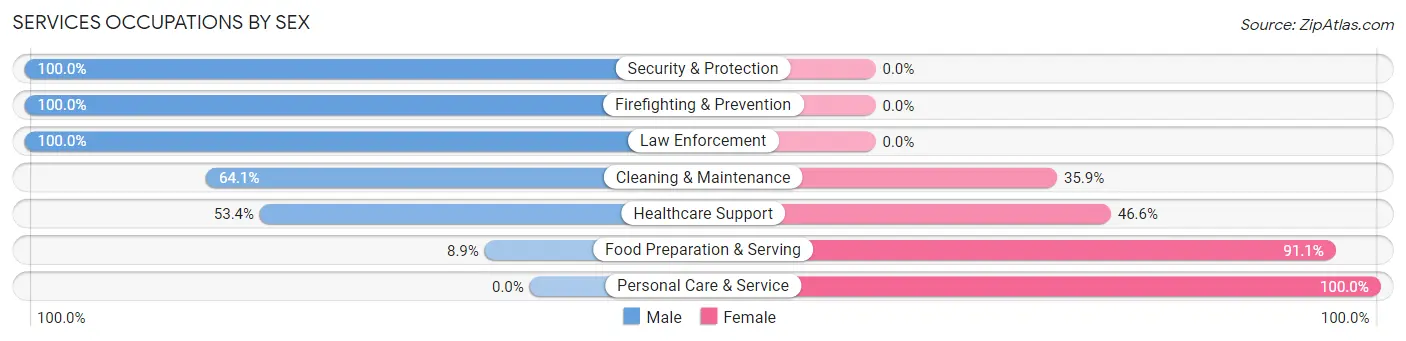
Services Occupations by Sex
Within the Services occupations in Harrisville, the most male-oriented occupations are Security & Protection (100.0%), Firefighting & Prevention (100.0%), and Law Enforcement (100.0%), while the most female-oriented occupations are Personal Care & Service (100.0%), Food Preparation & Serving (91.1%), and Healthcare Support (46.6%).
| Occupation | Male | Female |
| Healthcare Support | 47 (53.4%) | 41 (46.6%) |
| Security & Protection | 69 (100.0%) | 0 (0.0%) |
| Firefighting & Prevention | 19 (100.0%) | 0 (0.0%) |
| Law Enforcement | 50 (100.0%) | 0 (0.0%) |
| Food Preparation & Serving | 18 (8.9%) | 184 (91.1%) |
| Cleaning & Maintenance | 41 (64.1%) | 23 (35.9%) |
| Personal Care & Service | 0 (0.0%) | 130 (100.0%) |
| Total (Category) | 175 (31.7%) | 378 (68.3%) |
| Total (Overall) | 1,928 (53.1%) | 1,700 (46.9%) |
Sales and Office Occupations
The most common Sales and Office occupations in Harrisville are Office & Administration (713 | 19.7%), and Sales & Related (364 | 10.0%).

Sales and Office Occupations by Sex

| Occupation | Male | Female |
| Sales & Related | 294 (80.8%) | 70 (19.2%) |
| Office & Administration | 125 (17.5%) | 588 (82.5%) |
| Total (Category) | 419 (38.9%) | 658 (61.1%) |
| Total (Overall) | 1,928 (53.1%) | 1,700 (46.9%) |
Natural Resources, Construction and Maintenance Occupations
The most common Natural Resources, Construction and Maintenance occupations in Harrisville are Construction & Extraction (407 | 11.2%), and Installation, Maintenance & Repair (75 | 2.1%).
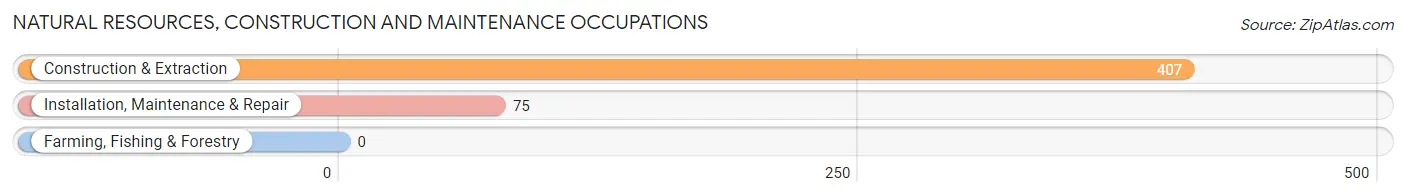
Natural Resources, Construction and Maintenance Occupations by Sex

| Occupation | Male | Female |
| Farming, Fishing & Forestry | 0 (0.0%) | 0 (0.0%) |
| Construction & Extraction | 407 (100.0%) | 0 (0.0%) |
| Installation, Maintenance & Repair | 70 (93.3%) | 5 (6.7%) |
| Total (Category) | 477 (99.0%) | 5 (1.0%) |
| Total (Overall) | 1,928 (53.1%) | 1,700 (46.9%) |
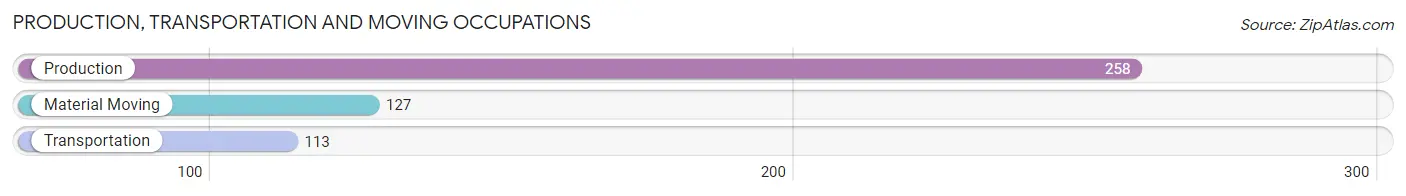
Production, Transportation and Moving Occupations
The most common Production, Transportation and Moving occupations in Harrisville are Production (258 | 7.1%), Material Moving (127 | 3.5%), and Transportation (113 | 3.1%).
Production, Transportation and Moving Occupations by Sex
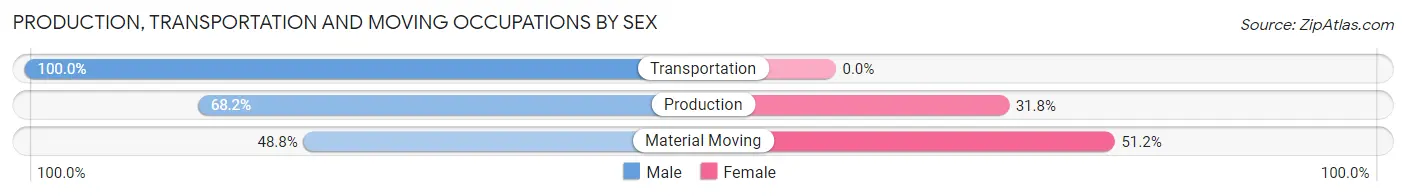
| Occupation | Male | Female |
| Production | 176 (68.2%) | 82 (31.8%) |
| Transportation | 113 (100.0%) | 0 (0.0%) |
| Material Moving | 62 (48.8%) | 65 (51.2%) |
| Total (Category) | 351 (70.5%) | 147 (29.5%) |
| Total (Overall) | 1,928 (53.1%) | 1,700 (46.9%) |
Employment Industries by Sex in Harrisville
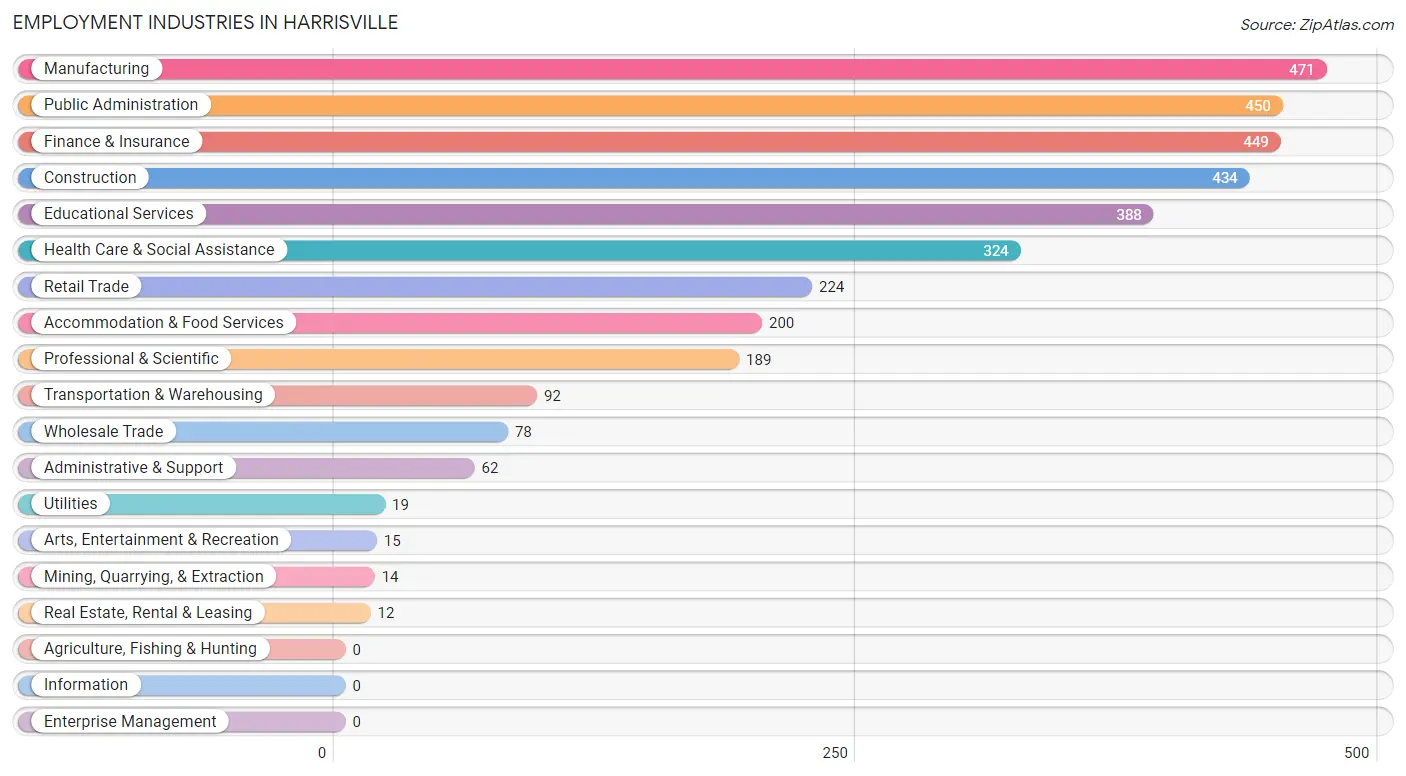
Employment Industries in Harrisville
The major employment industries in Harrisville include Manufacturing (471 | 13.0%), Public Administration (450 | 12.4%), Finance & Insurance (449 | 12.4%), Construction (434 | 12.0%), and Educational Services (388 | 10.7%).
Employment Industries by Sex in Harrisville
The Harrisville industries that see more men than women are Mining, Quarrying, & Extraction (100.0%), Construction (100.0%), and Wholesale Trade (100.0%), whereas the industries that tend to have a higher number of women are Real Estate, Rental & Leasing (100.0%), Accommodation & Food Services (91.0%), and Educational Services (78.6%).
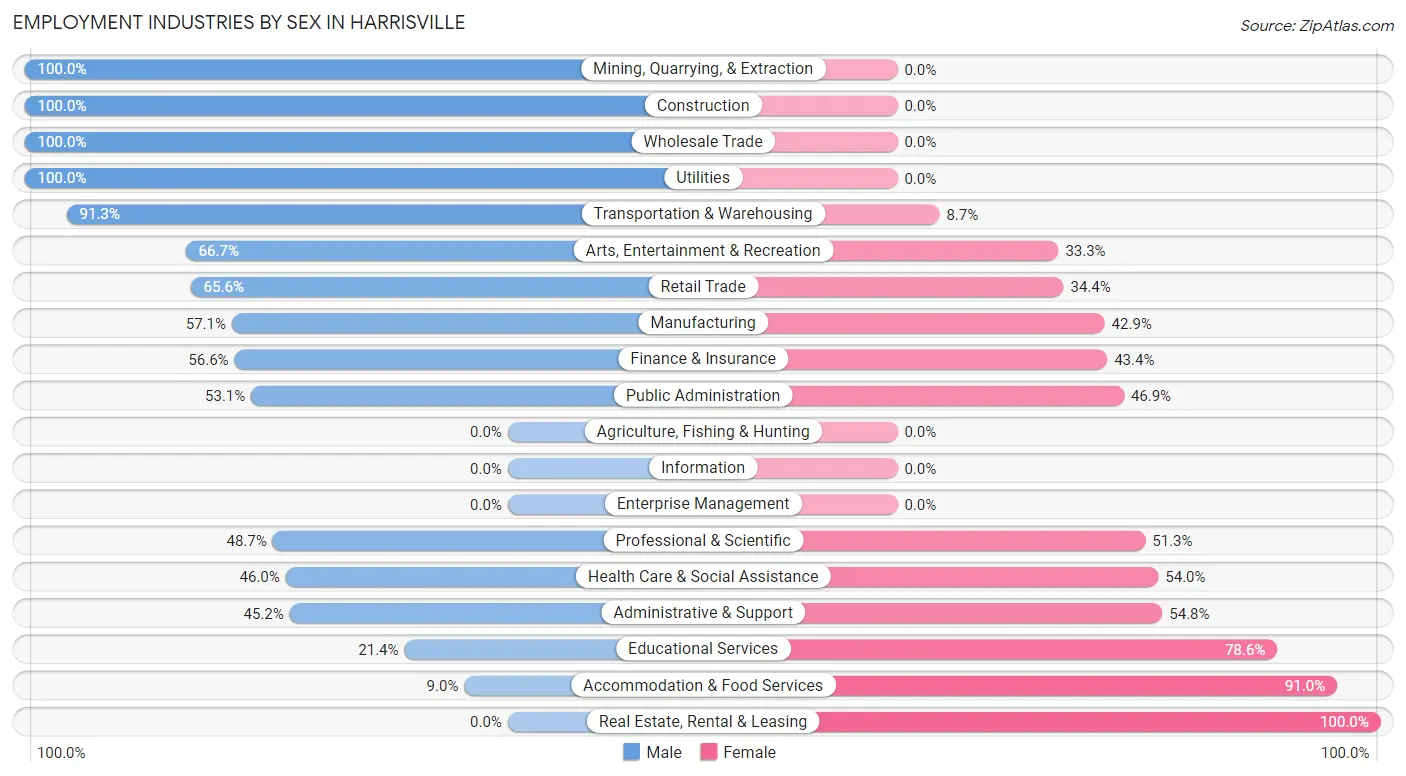
| Industry | Male | Female |
| Agriculture, Fishing & Hunting | 0 (0.0%) | 0 (0.0%) |
| Mining, Quarrying, & Extraction | 14 (100.0%) | 0 (0.0%) |
| Construction | 434 (100.0%) | 0 (0.0%) |
| Manufacturing | 269 (57.1%) | 202 (42.9%) |
| Wholesale Trade | 78 (100.0%) | 0 (0.0%) |
| Retail Trade | 147 (65.6%) | 77 (34.4%) |
| Transportation & Warehousing | 84 (91.3%) | 8 (8.7%) |
| Utilities | 19 (100.0%) | 0 (0.0%) |
| Information | 0 (0.0%) | 0 (0.0%) |
| Finance & Insurance | 254 (56.6%) | 195 (43.4%) |
| Real Estate, Rental & Leasing | 0 (0.0%) | 12 (100.0%) |
| Professional & Scientific | 92 (48.7%) | 97 (51.3%) |
| Enterprise Management | 0 (0.0%) | 0 (0.0%) |
| Administrative & Support | 28 (45.2%) | 34 (54.8%) |
| Educational Services | 83 (21.4%) | 305 (78.6%) |
| Health Care & Social Assistance | 149 (46.0%) | 175 (54.0%) |
| Arts, Entertainment & Recreation | 10 (66.7%) | 5 (33.3%) |
| Accommodation & Food Services | 18 (9.0%) | 182 (91.0%) |
| Public Administration | 239 (53.1%) | 211 (46.9%) |
| Total | 1,928 (53.1%) | 1,700 (46.9%) |
Education in Harrisville
School Enrollment in Harrisville
The most common levels of schooling among the 2,431 students in Harrisville are high school (571 | 23.5%), middle school (552 | 22.7%), and elementary school (543 | 22.3%).
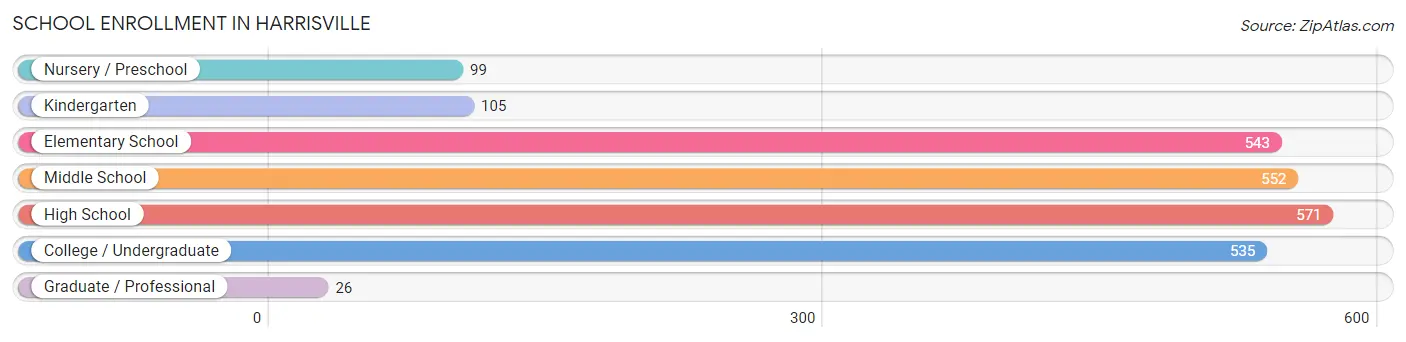
| School Level | # Students | % Students |
| Nursery / Preschool | 99 | 4.1% |
| Kindergarten | 105 | 4.3% |
| Elementary School | 543 | 22.3% |
| Middle School | 552 | 22.7% |
| High School | 571 | 23.5% |
| College / Undergraduate | 535 | 22.0% |
| Graduate / Professional | 26 | 1.1% |
| Total | 2,431 | 100.0% |
School Enrollment by Age by Funding Source in Harrisville
Out of a total of 2,431 students who are enrolled in schools in Harrisville, 192 (7.9%) attend a private institution, while the remaining 2,239 (92.1%) are enrolled in public schools. The age group of 25 to 34 year olds has the highest likelihood of being enrolled in private schools, with 114 (56.7% in the age bracket) enrolled. Conversely, the age group of 3 to 4 year olds has the lowest likelihood of being enrolled in a private school, with 71 (100.0% in the age bracket) attending a public institution.
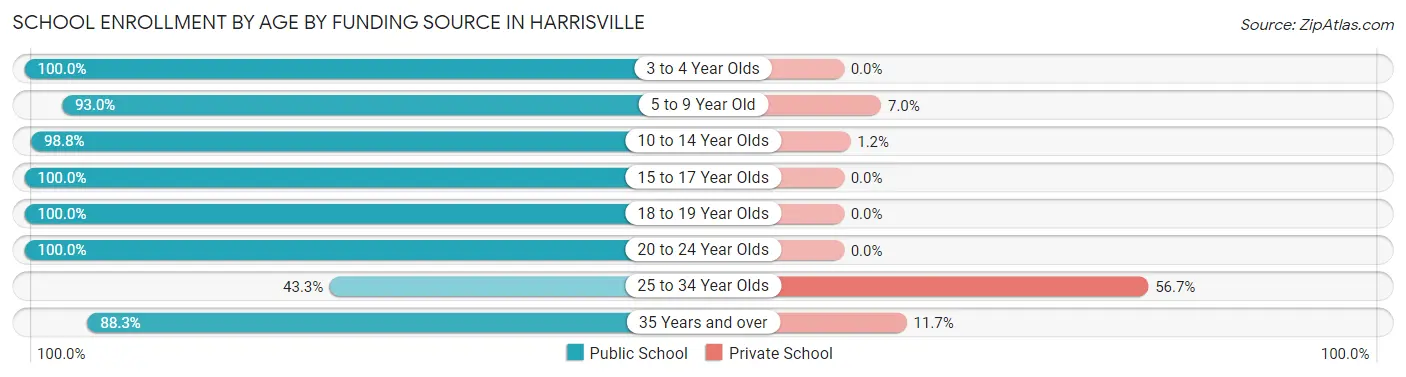
| Age Bracket | Public School | Private School |
| 3 to 4 Year Olds | 71 (100.0%) | 0 (0.0%) |
| 5 to 9 Year Old | 602 (93.0%) | 45 (7.0%) |
| 10 to 14 Year Olds | 644 (98.8%) | 8 (1.2%) |
| 15 to 17 Year Olds | 387 (100.0%) | 0 (0.0%) |
| 18 to 19 Year Olds | 217 (100.0%) | 0 (0.0%) |
| 20 to 24 Year Olds | 34 (100.0%) | 0 (0.0%) |
| 25 to 34 Year Olds | 87 (43.3%) | 114 (56.7%) |
| 35 Years and over | 196 (88.3%) | 26 (11.7%) |
| Total | 2,239 (92.1%) | 192 (7.9%) |
Educational Attainment by Field of Study in Harrisville
Business (246 | 26.8%), education (113 | 12.3%), bio, nature & agricultural (111 | 12.1%), science & technology (98 | 10.7%), and communications (72 | 7.8%) are the most common fields of study among 918 individuals in Harrisville who have obtained a bachelor's degree or higher.
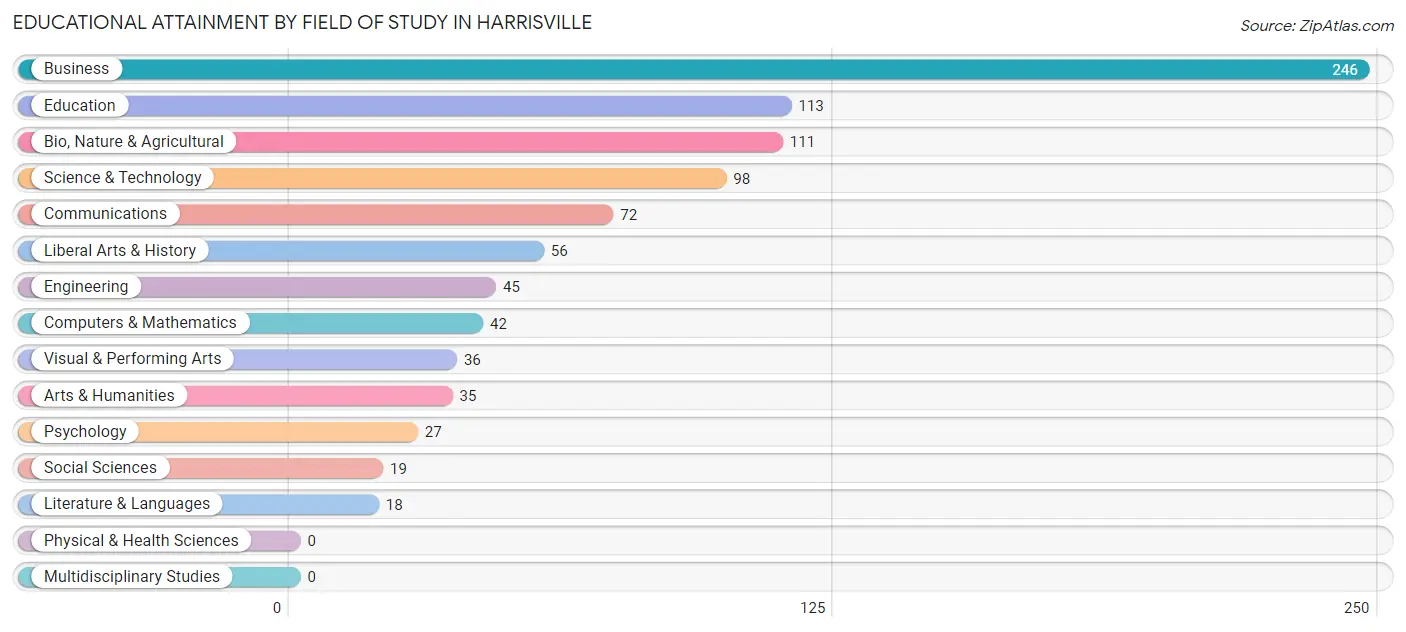
| Field of Study | # Graduates | % Graduates |
| Computers & Mathematics | 42 | 4.6% |
| Bio, Nature & Agricultural | 111 | 12.1% |
| Physical & Health Sciences | 0 | 0.0% |
| Psychology | 27 | 2.9% |
| Social Sciences | 19 | 2.1% |
| Engineering | 45 | 4.9% |
| Multidisciplinary Studies | 0 | 0.0% |
| Science & Technology | 98 | 10.7% |
| Business | 246 | 26.8% |
| Education | 113 | 12.3% |
| Literature & Languages | 18 | 2.0% |
| Liberal Arts & History | 56 | 6.1% |
| Visual & Performing Arts | 36 | 3.9% |
| Communications | 72 | 7.8% |
| Arts & Humanities | 35 | 3.8% |
| Total | 918 | 100.0% |
Transportation & Commute in Harrisville
Vehicle Availability by Sex in Harrisville
The most prevalent vehicle ownership categories in Harrisville are males with 2 vehicles (624, accounting for 32.5%) and females with 2 vehicles (372, making up 37.2%).
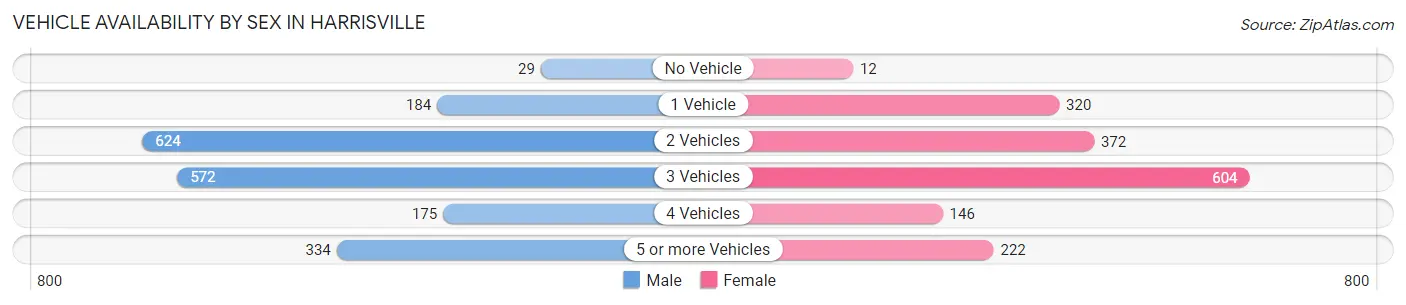
| Vehicles Available | Male | Female |
| No Vehicle | 29 (1.5%) | 12 (0.7%) |
| 1 Vehicle | 184 (9.6%) | 320 (19.1%) |
| 2 Vehicles | 624 (32.5%) | 372 (22.2%) |
| 3 Vehicles | 572 (29.8%) | 604 (36.0%) |
| 4 Vehicles | 175 (9.1%) | 146 (8.7%) |
| 5 or more Vehicles | 334 (17.4%) | 222 (13.3%) |
| Total | 1,918 (100.0%) | 1,676 (100.0%) |
Commute Time in Harrisville
The most frequently occuring commute durations in Harrisville are 10 to 14 minutes (586 commuters, 17.3%), 5 to 9 minutes (574 commuters, 17.0%), and 15 to 19 minutes (573 commuters, 16.9%).
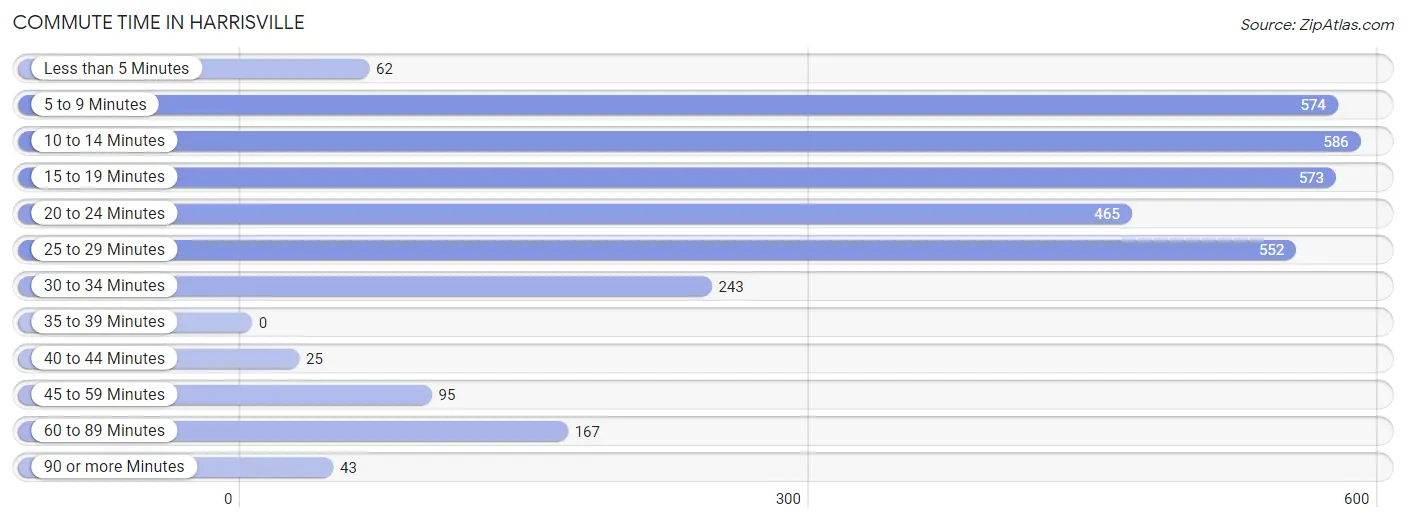
| Commute Time | # Commuters | % Commuters |
| Less than 5 Minutes | 62 | 1.8% |
| 5 to 9 Minutes | 574 | 17.0% |
| 10 to 14 Minutes | 586 | 17.3% |
| 15 to 19 Minutes | 573 | 16.9% |
| 20 to 24 Minutes | 465 | 13.7% |
| 25 to 29 Minutes | 552 | 16.3% |
| 30 to 34 Minutes | 243 | 7.2% |
| 35 to 39 Minutes | 0 | 0.0% |
| 40 to 44 Minutes | 25 | 0.7% |
| 45 to 59 Minutes | 95 | 2.8% |
| 60 to 89 Minutes | 167 | 4.9% |
| 90 or more Minutes | 43 | 1.3% |
Commute Time by Sex in Harrisville
The most common commute times in Harrisville are 15 to 19 minutes (377 commuters, 20.5%) for males and 10 to 14 minutes (333 commuters, 21.5%) for females.
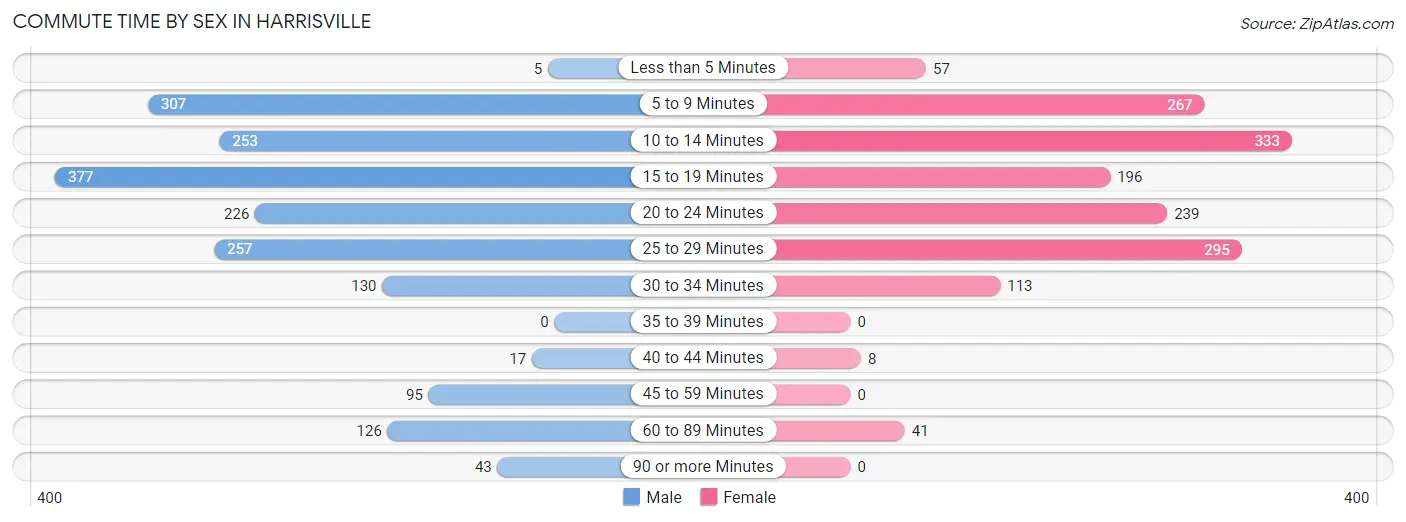
| Commute Time | Male | Female |
| Less than 5 Minutes | 5 (0.3%) | 57 (3.7%) |
| 5 to 9 Minutes | 307 (16.7%) | 267 (17.2%) |
| 10 to 14 Minutes | 253 (13.8%) | 333 (21.5%) |
| 15 to 19 Minutes | 377 (20.5%) | 196 (12.7%) |
| 20 to 24 Minutes | 226 (12.3%) | 239 (15.4%) |
| 25 to 29 Minutes | 257 (14.0%) | 295 (19.0%) |
| 30 to 34 Minutes | 130 (7.1%) | 113 (7.3%) |
| 35 to 39 Minutes | 0 (0.0%) | 0 (0.0%) |
| 40 to 44 Minutes | 17 (0.9%) | 8 (0.5%) |
| 45 to 59 Minutes | 95 (5.2%) | 0 (0.0%) |
| 60 to 89 Minutes | 126 (6.9%) | 41 (2.6%) |
| 90 or more Minutes | 43 (2.3%) | 0 (0.0%) |
Time of Departure to Work by Sex in Harrisville
The most frequent times of departure to work in Harrisville are 7:00 AM to 7:29 AM (364, 19.8%) for males and 7:00 AM to 7:29 AM (262, 16.9%) for females.
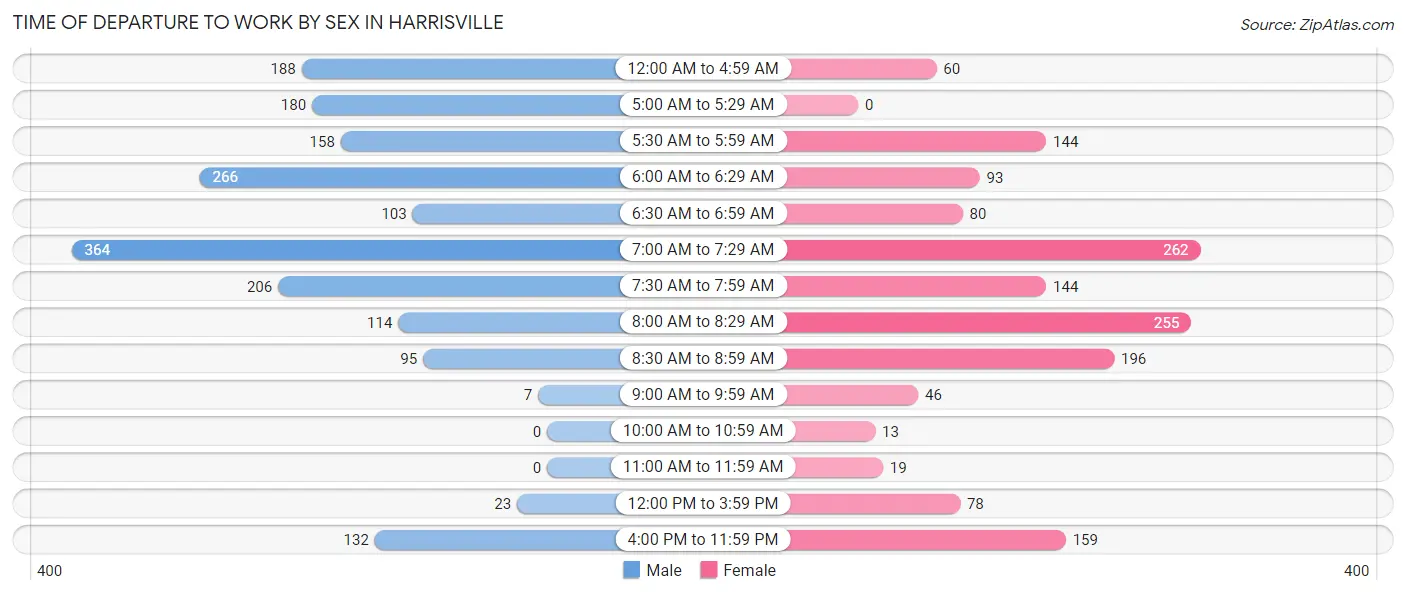
| Time of Departure | Male | Female |
| 12:00 AM to 4:59 AM | 188 (10.2%) | 60 (3.9%) |
| 5:00 AM to 5:29 AM | 180 (9.8%) | 0 (0.0%) |
| 5:30 AM to 5:59 AM | 158 (8.6%) | 144 (9.3%) |
| 6:00 AM to 6:29 AM | 266 (14.5%) | 93 (6.0%) |
| 6:30 AM to 6:59 AM | 103 (5.6%) | 80 (5.2%) |
| 7:00 AM to 7:29 AM | 364 (19.8%) | 262 (16.9%) |
| 7:30 AM to 7:59 AM | 206 (11.2%) | 144 (9.3%) |
| 8:00 AM to 8:29 AM | 114 (6.2%) | 255 (16.5%) |
| 8:30 AM to 8:59 AM | 95 (5.2%) | 196 (12.7%) |
| 9:00 AM to 9:59 AM | 7 (0.4%) | 46 (3.0%) |
| 10:00 AM to 10:59 AM | 0 (0.0%) | 13 (0.8%) |
| 11:00 AM to 11:59 AM | 0 (0.0%) | 19 (1.2%) |
| 12:00 PM to 3:59 PM | 23 (1.3%) | 78 (5.0%) |
| 4:00 PM to 11:59 PM | 132 (7.2%) | 159 (10.3%) |
| Total | 1,836 (100.0%) | 1,549 (100.0%) |
Housing Occupancy in Harrisville
Occupancy by Ownership in Harrisville
Of the total 2,193 dwellings in Harrisville, owner-occupied units account for 1,854 (84.5%), while renter-occupied units make up 339 (15.5%).
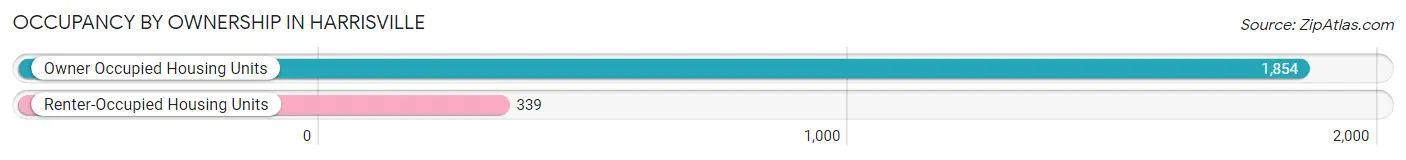
| Occupancy | # Housing Units | % Housing Units |
| Owner Occupied Housing Units | 1,854 | 84.5% |
| Renter-Occupied Housing Units | 339 | 15.5% |
| Total Occupied Housing Units | 2,193 | 100.0% |
Occupancy by Household Size in Harrisville
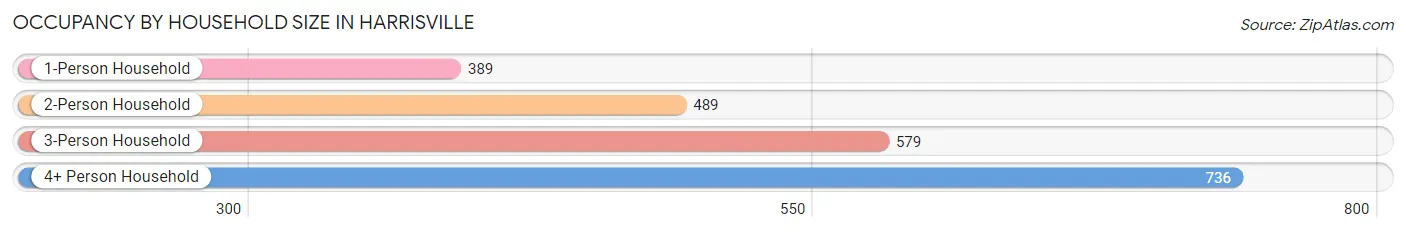
| Household Size | # Housing Units | % Housing Units |
| 1-Person Household | 389 | 17.7% |
| 2-Person Household | 489 | 22.3% |
| 3-Person Household | 579 | 26.4% |
| 4+ Person Household | 736 | 33.6% |
| Total Housing Units | 2,193 | 100.0% |
Occupancy by Ownership by Household Size in Harrisville
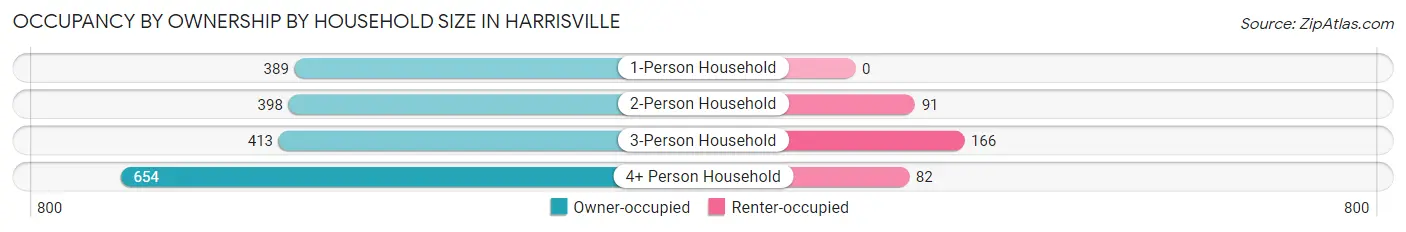
| Household Size | Owner-occupied | Renter-occupied |
| 1-Person Household | 389 (100.0%) | 0 (0.0%) |
| 2-Person Household | 398 (81.4%) | 91 (18.6%) |
| 3-Person Household | 413 (71.3%) | 166 (28.7%) |
| 4+ Person Household | 654 (88.9%) | 82 (11.1%) |
| Total Housing Units | 1,854 (84.5%) | 339 (15.5%) |
Occupancy by Educational Attainment in Harrisville
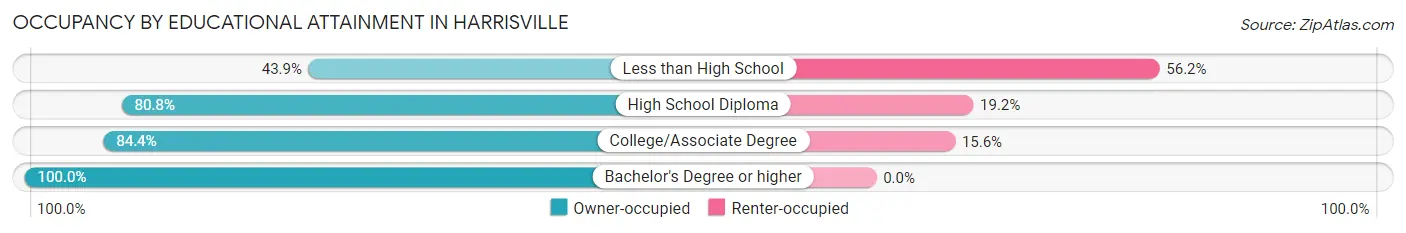
| Household Size | Owner-occupied | Renter-occupied |
| Less than High School | 57 (43.9%) | 73 (56.1%) |
| High School Diploma | 437 (80.8%) | 104 (19.2%) |
| College/Associate Degree | 875 (84.4%) | 162 (15.6%) |
| Bachelor's Degree or higher | 485 (100.0%) | 0 (0.0%) |
Occupancy by Age of Householder in Harrisville
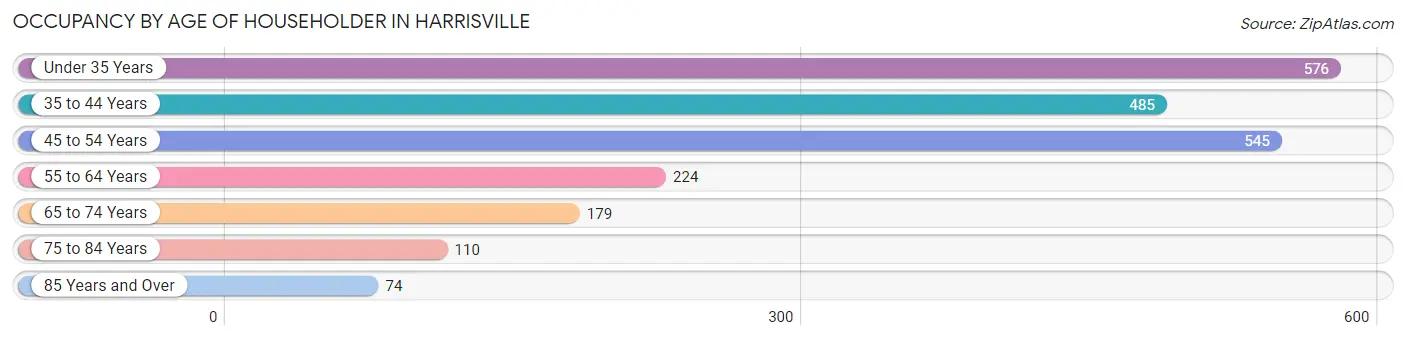
| Age Bracket | # Households | % Households |
| Under 35 Years | 576 | 26.3% |
| 35 to 44 Years | 485 | 22.1% |
| 45 to 54 Years | 545 | 24.8% |
| 55 to 64 Years | 224 | 10.2% |
| 65 to 74 Years | 179 | 8.2% |
| 75 to 84 Years | 110 | 5.0% |
| 85 Years and Over | 74 | 3.4% |
| Total | 2,193 | 100.0% |
Housing Finances in Harrisville
Median Income by Occupancy in Harrisville
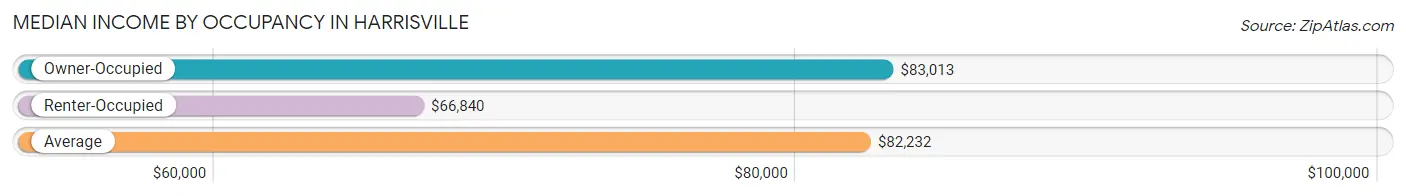
| Occupancy Type | # Households | Median Income |
| Owner-Occupied | 1,854 (84.5%) | $83,013 |
| Renter-Occupied | 339 (15.5%) | $66,840 |
| Average | 2,193 (100.0%) | $82,232 |
Occupancy by Householder Income Bracket in Harrisville
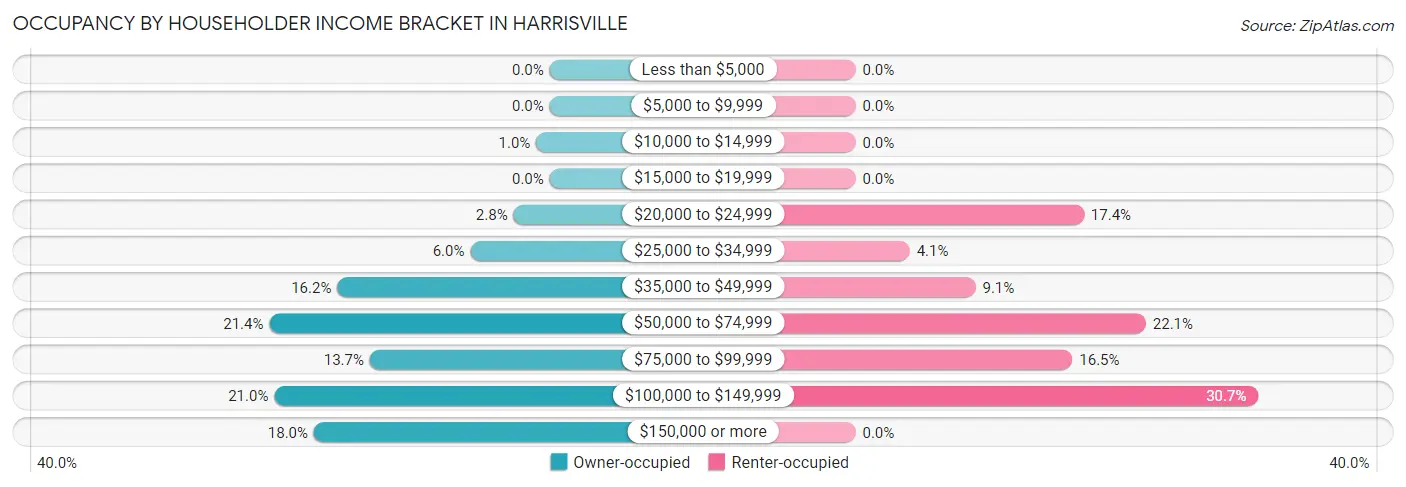
| Income Bracket | Owner-occupied | Renter-occupied |
| Less than $5,000 | 0 (0.0%) | 0 (0.0%) |
| $5,000 to $9,999 | 0 (0.0%) | 0 (0.0%) |
| $10,000 to $14,999 | 19 (1.0%) | 0 (0.0%) |
| $15,000 to $19,999 | 0 (0.0%) | 0 (0.0%) |
| $20,000 to $24,999 | 51 (2.8%) | 59 (17.4%) |
| $25,000 to $34,999 | 112 (6.0%) | 14 (4.1%) |
| $35,000 to $49,999 | 300 (16.2%) | 31 (9.1%) |
| $50,000 to $74,999 | 396 (21.4%) | 75 (22.1%) |
| $75,000 to $99,999 | 254 (13.7%) | 56 (16.5%) |
| $100,000 to $149,999 | 389 (21.0%) | 104 (30.7%) |
| $150,000 or more | 333 (18.0%) | 0 (0.0%) |
| Total | 1,854 (100.0%) | 339 (100.0%) |
Monthly Housing Cost Tiers in Harrisville
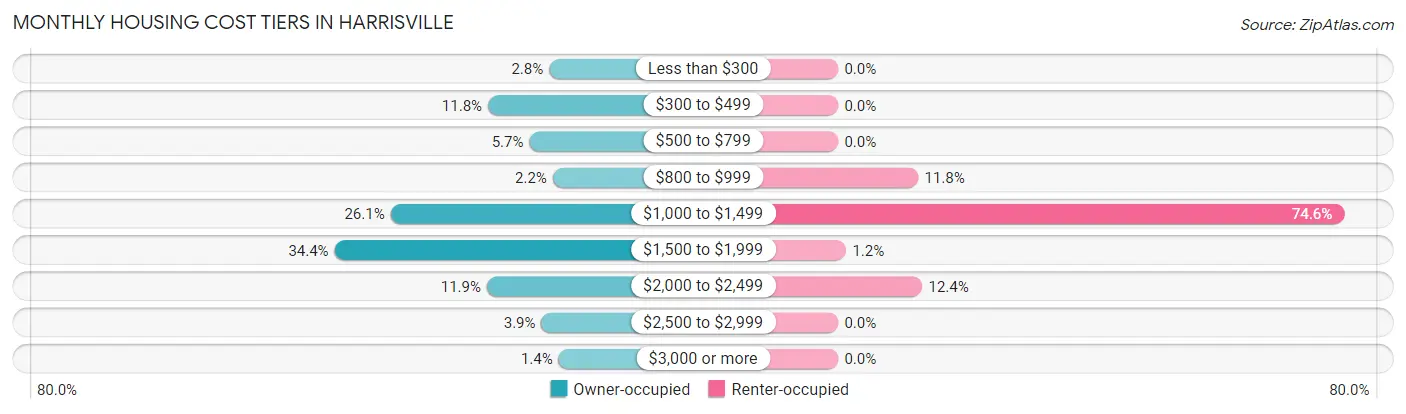
| Monthly Cost | Owner-occupied | Renter-occupied |
| Less than $300 | 51 (2.8%) | 0 (0.0%) |
| $300 to $499 | 218 (11.8%) | 0 (0.0%) |
| $500 to $799 | 105 (5.7%) | 0 (0.0%) |
| $800 to $999 | 41 (2.2%) | 40 (11.8%) |
| $1,000 to $1,499 | 484 (26.1%) | 253 (74.6%) |
| $1,500 to $1,999 | 637 (34.4%) | 4 (1.2%) |
| $2,000 to $2,499 | 221 (11.9%) | 42 (12.4%) |
| $2,500 to $2,999 | 72 (3.9%) | 0 (0.0%) |
| $3,000 or more | 25 (1.3%) | 0 (0.0%) |
| Total | 1,854 (100.0%) | 339 (100.0%) |
Physical Housing Characteristics in Harrisville
Housing Structures in Harrisville
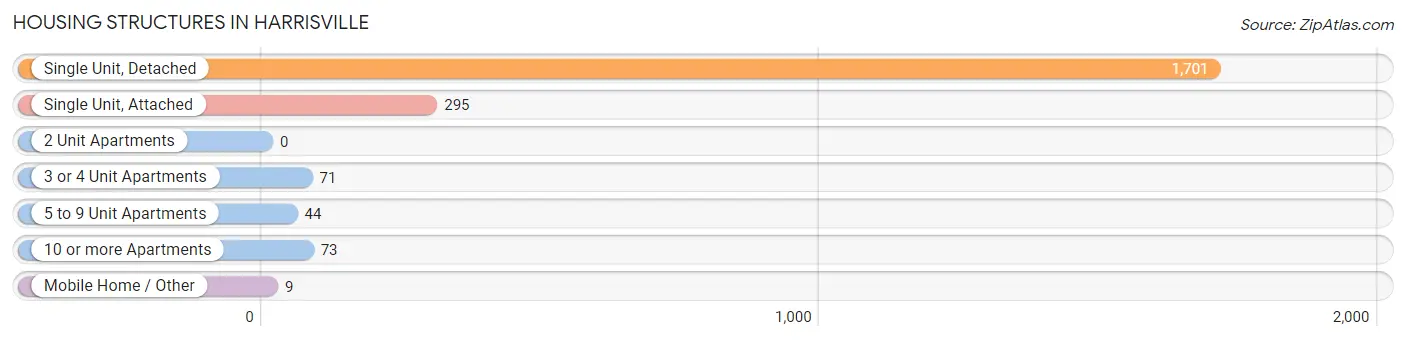
| Structure Type | # Housing Units | % Housing Units |
| Single Unit, Detached | 1,701 | 77.6% |
| Single Unit, Attached | 295 | 13.5% |
| 2 Unit Apartments | 0 | 0.0% |
| 3 or 4 Unit Apartments | 71 | 3.2% |
| 5 to 9 Unit Apartments | 44 | 2.0% |
| 10 or more Apartments | 73 | 3.3% |
| Mobile Home / Other | 9 | 0.4% |
| Total | 2,193 | 100.0% |
Housing Structures by Occupancy in Harrisville
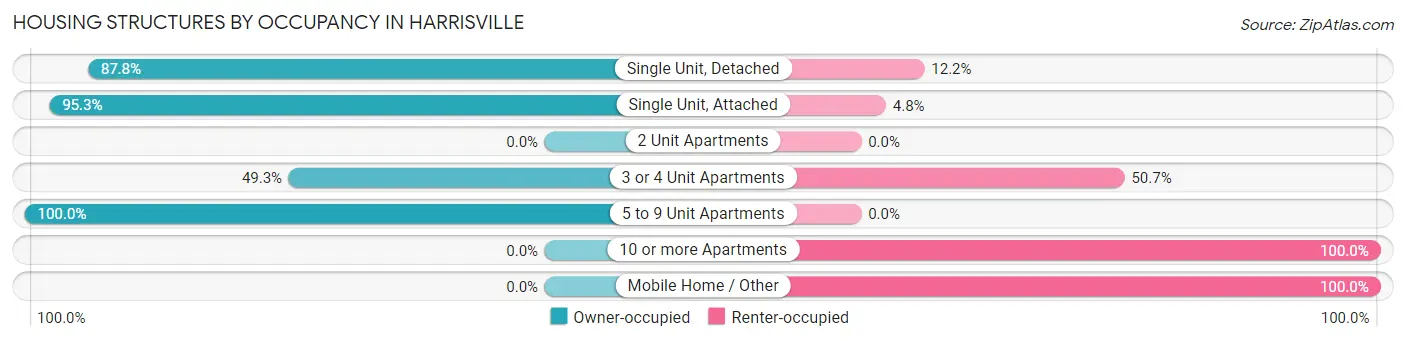
| Structure Type | Owner-occupied | Renter-occupied |
| Single Unit, Detached | 1,494 (87.8%) | 207 (12.2%) |
| Single Unit, Attached | 281 (95.3%) | 14 (4.8%) |
| 2 Unit Apartments | 0 (0.0%) | 0 (0.0%) |
| 3 or 4 Unit Apartments | 35 (49.3%) | 36 (50.7%) |
| 5 to 9 Unit Apartments | 44 (100.0%) | 0 (0.0%) |
| 10 or more Apartments | 0 (0.0%) | 73 (100.0%) |
| Mobile Home / Other | 0 (0.0%) | 9 (100.0%) |
| Total | 1,854 (84.5%) | 339 (15.5%) |
Housing Structures by Number of Rooms in Harrisville
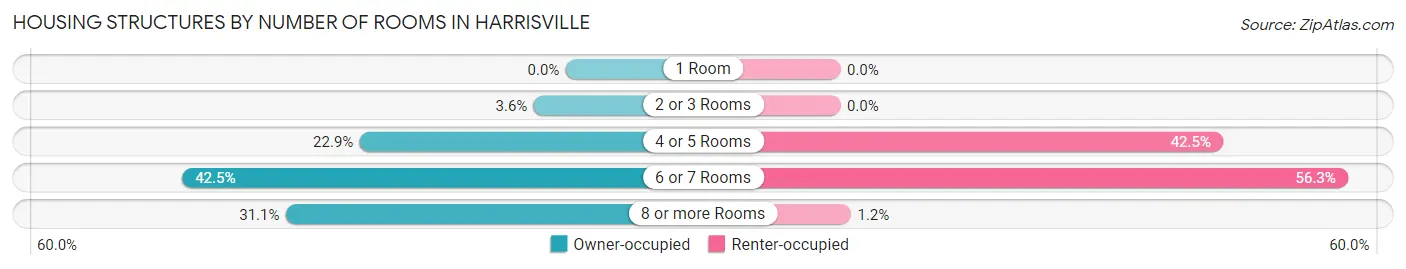
| Number of Rooms | Owner-occupied | Renter-occupied |
| 1 Room | 0 (0.0%) | 0 (0.0%) |
| 2 or 3 Rooms | 66 (3.6%) | 0 (0.0%) |
| 4 or 5 Rooms | 424 (22.9%) | 144 (42.5%) |
| 6 or 7 Rooms | 788 (42.5%) | 191 (56.3%) |
| 8 or more Rooms | 576 (31.1%) | 4 (1.2%) |
| Total | 1,854 (100.0%) | 339 (100.0%) |
Housing Structure by Heating Type in Harrisville
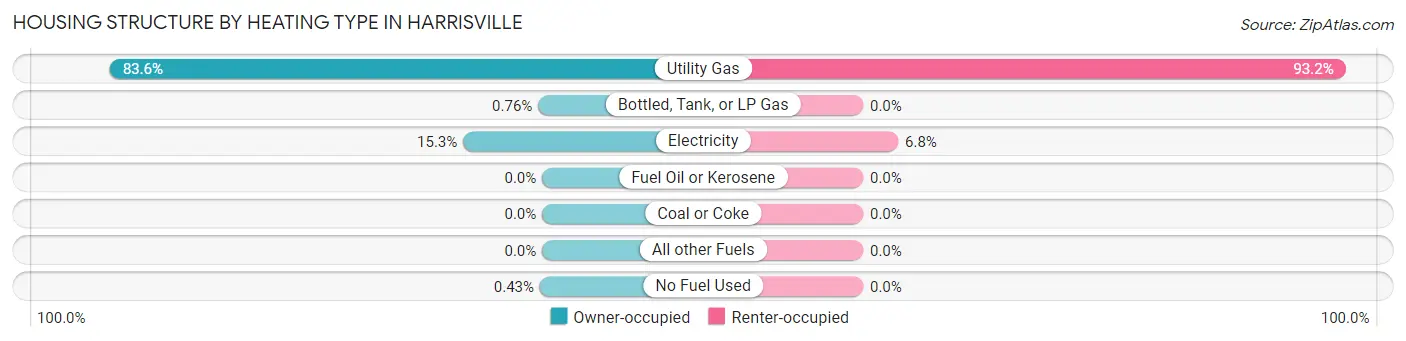
| Heating Type | Owner-occupied | Renter-occupied |
| Utility Gas | 1,549 (83.6%) | 316 (93.2%) |
| Bottled, Tank, or LP Gas | 14 (0.8%) | 0 (0.0%) |
| Electricity | 283 (15.3%) | 23 (6.8%) |
| Fuel Oil or Kerosene | 0 (0.0%) | 0 (0.0%) |
| Coal or Coke | 0 (0.0%) | 0 (0.0%) |
| All other Fuels | 0 (0.0%) | 0 (0.0%) |
| No Fuel Used | 8 (0.4%) | 0 (0.0%) |
| Total | 1,854 (100.0%) | 339 (100.0%) |
Household Vehicle Usage in Harrisville
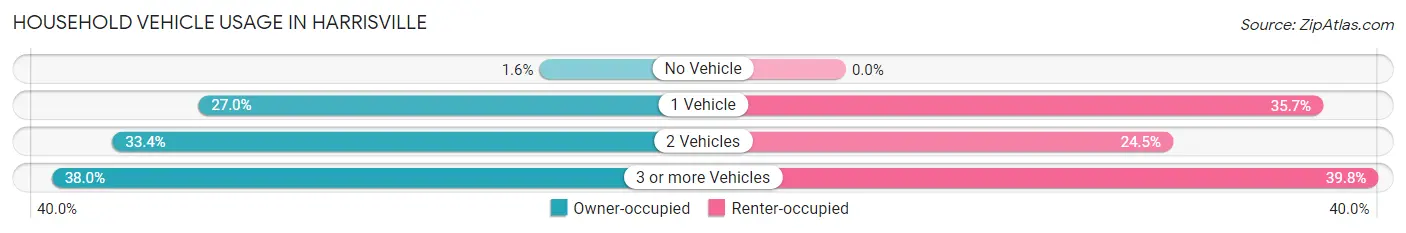
| Vehicles per Household | Owner-occupied | Renter-occupied |
| No Vehicle | 29 (1.6%) | 0 (0.0%) |
| 1 Vehicle | 501 (27.0%) | 121 (35.7%) |
| 2 Vehicles | 620 (33.4%) | 83 (24.5%) |
| 3 or more Vehicles | 704 (38.0%) | 135 (39.8%) |
| Total | 1,854 (100.0%) | 339 (100.0%) |
Real Estate & Mortgages in Harrisville
Real Estate and Mortgage Overview in Harrisville
| Characteristic | Without Mortgage | With Mortgage |
| Housing Units | 368 | 1,486 |
| Median Property Value | $372,700 | $343,100 |
| Median Household Income | $53,269 | $306 |
| Monthly Housing Costs | $452 | $25 |
| Real Estate Taxes | $2,385 | $19 |
Property Value by Mortgage Status in Harrisville
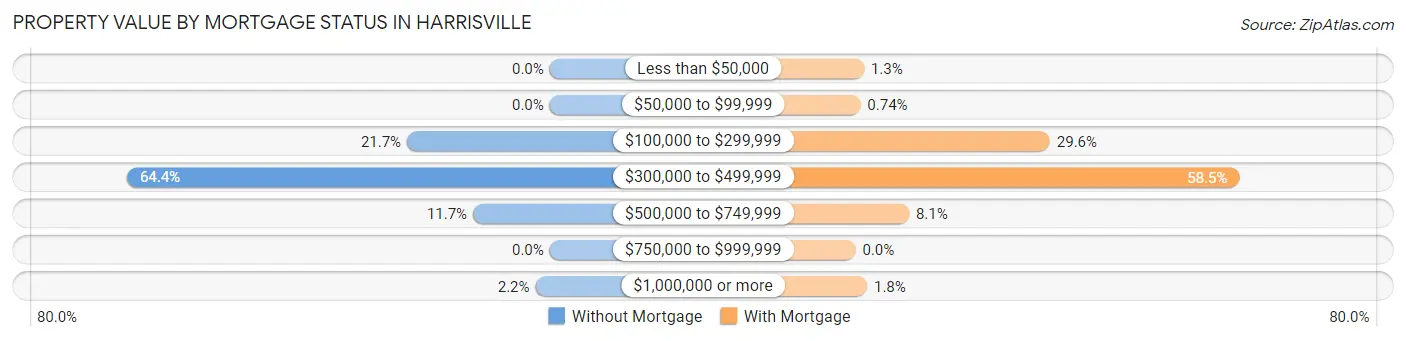
| Property Value | Without Mortgage | With Mortgage |
| Less than $50,000 | 0 (0.0%) | 19 (1.3%) |
| $50,000 to $99,999 | 0 (0.0%) | 11 (0.7%) |
| $100,000 to $299,999 | 80 (21.7%) | 440 (29.6%) |
| $300,000 to $499,999 | 237 (64.4%) | 869 (58.5%) |
| $500,000 to $749,999 | 43 (11.7%) | 121 (8.1%) |
| $750,000 to $999,999 | 0 (0.0%) | 0 (0.0%) |
| $1,000,000 or more | 8 (2.2%) | 26 (1.8%) |
| Total | 368 (100.0%) | 1,486 (100.0%) |
Household Income by Mortgage Status in Harrisville
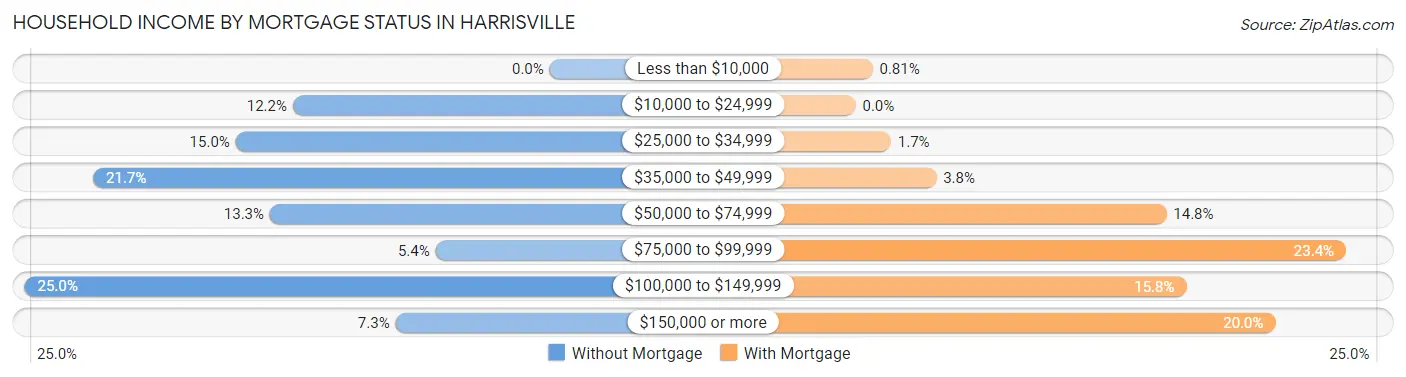
| Household Income | Without Mortgage | With Mortgage |
| Less than $10,000 | 0 (0.0%) | 12 (0.8%) |
| $10,000 to $24,999 | 45 (12.2%) | 0 (0.0%) |
| $25,000 to $34,999 | 55 (14.9%) | 25 (1.7%) |
| $35,000 to $49,999 | 80 (21.7%) | 57 (3.8%) |
| $50,000 to $74,999 | 49 (13.3%) | 220 (14.8%) |
| $75,000 to $99,999 | 20 (5.4%) | 347 (23.4%) |
| $100,000 to $149,999 | 92 (25.0%) | 234 (15.8%) |
| $150,000 or more | 27 (7.3%) | 297 (20.0%) |
| Total | 368 (100.0%) | 1,486 (100.0%) |
Property Value to Household Income Ratio in Harrisville
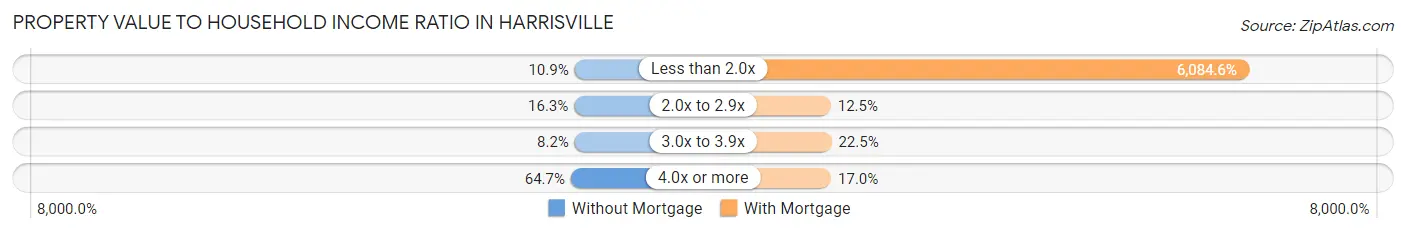
| Value-to-Income Ratio | Without Mortgage | With Mortgage |
| Less than 2.0x | 40 (10.9%) | 90,417 (6,084.6%) |
| 2.0x to 2.9x | 60 (16.3%) | 186 (12.5%) |
| 3.0x to 3.9x | 30 (8.2%) | 335 (22.5%) |
| 4.0x or more | 238 (64.7%) | 253 (17.0%) |
| Total | 368 (100.0%) | 1,486 (100.0%) |
Real Estate Taxes by Mortgage Status in Harrisville
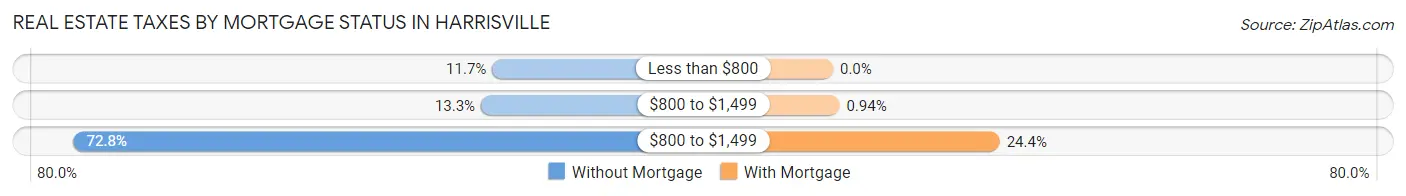
| Property Taxes | Without Mortgage | With Mortgage |
| Less than $800 | 43 (11.7%) | 0 (0.0%) |
| $800 to $1,499 | 49 (13.3%) | 14 (0.9%) |
| $800 to $1,499 | 268 (72.8%) | 362 (24.4%) |
| Total | 368 (100.0%) | 1,486 (100.0%) |
Health & Disability in Harrisville
Health Insurance Coverage by Age in Harrisville
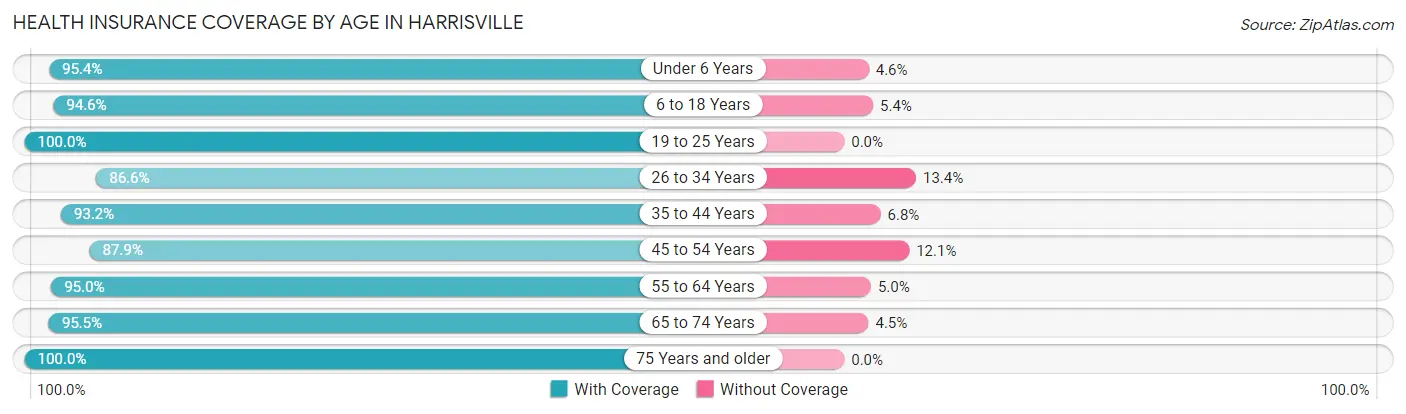
| Age Bracket | With Coverage | Without Coverage |
| Under 6 Years | 627 (95.4%) | 30 (4.6%) |
| 6 to 18 Years | 1,656 (94.6%) | 94 (5.4%) |
| 19 to 25 Years | 723 (100.0%) | 0 (0.0%) |
| 26 to 34 Years | 939 (86.6%) | 145 (13.4%) |
| 35 to 44 Years | 840 (93.2%) | 61 (6.8%) |
| 45 to 54 Years | 668 (87.9%) | 92 (12.1%) |
| 55 to 64 Years | 421 (95.0%) | 22 (5.0%) |
| 65 to 74 Years | 317 (95.5%) | 15 (4.5%) |
| 75 Years and older | 259 (100.0%) | 0 (0.0%) |
| Total | 6,450 (93.4%) | 459 (6.6%) |
Health Insurance Coverage by Citizenship Status in Harrisville
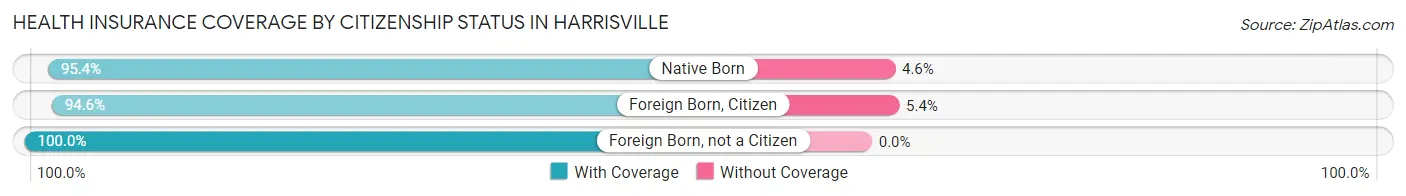
| Citizenship Status | With Coverage | Without Coverage |
| Native Born | 627 (95.4%) | 30 (4.6%) |
| Foreign Born, Citizen | 1,656 (94.6%) | 94 (5.4%) |
| Foreign Born, not a Citizen | 723 (100.0%) | 0 (0.0%) |
Health Insurance Coverage by Household Income in Harrisville
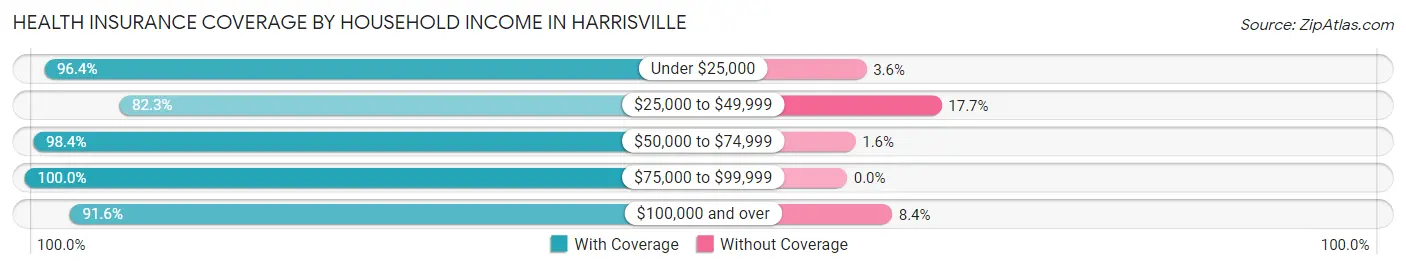
| Household Income | With Coverage | Without Coverage |
| Under $25,000 | 212 (96.4%) | 8 (3.6%) |
| $25,000 to $49,999 | 743 (82.3%) | 160 (17.7%) |
| $50,000 to $74,999 | 1,481 (98.4%) | 24 (1.6%) |
| $75,000 to $99,999 | 1,114 (100.0%) | 0 (0.0%) |
| $100,000 and over | 2,900 (91.6%) | 267 (8.4%) |
Public vs Private Health Insurance Coverage by Age in Harrisville
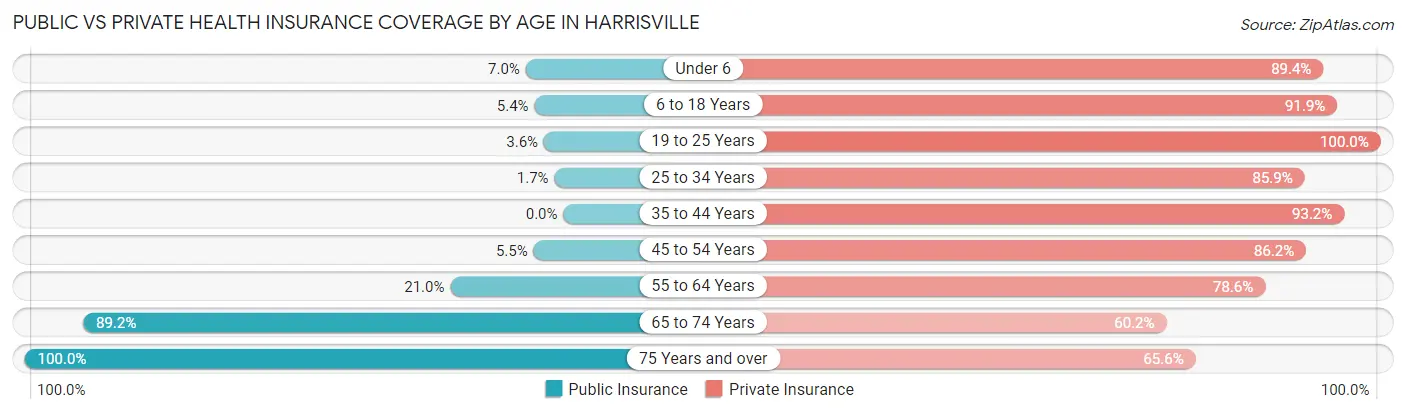
| Age Bracket | Public Insurance | Private Insurance |
| Under 6 | 46 (7.0%) | 587 (89.3%) |
| 6 to 18 Years | 94 (5.4%) | 1,609 (91.9%) |
| 19 to 25 Years | 26 (3.6%) | 723 (100.0%) |
| 25 to 34 Years | 18 (1.7%) | 931 (85.9%) |
| 35 to 44 Years | 0 (0.0%) | 840 (93.2%) |
| 45 to 54 Years | 42 (5.5%) | 655 (86.2%) |
| 55 to 64 Years | 93 (21.0%) | 348 (78.6%) |
| 65 to 74 Years | 296 (89.2%) | 200 (60.2%) |
| 75 Years and over | 259 (100.0%) | 170 (65.6%) |
| Total | 874 (12.7%) | 6,063 (87.8%) |
Disability Status by Sex by Age in Harrisville
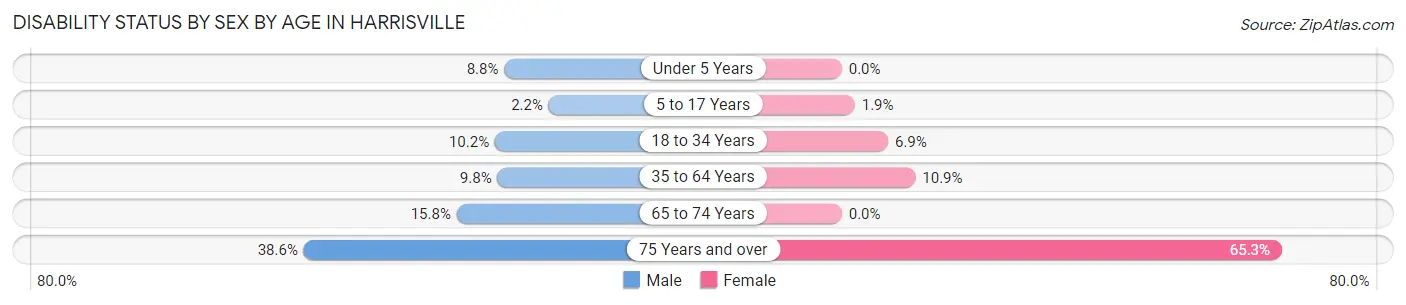
| Age Bracket | Male | Female |
| Under 5 Years | 35 (8.8%) | 0 (0.0%) |
| 5 to 17 Years | 17 (2.2%) | 18 (1.9%) |
| 18 to 34 Years | 104 (10.2%) | 62 (6.9%) |
| 35 to 64 Years | 101 (9.8%) | 117 (10.9%) |
| 65 to 74 Years | 19 (15.8%) | 0 (0.0%) |
| 75 Years and over | 32 (38.6%) | 115 (65.3%) |
Disability Class by Sex by Age in Harrisville
Disability Class: Hearing Difficulty
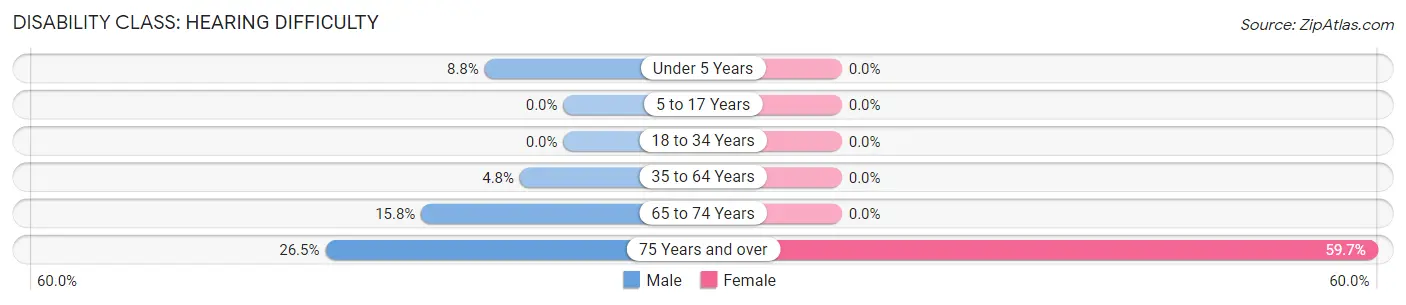
| Age Bracket | Male | Female |
| Under 5 Years | 35 (8.8%) | 0 (0.0%) |
| 5 to 17 Years | 0 (0.0%) | 0 (0.0%) |
| 18 to 34 Years | 0 (0.0%) | 0 (0.0%) |
| 35 to 64 Years | 50 (4.8%) | 0 (0.0%) |
| 65 to 74 Years | 19 (15.8%) | 0 (0.0%) |
| 75 Years and over | 22 (26.5%) | 105 (59.7%) |
Disability Class: Vision Difficulty
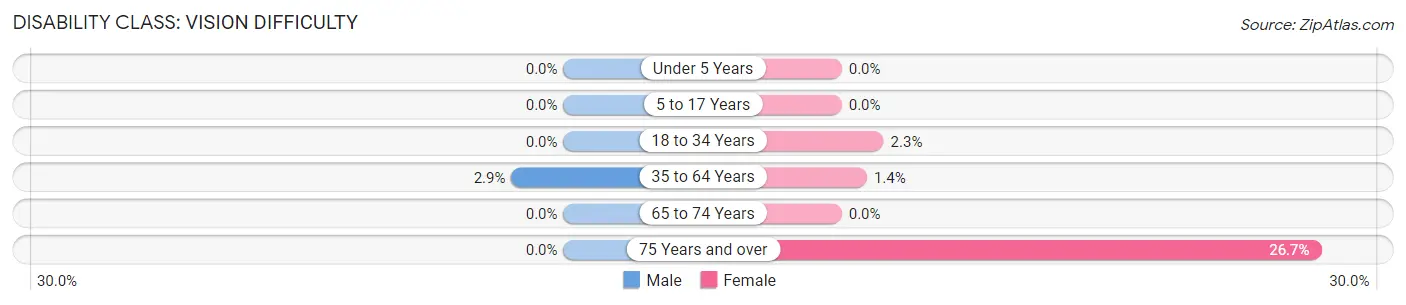
| Age Bracket | Male | Female |
| Under 5 Years | 0 (0.0%) | 0 (0.0%) |
| 5 to 17 Years | 0 (0.0%) | 0 (0.0%) |
| 18 to 34 Years | 0 (0.0%) | 21 (2.3%) |
| 35 to 64 Years | 30 (2.9%) | 15 (1.4%) |
| 65 to 74 Years | 0 (0.0%) | 0 (0.0%) |
| 75 Years and over | 0 (0.0%) | 47 (26.7%) |
Disability Class: Cognitive Difficulty
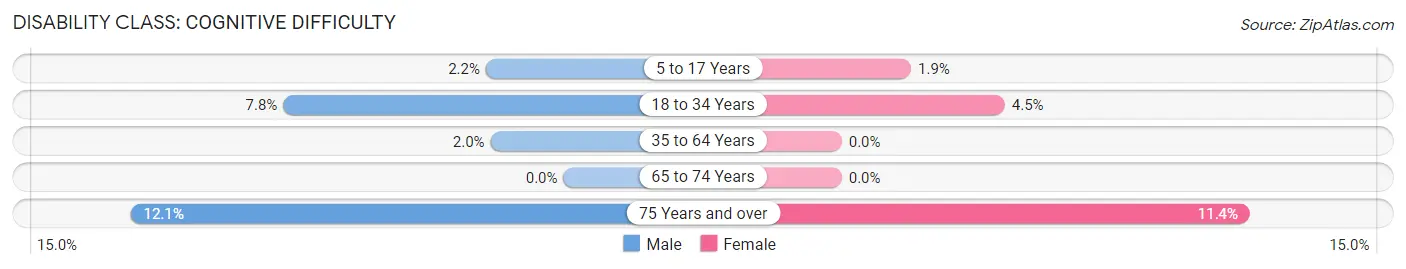
| Age Bracket | Male | Female |
| 5 to 17 Years | 17 (2.2%) | 18 (1.9%) |
| 18 to 34 Years | 80 (7.8%) | 41 (4.5%) |
| 35 to 64 Years | 21 (2.0%) | 0 (0.0%) |
| 65 to 74 Years | 0 (0.0%) | 0 (0.0%) |
| 75 Years and over | 10 (12.0%) | 20 (11.4%) |
Disability Class: Ambulatory Difficulty
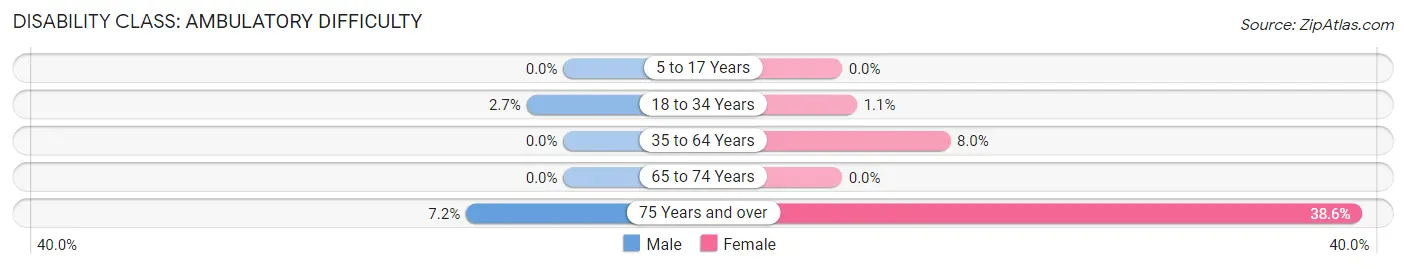
| Age Bracket | Male | Female |
| 5 to 17 Years | 0 (0.0%) | 0 (0.0%) |
| 18 to 34 Years | 28 (2.7%) | 10 (1.1%) |
| 35 to 64 Years | 0 (0.0%) | 86 (8.0%) |
| 65 to 74 Years | 0 (0.0%) | 0 (0.0%) |
| 75 Years and over | 6 (7.2%) | 68 (38.6%) |
Disability Class: Self-Care Difficulty
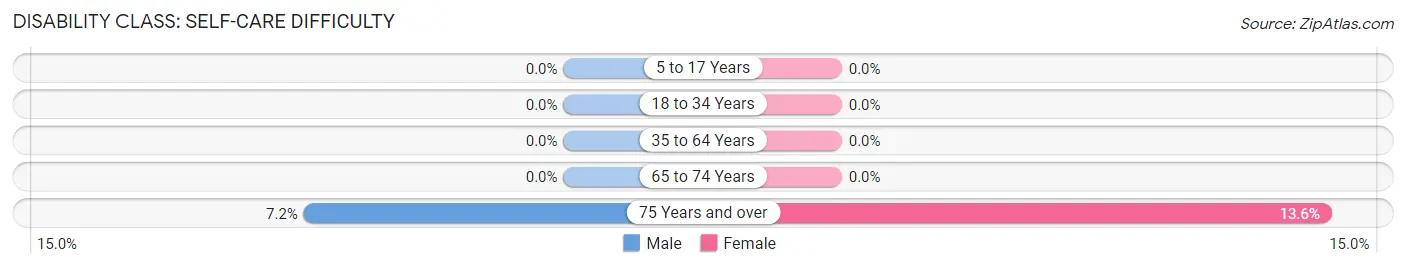
| Age Bracket | Male | Female |
| 5 to 17 Years | 0 (0.0%) | 0 (0.0%) |
| 18 to 34 Years | 0 (0.0%) | 0 (0.0%) |
| 35 to 64 Years | 0 (0.0%) | 0 (0.0%) |
| 65 to 74 Years | 0 (0.0%) | 0 (0.0%) |
| 75 Years and over | 6 (7.2%) | 24 (13.6%) |
Technology Access in Harrisville
Computing Device Access in Harrisville
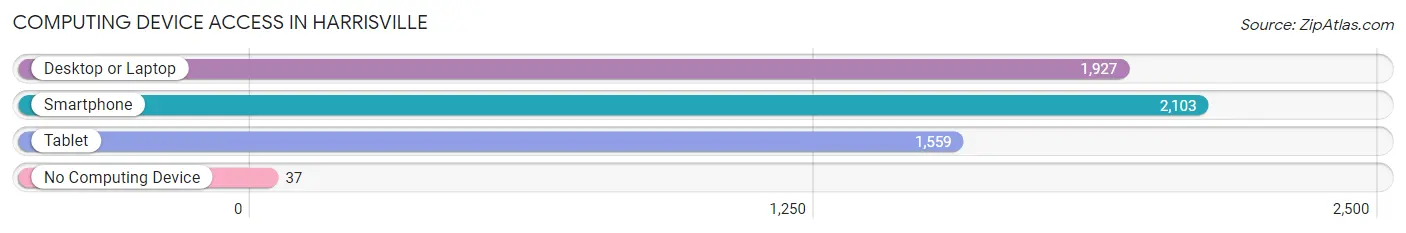
| Device Type | # Households | % Households |
| Desktop or Laptop | 1,927 | 87.9% |
| Smartphone | 2,103 | 95.9% |
| Tablet | 1,559 | 71.1% |
| No Computing Device | 37 | 1.7% |
| Total | 2,193 | 100.0% |
Internet Access in Harrisville
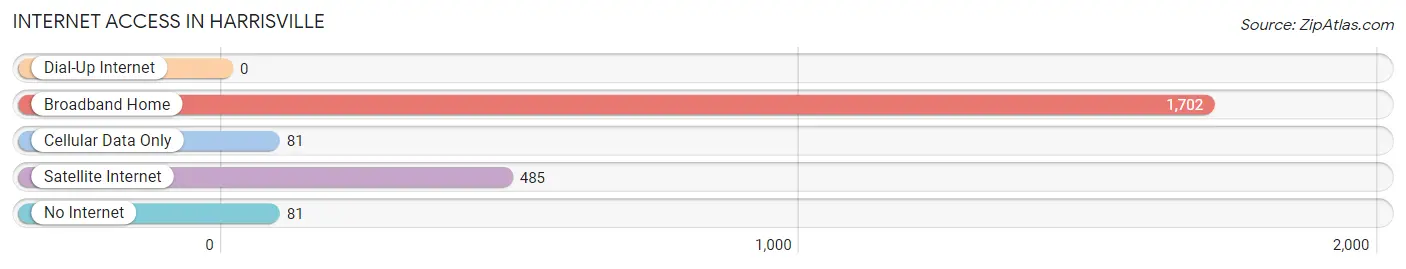
| Internet Type | # Households | % Households |
| Dial-Up Internet | 0 | 0.0% |
| Broadband Home | 1,702 | 77.6% |
| Cellular Data Only | 81 | 3.7% |
| Satellite Internet | 485 | 22.1% |
| No Internet | 81 | 3.7% |
| Total | 2,193 | 100.0% |
Harrisville Summary
Harville, Utah is a small town located in the southeastern corner of the state, near the border of Colorado. It is situated in the Wasatch Mountains, and is part of the Uintah Basin. The town was founded in 1876 by Mormon settlers, and is named after one of the original settlers, John Harville. The town has a population of approximately 1,000 people, and is known for its rural charm and friendly atmosphere.
Geography
Harville is located in the Uintah Basin, which is a large, flat area of land in the Wasatch Mountains. The town is situated at an elevation of 5,400 feet, and is surrounded by mountains and hills. The climate in Harville is semi-arid, with hot summers and cold winters. The average annual precipitation is approximately 10 inches.
The town is located near the Colorado border, and is about 30 miles from the nearest major city, Vernal. The nearest interstate highway is Interstate 70, which is about 40 miles away.
Economy
The economy of Harville is largely based on agriculture and tourism. The town is home to several farms, which produce a variety of crops, including hay, wheat, corn, and alfalfa. The town also has several small businesses, including a grocery store, a hardware store, and a restaurant.
Tourism is an important part of the economy in Harville. The town is located near several popular outdoor recreation areas, including the Uintah Mountains, the Flaming Gorge National Recreation Area, and the Dinosaur National Monument. The town also hosts several annual events, including the Harville Days Festival and the Harville Rodeo.
Demographics
As of the 2010 census, the population of Harville was 1,000 people. The racial makeup of the town was 97.2% White, 0.7% Native American, 0.3% Asian, 0.2% from other races, and 1.6% from two or more races. The median age of the population was 37.5 years.
The median household income in Harville was $37,500, and the median family income was $41,250. The per capita income was $17,500. About 11.2% of the population was below the poverty line.
Conclusion
Harville, Utah is a small town located in the southeastern corner of the state, near the border of Colorado. It is situated in the Wasatch Mountains, and is part of the Uintah Basin. The town was founded in 1876 by Mormon settlers, and is known for its rural charm and friendly atmosphere. The economy of Harville is largely based on agriculture and tourism, and the town is home to a population of approximately 1,000 people. The racial makeup of the town is predominantly White, with a small percentage of Native American, Asian, and other races. The median household income in Harville is $37,500, and the per capita income is $17,500.
Common Questions
What is Per Capita Income in Harrisville?
Per Capita income in Harrisville is $32,111.
What is the Median Family Income in Harrisville?
Median Family Income in Harrisville is $89,050.
What is the Median Household income in Harrisville?
Median Household Income in Harrisville is $82,232.
What is Income or Wage Gap in Harrisville?
Income or Wage Gap in Harrisville is 19.0%.
Women in Harrisville earn 81.0 cents for every dollar earned by a man.
What is Family Income Deficit in Harrisville?
Family Income Deficit in Harrisville is $4,252.
Families that are below poverty line in Harrisville earn $4,252 less on average than the poverty threshold level.
What is Inequality or Gini Index in Harrisville?
Inequality or Gini Index in Harrisville is 0.36.
What is the Total Population of Harrisville?
Total Population of Harrisville is 6,909.
What is the Total Male Population of Harrisville?
Total Male Population of Harrisville is 3,447.
What is the Total Female Population of Harrisville?
Total Female Population of Harrisville is 3,462.
What is the Ratio of Males per 100 Females in Harrisville?
There are 99.57 Males per 100 Females in Harrisville.
What is the Ratio of Females per 100 Males in Harrisville?
There are 100.44 Females per 100 Males in Harrisville.
What is the Median Population Age in Harrisville?
Median Population Age in Harrisville is 28.3 Years.
What is the Average Family Size in Harrisville
Average Family Size in Harrisville is 3.5 People.
What is the Average Household Size in Harrisville
Average Household Size in Harrisville is 3.1 People.
How Large is the Labor Force in Harrisville?
There are 3,727 People in the Labor Forcein in Harrisville.
What is the Percentage of People in the Labor Force in Harrisville?
75.7% of People are in the Labor Force in Harrisville.
What is the Unemployment Rate in Harrisville?
Unemployment Rate in Harrisville is 2.6%.