Riverside, UT Map & Demographics
Riverside Map
Riverside Overview
$23,440
PER CAPITA INCOME
$75,000
AVG FAMILY INCOME
$85,046
AVG HOUSEHOLD INCOME
34.5%
WAGE / INCOME GAP [ % ]
65.5¢/ $1
WAGE / INCOME GAP [ $ ]
0.26
INEQUALITY / GINI INDEX
1,283
TOTAL POPULATION
709
MALE POPULATION
574
FEMALE POPULATION
123.52
MALES / 100 FEMALES
80.96
FEMALES / 100 MALES
32.0
MEDIAN AGE
4.2
AVG FAMILY SIZE
3.8
AVG HOUSEHOLD SIZE
541
LABOR FORCE [ PEOPLE ]
54.4%
PERCENT IN LABOR FORCE
Riverside Zip Codes
Riverside Area Codes
Income in Riverside
Income Overview in Riverside
Per Capita Income in Riverside is $23,440, while median incomes of families and households are $75,000 and $85,046 respectively.
| Characteristic | Number | Measure |
| Per Capita Income | 1,283 | $23,440 |
| Median Family Income | 282 | $75,000 |
| Mean Family Income | 282 | $85,627 |
| Median Household Income | 335 | $85,046 |
| Mean Household Income | 335 | $89,340 |
| Income Deficit | 282 | $0 |
| Wage / Income Gap (%) | 1,283 | 34.50% |
| Wage / Income Gap ($) | 1,283 | 65.50¢ per $1 |
| Gini / Inequality Index | 1,283 | 0.26 |
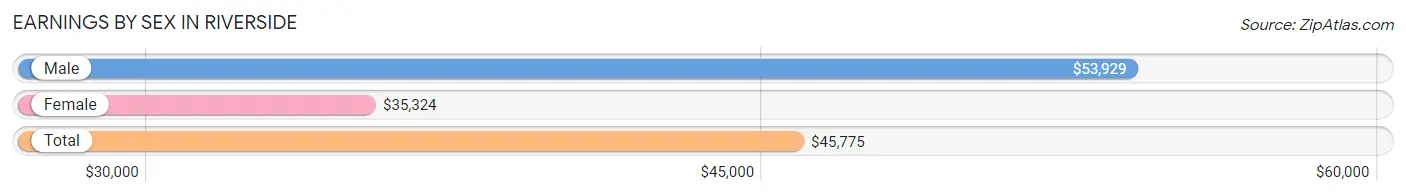
Earnings by Sex in Riverside
Average Earnings in Riverside are $45,775, $53,929 for men and $35,324 for women, a difference of 34.5%.
| Sex | Number | Average Earnings |
| Male | 288 (50.8%) | $53,929 |
| Female | 279 (49.2%) | $35,324 |
| Total | 567 (100.0%) | $45,775 |
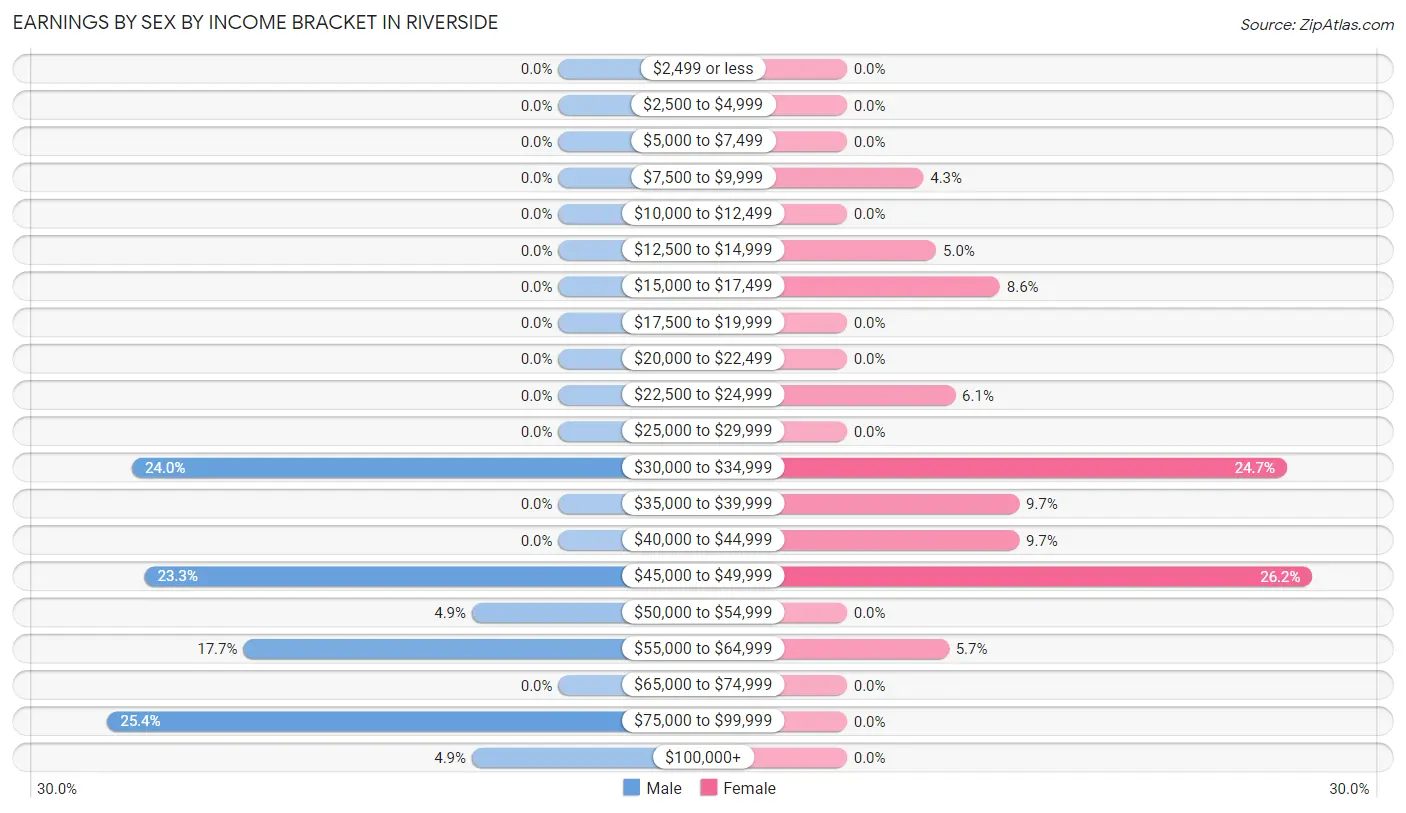
Earnings by Sex by Income Bracket in Riverside
The most common earnings brackets in Riverside are $75,000 to $99,999 for men (73 | 25.4%) and $45,000 to $49,999 for women (73 | 26.2%).
| Income | Male | Female |
| $2,499 or less | 0 (0.0%) | 0 (0.0%) |
| $2,500 to $4,999 | 0 (0.0%) | 0 (0.0%) |
| $5,000 to $7,499 | 0 (0.0%) | 0 (0.0%) |
| $7,500 to $9,999 | 0 (0.0%) | 12 (4.3%) |
| $10,000 to $12,499 | 0 (0.0%) | 0 (0.0%) |
| $12,500 to $14,999 | 0 (0.0%) | 14 (5.0%) |
| $15,000 to $17,499 | 0 (0.0%) | 24 (8.6%) |
| $17,500 to $19,999 | 0 (0.0%) | 0 (0.0%) |
| $20,000 to $22,499 | 0 (0.0%) | 0 (0.0%) |
| $22,500 to $24,999 | 0 (0.0%) | 17 (6.1%) |
| $25,000 to $29,999 | 0 (0.0%) | 0 (0.0%) |
| $30,000 to $34,999 | 69 (24.0%) | 69 (24.7%) |
| $35,000 to $39,999 | 0 (0.0%) | 27 (9.7%) |
| $40,000 to $44,999 | 0 (0.0%) | 27 (9.7%) |
| $45,000 to $49,999 | 67 (23.3%) | 73 (26.2%) |
| $50,000 to $54,999 | 14 (4.9%) | 0 (0.0%) |
| $55,000 to $64,999 | 51 (17.7%) | 16 (5.7%) |
| $65,000 to $74,999 | 0 (0.0%) | 0 (0.0%) |
| $75,000 to $99,999 | 73 (25.4%) | 0 (0.0%) |
| $100,000+ | 14 (4.9%) | 0 (0.0%) |
| Total | 288 (100.0%) | 279 (100.0%) |
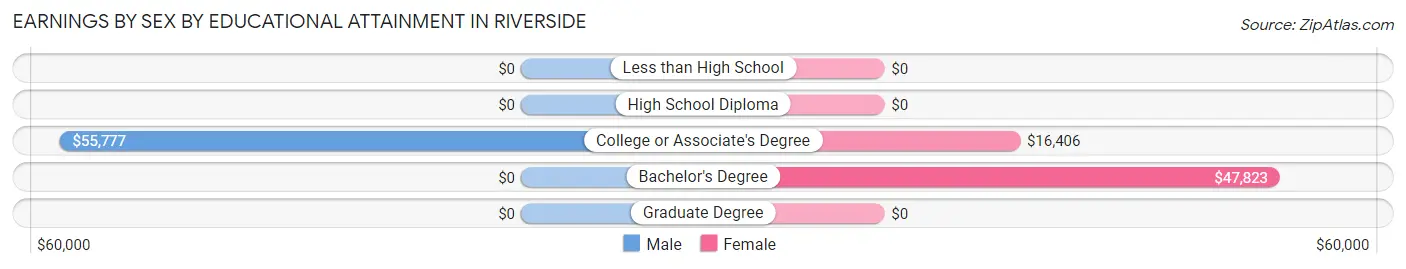
Earnings by Sex by Educational Attainment in Riverside
Average earnings in Riverside are $53,929 for men and $34,366 for women, a difference of 36.3%. Men with an educational attainment of college or associate's degree enjoy the highest average annual earnings of $55,777, while those with college or associate's degree education earn the least with $55,777. Women with an educational attainment of bachelor's degree earn the most with the average annual earnings of $47,823, while those with college or associate's degree education have the smallest earnings of $16,406.
| Educational Attainment | Male Income | Female Income |
| Less than High School | - | - |
| High School Diploma | - | - |
| College or Associate's Degree | $55,777 | $16,406 |
| Bachelor's Degree | - | - |
| Graduate Degree | - | - |
| Total | $53,929 | $34,366 |
Family Income in Riverside
Family Income Brackets in Riverside
According to the Riverside family income data, there are 118 families falling into the $50,000 to $74,999 income range, which is the most common income bracket and makes up 41.8% of all families.
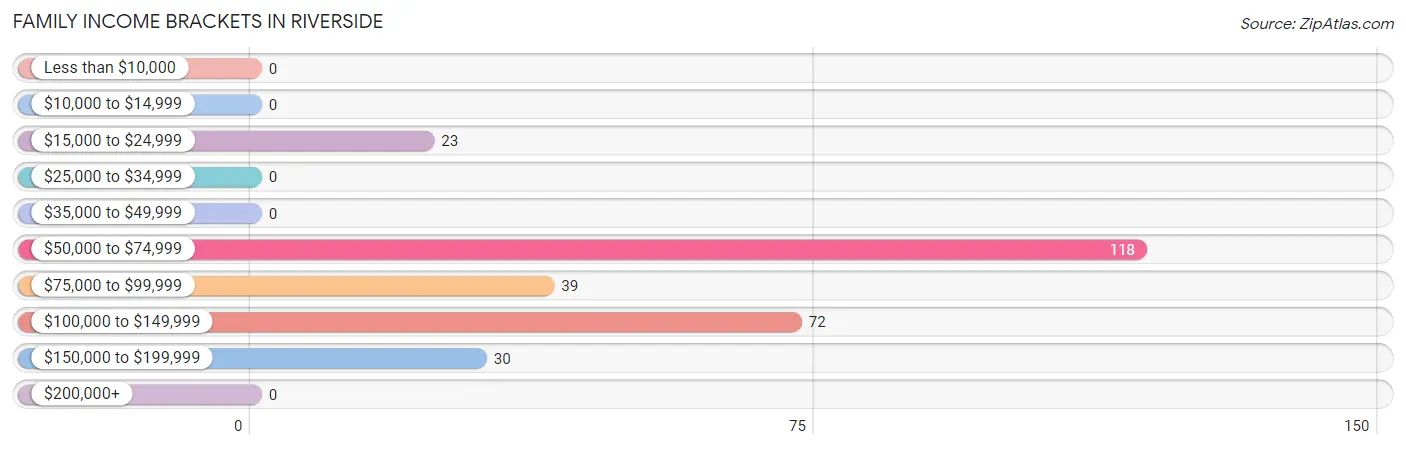
| Income Bracket | # Families | % Families |
| Less than $10,000 | 0 | 0.0% |
| $10,000 to $14,999 | 0 | 0.0% |
| $15,000 to $24,999 | 23 | 8.2% |
| $25,000 to $34,999 | 0 | 0.0% |
| $35,000 to $49,999 | 0 | 0.0% |
| $50,000 to $74,999 | 118 | 41.8% |
| $75,000 to $99,999 | 39 | 13.8% |
| $100,000 to $149,999 | 72 | 25.5% |
| $150,000 to $199,999 | 30 | 10.6% |
| $200,000+ | 0 | 0.0% |
Family Income by Famaliy Size in Riverside
4-person families (80 | 28.4%) account for the highest median family income in Riverside with $80,625 per family, while 2-person families (108 | 38.3%) have the highest median income of $34,511 per family member.
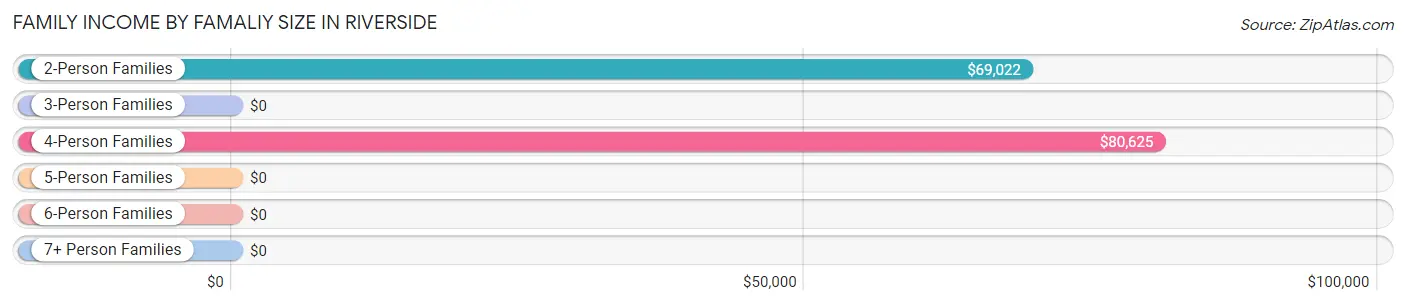
| Income Bracket | # Families | Median Income |
| 2-Person Families | 108 (38.3%) | $69,022 |
| 3-Person Families | 14 (5.0%) | $0 |
| 4-Person Families | 80 (28.4%) | $80,625 |
| 5-Person Families | 41 (14.5%) | $0 |
| 6-Person Families | 39 (13.8%) | $0 |
| 7+ Person Families | 0 (0.0%) | $0 |
| Total | 282 (100.0%) | $75,000 |
Family Income by Number of Earners in Riverside
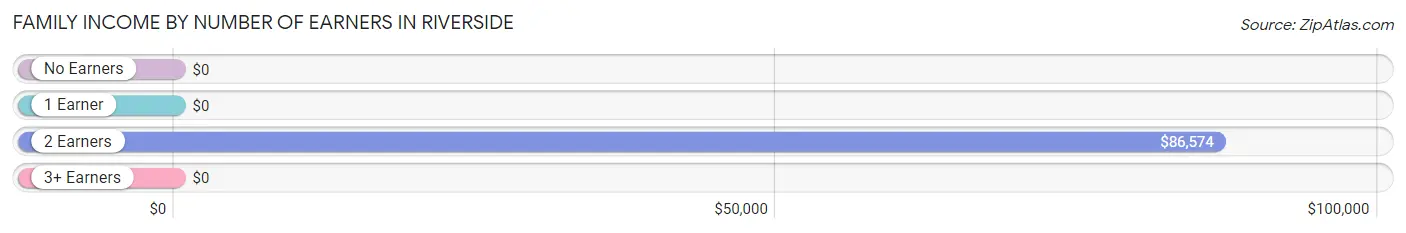
| Number of Earners | # Families | Median Income |
| No Earners | 23 (8.2%) | $0 |
| 1 Earner | 49 (17.4%) | $0 |
| 2 Earners | 196 (69.5%) | $86,574 |
| 3+ Earners | 14 (5.0%) | $0 |
| Total | 282 (100.0%) | $75,000 |
Household Income in Riverside
Household Income Brackets in Riverside
With 118 households falling in the category, the $50,000 to $74,999 income range is the most frequent in Riverside, accounting for 35.2% of all households.
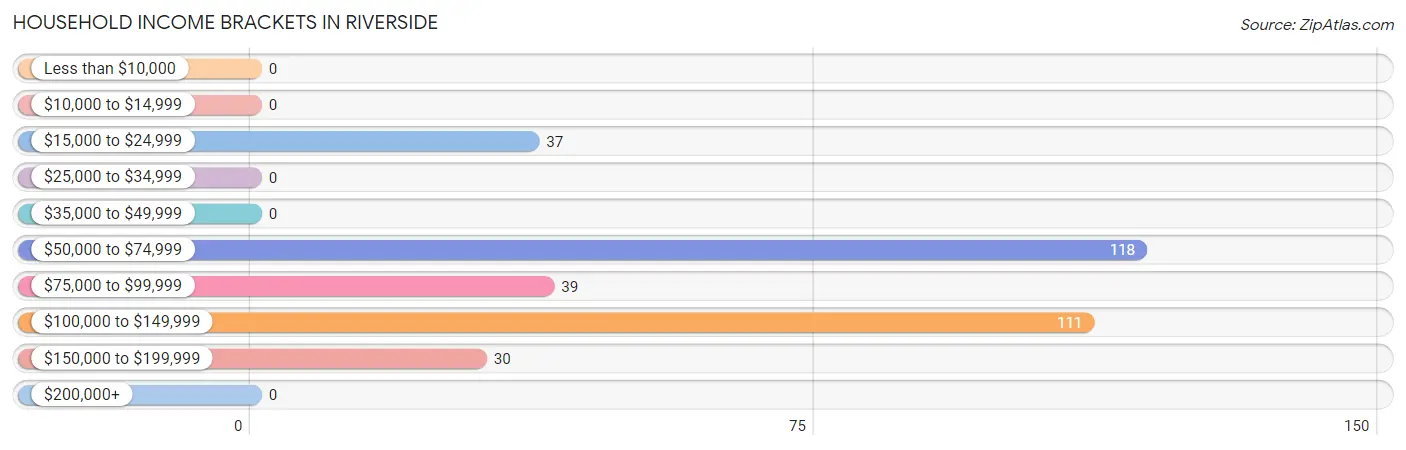
| Income Bracket | # Households | % Households |
| Less than $10,000 | 0 | 0.0% |
| $10,000 to $14,999 | 0 | 0.0% |
| $15,000 to $24,999 | 37 | 11.0% |
| $25,000 to $34,999 | 0 | 0.0% |
| $35,000 to $49,999 | 0 | 0.0% |
| $50,000 to $74,999 | 118 | 35.2% |
| $75,000 to $99,999 | 39 | 11.6% |
| $100,000 to $149,999 | 111 | 33.1% |
| $150,000 to $199,999 | 30 | 9.0% |
| $200,000+ | 0 | 0.0% |
Household Income by Householder Age in Riverside
The median household income in Riverside is $85,046, with the highest median household income of $142,212 found in the 25 to 44 years age bracket for the primary householder. A total of 69 households (20.6%) fall into this category.
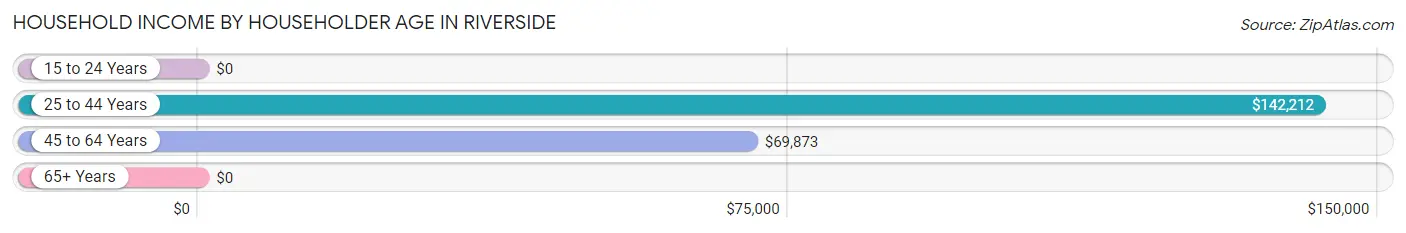
| Income Bracket | # Households | Median Income |
| 15 to 24 Years | 0 (0.0%) | $0 |
| 25 to 44 Years | 69 (20.6%) | $142,212 |
| 45 to 64 Years | 229 (68.4%) | $69,873 |
| 65+ Years | 37 (11.0%) | $0 |
| Total | 335 (100.0%) | $85,046 |
Poverty in Riverside
Income Below Poverty by Sex and Age in Riverside
With 10.6% poverty level for males and 13.8% for females among the residents of Riverside, 18 to 24 year old males and 65 to 74 year old females are the most vulnerable to poverty, with 29 males (100.0%) and 23 females (100.0%) in their respective age groups living below the poverty level.
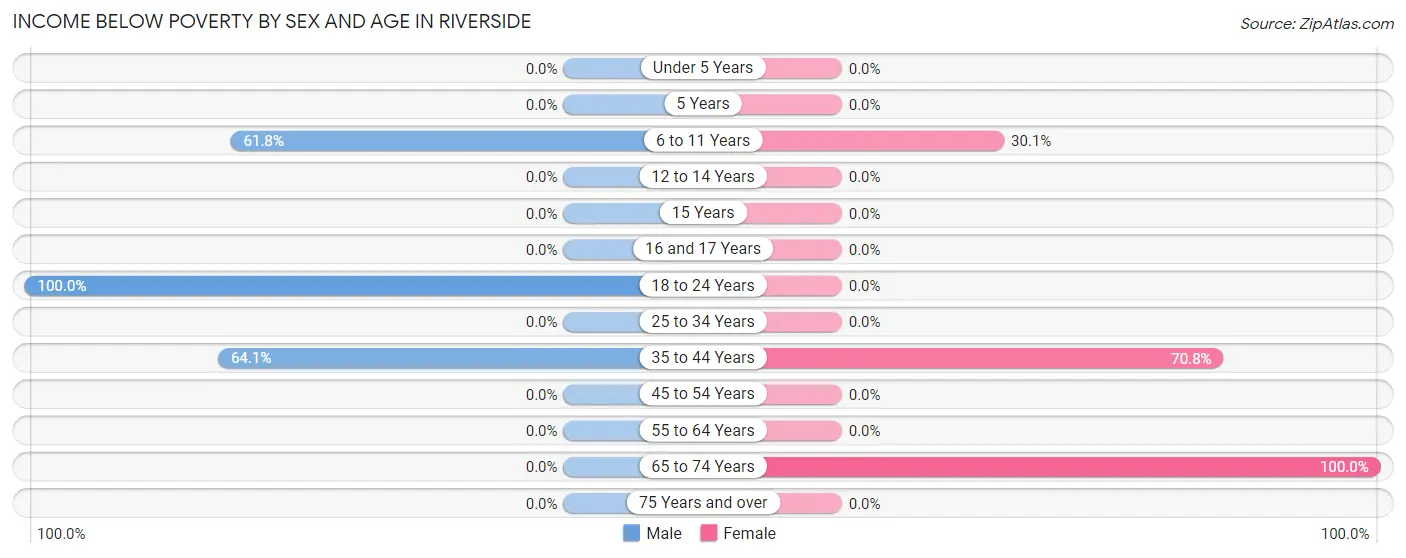
| Age Bracket | Male | Female |
| Under 5 Years | 0 (0.0%) | 0 (0.0%) |
| 5 Years | 0 (0.0%) | 0 (0.0%) |
| 6 to 11 Years | 21 (61.8%) | 22 (30.1%) |
| 12 to 14 Years | 0 (0.0%) | 0 (0.0%) |
| 15 Years | 0 (0.0%) | 0 (0.0%) |
| 16 and 17 Years | 0 (0.0%) | 0 (0.0%) |
| 18 to 24 Years | 29 (100.0%) | 0 (0.0%) |
| 25 to 34 Years | 0 (0.0%) | 0 (0.0%) |
| 35 to 44 Years | 25 (64.1%) | 34 (70.8%) |
| 45 to 54 Years | 0 (0.0%) | 0 (0.0%) |
| 55 to 64 Years | 0 (0.0%) | 0 (0.0%) |
| 65 to 74 Years | 0 (0.0%) | 23 (100.0%) |
| 75 Years and over | 0 (0.0%) | 0 (0.0%) |
| Total | 75 (10.6%) | 79 (13.8%) |
Income Above Poverty by Sex and Age in Riverside
According to the poverty statistics in Riverside, males aged under 5 years and females aged 5 years are the age groups that are most secure financially, with 100.0% of males and 100.0% of females in these age groups living above the poverty line.
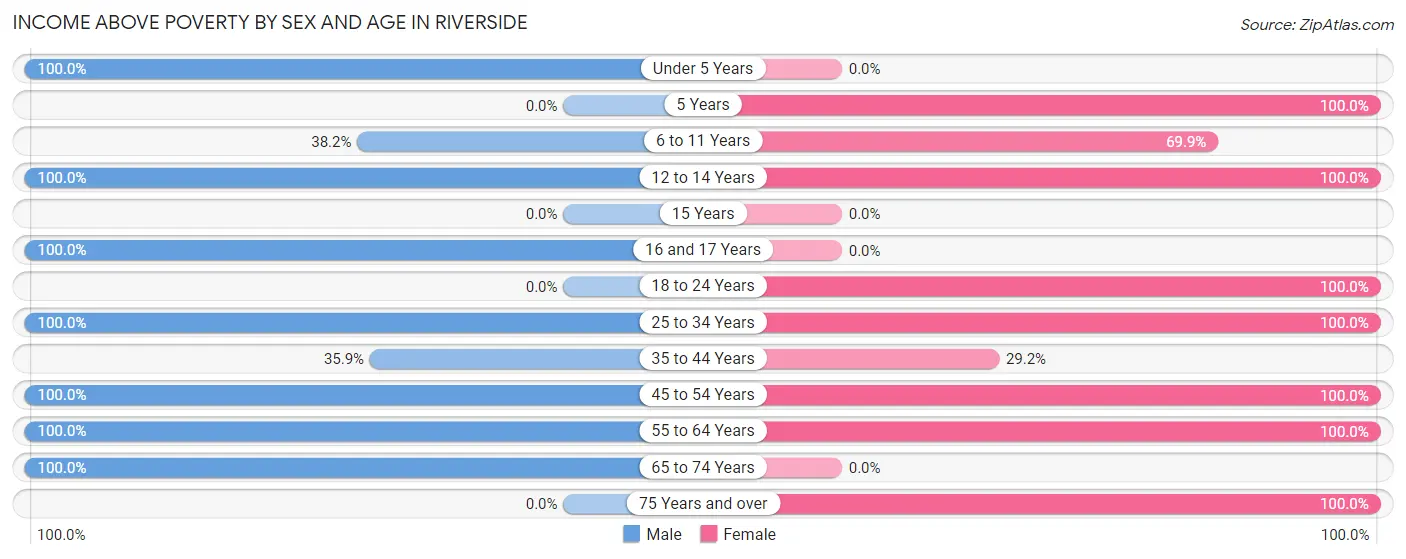
| Age Bracket | Male | Female |
| Under 5 Years | 119 (100.0%) | 0 (0.0%) |
| 5 Years | 0 (0.0%) | 18 (100.0%) |
| 6 to 11 Years | 13 (38.2%) | 51 (69.9%) |
| 12 to 14 Years | 30 (100.0%) | 14 (100.0%) |
| 15 Years | 0 (0.0%) | 0 (0.0%) |
| 16 and 17 Years | 48 (100.0%) | 0 (0.0%) |
| 18 to 24 Years | 0 (0.0%) | 118 (100.0%) |
| 25 to 34 Years | 177 (100.0%) | 76 (100.0%) |
| 35 to 44 Years | 14 (35.9%) | 14 (29.2%) |
| 45 to 54 Years | 86 (100.0%) | 27 (100.0%) |
| 55 to 64 Years | 48 (100.0%) | 163 (100.0%) |
| 65 to 74 Years | 99 (100.0%) | 0 (0.0%) |
| 75 Years and over | 0 (0.0%) | 14 (100.0%) |
| Total | 634 (89.4%) | 495 (86.2%) |
Income Below Poverty Among Married-Couple Families in Riverside
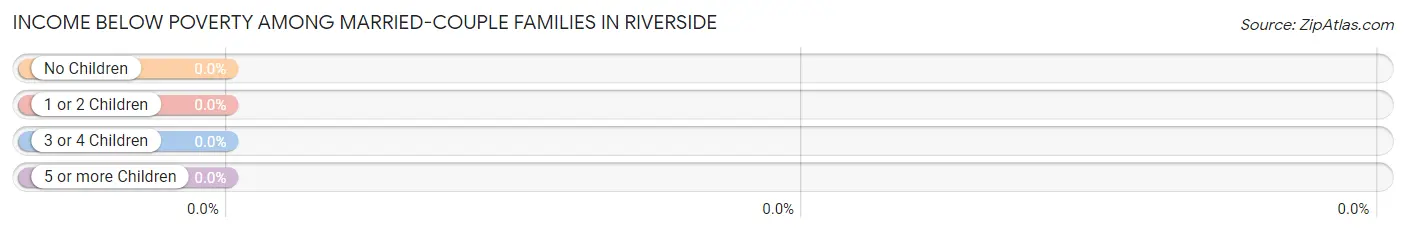
| Children | Above Poverty | Below Poverty |
| No Children | 134 (100.0%) | 0 (0.0%) |
| 1 or 2 Children | 58 (100.0%) | 0 (0.0%) |
| 3 or 4 Children | 30 (100.0%) | 0 (0.0%) |
| 5 or more Children | 0 (0.0%) | 0 (0.0%) |
| Total | 222 (100.0%) | 0 (0.0%) |
Income Below Poverty Among Single-Parent Households in Riverside
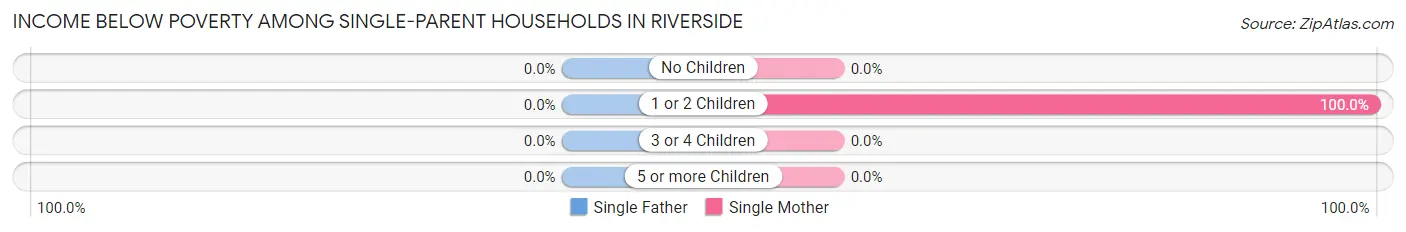
| Children | Single Father | Single Mother |
| No Children | 0 (0.0%) | 0 (0.0%) |
| 1 or 2 Children | 0 (0.0%) | 23 (100.0%) |
| 3 or 4 Children | 0 (0.0%) | 0 (0.0%) |
| 5 or more Children | 0 (0.0%) | 0 (0.0%) |
| Total | 0 (0.0%) | 23 (100.0%) |
Income Below Poverty Among Married-Couple vs Single-Parent Households in Riverside
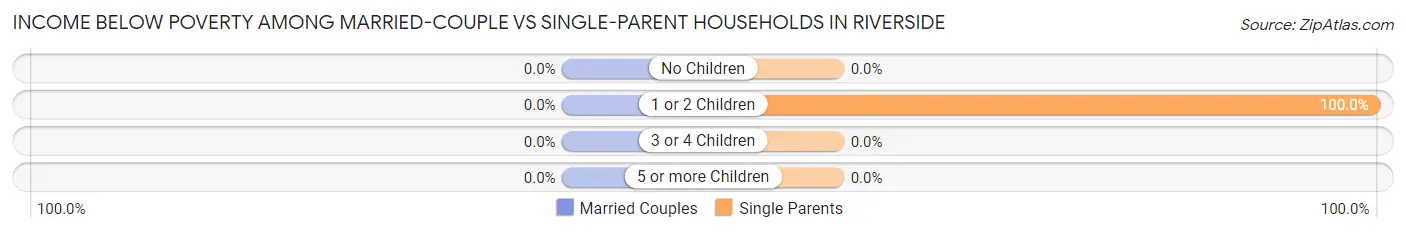
| Children | Married-Couple Families | Single-Parent Households |
| No Children | 0 (0.0%) | 0 (0.0%) |
| 1 or 2 Children | 0 (0.0%) | 23 (100.0%) |
| 3 or 4 Children | 0 (0.0%) | 0 (0.0%) |
| 5 or more Children | 0 (0.0%) | 0 (0.0%) |
| Total | 0 (0.0%) | 23 (38.3%) |
Race in Riverside
The most populous races in Riverside are White / Caucasian (1,215 | 94.7%), Hispanic or Latino (90 | 7.0%), and Two or more Races (68 | 5.3%).
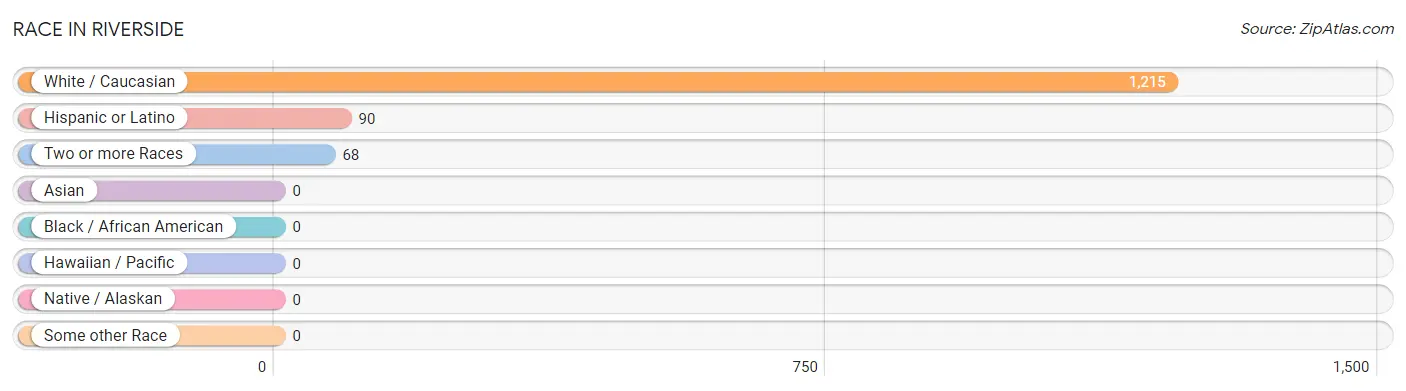
| Race | # Population | % Population |
| Asian | 0 | 0.0% |
| Black / African American | 0 | 0.0% |
| Hawaiian / Pacific | 0 | 0.0% |
| Hispanic or Latino | 90 | 7.0% |
| Native / Alaskan | 0 | 0.0% |
| White / Caucasian | 1,215 | 94.7% |
| Two or more Races | 68 | 5.3% |
| Some other Race | 0 | 0.0% |
| Total | 1,283 | 100.0% |
Ancestry in Riverside
The most populous ancestries reported in Riverside are German (341 | 26.6%), English (234 | 18.2%), Swiss (119 | 9.3%), Swedish (113 | 8.8%), and Danish (103 | 8.0%), together accounting for 70.9% of all Riverside residents.
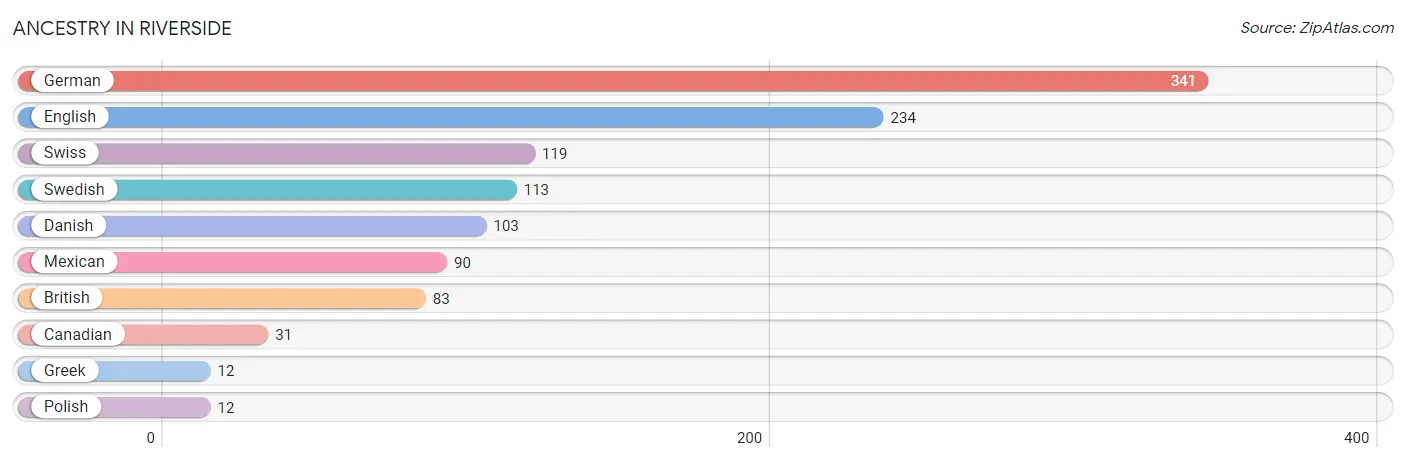
| Ancestry | # Population | % Population |
| British | 83 | 6.5% |
| Canadian | 31 | 2.4% |
| Danish | 103 | 8.0% |
| English | 234 | 18.2% |
| German | 341 | 26.6% |
| Greek | 12 | 0.9% |
| Mexican | 90 | 7.0% |
| Polish | 12 | 0.9% |
| Swedish | 113 | 8.8% |
| Swiss | 119 | 9.3% | View All 10 Rows |
Immigrants in Riverside

| Immigration Origin | # Population | % Population | View All 0 Rows |
Sex and Age in Riverside
Sex and Age in Riverside
The most populous age groups in Riverside are Under 5 Years (119 | 16.8%) for men and 20 to 24 Years (118 | 20.6%) for women.
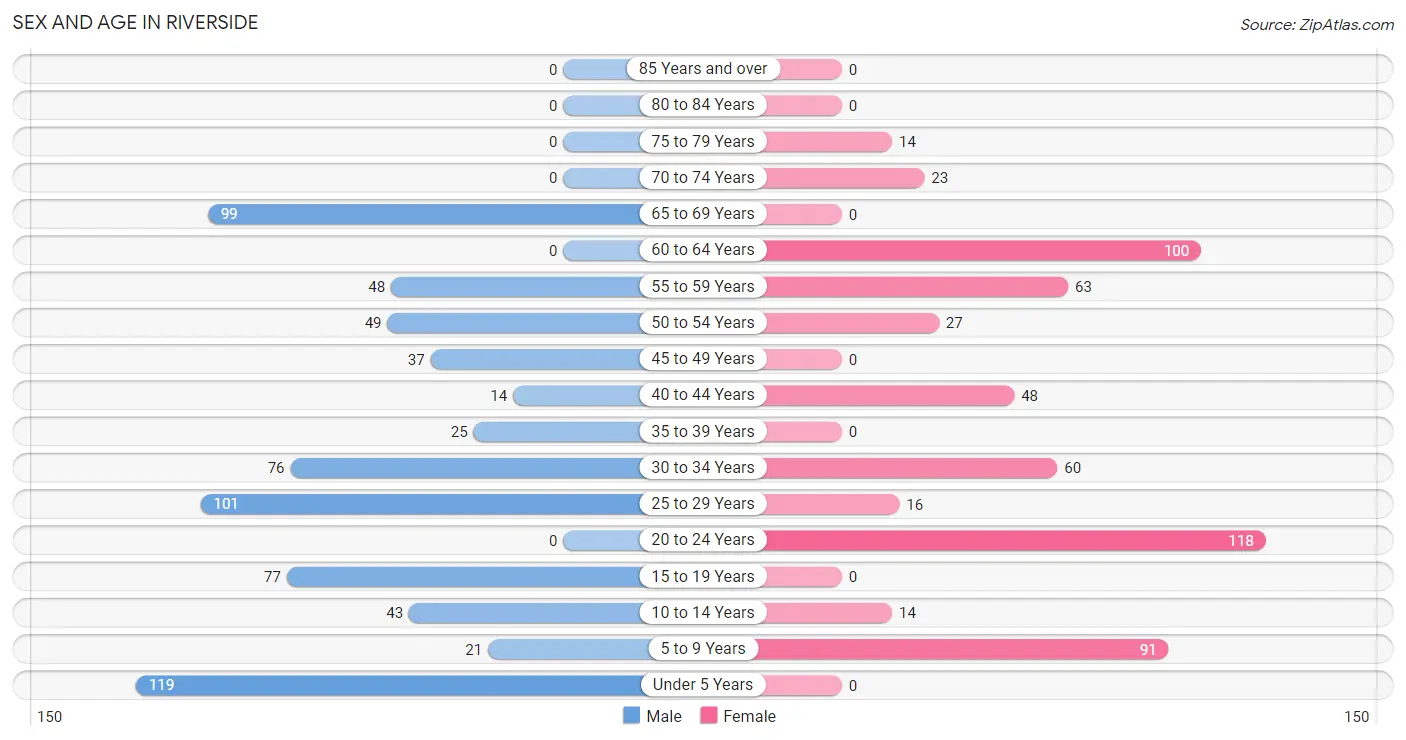
| Age Bracket | Male | Female |
| Under 5 Years | 119 (16.8%) | 0 (0.0%) |
| 5 to 9 Years | 21 (3.0%) | 91 (15.9%) |
| 10 to 14 Years | 43 (6.1%) | 14 (2.4%) |
| 15 to 19 Years | 77 (10.9%) | 0 (0.0%) |
| 20 to 24 Years | 0 (0.0%) | 118 (20.6%) |
| 25 to 29 Years | 101 (14.2%) | 16 (2.8%) |
| 30 to 34 Years | 76 (10.7%) | 60 (10.4%) |
| 35 to 39 Years | 25 (3.5%) | 0 (0.0%) |
| 40 to 44 Years | 14 (2.0%) | 48 (8.4%) |
| 45 to 49 Years | 37 (5.2%) | 0 (0.0%) |
| 50 to 54 Years | 49 (6.9%) | 27 (4.7%) |
| 55 to 59 Years | 48 (6.8%) | 63 (11.0%) |
| 60 to 64 Years | 0 (0.0%) | 100 (17.4%) |
| 65 to 69 Years | 99 (14.0%) | 0 (0.0%) |
| 70 to 74 Years | 0 (0.0%) | 23 (4.0%) |
| 75 to 79 Years | 0 (0.0%) | 14 (2.4%) |
| 80 to 84 Years | 0 (0.0%) | 0 (0.0%) |
| 85 Years and over | 0 (0.0%) | 0 (0.0%) |
| Total | 709 (100.0%) | 574 (100.0%) |
Families and Households in Riverside
Median Family Size in Riverside
The median family size in Riverside is 4.21 persons per family, with single female/mother families (23 | 8.2%) accounting for the largest median family size of 6.7 persons per family. On the other hand, single male/father families (37 | 13.1%) represent the smallest median family size with 3.65 persons per family.
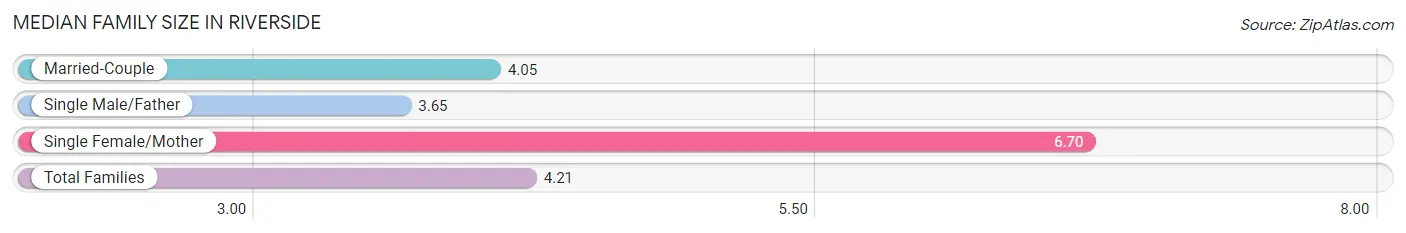
| Family Type | # Families | Family Size |
| Married-Couple | 222 (78.7%) | 4.05 |
| Single Male/Father | 37 (13.1%) | 3.65 |
| Single Female/Mother | 23 (8.2%) | 6.70 |
| Total Families | 282 (100.0%) | 4.21 |
Median Household Size in Riverside
The median household size in Riverside is 3.83 persons per household, with single female/mother households (23 | 6.9%) accounting for the largest median household size of 6.7 persons per household. non-family households (53 | 15.8%) represent the smallest median household size with 1.79 persons per household.
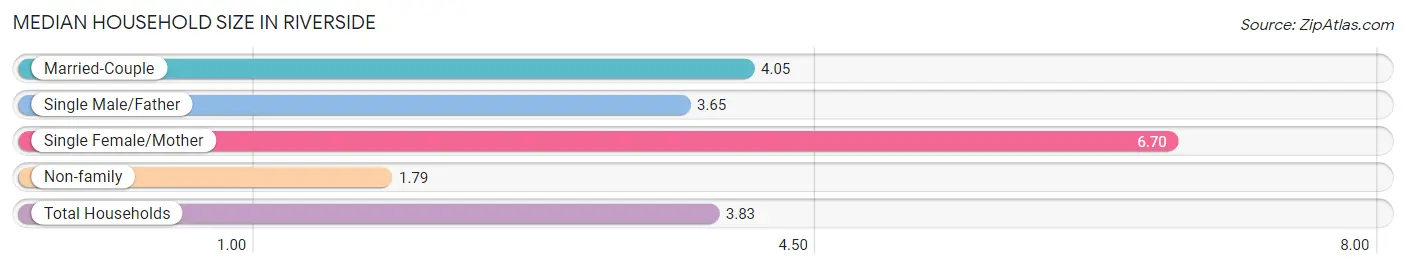
| Household Type | # Households | Household Size |
| Married-Couple | 222 (66.3%) | 4.05 |
| Single Male/Father | 37 (11.0%) | 3.65 |
| Single Female/Mother | 23 (6.9%) | 6.70 |
| Non-family | 53 (15.8%) | 1.79 |
| Total Households | 335 (100.0%) | 3.83 |
Household Size by Marriage Status in Riverside
Out of a total of 335 households in Riverside, 282 (84.2%) are family households, while 53 (15.8%) are nonfamily households. The most numerous type of family households are 2-person households, comprising 108, and the most common type of nonfamily households are 2-person households, comprising 39.

| Household Size | Family Households | Nonfamily Households |
| 1-Person Households | - | 14 (4.2%) |
| 2-Person Households | 108 (32.2%) | 39 (11.6%) |
| 3-Person Households | 14 (4.2%) | 0 (0.0%) |
| 4-Person Households | 80 (23.9%) | 0 (0.0%) |
| 5-Person Households | 41 (12.2%) | 0 (0.0%) |
| 6-Person Households | 39 (11.6%) | 0 (0.0%) |
| 7+ Person Households | 0 (0.0%) | 0 (0.0%) |
| Total | 282 (84.2%) | 53 (15.8%) |
Female Fertility in Riverside
Fertility by Age in Riverside
Average fertility rate in Riverside is 380.0 births per 1,000 women. Women in the age bracket of 20 to 34 years have the highest fertility rate with 474.0 births per 1,000 women. Women in the age bracket of 20 to 34 years acount for 100.0% of all women with births.
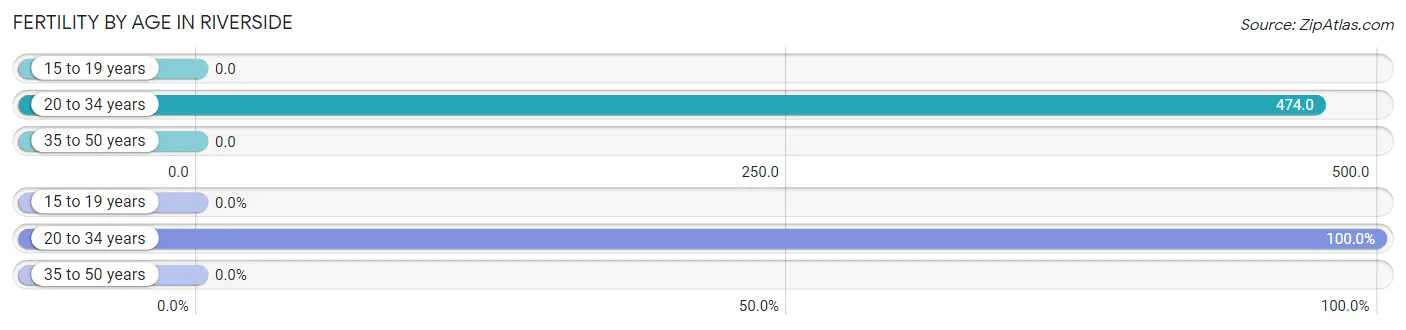
| Age Bracket | Women with Births | Births / 1,000 Women |
| 15 to 19 years | 0 (0.0%) | 0.0 |
| 20 to 34 years | 92 (100.0%) | 474.0 |
| 35 to 50 years | 0 (0.0%) | 0.0 |
| Total | 92 (100.0%) | 380.0 |
Fertility by Age by Marriage Status in Riverside
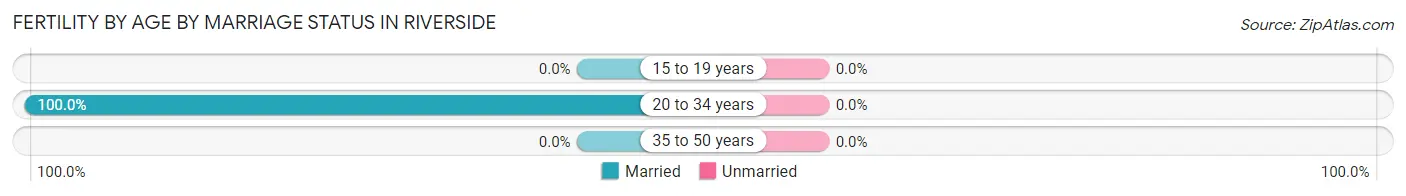
| Age Bracket | Married | Unmarried |
| 15 to 19 years | 0 (0.0%) | 0 (0.0%) |
| 20 to 34 years | 92 (100.0%) | 0 (0.0%) |
| 35 to 50 years | 0 (0.0%) | 0 (0.0%) |
| Total | 92 (100.0%) | 0 (0.0%) |
Fertility by Education in Riverside
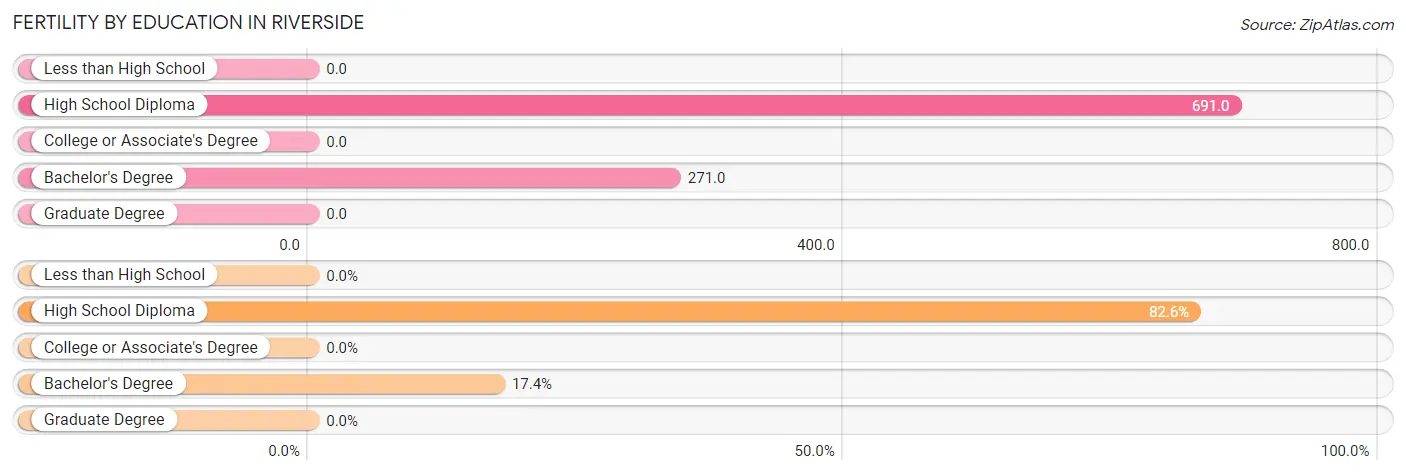
| Educational Attainment | Women with Births | Births / 1,000 Women |
| Less than High School | 0 (0.0%) | 0.0 |
| High School Diploma | 76 (82.6%) | 691.0 |
| College or Associate's Degree | 0 (0.0%) | 0.0 |
| Bachelor's Degree | 16 (17.4%) | 271.0 |
| Graduate Degree | 0 (0.0%) | 0.0 |
| Total | 92 (100.0%) | 380.0 |
Fertility by Education by Marriage Status in Riverside
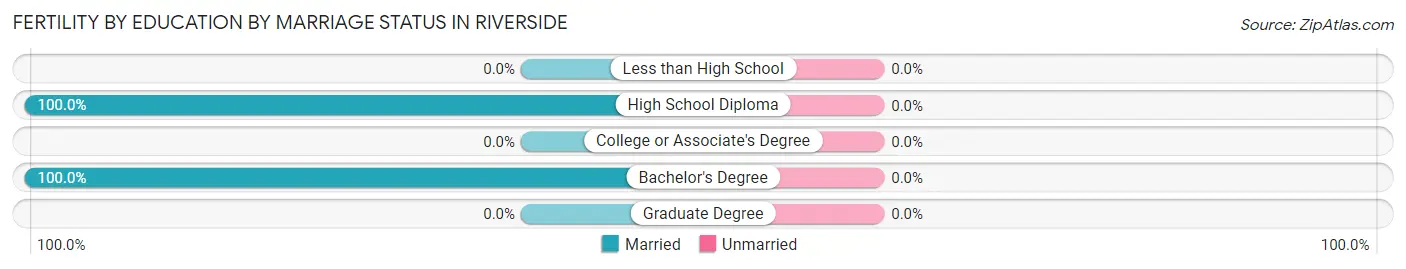
| Educational Attainment | Married | Unmarried |
| Less than High School | 0 (0.0%) | 0 (0.0%) |
| High School Diploma | 76 (100.0%) | 0 (0.0%) |
| College or Associate's Degree | 0 (0.0%) | 0 (0.0%) |
| Bachelor's Degree | 16 (100.0%) | 0 (0.0%) |
| Graduate Degree | 0 (0.0%) | 0 (0.0%) |
| Total | 92 (100.0%) | 0 (0.0%) |
Employment Characteristics in Riverside
Employment by Class of Employer in Riverside
Among the 541 employed individuals in Riverside, private company employees (203 | 37.5%), local government employees (96 | 17.7%), and self-employed (not incorporated) (83 | 15.3%) make up the most common classes of employment.
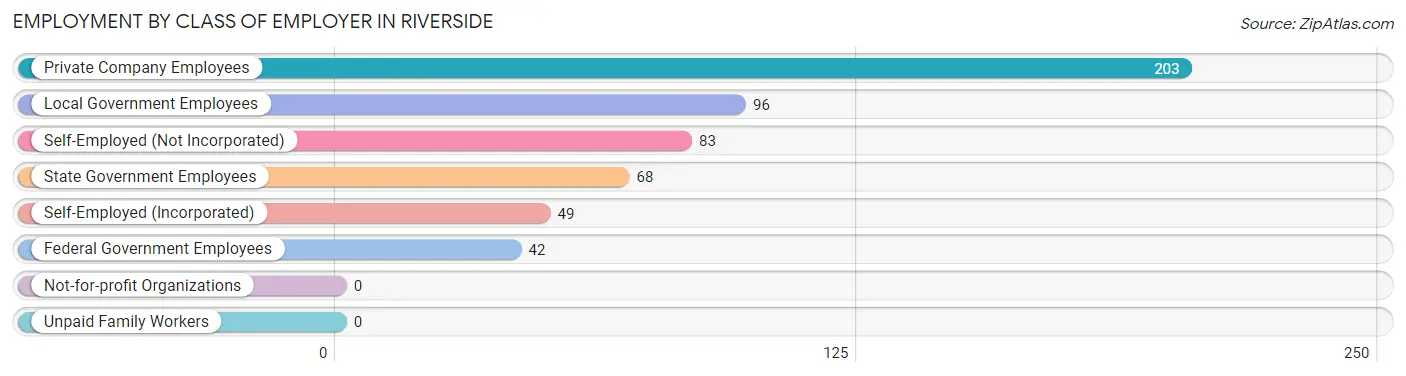
| Employer Class | # Employees | % Employees |
| Private Company Employees | 203 | 37.5% |
| Self-Employed (Incorporated) | 49 | 9.1% |
| Self-Employed (Not Incorporated) | 83 | 15.3% |
| Not-for-profit Organizations | 0 | 0.0% |
| Local Government Employees | 96 | 17.7% |
| State Government Employees | 68 | 12.6% |
| Federal Government Employees | 42 | 7.8% |
| Unpaid Family Workers | 0 | 0.0% |
| Total | 541 | 100.0% |
Employment Status by Age in Riverside
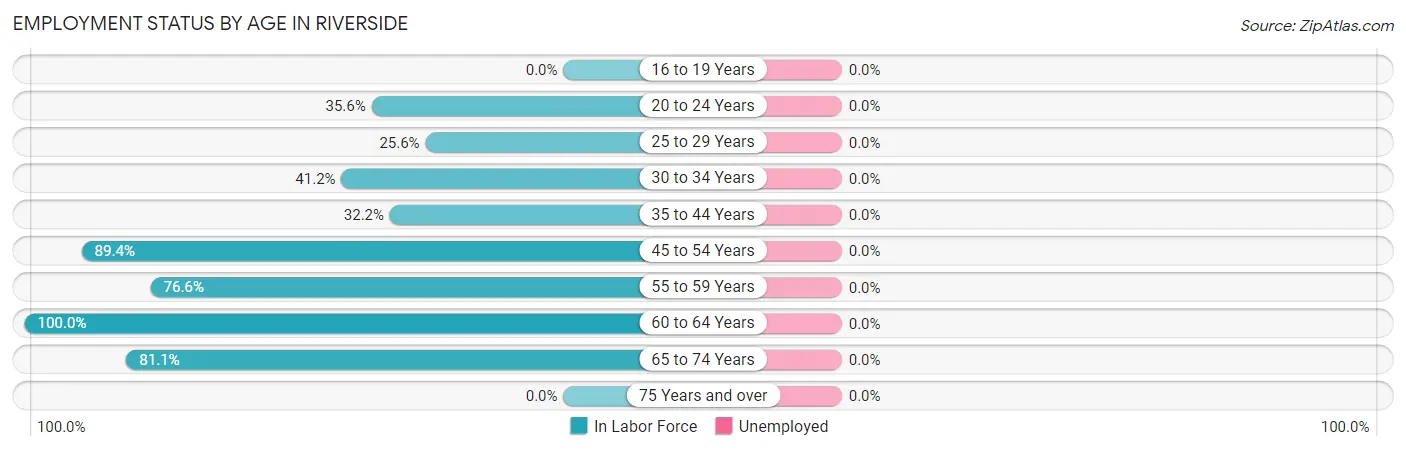
| Age Bracket | In Labor Force | Unemployed |
| 16 to 19 Years | 0 (0.0%) | 0 (0.0%) |
| 20 to 24 Years | 42 (35.6%) | 0 (0.0%) |
| 25 to 29 Years | 30 (25.6%) | 0 (0.0%) |
| 30 to 34 Years | 56 (41.2%) | 0 (0.0%) |
| 35 to 44 Years | 28 (32.2%) | 0 (0.0%) |
| 45 to 54 Years | 101 (89.4%) | 0 (0.0%) |
| 55 to 59 Years | 85 (76.6%) | 0 (0.0%) |
| 60 to 64 Years | 100 (100.0%) | 0 (0.0%) |
| 65 to 74 Years | 99 (81.1%) | 0 (0.0%) |
| 75 Years and over | 0 (0.0%) | 0 (0.0%) |
| Total | 541 (54.4%) | 0 (0.0%) |
Employment Status by Educational Attainment in Riverside
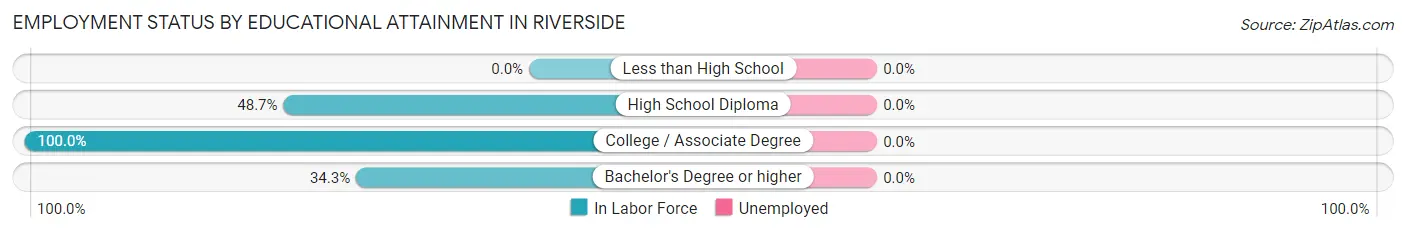
| Educational Attainment | In Labor Force | Unemployed |
| Less than High School | 0 (0.0%) | 0 (0.0%) |
| High School Diploma | 116 (48.7%) | 0 (0.0%) |
| College / Associate Degree | 210 (100.0%) | 0 (0.0%) |
| Bachelor's Degree or higher | 74 (34.3%) | 0 (0.0%) |
| Total | 400 (60.2%) | 0 (0.0%) |
Employment Occupations by Sex in Riverside
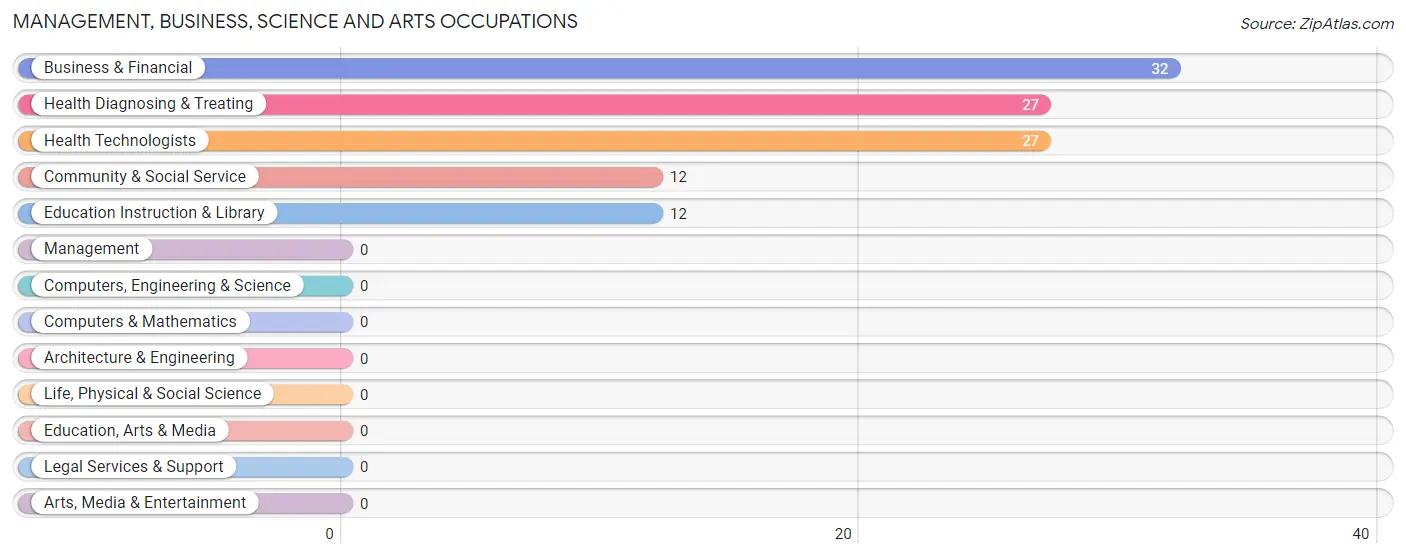
Management, Business, Science and Arts Occupations
The most common Management, Business, Science and Arts occupations in Riverside are Business & Financial (32 | 5.9%), Health Diagnosing & Treating (27 | 5.0%), Health Technologists (27 | 5.0%), Community & Social Service (12 | 2.2%), and Education Instruction & Library (12 | 2.2%).
Management, Business, Science and Arts Occupations by Sex
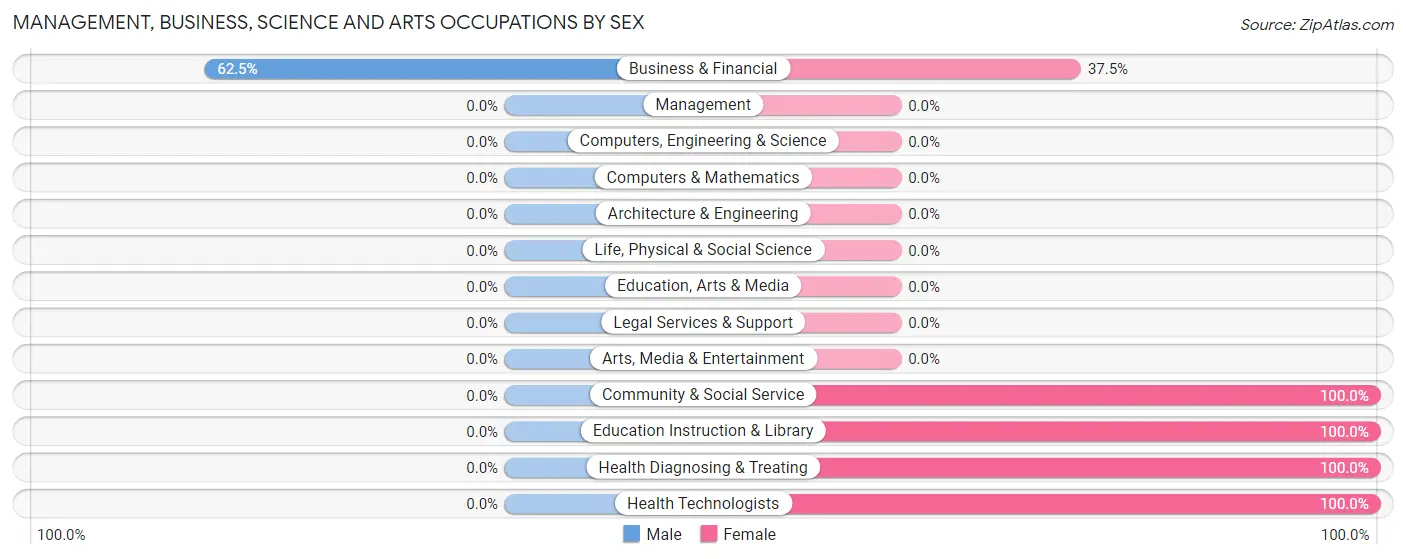
| Occupation | Male | Female |
| Management | 0 (0.0%) | 0 (0.0%) |
| Business & Financial | 20 (62.5%) | 12 (37.5%) |
| Computers, Engineering & Science | 0 (0.0%) | 0 (0.0%) |
| Computers & Mathematics | 0 (0.0%) | 0 (0.0%) |
| Architecture & Engineering | 0 (0.0%) | 0 (0.0%) |
| Life, Physical & Social Science | 0 (0.0%) | 0 (0.0%) |
| Community & Social Service | 0 (0.0%) | 12 (100.0%) |
| Education, Arts & Media | 0 (0.0%) | 0 (0.0%) |
| Legal Services & Support | 0 (0.0%) | 0 (0.0%) |
| Education Instruction & Library | 0 (0.0%) | 12 (100.0%) |
| Arts, Media & Entertainment | 0 (0.0%) | 0 (0.0%) |
| Health Diagnosing & Treating | 0 (0.0%) | 27 (100.0%) |
| Health Technologists | 0 (0.0%) | 27 (100.0%) |
| Total (Category) | 20 (28.2%) | 51 (71.8%) |
| Total (Overall) | 274 (50.6%) | 267 (49.3%) |
Services Occupations
The most common Services occupations in Riverside are Personal Care & Service (106 | 19.6%), Food Preparation & Serving (27 | 5.0%), and Healthcare Support (14 | 2.6%).
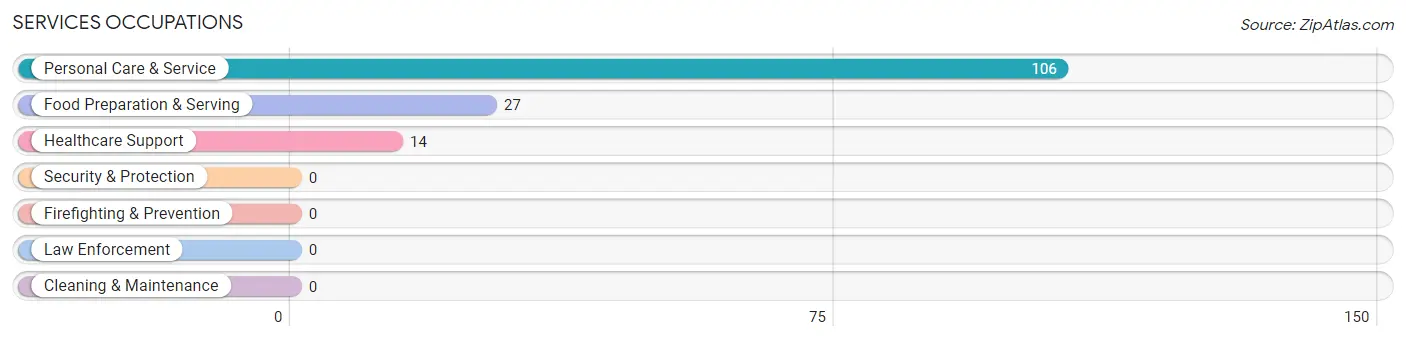
Services Occupations by Sex
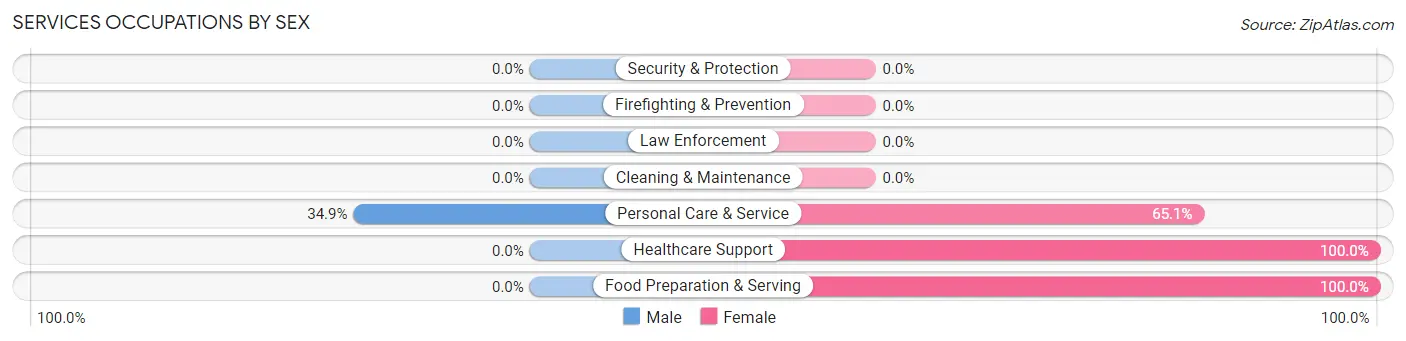
| Occupation | Male | Female |
| Healthcare Support | 0 (0.0%) | 14 (100.0%) |
| Security & Protection | 0 (0.0%) | 0 (0.0%) |
| Firefighting & Prevention | 0 (0.0%) | 0 (0.0%) |
| Law Enforcement | 0 (0.0%) | 0 (0.0%) |
| Food Preparation & Serving | 0 (0.0%) | 27 (100.0%) |
| Cleaning & Maintenance | 0 (0.0%) | 0 (0.0%) |
| Personal Care & Service | 37 (34.9%) | 69 (65.1%) |
| Total (Category) | 37 (25.2%) | 110 (74.8%) |
| Total (Overall) | 274 (50.6%) | 267 (49.3%) |
Sales and Office Occupations
The most common Sales and Office occupations in Riverside are Office & Administration (31 | 5.7%), and Sales & Related (30 | 5.6%).
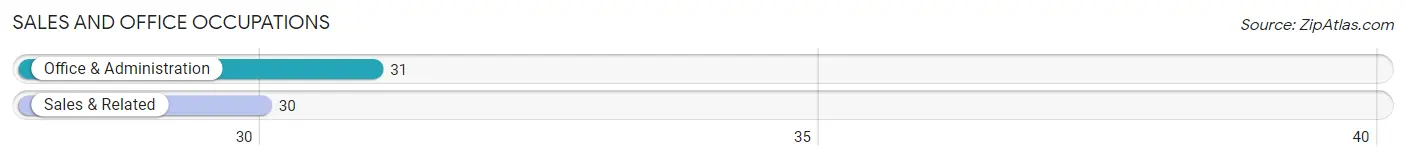
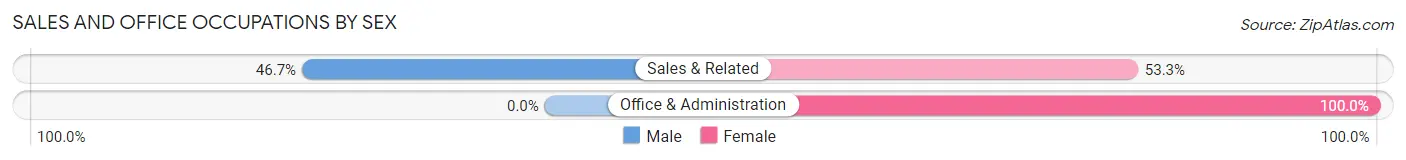
Sales and Office Occupations by Sex
| Occupation | Male | Female |
| Sales & Related | 14 (46.7%) | 16 (53.3%) |
| Office & Administration | 0 (0.0%) | 31 (100.0%) |
| Total (Category) | 14 (23.0%) | 47 (77.0%) |
| Total (Overall) | 274 (50.6%) | 267 (49.3%) |
Natural Resources, Construction and Maintenance Occupations
The most common Natural Resources, Construction and Maintenance occupations in Riverside are Construction & Extraction (76 | 14.1%), and Farming, Fishing & Forestry (72 | 13.3%).
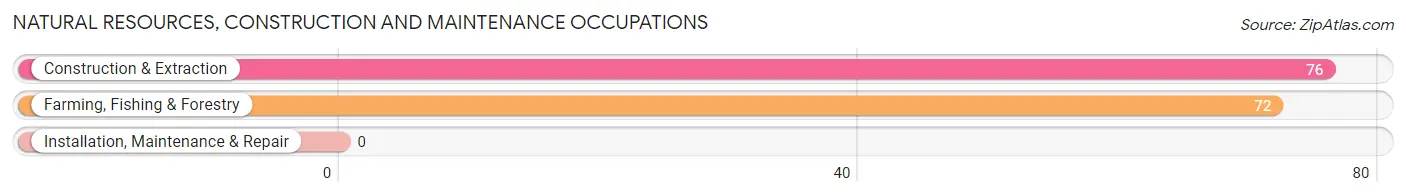
Natural Resources, Construction and Maintenance Occupations by Sex
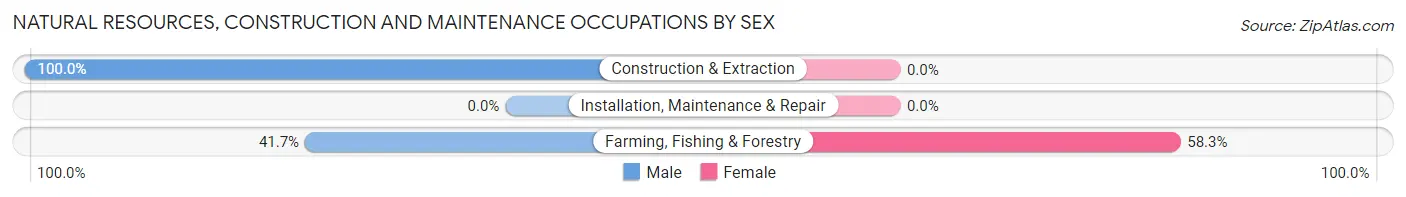
| Occupation | Male | Female |
| Farming, Fishing & Forestry | 30 (41.7%) | 42 (58.3%) |
| Construction & Extraction | 76 (100.0%) | 0 (0.0%) |
| Installation, Maintenance & Repair | 0 (0.0%) | 0 (0.0%) |
| Total (Category) | 106 (71.6%) | 42 (28.4%) |
| Total (Overall) | 274 (50.6%) | 267 (49.3%) |
Production, Transportation and Moving Occupations
The most common Production, Transportation and Moving occupations in Riverside are Transportation (86 | 15.9%), and Production (28 | 5.2%).
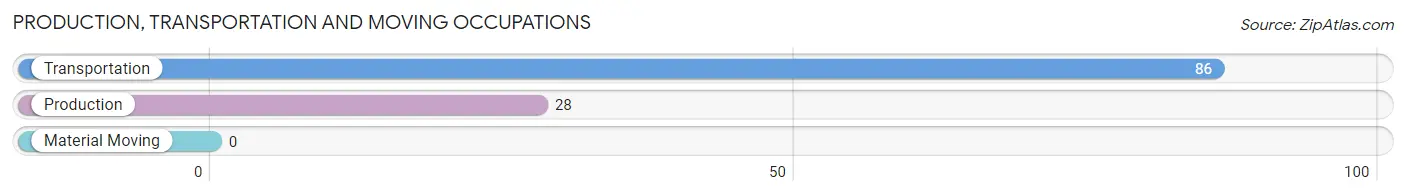
Production, Transportation and Moving Occupations by Sex
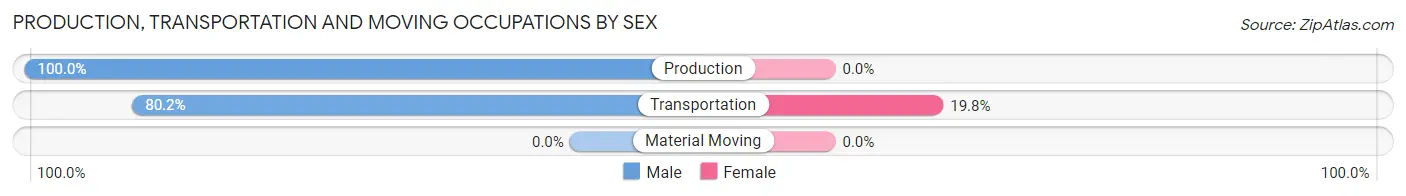
| Occupation | Male | Female |
| Production | 28 (100.0%) | 0 (0.0%) |
| Transportation | 69 (80.2%) | 17 (19.8%) |
| Material Moving | 0 (0.0%) | 0 (0.0%) |
| Total (Category) | 97 (85.1%) | 17 (14.9%) |
| Total (Overall) | 274 (50.6%) | 267 (49.3%) |
Employment Industries by Sex in Riverside
Employment Industries in Riverside
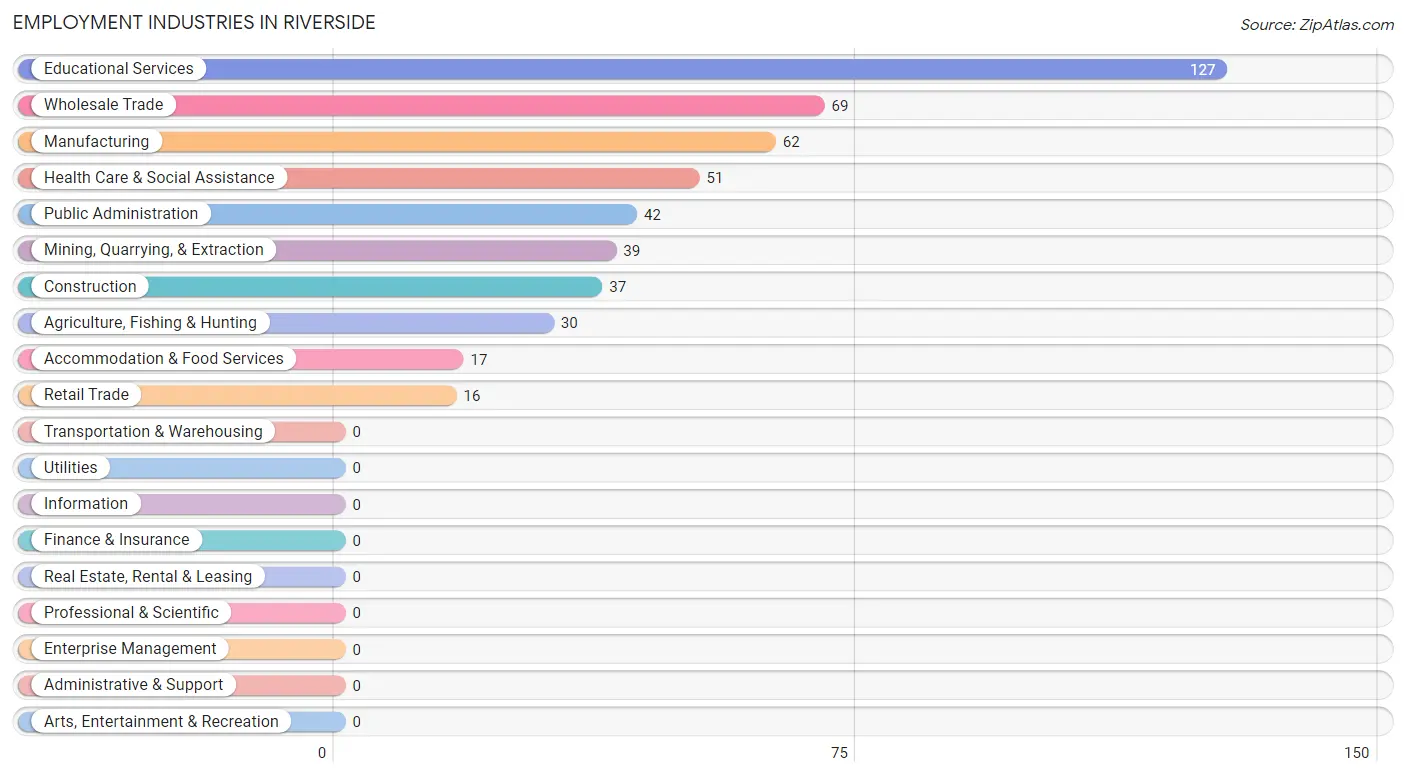
The major employment industries in Riverside include Educational Services (127 | 23.5%), Wholesale Trade (69 | 12.8%), Manufacturing (62 | 11.5%), Health Care & Social Assistance (51 | 9.4%), and Public Administration (42 | 7.8%).
Employment Industries by Sex in Riverside
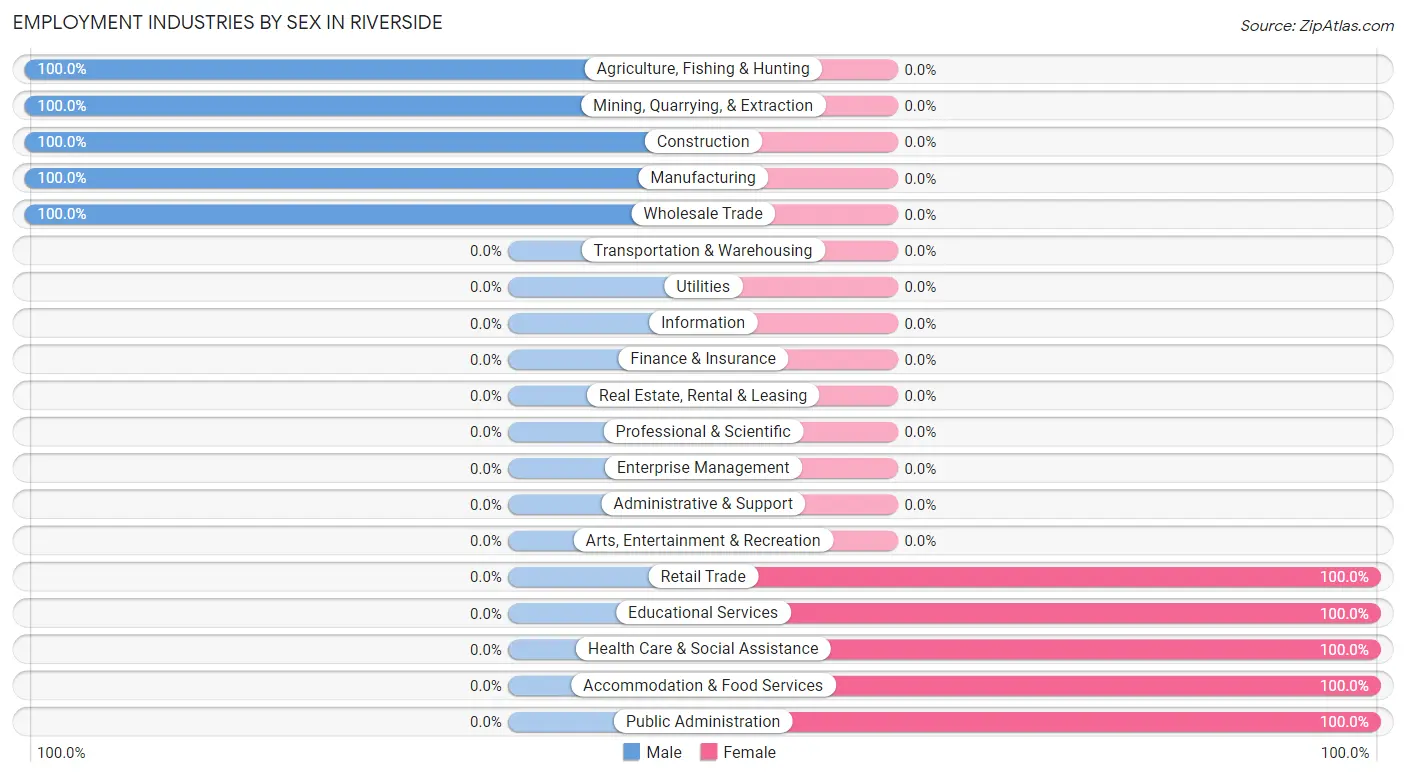
The Riverside industries that see more men than women are Agriculture, Fishing & Hunting (100.0%), Mining, Quarrying, & Extraction (100.0%), and Construction (100.0%), whereas the industries that tend to have a higher number of women are Retail Trade (100.0%), Educational Services (100.0%), and Health Care & Social Assistance (100.0%).
| Industry | Male | Female |
| Agriculture, Fishing & Hunting | 30 (100.0%) | 0 (0.0%) |
| Mining, Quarrying, & Extraction | 39 (100.0%) | 0 (0.0%) |
| Construction | 37 (100.0%) | 0 (0.0%) |
| Manufacturing | 62 (100.0%) | 0 (0.0%) |
| Wholesale Trade | 69 (100.0%) | 0 (0.0%) |
| Retail Trade | 0 (0.0%) | 16 (100.0%) |
| Transportation & Warehousing | 0 (0.0%) | 0 (0.0%) |
| Utilities | 0 (0.0%) | 0 (0.0%) |
| Information | 0 (0.0%) | 0 (0.0%) |
| Finance & Insurance | 0 (0.0%) | 0 (0.0%) |
| Real Estate, Rental & Leasing | 0 (0.0%) | 0 (0.0%) |
| Professional & Scientific | 0 (0.0%) | 0 (0.0%) |
| Enterprise Management | 0 (0.0%) | 0 (0.0%) |
| Administrative & Support | 0 (0.0%) | 0 (0.0%) |
| Educational Services | 0 (0.0%) | 127 (100.0%) |
| Health Care & Social Assistance | 0 (0.0%) | 51 (100.0%) |
| Arts, Entertainment & Recreation | 0 (0.0%) | 0 (0.0%) |
| Accommodation & Food Services | 0 (0.0%) | 17 (100.0%) |
| Public Administration | 0 (0.0%) | 42 (100.0%) |
| Total | 274 (50.6%) | 267 (49.3%) |
Education in Riverside
School Enrollment in Riverside
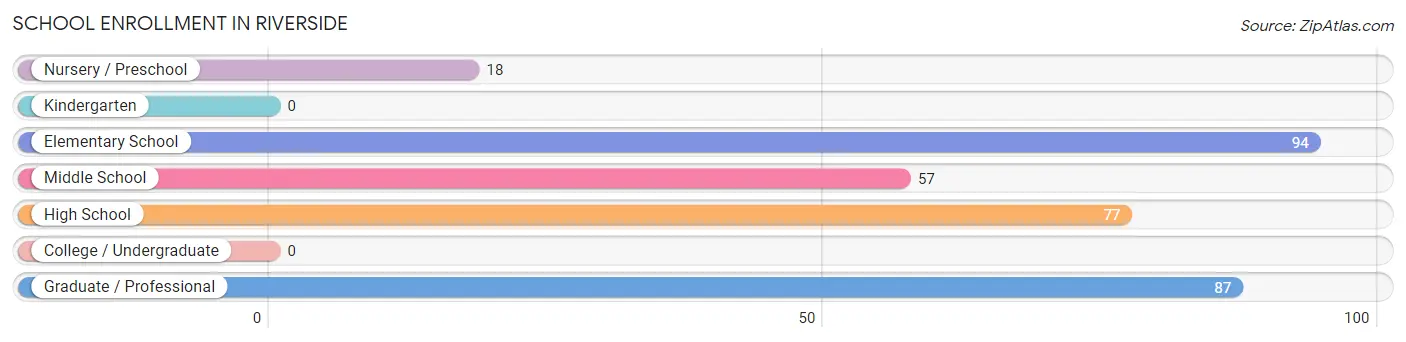
The most common levels of schooling among the 333 students in Riverside are elementary school (94 | 28.2%), graduate / professional (87 | 26.1%), and high school (77 | 23.1%).
| School Level | # Students | % Students |
| Nursery / Preschool | 18 | 5.4% |
| Kindergarten | 0 | 0.0% |
| Elementary School | 94 | 28.2% |
| Middle School | 57 | 17.1% |
| High School | 77 | 23.1% |
| College / Undergraduate | 0 | 0.0% |
| Graduate / Professional | 87 | 26.1% |
| Total | 333 | 100.0% |
School Enrollment by Age by Funding Source in Riverside
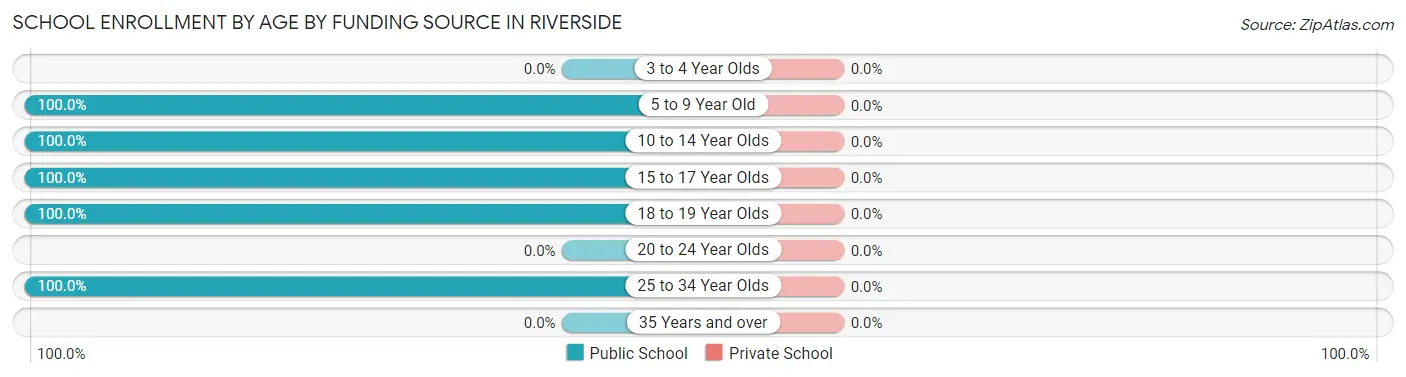
| Age Bracket | Public School | Private School |
| 3 to 4 Year Olds | 0 (0.0%) | 0 (0.0%) |
| 5 to 9 Year Old | 112 (100.0%) | 0 (0.0%) |
| 10 to 14 Year Olds | 57 (100.0%) | 0 (0.0%) |
| 15 to 17 Year Olds | 48 (100.0%) | 0 (0.0%) |
| 18 to 19 Year Olds | 29 (100.0%) | 0 (0.0%) |
| 20 to 24 Year Olds | 0 (0.0%) | 0 (0.0%) |
| 25 to 34 Year Olds | 87 (100.0%) | 0 (0.0%) |
| 35 Years and over | 0 (0.0%) | 0 (0.0%) |
| Total | 333 (100.0%) | 0 (0.0%) |
Educational Attainment by Field of Study in Riverside
Business (87 | 40.3%), science & technology (70 | 32.4%), education (47 | 21.8%), and social sciences (12 | 5.6%) are the most common fields of study among 216 individuals in Riverside who have obtained a bachelor's degree or higher.
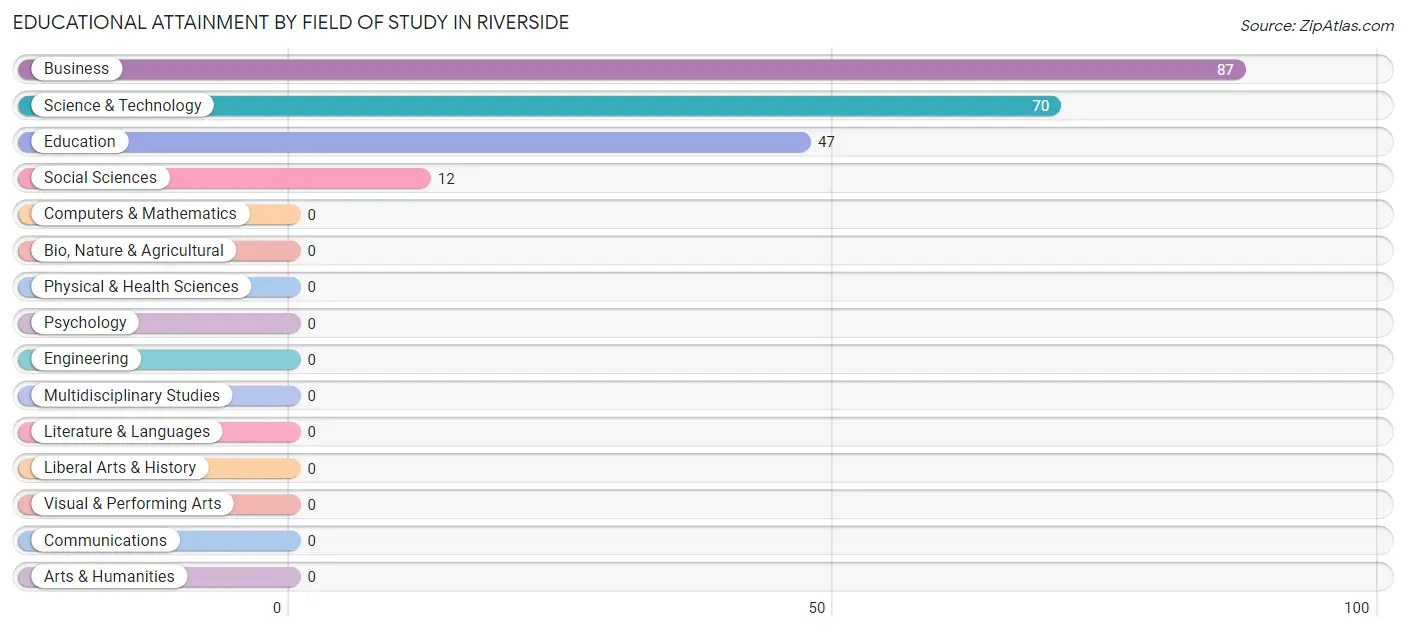
| Field of Study | # Graduates | % Graduates |
| Computers & Mathematics | 0 | 0.0% |
| Bio, Nature & Agricultural | 0 | 0.0% |
| Physical & Health Sciences | 0 | 0.0% |
| Psychology | 0 | 0.0% |
| Social Sciences | 12 | 5.6% |
| Engineering | 0 | 0.0% |
| Multidisciplinary Studies | 0 | 0.0% |
| Science & Technology | 70 | 32.4% |
| Business | 87 | 40.3% |
| Education | 47 | 21.8% |
| Literature & Languages | 0 | 0.0% |
| Liberal Arts & History | 0 | 0.0% |
| Visual & Performing Arts | 0 | 0.0% |
| Communications | 0 | 0.0% |
| Arts & Humanities | 0 | 0.0% |
| Total | 216 | 100.0% |
Transportation & Commute in Riverside
Vehicle Availability by Sex in Riverside
The most prevalent vehicle ownership categories in Riverside are males with 2 vehicles (120, accounting for 43.8%) and females with 2 vehicles (89, making up 44.9%).
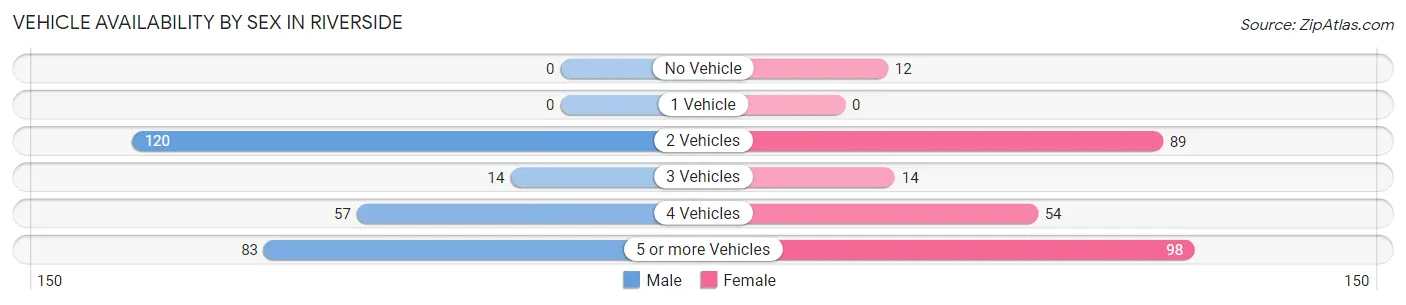
| Vehicles Available | Male | Female |
| No Vehicle | 0 (0.0%) | 12 (4.5%) |
| 1 Vehicle | 0 (0.0%) | 0 (0.0%) |
| 2 Vehicles | 120 (43.8%) | 89 (33.3%) |
| 3 Vehicles | 14 (5.1%) | 14 (5.2%) |
| 4 Vehicles | 57 (20.8%) | 54 (20.2%) |
| 5 or more Vehicles | 83 (30.3%) | 98 (36.7%) |
| Total | 274 (100.0%) | 267 (100.0%) |
Commute Time in Riverside
The most frequently occuring commute durations in Riverside are 30 to 34 minutes (144 commuters, 31.4%), 10 to 14 minutes (110 commuters, 24.0%), and 15 to 19 minutes (54 commuters, 11.8%).
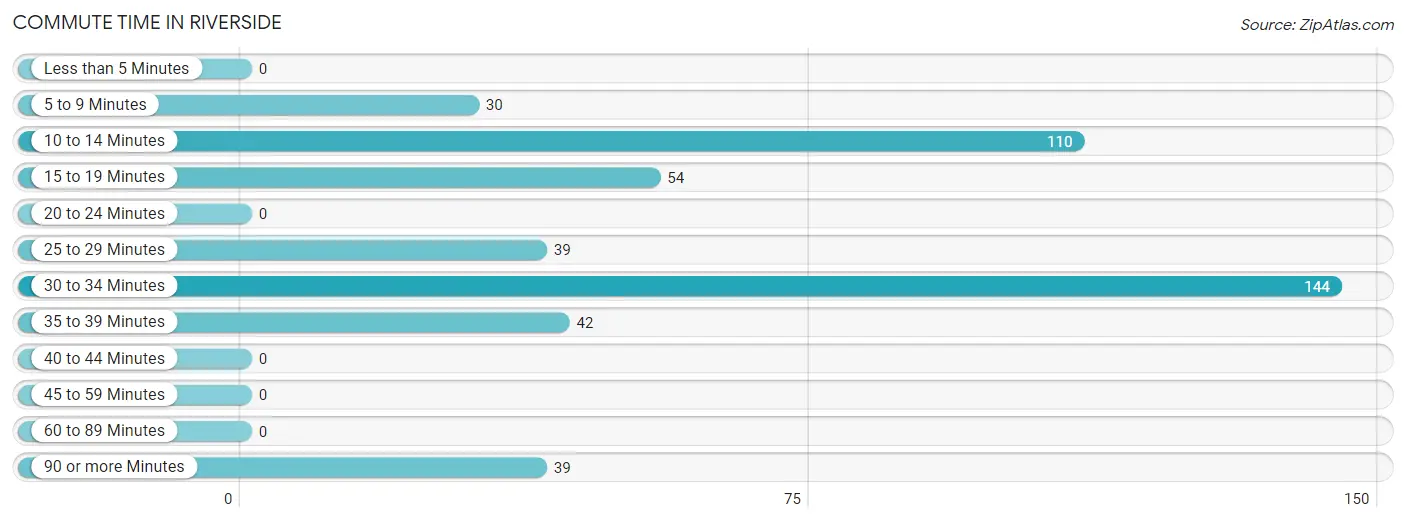
| Commute Time | # Commuters | % Commuters |
| Less than 5 Minutes | 0 | 0.0% |
| 5 to 9 Minutes | 30 | 6.6% |
| 10 to 14 Minutes | 110 | 24.0% |
| 15 to 19 Minutes | 54 | 11.8% |
| 20 to 24 Minutes | 0 | 0.0% |
| 25 to 29 Minutes | 39 | 8.5% |
| 30 to 34 Minutes | 144 | 31.4% |
| 35 to 39 Minutes | 42 | 9.2% |
| 40 to 44 Minutes | 0 | 0.0% |
| 45 to 59 Minutes | 0 | 0.0% |
| 60 to 89 Minutes | 0 | 0.0% |
| 90 or more Minutes | 39 | 8.5% |
Commute Time by Sex in Riverside
The most common commute times in Riverside are 30 to 34 minutes (85 commuters, 41.5%) for males and 10 to 14 minutes (96 commuters, 37.9%) for females.
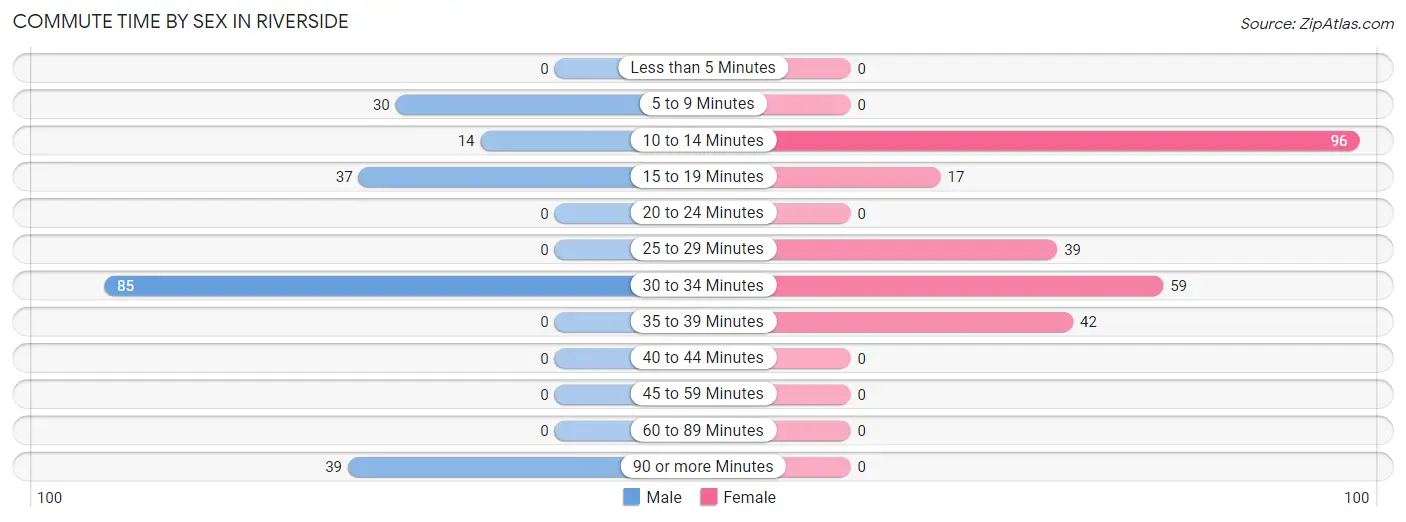
| Commute Time | Male | Female |
| Less than 5 Minutes | 0 (0.0%) | 0 (0.0%) |
| 5 to 9 Minutes | 30 (14.6%) | 0 (0.0%) |
| 10 to 14 Minutes | 14 (6.8%) | 96 (37.9%) |
| 15 to 19 Minutes | 37 (18.0%) | 17 (6.7%) |
| 20 to 24 Minutes | 0 (0.0%) | 0 (0.0%) |
| 25 to 29 Minutes | 0 (0.0%) | 39 (15.4%) |
| 30 to 34 Minutes | 85 (41.5%) | 59 (23.3%) |
| 35 to 39 Minutes | 0 (0.0%) | 42 (16.6%) |
| 40 to 44 Minutes | 0 (0.0%) | 0 (0.0%) |
| 45 to 59 Minutes | 0 (0.0%) | 0 (0.0%) |
| 60 to 89 Minutes | 0 (0.0%) | 0 (0.0%) |
| 90 or more Minutes | 39 (19.0%) | 0 (0.0%) |
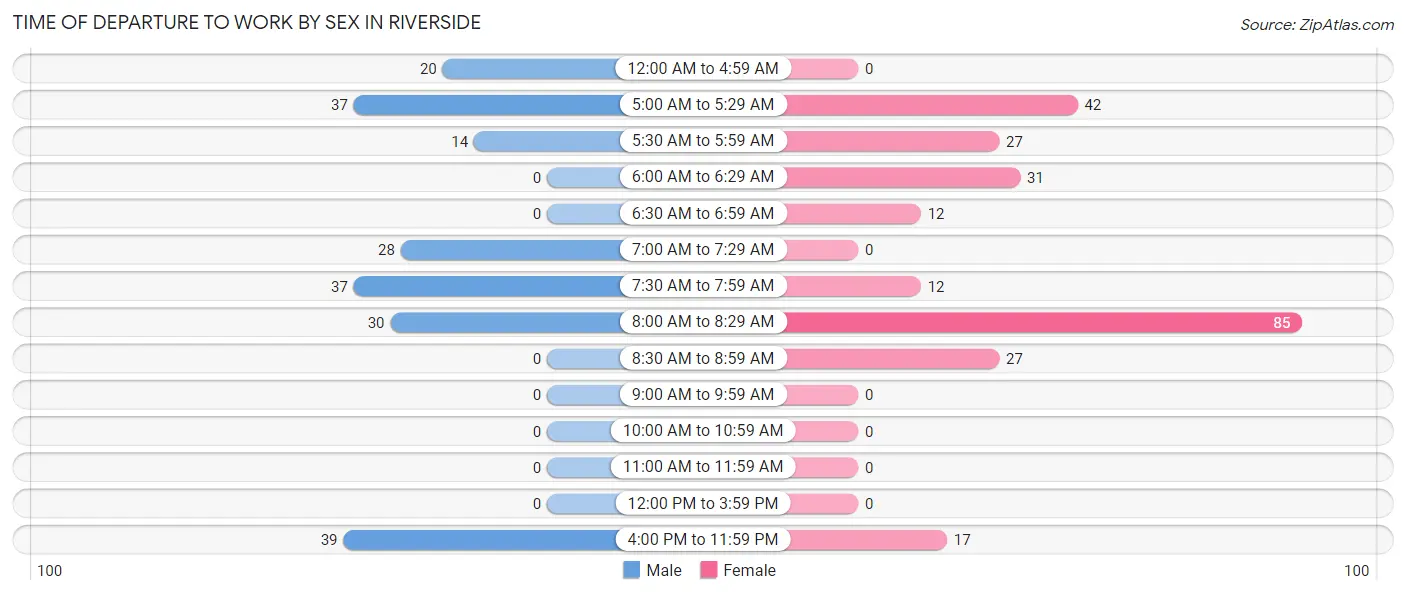
Time of Departure to Work by Sex in Riverside
The most frequent times of departure to work in Riverside are 4:00 PM to 11:59 PM (39, 19.0%) for males and 8:00 AM to 8:29 AM (85, 33.6%) for females.
| Time of Departure | Male | Female |
| 12:00 AM to 4:59 AM | 20 (9.8%) | 0 (0.0%) |
| 5:00 AM to 5:29 AM | 37 (18.0%) | 42 (16.6%) |
| 5:30 AM to 5:59 AM | 14 (6.8%) | 27 (10.7%) |
| 6:00 AM to 6:29 AM | 0 (0.0%) | 31 (12.2%) |
| 6:30 AM to 6:59 AM | 0 (0.0%) | 12 (4.7%) |
| 7:00 AM to 7:29 AM | 28 (13.7%) | 0 (0.0%) |
| 7:30 AM to 7:59 AM | 37 (18.0%) | 12 (4.7%) |
| 8:00 AM to 8:29 AM | 30 (14.6%) | 85 (33.6%) |
| 8:30 AM to 8:59 AM | 0 (0.0%) | 27 (10.7%) |
| 9:00 AM to 9:59 AM | 0 (0.0%) | 0 (0.0%) |
| 10:00 AM to 10:59 AM | 0 (0.0%) | 0 (0.0%) |
| 11:00 AM to 11:59 AM | 0 (0.0%) | 0 (0.0%) |
| 12:00 PM to 3:59 PM | 0 (0.0%) | 0 (0.0%) |
| 4:00 PM to 11:59 PM | 39 (19.0%) | 17 (6.7%) |
| Total | 205 (100.0%) | 253 (100.0%) |
Housing Occupancy in Riverside
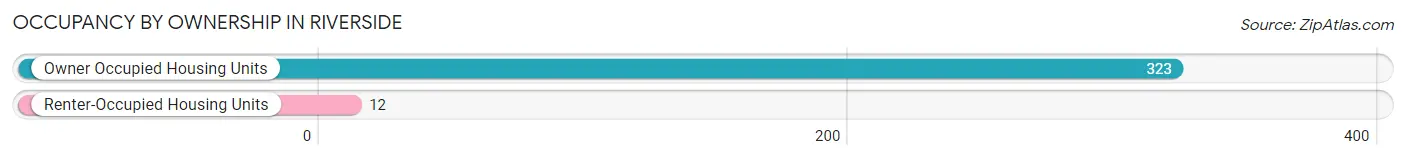
Occupancy by Ownership in Riverside
Of the total 335 dwellings in Riverside, owner-occupied units account for 323 (96.4%), while renter-occupied units make up 12 (3.6%).
| Occupancy | # Housing Units | % Housing Units |
| Owner Occupied Housing Units | 323 | 96.4% |
| Renter-Occupied Housing Units | 12 | 3.6% |
| Total Occupied Housing Units | 335 | 100.0% |
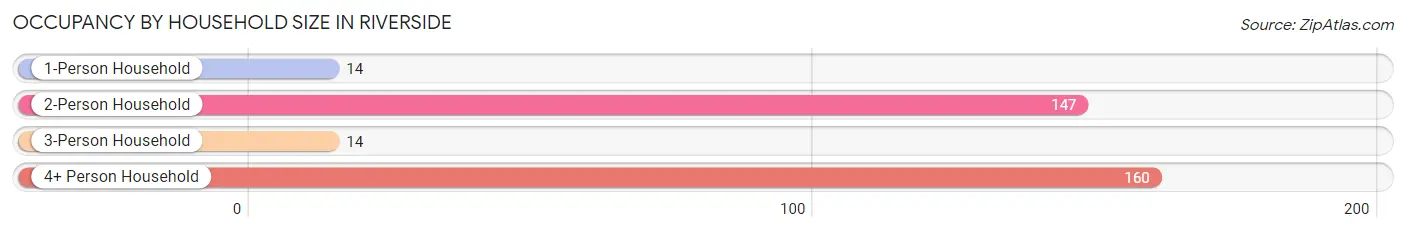
Occupancy by Household Size in Riverside
| Household Size | # Housing Units | % Housing Units |
| 1-Person Household | 14 | 4.2% |
| 2-Person Household | 147 | 43.9% |
| 3-Person Household | 14 | 4.2% |
| 4+ Person Household | 160 | 47.8% |
| Total Housing Units | 335 | 100.0% |
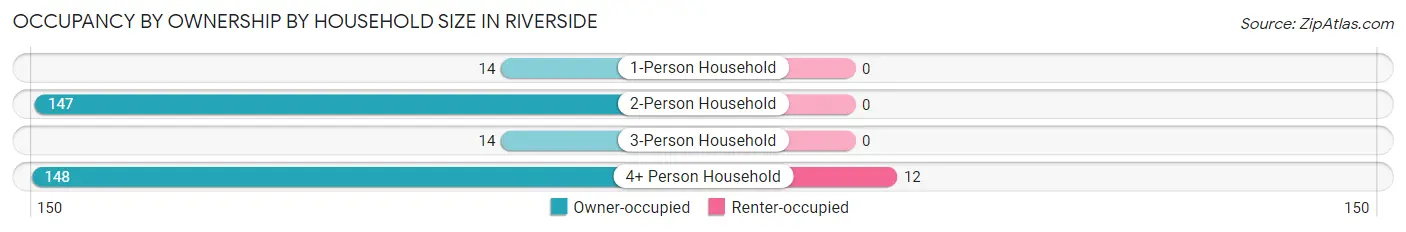
Occupancy by Ownership by Household Size in Riverside
| Household Size | Owner-occupied | Renter-occupied |
| 1-Person Household | 14 (100.0%) | 0 (0.0%) |
| 2-Person Household | 147 (100.0%) | 0 (0.0%) |
| 3-Person Household | 14 (100.0%) | 0 (0.0%) |
| 4+ Person Household | 148 (92.5%) | 12 (7.5%) |
| Total Housing Units | 323 (96.4%) | 12 (3.6%) |
Occupancy by Educational Attainment in Riverside
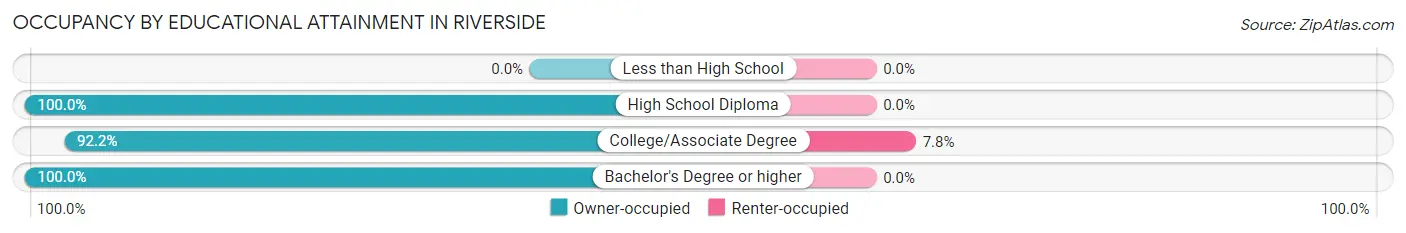
| Household Size | Owner-occupied | Renter-occupied |
| Less than High School | 0 (0.0%) | 0 (0.0%) |
| High School Diploma | 96 (100.0%) | 0 (0.0%) |
| College/Associate Degree | 141 (92.2%) | 12 (7.8%) |
| Bachelor's Degree or higher | 86 (100.0%) | 0 (0.0%) |
Occupancy by Age of Householder in Riverside
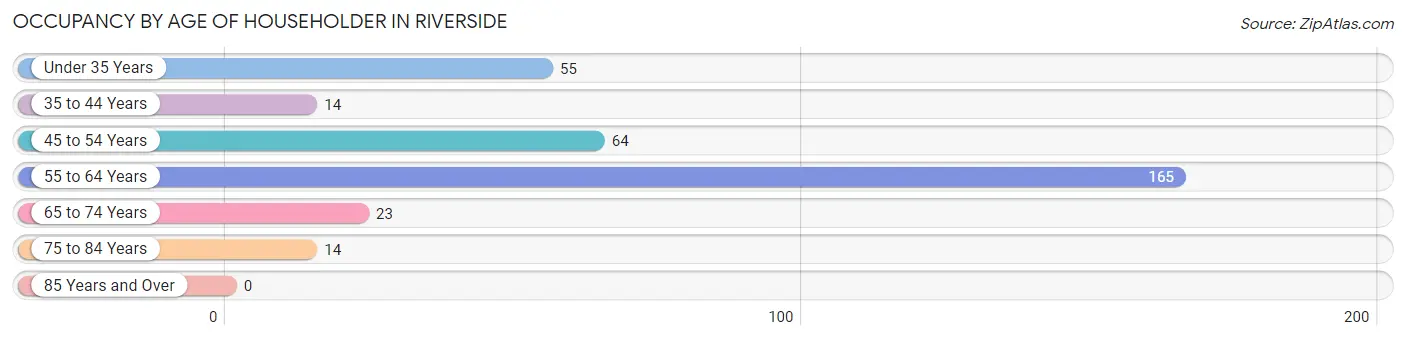
| Age Bracket | # Households | % Households |
| Under 35 Years | 55 | 16.4% |
| 35 to 44 Years | 14 | 4.2% |
| 45 to 54 Years | 64 | 19.1% |
| 55 to 64 Years | 165 | 49.2% |
| 65 to 74 Years | 23 | 6.9% |
| 75 to 84 Years | 14 | 4.2% |
| 85 Years and Over | 0 | 0.0% |
| Total | 335 | 100.0% |
Housing Finances in Riverside
Median Income by Occupancy in Riverside
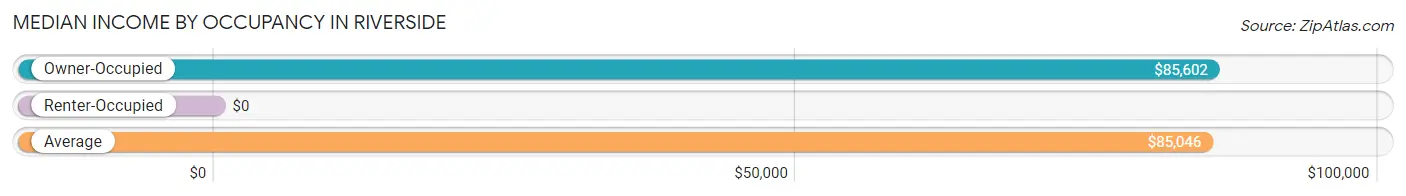
| Occupancy Type | # Households | Median Income |
| Owner-Occupied | 323 (96.4%) | $85,602 |
| Renter-Occupied | 12 (3.6%) | $0 |
| Average | 335 (100.0%) | $85,046 |
Occupancy by Householder Income Bracket in Riverside
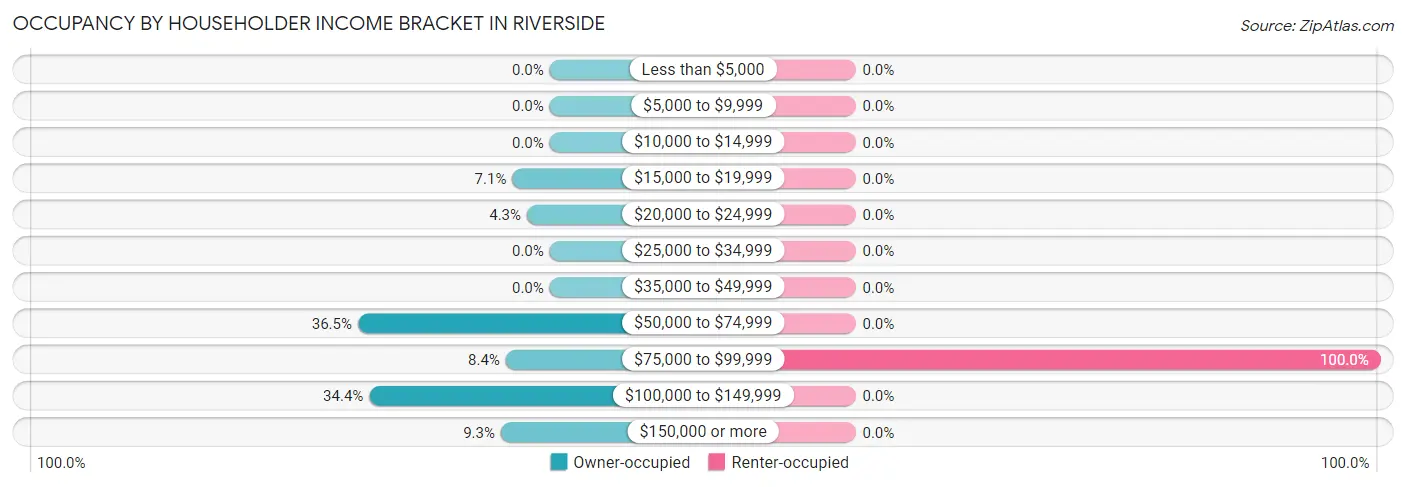
| Income Bracket | Owner-occupied | Renter-occupied |
| Less than $5,000 | 0 (0.0%) | 0 (0.0%) |
| $5,000 to $9,999 | 0 (0.0%) | 0 (0.0%) |
| $10,000 to $14,999 | 0 (0.0%) | 0 (0.0%) |
| $15,000 to $19,999 | 23 (7.1%) | 0 (0.0%) |
| $20,000 to $24,999 | 14 (4.3%) | 0 (0.0%) |
| $25,000 to $34,999 | 0 (0.0%) | 0 (0.0%) |
| $35,000 to $49,999 | 0 (0.0%) | 0 (0.0%) |
| $50,000 to $74,999 | 118 (36.5%) | 0 (0.0%) |
| $75,000 to $99,999 | 27 (8.4%) | 12 (100.0%) |
| $100,000 to $149,999 | 111 (34.4%) | 0 (0.0%) |
| $150,000 or more | 30 (9.3%) | 0 (0.0%) |
| Total | 323 (100.0%) | 12 (100.0%) |
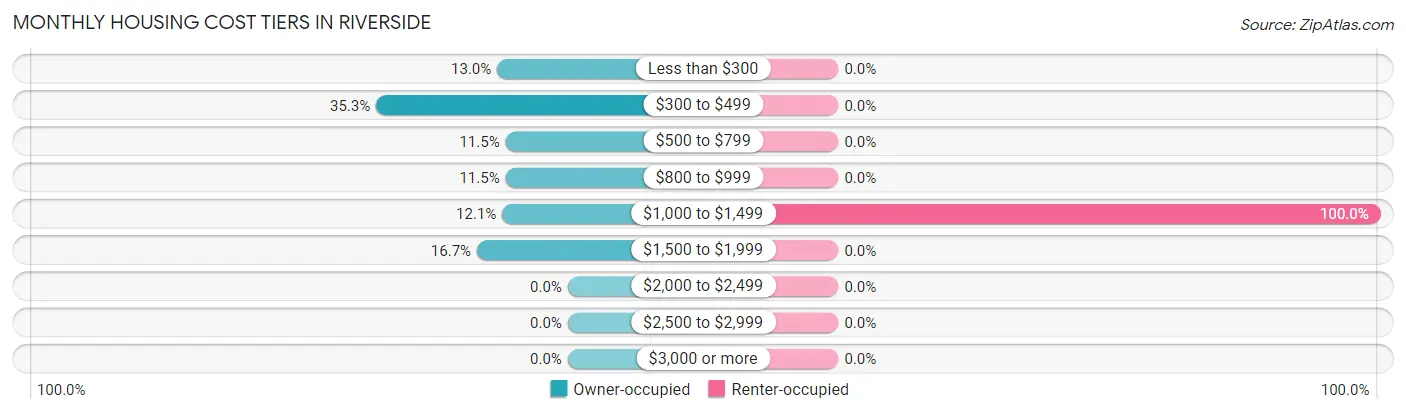
Monthly Housing Cost Tiers in Riverside
| Monthly Cost | Owner-occupied | Renter-occupied |
| Less than $300 | 42 (13.0%) | 0 (0.0%) |
| $300 to $499 | 114 (35.3%) | 0 (0.0%) |
| $500 to $799 | 37 (11.5%) | 0 (0.0%) |
| $800 to $999 | 37 (11.5%) | 0 (0.0%) |
| $1,000 to $1,499 | 39 (12.1%) | 12 (100.0%) |
| $1,500 to $1,999 | 54 (16.7%) | 0 (0.0%) |
| $2,000 to $2,499 | 0 (0.0%) | 0 (0.0%) |
| $2,500 to $2,999 | 0 (0.0%) | 0 (0.0%) |
| $3,000 or more | 0 (0.0%) | 0 (0.0%) |
| Total | 323 (100.0%) | 12 (100.0%) |
Physical Housing Characteristics in Riverside
Housing Structures in Riverside
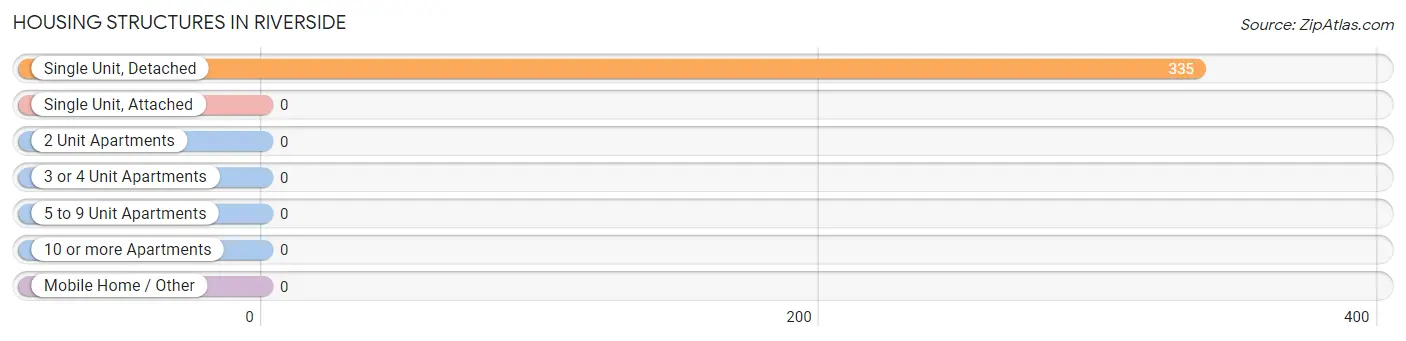
| Structure Type | # Housing Units | % Housing Units |
| Single Unit, Detached | 335 | 100.0% |
| Single Unit, Attached | 0 | 0.0% |
| 2 Unit Apartments | 0 | 0.0% |
| 3 or 4 Unit Apartments | 0 | 0.0% |
| 5 to 9 Unit Apartments | 0 | 0.0% |
| 10 or more Apartments | 0 | 0.0% |
| Mobile Home / Other | 0 | 0.0% |
| Total | 335 | 100.0% |
Housing Structures by Occupancy in Riverside
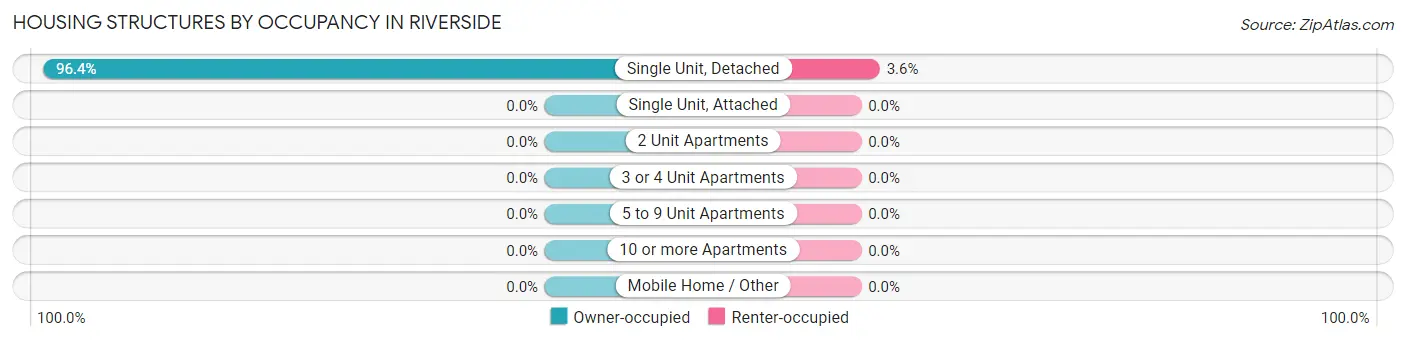
| Structure Type | Owner-occupied | Renter-occupied |
| Single Unit, Detached | 323 (96.4%) | 12 (3.6%) |
| Single Unit, Attached | 0 (0.0%) | 0 (0.0%) |
| 2 Unit Apartments | 0 (0.0%) | 0 (0.0%) |
| 3 or 4 Unit Apartments | 0 (0.0%) | 0 (0.0%) |
| 5 to 9 Unit Apartments | 0 (0.0%) | 0 (0.0%) |
| 10 or more Apartments | 0 (0.0%) | 0 (0.0%) |
| Mobile Home / Other | 0 (0.0%) | 0 (0.0%) |
| Total | 323 (96.4%) | 12 (3.6%) |
Housing Structures by Number of Rooms in Riverside
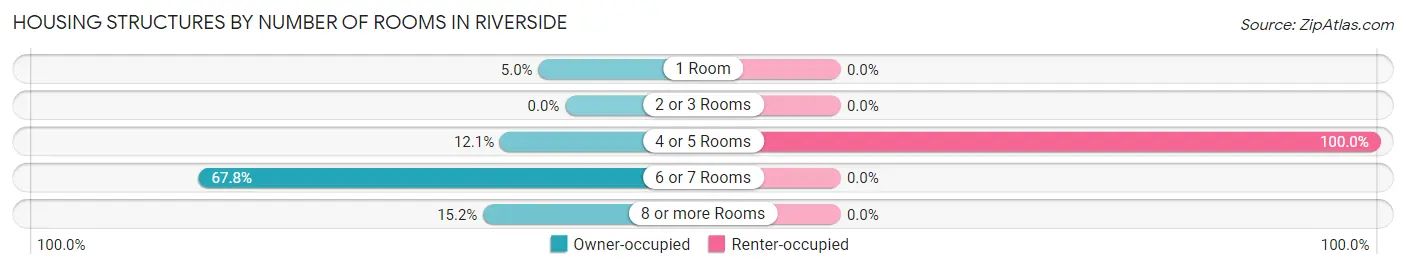
| Number of Rooms | Owner-occupied | Renter-occupied |
| 1 Room | 16 (5.0%) | 0 (0.0%) |
| 2 or 3 Rooms | 0 (0.0%) | 0 (0.0%) |
| 4 or 5 Rooms | 39 (12.1%) | 12 (100.0%) |
| 6 or 7 Rooms | 219 (67.8%) | 0 (0.0%) |
| 8 or more Rooms | 49 (15.2%) | 0 (0.0%) |
| Total | 323 (100.0%) | 12 (100.0%) |
Housing Structure by Heating Type in Riverside
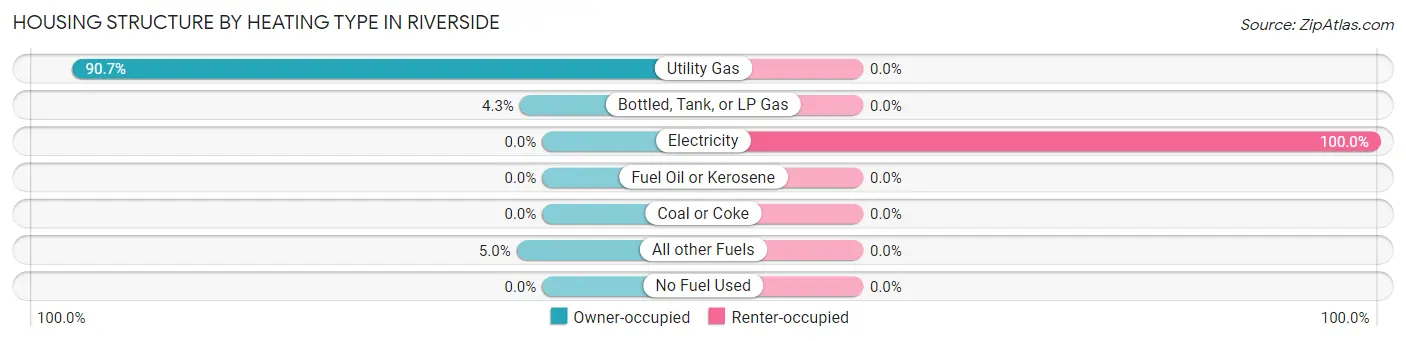
| Heating Type | Owner-occupied | Renter-occupied |
| Utility Gas | 293 (90.7%) | 0 (0.0%) |
| Bottled, Tank, or LP Gas | 14 (4.3%) | 0 (0.0%) |
| Electricity | 0 (0.0%) | 12 (100.0%) |
| Fuel Oil or Kerosene | 0 (0.0%) | 0 (0.0%) |
| Coal or Coke | 0 (0.0%) | 0 (0.0%) |
| All other Fuels | 16 (5.0%) | 0 (0.0%) |
| No Fuel Used | 0 (0.0%) | 0 (0.0%) |
| Total | 323 (100.0%) | 12 (100.0%) |
Household Vehicle Usage in Riverside
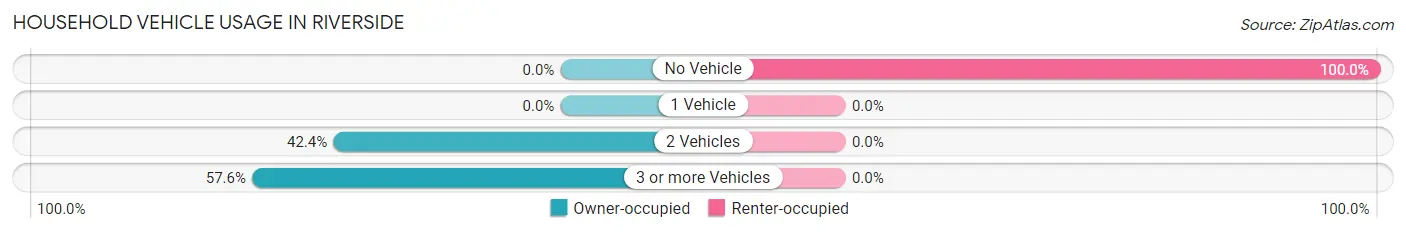
| Vehicles per Household | Owner-occupied | Renter-occupied |
| No Vehicle | 0 (0.0%) | 12 (100.0%) |
| 1 Vehicle | 0 (0.0%) | 0 (0.0%) |
| 2 Vehicles | 137 (42.4%) | 0 (0.0%) |
| 3 or more Vehicles | 186 (57.6%) | 0 (0.0%) |
| Total | 323 (100.0%) | 12 (100.0%) |
Real Estate & Mortgages in Riverside
Real Estate and Mortgage Overview in Riverside
| Characteristic | Without Mortgage | With Mortgage |
| Housing Units | 193 | 130 |
| Median Property Value | $403,600 | $285,100 |
| Median Household Income | $69,221 | $0 |
| Monthly Housing Costs | $448 | $0 |
| Real Estate Taxes | $2,350 | $0 |
Property Value by Mortgage Status in Riverside
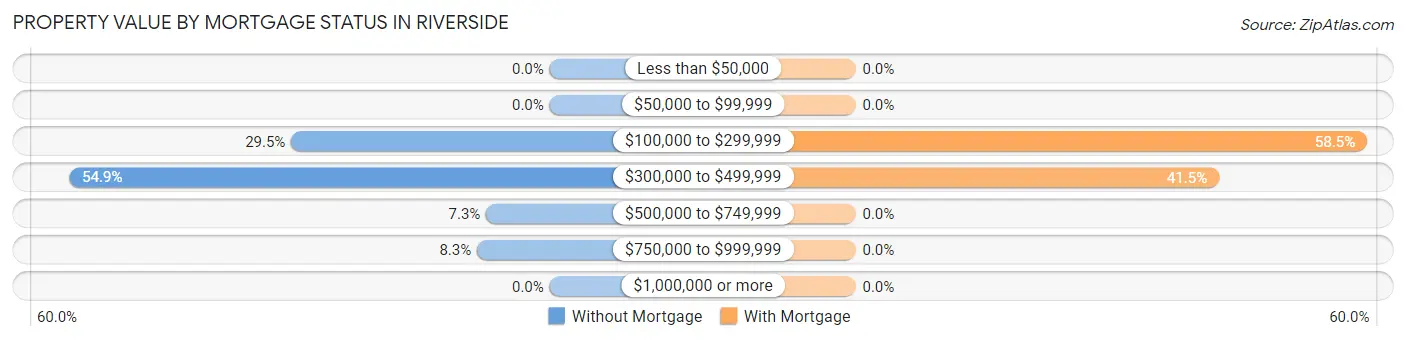
| Property Value | Without Mortgage | With Mortgage |
| Less than $50,000 | 0 (0.0%) | 0 (0.0%) |
| $50,000 to $99,999 | 0 (0.0%) | 0 (0.0%) |
| $100,000 to $299,999 | 57 (29.5%) | 76 (58.5%) |
| $300,000 to $499,999 | 106 (54.9%) | 54 (41.5%) |
| $500,000 to $749,999 | 14 (7.2%) | 0 (0.0%) |
| $750,000 to $999,999 | 16 (8.3%) | 0 (0.0%) |
| $1,000,000 or more | 0 (0.0%) | 0 (0.0%) |
| Total | 193 (100.0%) | 130 (100.0%) |
Household Income by Mortgage Status in Riverside
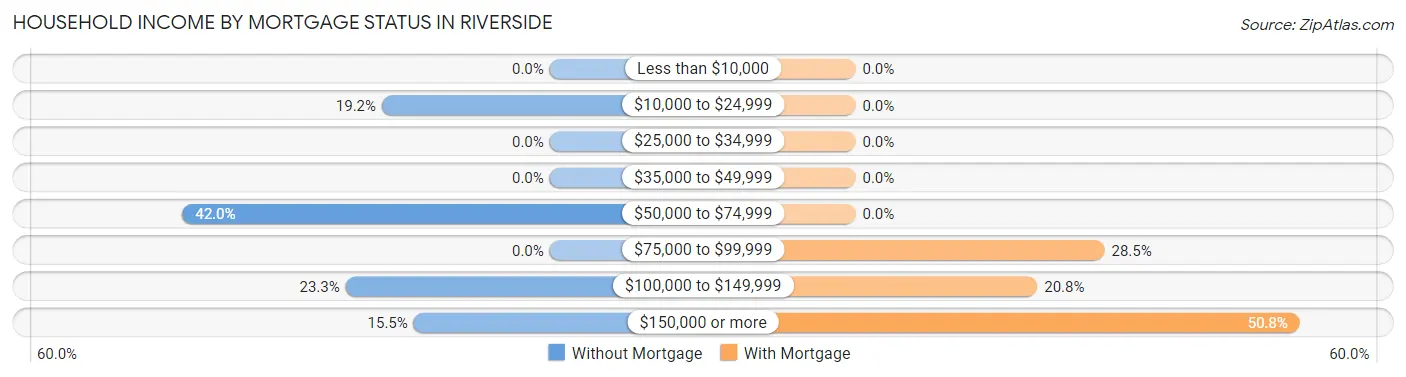
| Household Income | Without Mortgage | With Mortgage |
| Less than $10,000 | 0 (0.0%) | 0 (0.0%) |
| $10,000 to $24,999 | 37 (19.2%) | 0 (0.0%) |
| $25,000 to $34,999 | 0 (0.0%) | 0 (0.0%) |
| $35,000 to $49,999 | 0 (0.0%) | 0 (0.0%) |
| $50,000 to $74,999 | 81 (42.0%) | 0 (0.0%) |
| $75,000 to $99,999 | 0 (0.0%) | 37 (28.5%) |
| $100,000 to $149,999 | 45 (23.3%) | 27 (20.8%) |
| $150,000 or more | 30 (15.5%) | 66 (50.8%) |
| Total | 193 (100.0%) | 130 (100.0%) |
Property Value to Household Income Ratio in Riverside
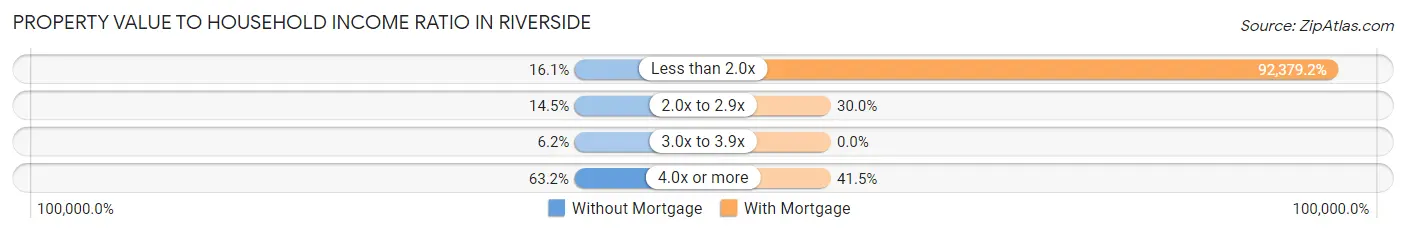
| Value-to-Income Ratio | Without Mortgage | With Mortgage |
| Less than 2.0x | 31 (16.1%) | 120,093 (92,379.2%) |
| 2.0x to 2.9x | 28 (14.5%) | 39 (30.0%) |
| 3.0x to 3.9x | 12 (6.2%) | 0 (0.0%) |
| 4.0x or more | 122 (63.2%) | 54 (41.5%) |
| Total | 193 (100.0%) | 130 (100.0%) |
Real Estate Taxes by Mortgage Status in Riverside
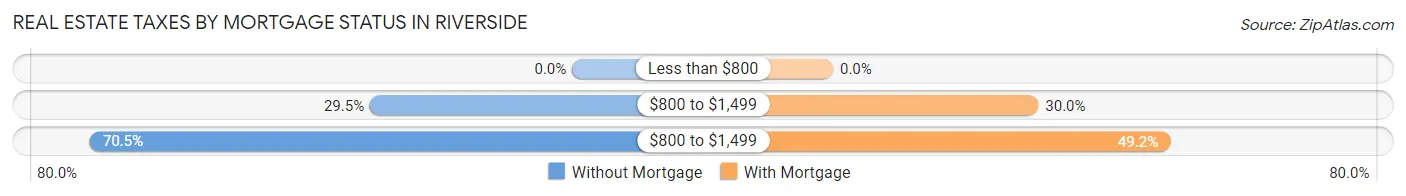
| Property Taxes | Without Mortgage | With Mortgage |
| Less than $800 | 0 (0.0%) | 0 (0.0%) |
| $800 to $1,499 | 57 (29.5%) | 39 (30.0%) |
| $800 to $1,499 | 136 (70.5%) | 64 (49.2%) |
| Total | 193 (100.0%) | 130 (100.0%) |
Health & Disability in Riverside
Health Insurance Coverage by Age in Riverside
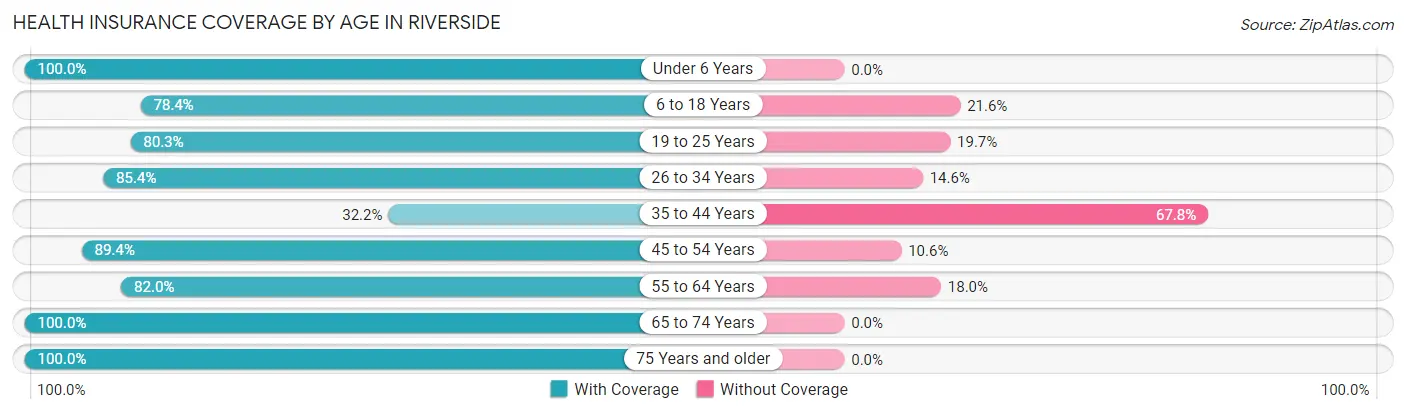
| Age Bracket | With Coverage | Without Coverage |
| Under 6 Years | 137 (100.0%) | 0 (0.0%) |
| 6 to 18 Years | 156 (78.4%) | 43 (21.6%) |
| 19 to 25 Years | 118 (80.3%) | 29 (19.7%) |
| 26 to 34 Years | 216 (85.4%) | 37 (14.6%) |
| 35 to 44 Years | 28 (32.2%) | 59 (67.8%) |
| 45 to 54 Years | 101 (89.4%) | 12 (10.6%) |
| 55 to 64 Years | 173 (82.0%) | 38 (18.0%) |
| 65 to 74 Years | 122 (100.0%) | 0 (0.0%) |
| 75 Years and older | 14 (100.0%) | 0 (0.0%) |
| Total | 1,065 (83.0%) | 218 (17.0%) |
Health Insurance Coverage by Citizenship Status in Riverside
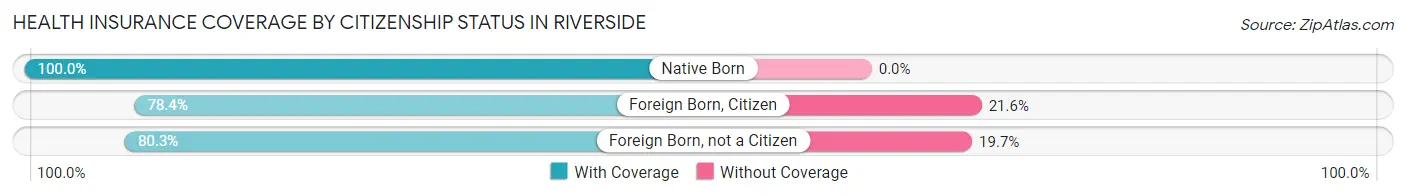
| Citizenship Status | With Coverage | Without Coverage |
| Native Born | 137 (100.0%) | 0 (0.0%) |
| Foreign Born, Citizen | 156 (78.4%) | 43 (21.6%) |
| Foreign Born, not a Citizen | 118 (80.3%) | 29 (19.7%) |
Health Insurance Coverage by Household Income in Riverside
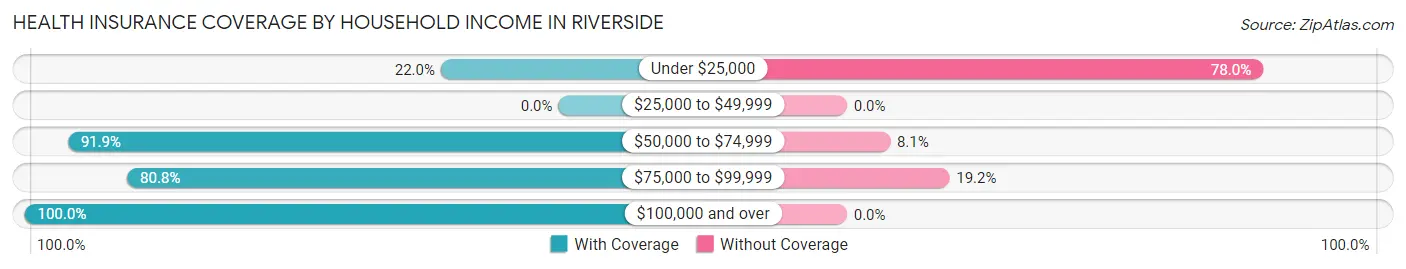
| Household Income | With Coverage | Without Coverage |
| Under $25,000 | 37 (22.0%) | 131 (78.0%) |
| $25,000 to $49,999 | 0 (0.0%) | 0 (0.0%) |
| $50,000 to $74,999 | 273 (91.9%) | 24 (8.1%) |
| $75,000 to $99,999 | 265 (80.8%) | 63 (19.2%) |
| $100,000 and over | 490 (100.0%) | 0 (0.0%) |
Public vs Private Health Insurance Coverage by Age in Riverside
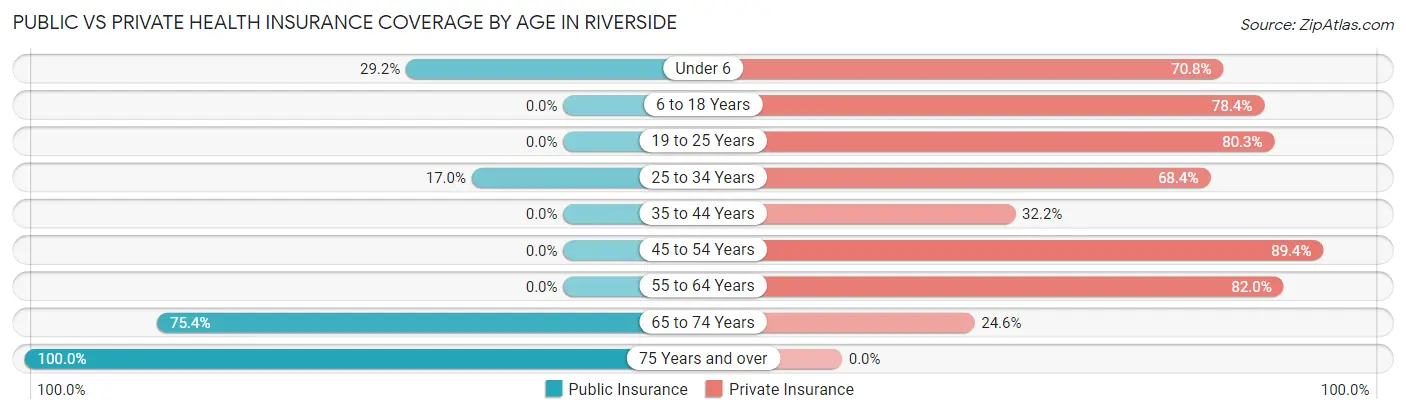
| Age Bracket | Public Insurance | Private Insurance |
| Under 6 | 40 (29.2%) | 97 (70.8%) |
| 6 to 18 Years | 0 (0.0%) | 156 (78.4%) |
| 19 to 25 Years | 0 (0.0%) | 118 (80.3%) |
| 25 to 34 Years | 43 (17.0%) | 173 (68.4%) |
| 35 to 44 Years | 0 (0.0%) | 28 (32.2%) |
| 45 to 54 Years | 0 (0.0%) | 101 (89.4%) |
| 55 to 64 Years | 0 (0.0%) | 173 (82.0%) |
| 65 to 74 Years | 92 (75.4%) | 30 (24.6%) |
| 75 Years and over | 14 (100.0%) | 0 (0.0%) |
| Total | 189 (14.7%) | 876 (68.3%) |
Disability Status by Sex by Age in Riverside
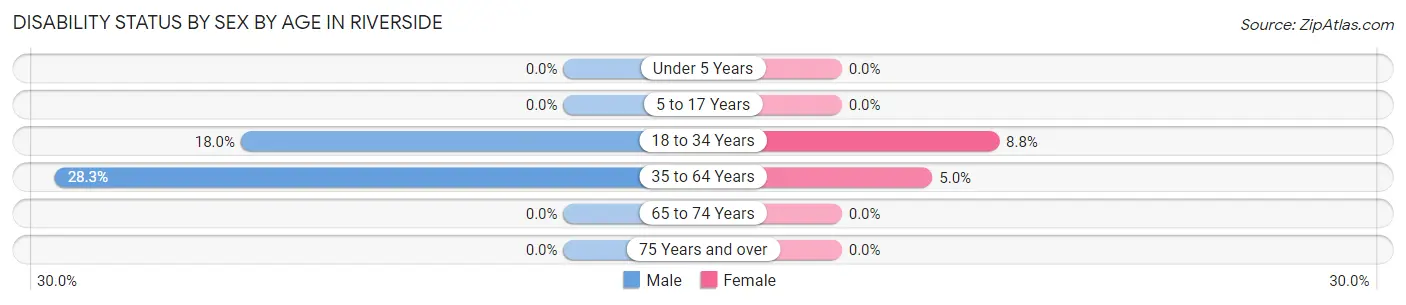
| Age Bracket | Male | Female |
| Under 5 Years | 0 (0.0%) | 0 (0.0%) |
| 5 to 17 Years | 0 (0.0%) | 0 (0.0%) |
| 18 to 34 Years | 37 (18.0%) | 17 (8.8%) |
| 35 to 64 Years | 49 (28.3%) | 12 (5.0%) |
| 65 to 74 Years | 0 (0.0%) | 0 (0.0%) |
| 75 Years and over | 0 (0.0%) | 0 (0.0%) |
Disability Class by Sex by Age in Riverside
Disability Class: Hearing Difficulty
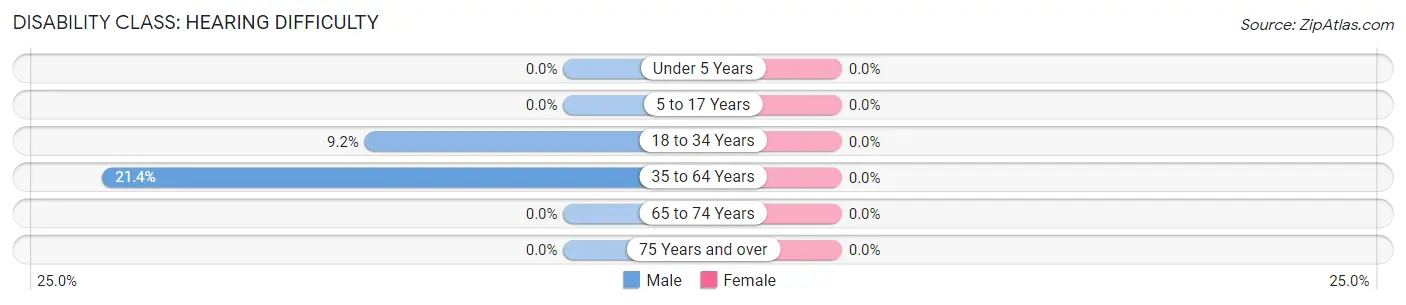
| Age Bracket | Male | Female |
| Under 5 Years | 0 (0.0%) | 0 (0.0%) |
| 5 to 17 Years | 0 (0.0%) | 0 (0.0%) |
| 18 to 34 Years | 19 (9.2%) | 0 (0.0%) |
| 35 to 64 Years | 37 (21.4%) | 0 (0.0%) |
| 65 to 74 Years | 0 (0.0%) | 0 (0.0%) |
| 75 Years and over | 0 (0.0%) | 0 (0.0%) |
Disability Class: Vision Difficulty
| Age Bracket | Male | Female |
| Under 5 Years | 0 (0.0%) | 0 (0.0%) |
| 5 to 17 Years | 0 (0.0%) | 0 (0.0%) |
| 18 to 34 Years | 0 (0.0%) | 0 (0.0%) |
| 35 to 64 Years | 0 (0.0%) | 0 (0.0%) |
| 65 to 74 Years | 0 (0.0%) | 0 (0.0%) |
| 75 Years and over | 0 (0.0%) | 0 (0.0%) |
Disability Class: Cognitive Difficulty
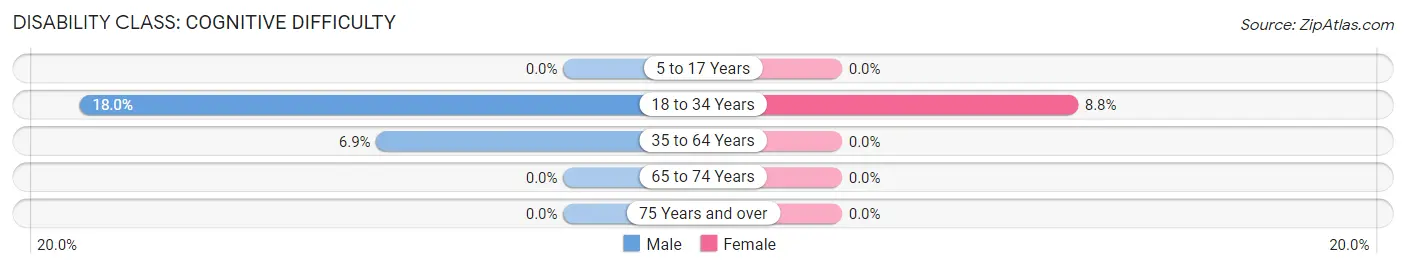
| Age Bracket | Male | Female |
| 5 to 17 Years | 0 (0.0%) | 0 (0.0%) |
| 18 to 34 Years | 37 (18.0%) | 17 (8.8%) |
| 35 to 64 Years | 12 (6.9%) | 0 (0.0%) |
| 65 to 74 Years | 0 (0.0%) | 0 (0.0%) |
| 75 Years and over | 0 (0.0%) | 0 (0.0%) |
Disability Class: Ambulatory Difficulty
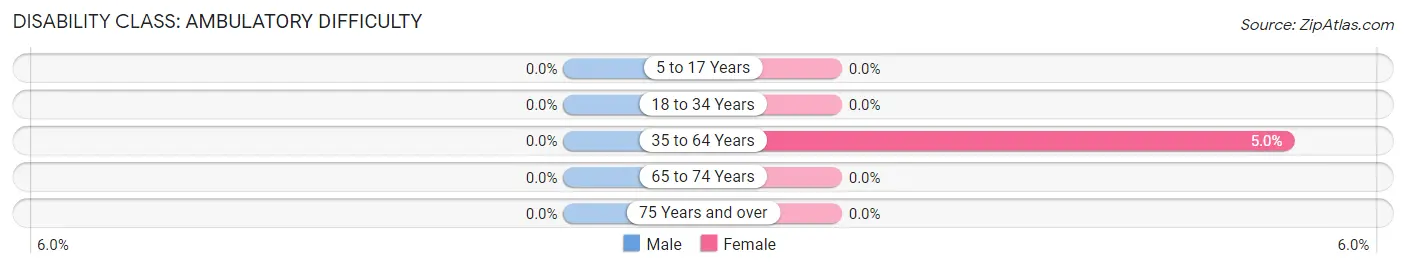
| Age Bracket | Male | Female |
| 5 to 17 Years | 0 (0.0%) | 0 (0.0%) |
| 18 to 34 Years | 0 (0.0%) | 0 (0.0%) |
| 35 to 64 Years | 0 (0.0%) | 12 (5.0%) |
| 65 to 74 Years | 0 (0.0%) | 0 (0.0%) |
| 75 Years and over | 0 (0.0%) | 0 (0.0%) |
Disability Class: Self-Care Difficulty
| Age Bracket | Male | Female |
| 5 to 17 Years | 0 (0.0%) | 0 (0.0%) |
| 18 to 34 Years | 0 (0.0%) | 0 (0.0%) |
| 35 to 64 Years | 0 (0.0%) | 0 (0.0%) |
| 65 to 74 Years | 0 (0.0%) | 0 (0.0%) |
| 75 Years and over | 0 (0.0%) | 0 (0.0%) |
Technology Access in Riverside
Computing Device Access in Riverside
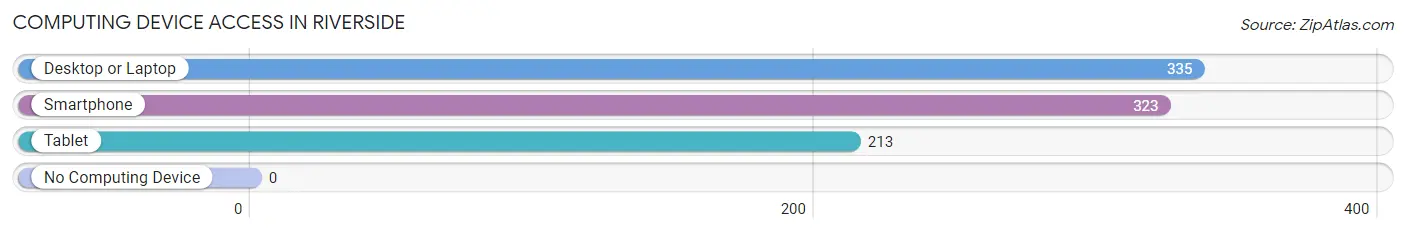
| Device Type | # Households | % Households |
| Desktop or Laptop | 335 | 100.0% |
| Smartphone | 323 | 96.4% |
| Tablet | 213 | 63.6% |
| No Computing Device | 0 | 0.0% |
| Total | 335 | 100.0% |
Internet Access in Riverside
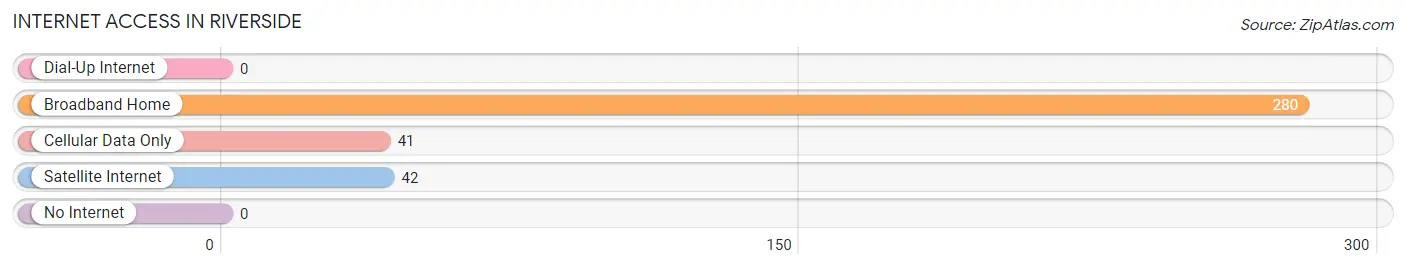
| Internet Type | # Households | % Households |
| Dial-Up Internet | 0 | 0.0% |
| Broadband Home | 280 | 83.6% |
| Cellular Data Only | 41 | 12.2% |
| Satellite Internet | 42 | 12.5% |
| No Internet | 0 | 0.0% |
| Total | 335 | 100.0% |
Riverside Summary
Riverside is a small town located in the southeastern corner of Utah, in the United States. It is situated in the San Rafael Swell, a large geological formation in the Colorado Plateau. The town is located in Emery County, and is the county seat. The population of Riverside was estimated to be 545 in 2020.
History
Riverside was first settled in 1877 by a group of Mormon pioneers led by John W. Van Cott. The town was originally called Emery, but was later changed to Riverside due to its proximity to the San Rafael River. The town was incorporated in 1891.
Riverside was an important stop on the Denver and Rio Grande Western Railroad, which ran through the town from 1891 to 1941. The railroad brought economic growth to the area, and the town became a center for the local agricultural industry.
In the early 20th century, Riverside was a popular tourist destination. The town was home to a number of resorts, including the Riverside Hotel, which was built in 1910. The hotel was a popular destination for visitors from Salt Lake City and other nearby cities.
Geography
Riverside is located in the San Rafael Swell, a large geological formation in the Colorado Plateau. The town is situated at an elevation of 5,400 feet (1,646 m). The San Rafael River runs through the town, and the surrounding area is characterized by rolling hills and canyons.
The climate in Riverside is semi-arid, with hot summers and cold winters. The average annual precipitation is 8.5 inches (216 mm).
Economy
Riverside is a small, rural town with a limited economy. The town is home to a number of small businesses, including a grocery store, a hardware store, and a few restaurants. The town is also home to a number of small farms and ranches.
The town is also home to a number of tourist attractions, including the San Rafael Swell, the San Rafael River, and the Riverside Hotel. These attractions bring in a number of visitors each year, providing a boost to the local economy.
Demographics
Riverside is a predominantly white town, with a population that is 97.3% white. The town has a median household income of $41,250, and a poverty rate of 16.3%. The town has a high school graduation rate of 87.3%.
Conclusion
Riverside is a small town located in the southeastern corner of Utah. The town was first settled in 1877, and was an important stop on the Denver and Rio Grande Western Railroad. The town is home to a number of small businesses, farms, and tourist attractions. The population of Riverside is predominantly white, with a median household income of $41,250 and a poverty rate of 16.3%. The town is a popular tourist destination, and provides a boost to the local economy.
Common Questions
What is Per Capita Income in Riverside?
Per Capita income in Riverside is $23,440.
What is the Median Family Income in Riverside?
Median Family Income in Riverside is $75,000.
What is the Median Household income in Riverside?
Median Household Income in Riverside is $85,046.
What is Income or Wage Gap in Riverside?
Income or Wage Gap in Riverside is 34.5%.
Women in Riverside earn 65.5 cents for every dollar earned by a man.
What is Inequality or Gini Index in Riverside?
Inequality or Gini Index in Riverside is 0.26.
What is the Total Population of Riverside?
Total Population of Riverside is 1,283.
What is the Total Male Population of Riverside?
Total Male Population of Riverside is 709.
What is the Total Female Population of Riverside?
Total Female Population of Riverside is 574.
What is the Ratio of Males per 100 Females in Riverside?
There are 123.52 Males per 100 Females in Riverside.
What is the Ratio of Females per 100 Males in Riverside?
There are 80.96 Females per 100 Males in Riverside.
What is the Median Population Age in Riverside?
Median Population Age in Riverside is 32.0 Years.
What is the Average Family Size in Riverside
Average Family Size in Riverside is 4.2 People.
What is the Average Household Size in Riverside
Average Household Size in Riverside is 3.8 People.
How Large is the Labor Force in Riverside?
There are 541 People in the Labor Forcein in Riverside.
What is the Percentage of People in the Labor Force in Riverside?
54.4% of People are in the Labor Force in Riverside.