North Logan, UT Map & Demographics
North Logan Map
North Logan Overview
$35,048
PER CAPITA INCOME
$97,920
AVG FAMILY INCOME
$80,597
AVG HOUSEHOLD INCOME
52.9%
WAGE / INCOME GAP [ % ]
47.1¢/ $1
WAGE / INCOME GAP [ $ ]
0.46
INEQUALITY / GINI INDEX
10,981
TOTAL POPULATION
5,530
MALE POPULATION
5,451
FEMALE POPULATION
101.45
MALES / 100 FEMALES
98.57
FEMALES / 100 MALES
27.6
MEDIAN AGE
3.5
AVG FAMILY SIZE
3.1
AVG HOUSEHOLD SIZE
5,631
LABOR FORCE [ PEOPLE ]
67.7%
PERCENT IN LABOR FORCE
2.2%
UNEMPLOYMENT RATE
North Logan Area Codes
Income in North Logan
Income Overview in North Logan
Per Capita Income in North Logan is $35,048, while median incomes of families and households are $97,920 and $80,597 respectively.
| Characteristic | Number | Measure |
| Per Capita Income | 10,981 | $35,048 |
| Median Family Income | 2,501 | $97,920 |
| Mean Family Income | 2,501 | $124,994 |
| Median Household Income | 3,546 | $80,597 |
| Mean Household Income | 3,546 | $107,502 |
| Income Deficit | 2,501 | $0 |
| Wage / Income Gap (%) | 10,981 | 52.88% |
| Wage / Income Gap ($) | 10,981 | 47.12¢ per $1 |
| Gini / Inequality Index | 10,981 | 0.46 |
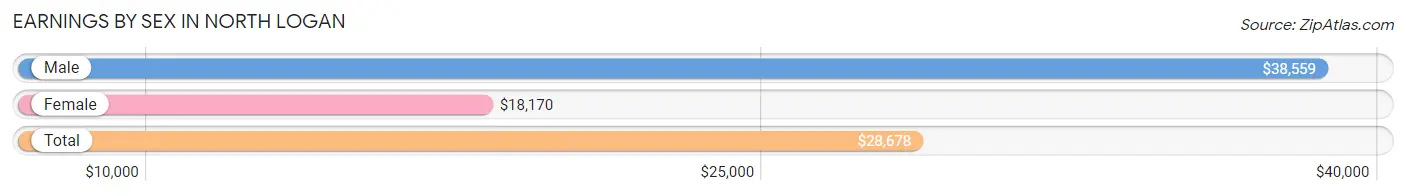
Earnings by Sex in North Logan
Average Earnings in North Logan are $28,678, $38,559 for men and $18,170 for women, a difference of 52.9%.
| Sex | Number | Average Earnings |
| Male | 3,462 (56.1%) | $38,559 |
| Female | 2,704 (43.9%) | $18,170 |
| Total | 6,166 (100.0%) | $28,678 |
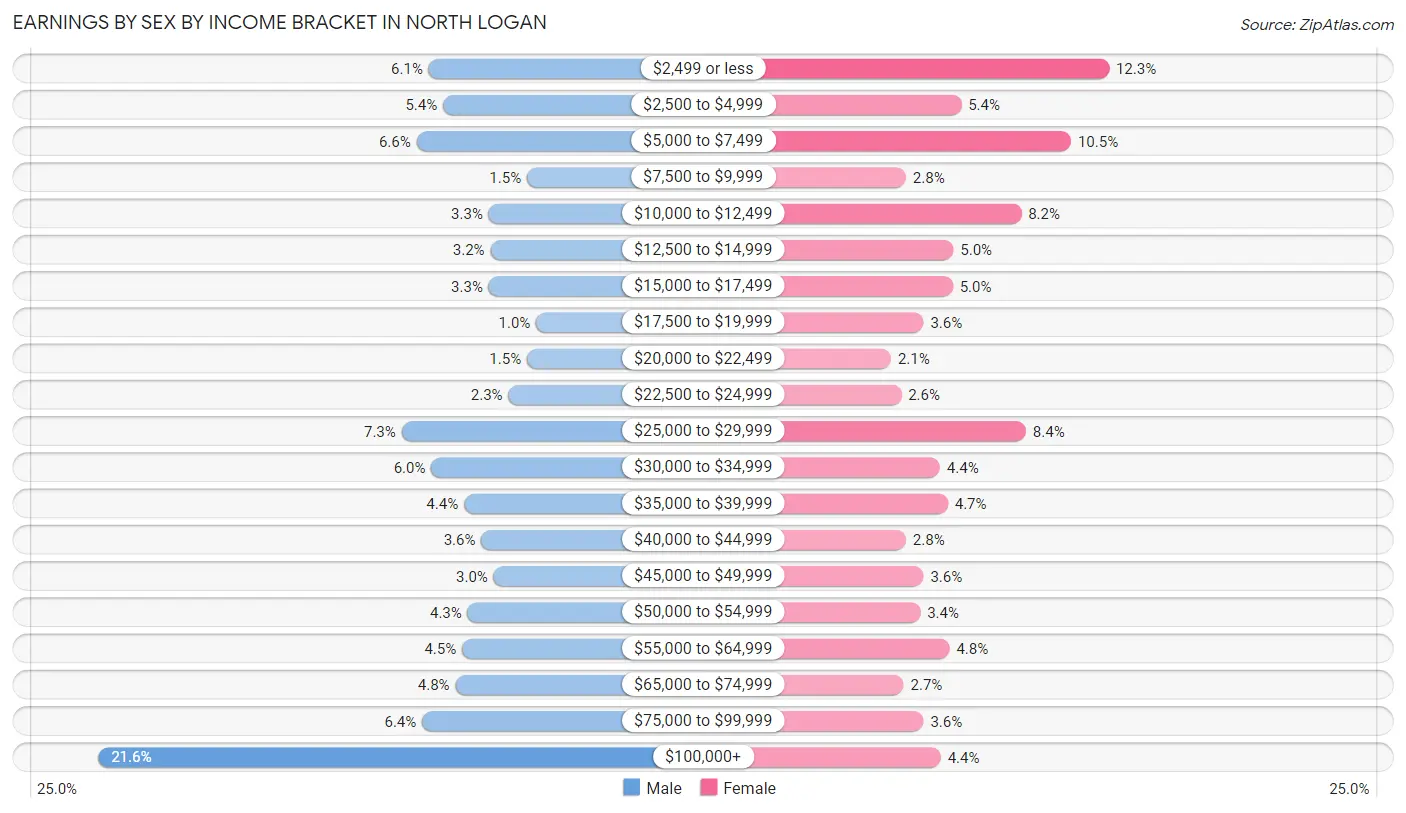
Earnings by Sex by Income Bracket in North Logan
The most common earnings brackets in North Logan are $100,000+ for men (746 | 21.5%) and $2,499 or less for women (332 | 12.3%).
| Income | Male | Female |
| $2,499 or less | 210 (6.1%) | 332 (12.3%) |
| $2,500 to $4,999 | 187 (5.4%) | 145 (5.4%) |
| $5,000 to $7,499 | 230 (6.6%) | 284 (10.5%) |
| $7,500 to $9,999 | 51 (1.5%) | 75 (2.8%) |
| $10,000 to $12,499 | 113 (3.3%) | 221 (8.2%) |
| $12,500 to $14,999 | 110 (3.2%) | 135 (5.0%) |
| $15,000 to $17,499 | 113 (3.3%) | 134 (5.0%) |
| $17,500 to $19,999 | 36 (1.0%) | 97 (3.6%) |
| $20,000 to $22,499 | 51 (1.5%) | 56 (2.1%) |
| $22,500 to $24,999 | 81 (2.3%) | 69 (2.5%) |
| $25,000 to $29,999 | 254 (7.3%) | 227 (8.4%) |
| $30,000 to $34,999 | 206 (5.9%) | 118 (4.4%) |
| $35,000 to $39,999 | 153 (4.4%) | 128 (4.7%) |
| $40,000 to $44,999 | 125 (3.6%) | 75 (2.8%) |
| $45,000 to $49,999 | 105 (3.0%) | 97 (3.6%) |
| $50,000 to $54,999 | 147 (4.3%) | 93 (3.4%) |
| $55,000 to $64,999 | 156 (4.5%) | 130 (4.8%) |
| $65,000 to $74,999 | 167 (4.8%) | 72 (2.7%) |
| $75,000 to $99,999 | 221 (6.4%) | 97 (3.6%) |
| $100,000+ | 746 (21.5%) | 119 (4.4%) |
| Total | 3,462 (100.0%) | 2,704 (100.0%) |
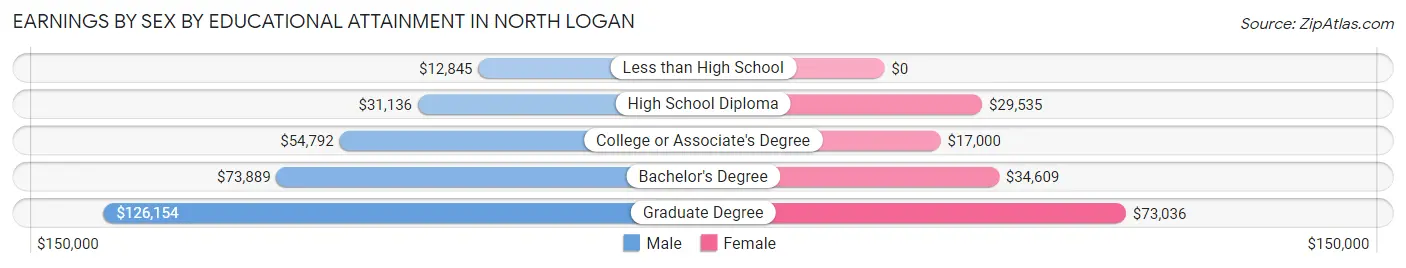
Earnings by Sex by Educational Attainment in North Logan
Average earnings in North Logan are $60,058 for men and $32,841 for women, a difference of 45.3%. Men with an educational attainment of graduate degree enjoy the highest average annual earnings of $126,154, while those with less than high school education earn the least with $12,845. Women with an educational attainment of graduate degree earn the most with the average annual earnings of $73,036, while those with college or associate's degree education have the smallest earnings of $17,000.
| Educational Attainment | Male Income | Female Income |
| Less than High School | $12,845 | $0 |
| High School Diploma | $31,136 | $29,535 |
| College or Associate's Degree | $54,792 | $17,000 |
| Bachelor's Degree | $73,889 | $34,609 |
| Graduate Degree | $126,154 | $73,036 |
| Total | $60,058 | $32,841 |
Family Income in North Logan
Family Income Brackets in North Logan
According to the North Logan family income data, there are 498 families falling into the $100,000 to $149,999 income range, which is the most common income bracket and makes up 19.9% of all families. Conversely, the $15,000 to $24,999 income bracket is the least frequent group with only 13 families (0.5%) belonging to this category.
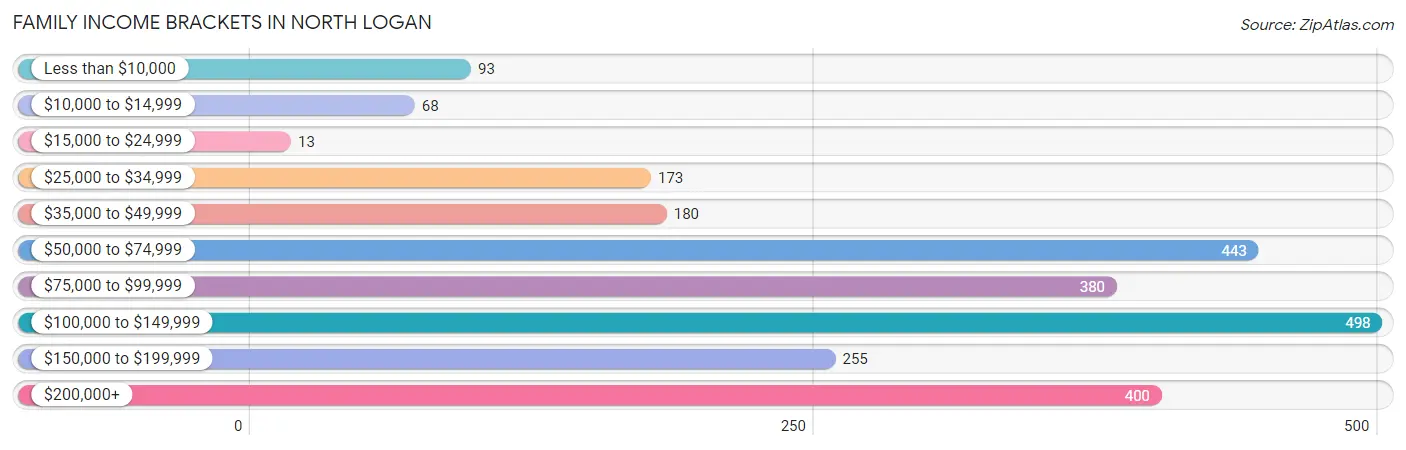
| Income Bracket | # Families | % Families |
| Less than $10,000 | 93 | 3.7% |
| $10,000 to $14,999 | 68 | 2.7% |
| $15,000 to $24,999 | 13 | 0.5% |
| $25,000 to $34,999 | 173 | 6.9% |
| $35,000 to $49,999 | 180 | 7.2% |
| $50,000 to $74,999 | 443 | 17.7% |
| $75,000 to $99,999 | 380 | 15.2% |
| $100,000 to $149,999 | 498 | 19.9% |
| $150,000 to $199,999 | 255 | 10.2% |
| $200,000+ | 400 | 16.0% |
Family Income by Famaliy Size in North Logan
5-person families (362 | 14.5%) account for the highest median family income in North Logan with $135,357 per family, while 2-person families (926 | 37.0%) have the highest median income of $37,136 per family member.
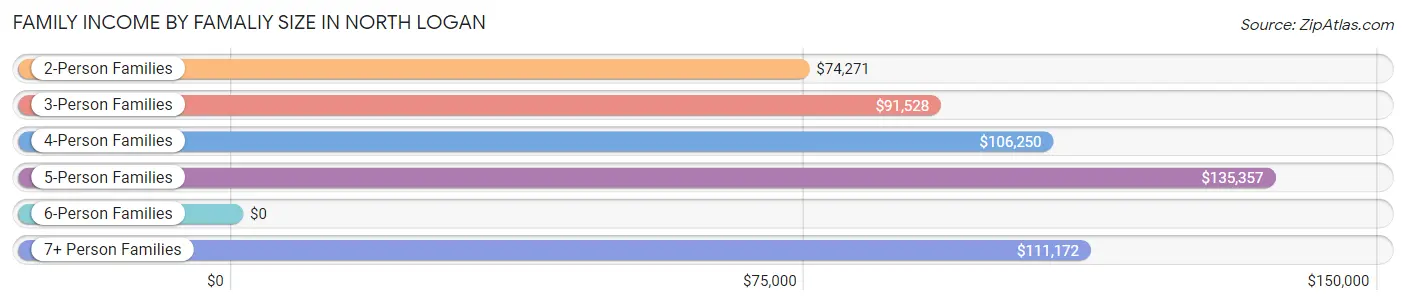
| Income Bracket | # Families | Median Income |
| 2-Person Families | 926 (37.0%) | $74,271 |
| 3-Person Families | 527 (21.1%) | $91,528 |
| 4-Person Families | 390 (15.6%) | $106,250 |
| 5-Person Families | 362 (14.5%) | $135,357 |
| 6-Person Families | 143 (5.7%) | $0 |
| 7+ Person Families | 153 (6.1%) | $111,172 |
| Total | 2,501 (100.0%) | $97,920 |
Family Income by Number of Earners in North Logan
The median family income in North Logan is $97,920, with families comprising 3+ earners (559) having the highest median family income of $121,103, while families with 1 earner (715) have the lowest median family income of $59,688, accounting for 22.4% and 28.6% of families, respectively.
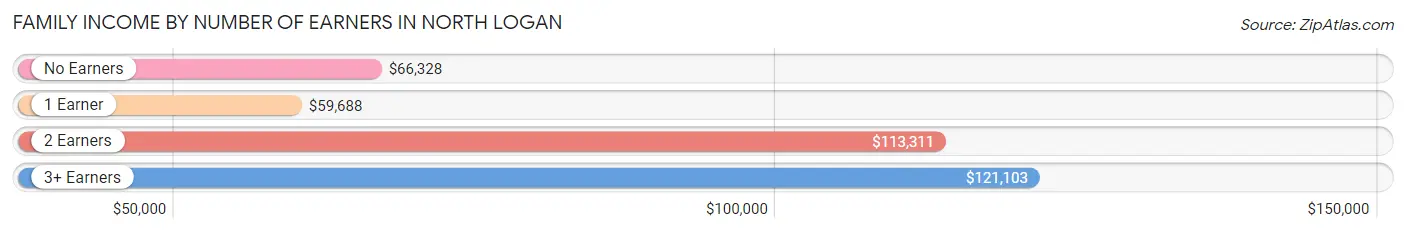
| Number of Earners | # Families | Median Income |
| No Earners | 245 (9.8%) | $66,328 |
| 1 Earner | 715 (28.6%) | $59,688 |
| 2 Earners | 982 (39.3%) | $113,311 |
| 3+ Earners | 559 (22.4%) | $121,103 |
| Total | 2,501 (100.0%) | $97,920 |
Household Income in North Logan
Household Income Brackets in North Logan
With 660 households falling in the category, the $100,000 to $149,999 income range is the most frequent in North Logan, accounting for 18.6% of all households. In contrast, only 60 households (1.7%) fall into the $10,000 to $14,999 income bracket, making it the least populous group.
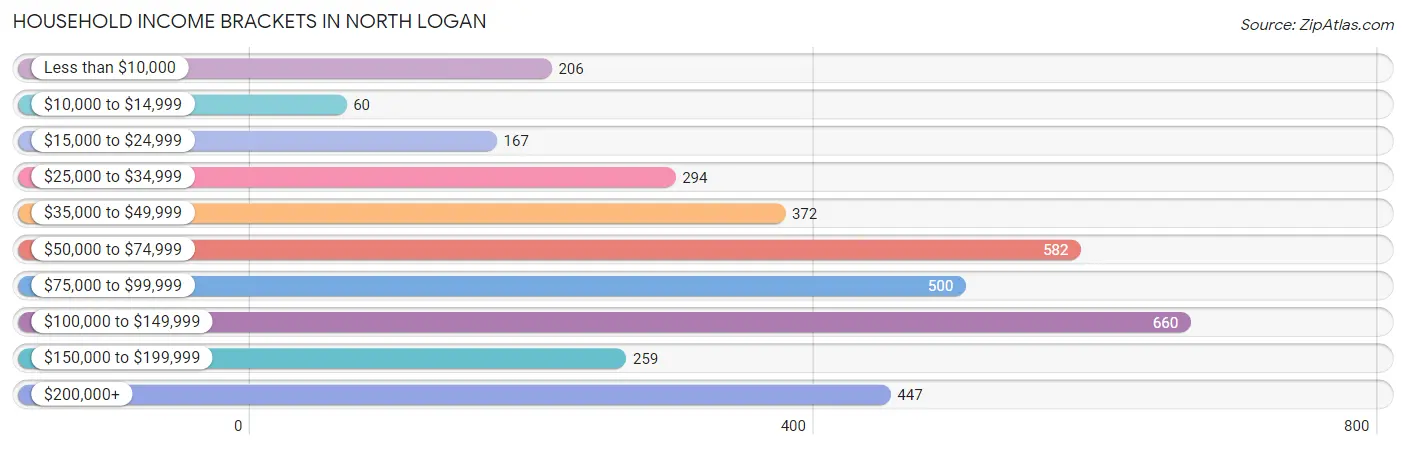
| Income Bracket | # Households | % Households |
| Less than $10,000 | 206 | 5.8% |
| $10,000 to $14,999 | 60 | 1.7% |
| $15,000 to $24,999 | 167 | 4.7% |
| $25,000 to $34,999 | 294 | 8.3% |
| $35,000 to $49,999 | 372 | 10.5% |
| $50,000 to $74,999 | 582 | 16.4% |
| $75,000 to $99,999 | 500 | 14.1% |
| $100,000 to $149,999 | 660 | 18.6% |
| $150,000 to $199,999 | 259 | 7.3% |
| $200,000+ | 447 | 12.6% |
Household Income by Householder Age in North Logan
The median household income in North Logan is $80,597, with the highest median household income of $113,083 found in the 45 to 64 years age bracket for the primary householder. A total of 1,117 households (31.5%) fall into this category. Meanwhile, the 15 to 24 years age bracket for the primary householder has the lowest median household income of $33,179, with 493 households (13.9%) in this group.
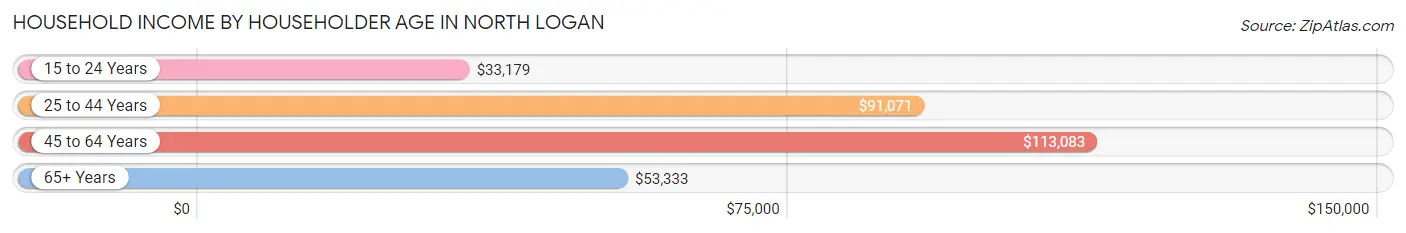
| Income Bracket | # Households | Median Income |
| 15 to 24 Years | 493 (13.9%) | $33,179 |
| 25 to 44 Years | 1,256 (35.4%) | $91,071 |
| 45 to 64 Years | 1,117 (31.5%) | $113,083 |
| 65+ Years | 680 (19.2%) | $53,333 |
| Total | 3,546 (100.0%) | $80,597 |
Poverty in North Logan
Income Below Poverty by Sex and Age in North Logan
With 13.5% poverty level for males and 17.5% for females among the residents of North Logan, under 5 year old males and 18 to 24 year old females are the most vulnerable to poverty, with 100 males (36.1%) and 398 females (47.5%) in their respective age groups living below the poverty level.
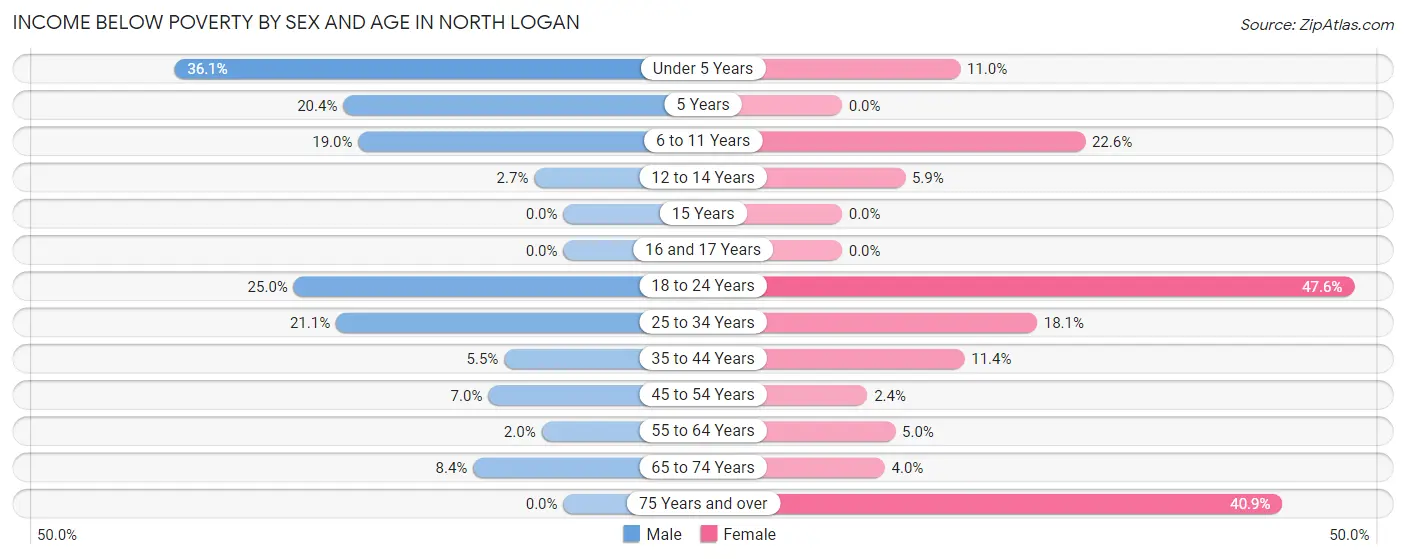
| Age Bracket | Male | Female |
| Under 5 Years | 100 (36.1%) | 44 (11.0%) |
| 5 Years | 19 (20.4%) | 0 (0.0%) |
| 6 to 11 Years | 98 (19.0%) | 116 (22.6%) |
| 12 to 14 Years | 9 (2.7%) | 16 (5.9%) |
| 15 Years | 0 (0.0%) | 0 (0.0%) |
| 16 and 17 Years | 0 (0.0%) | 0 (0.0%) |
| 18 to 24 Years | 250 (25.0%) | 398 (47.5%) |
| 25 to 34 Years | 157 (21.1%) | 128 (18.1%) |
| 35 to 44 Years | 38 (5.5%) | 69 (11.4%) |
| 45 to 54 Years | 43 (7.0%) | 11 (2.4%) |
| 55 to 64 Years | 10 (2.0%) | 26 (5.0%) |
| 65 to 74 Years | 18 (8.4%) | 15 (4.0%) |
| 75 Years and over | 0 (0.0%) | 112 (40.9%) |
| Total | 742 (13.5%) | 935 (17.5%) |
Income Above Poverty by Sex and Age in North Logan
According to the poverty statistics in North Logan, males aged 15 years and females aged 5 years are the age groups that are most secure financially, with 100.0% of males and 100.0% of females in these age groups living above the poverty line.
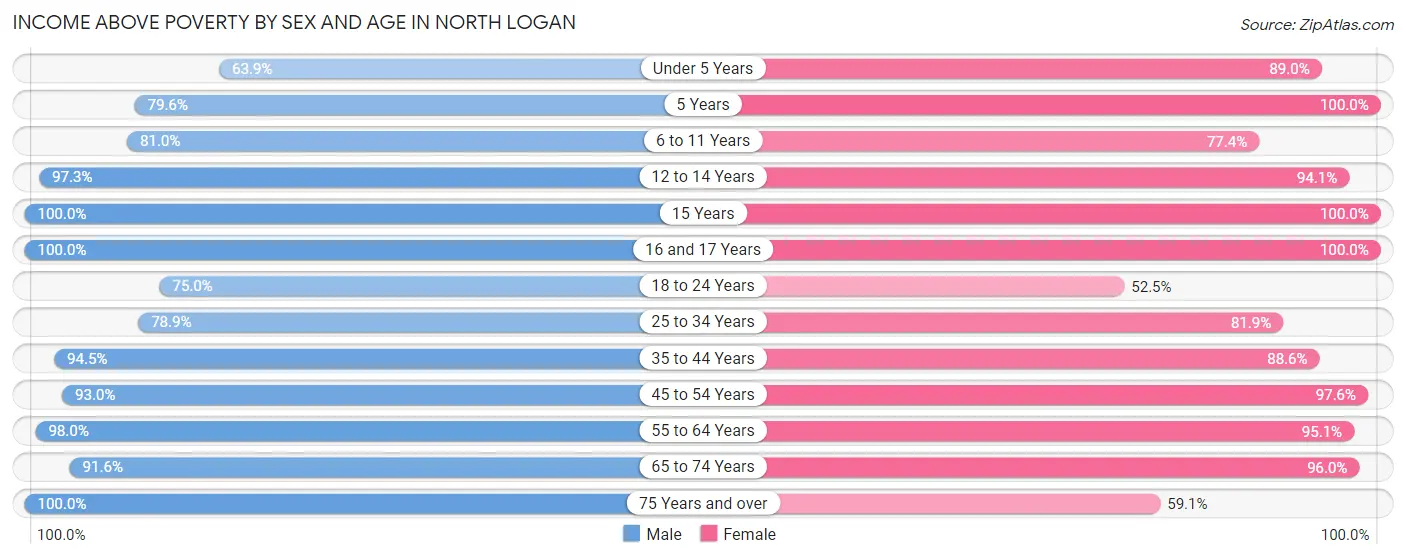
| Age Bracket | Male | Female |
| Under 5 Years | 177 (63.9%) | 357 (89.0%) |
| 5 Years | 74 (79.6%) | 67 (100.0%) |
| 6 to 11 Years | 417 (81.0%) | 398 (77.4%) |
| 12 to 14 Years | 324 (97.3%) | 257 (94.1%) |
| 15 Years | 88 (100.0%) | 99 (100.0%) |
| 16 and 17 Years | 243 (100.0%) | 199 (100.0%) |
| 18 to 24 Years | 749 (75.0%) | 439 (52.4%) |
| 25 to 34 Years | 587 (78.9%) | 579 (81.9%) |
| 35 to 44 Years | 654 (94.5%) | 538 (88.6%) |
| 45 to 54 Years | 574 (93.0%) | 455 (97.6%) |
| 55 to 64 Years | 482 (98.0%) | 499 (95.1%) |
| 65 to 74 Years | 197 (91.6%) | 363 (96.0%) |
| 75 Years and over | 196 (100.0%) | 162 (59.1%) |
| Total | 4,762 (86.5%) | 4,412 (82.5%) |
Income Below Poverty Among Married-Couple Families in North Logan
The poverty statistics for married-couple families in North Logan show that 5.4% or 104 of the total 1,942 families live below the poverty line. Families with 5 or more children have the highest poverty rate of 9.6%, comprising of 9 families. On the other hand, families with no children have the lowest poverty rate of 1.8%, which includes 16 families.
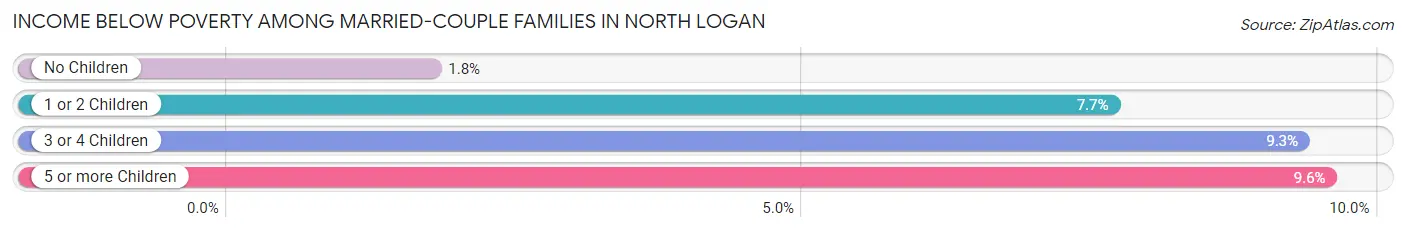
| Children | Above Poverty | Below Poverty |
| No Children | 886 (98.2%) | 16 (1.8%) |
| 1 or 2 Children | 517 (92.3%) | 43 (7.7%) |
| 3 or 4 Children | 350 (90.7%) | 36 (9.3%) |
| 5 or more Children | 85 (90.4%) | 9 (9.6%) |
| Total | 1,838 (94.6%) | 104 (5.4%) |
Income Below Poverty Among Single-Parent Households in North Logan
According to the poverty data in North Logan, 10.1% or 22 single-father households and 26.9% or 92 single-mother households are living below the poverty line. Among single-father households, those with no children have the highest poverty rate, with 22 households (22.7%) experiencing poverty. Likewise, among single-mother households, those with 3 or 4 children have the highest poverty rate, with 21 households (42.0%) falling below the poverty line.
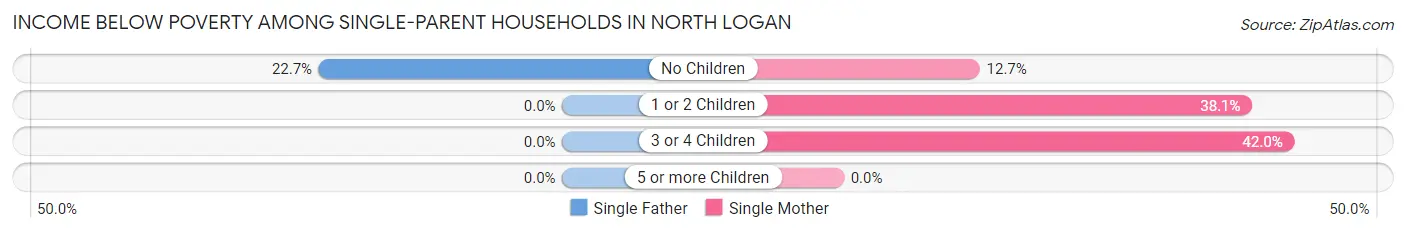
| Children | Single Father | Single Mother |
| No Children | 22 (22.7%) | 20 (12.7%) |
| 1 or 2 Children | 0 (0.0%) | 51 (38.1%) |
| 3 or 4 Children | 0 (0.0%) | 21 (42.0%) |
| 5 or more Children | 0 (0.0%) | 0 (0.0%) |
| Total | 22 (10.1%) | 92 (26.9%) |
Income Below Poverty Among Married-Couple vs Single-Parent Households in North Logan
The poverty data for North Logan shows that 104 of the married-couple family households (5.4%) and 114 of the single-parent households (20.4%) are living below the poverty level. Within the married-couple family households, those with 5 or more children have the highest poverty rate, with 9 households (9.6%) falling below the poverty line. Among the single-parent households, those with 3 or 4 children have the highest poverty rate, with 21 household (42.0%) living below poverty.
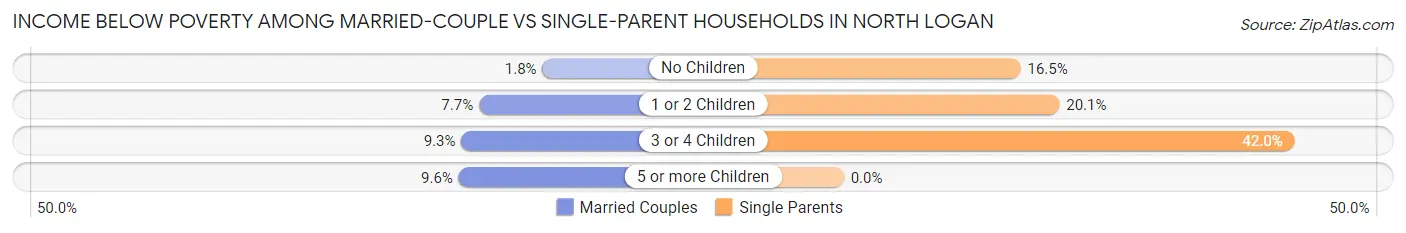
| Children | Married-Couple Families | Single-Parent Households |
| No Children | 16 (1.8%) | 42 (16.5%) |
| 1 or 2 Children | 43 (7.7%) | 51 (20.1%) |
| 3 or 4 Children | 36 (9.3%) | 21 (42.0%) |
| 5 or more Children | 9 (9.6%) | 0 (0.0%) |
| Total | 104 (5.4%) | 114 (20.4%) |
Race in North Logan
The most populous races in North Logan are White / Caucasian (9,210 | 83.9%), Hispanic or Latino (1,179 | 10.7%), and Two or more Races (882 | 8.0%).
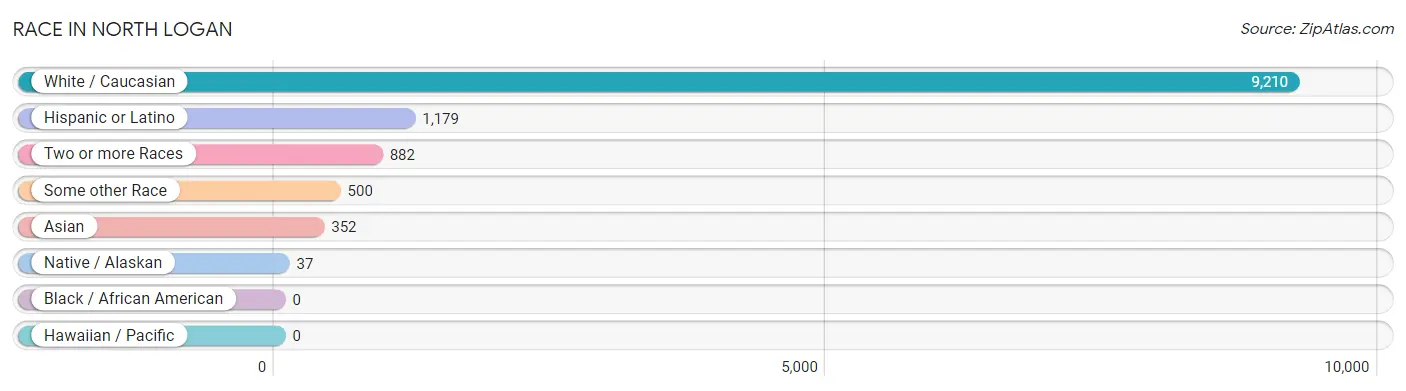
| Race | # Population | % Population |
| Asian | 352 | 3.2% |
| Black / African American | 0 | 0.0% |
| Hawaiian / Pacific | 0 | 0.0% |
| Hispanic or Latino | 1,179 | 10.7% |
| Native / Alaskan | 37 | 0.3% |
| White / Caucasian | 9,210 | 83.9% |
| Two or more Races | 882 | 8.0% |
| Some other Race | 500 | 4.5% |
| Total | 10,981 | 100.0% |
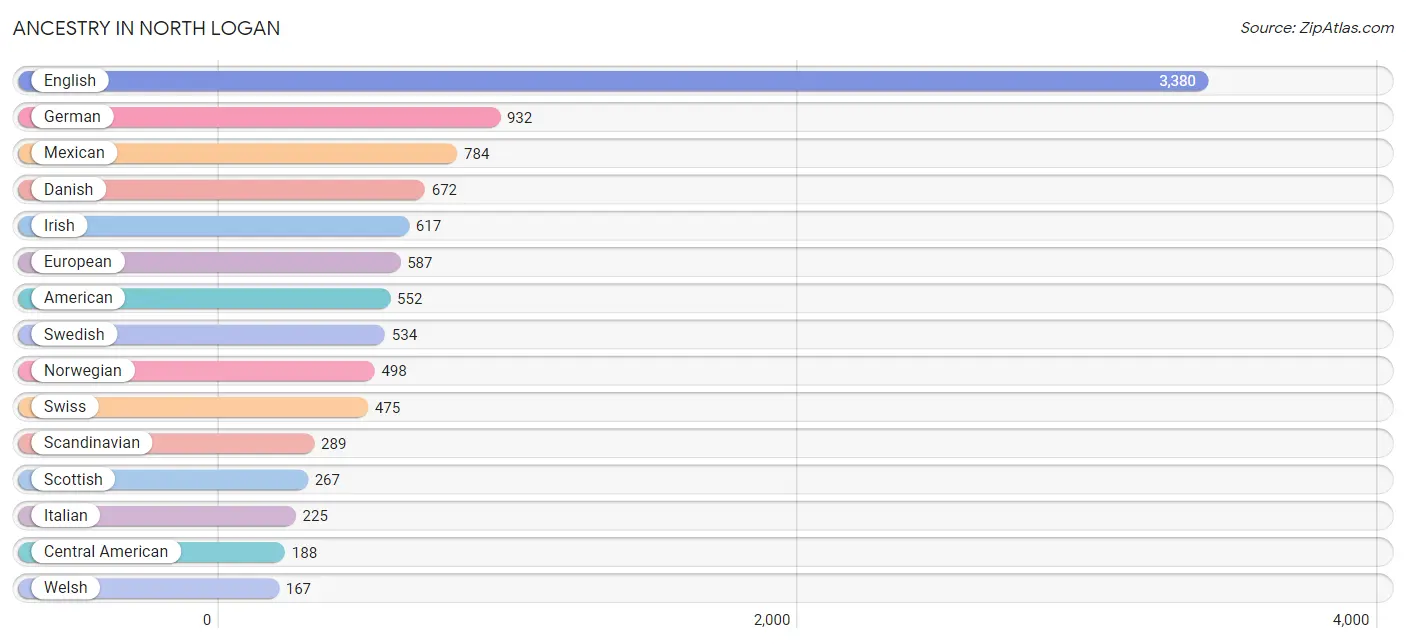
Ancestry in North Logan
The most populous ancestries reported in North Logan are English (3,380 | 30.8%), German (932 | 8.5%), Mexican (784 | 7.1%), Danish (672 | 6.1%), and Irish (617 | 5.6%), together accounting for 58.2% of all North Logan residents.
| Ancestry | # Population | % Population |
| American | 552 | 5.0% |
| Arab | 112 | 1.0% |
| Austrian | 37 | 0.3% |
| Bhutanese | 84 | 0.8% |
| Blackfeet | 22 | 0.2% |
| British | 112 | 1.0% |
| Burmese | 106 | 1.0% |
| Celtic | 13 | 0.1% |
| Central American | 188 | 1.7% |
| Chilean | 19 | 0.2% |
| Choctaw | 62 | 0.6% |
| Comanche | 9 | 0.1% |
| Czech | 11 | 0.1% |
| Danish | 672 | 6.1% |
| Dutch | 124 | 1.1% |
| Eastern European | 11 | 0.1% |
| English | 3,380 | 30.8% |
| European | 587 | 5.3% |
| French | 124 | 1.1% |
| French Canadian | 9 | 0.1% |
| German | 932 | 8.5% |
| German Russian | 8 | 0.1% |
| Greek | 31 | 0.3% |
| Guatemalan | 25 | 0.2% |
| Hungarian | 18 | 0.2% |
| Indian (Asian) | 150 | 1.4% |
| Iranian | 61 | 0.6% |
| Irish | 617 | 5.6% |
| Israeli | 14 | 0.1% |
| Italian | 225 | 2.1% |
| Japanese | 123 | 1.1% |
| Korean | 84 | 0.8% |
| Mexican | 784 | 7.1% |
| Mexican American Indian | 6 | 0.1% |
| Native Hawaiian | 25 | 0.2% |
| Navajo | 39 | 0.4% |
| Northern European | 131 | 1.2% |
| Norwegian | 498 | 4.5% |
| Pakistani | 14 | 0.1% |
| Palestinian | 9 | 0.1% |
| Polish | 29 | 0.3% |
| Portuguese | 12 | 0.1% |
| Puerto Rican | 111 | 1.0% |
| Romanian | 39 | 0.4% |
| Russian | 15 | 0.1% |
| Salvadoran | 163 | 1.5% |
| Scandinavian | 289 | 2.6% |
| Scotch-Irish | 44 | 0.4% |
| Scottish | 267 | 2.4% |
| Shoshone | 11 | 0.1% |
| Sioux | 5 | 0.1% |
| Slovak | 26 | 0.2% |
| South American | 19 | 0.2% |
| Spanish | 51 | 0.5% |
| Swedish | 534 | 4.9% |
| Swiss | 475 | 4.3% |
| Welsh | 167 | 1.5% | View All 57 Rows |
Immigrants in North Logan
The most numerous immigrant groups reported in North Logan came from Latin America (465 | 4.2%), Asia (381 | 3.5%), Central America (363 | 3.3%), Mexico (235 | 2.1%), and South Eastern Asia (177 | 1.6%), together accounting for 14.8% of all North Logan residents.
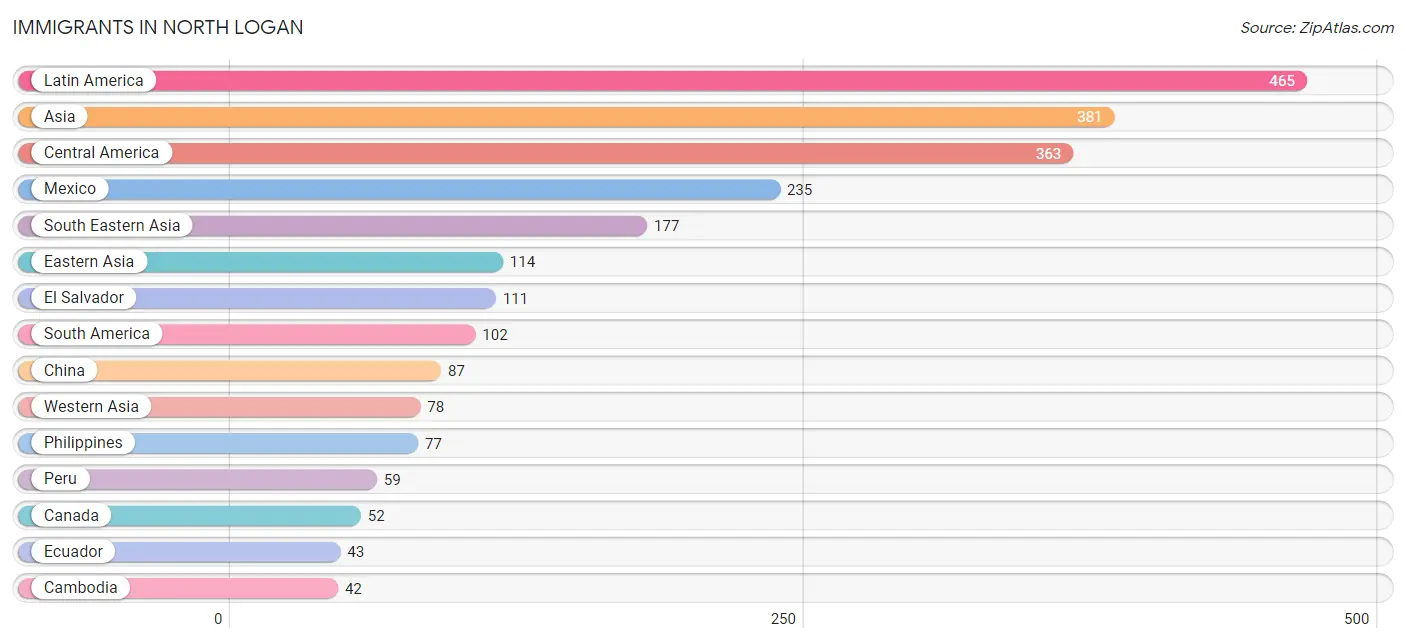
| Immigration Origin | # Population | % Population |
| Asia | 381 | 3.5% |
| Cambodia | 42 | 0.4% |
| Canada | 52 | 0.5% |
| Central America | 363 | 3.3% |
| China | 87 | 0.8% |
| Czechoslovakia | 11 | 0.1% |
| Eastern Asia | 114 | 1.0% |
| Eastern Europe | 11 | 0.1% |
| Ecuador | 43 | 0.4% |
| El Salvador | 111 | 1.0% |
| Europe | 33 | 0.3% |
| Germany | 8 | 0.1% |
| Guatemala | 17 | 0.2% |
| Hong Kong | 12 | 0.1% |
| India | 12 | 0.1% |
| Indonesia | 19 | 0.2% |
| Israel | 14 | 0.1% |
| Italy | 6 | 0.1% |
| Korea | 27 | 0.3% |
| Kuwait | 38 | 0.4% |
| Latin America | 465 | 4.2% |
| Mexico | 235 | 2.1% |
| Northern Europe | 8 | 0.1% |
| Peru | 59 | 0.5% |
| Philippines | 77 | 0.7% |
| South America | 102 | 0.9% |
| South Central Asia | 12 | 0.1% |
| South Eastern Asia | 177 | 1.6% |
| Southern Europe | 6 | 0.1% |
| Thailand | 39 | 0.4% |
| Western Asia | 78 | 0.7% |
| Western Europe | 8 | 0.1% | View All 32 Rows |
Sex and Age in North Logan
Sex and Age in North Logan
The most populous age groups in North Logan are 20 to 24 Years (742 | 13.4%) for men and 20 to 24 Years (734 | 13.5%) for women.
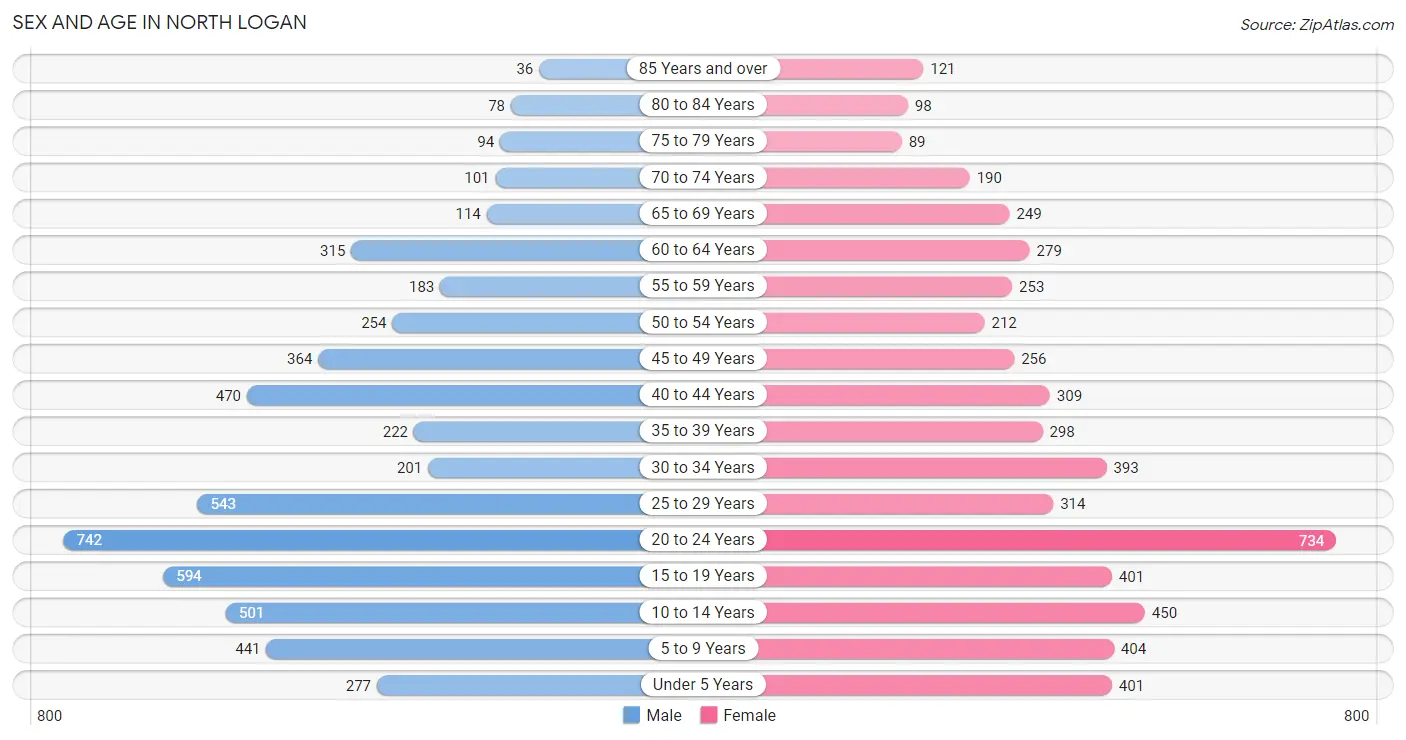
| Age Bracket | Male | Female |
| Under 5 Years | 277 (5.0%) | 401 (7.4%) |
| 5 to 9 Years | 441 (8.0%) | 404 (7.4%) |
| 10 to 14 Years | 501 (9.1%) | 450 (8.3%) |
| 15 to 19 Years | 594 (10.7%) | 401 (7.4%) |
| 20 to 24 Years | 742 (13.4%) | 734 (13.5%) |
| 25 to 29 Years | 543 (9.8%) | 314 (5.8%) |
| 30 to 34 Years | 201 (3.6%) | 393 (7.2%) |
| 35 to 39 Years | 222 (4.0%) | 298 (5.5%) |
| 40 to 44 Years | 470 (8.5%) | 309 (5.7%) |
| 45 to 49 Years | 364 (6.6%) | 256 (4.7%) |
| 50 to 54 Years | 254 (4.6%) | 212 (3.9%) |
| 55 to 59 Years | 183 (3.3%) | 253 (4.6%) |
| 60 to 64 Years | 315 (5.7%) | 279 (5.1%) |
| 65 to 69 Years | 114 (2.1%) | 249 (4.6%) |
| 70 to 74 Years | 101 (1.8%) | 190 (3.5%) |
| 75 to 79 Years | 94 (1.7%) | 89 (1.6%) |
| 80 to 84 Years | 78 (1.4%) | 98 (1.8%) |
| 85 Years and over | 36 (0.6%) | 121 (2.2%) |
| Total | 5,530 (100.0%) | 5,451 (100.0%) |
Families and Households in North Logan
Median Family Size in North Logan
The median family size in North Logan is 3.49 persons per family, with married-couple families (1,942 | 77.6%) accounting for the largest median family size of 3.73 persons per family. On the other hand, single male/father families (217 | 8.7%) represent the smallest median family size with 2.39 persons per family.
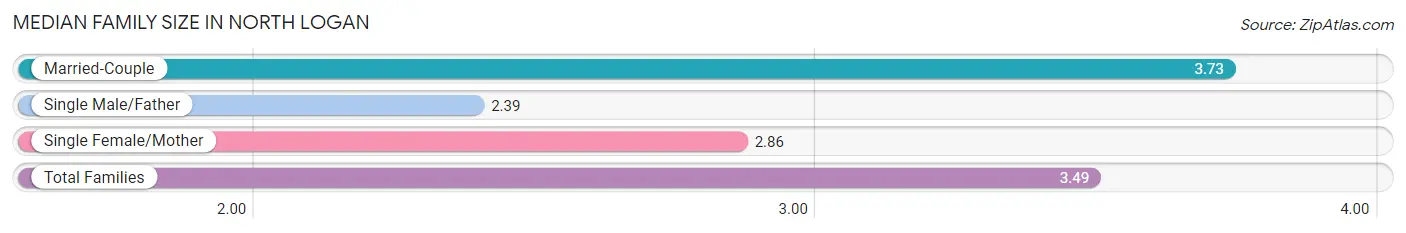
| Family Type | # Families | Family Size |
| Married-Couple | 1,942 (77.6%) | 3.73 |
| Single Male/Father | 217 (8.7%) | 2.39 |
| Single Female/Mother | 342 (13.7%) | 2.86 |
| Total Families | 2,501 (100.0%) | 3.49 |
Median Household Size in North Logan
The median household size in North Logan is 3.06 persons per household, with married-couple households (1,942 | 54.8%) accounting for the largest median household size of 3.76 persons per household. non-family households (1,045 | 29.5%) represent the smallest median household size with 1.75 persons per household.
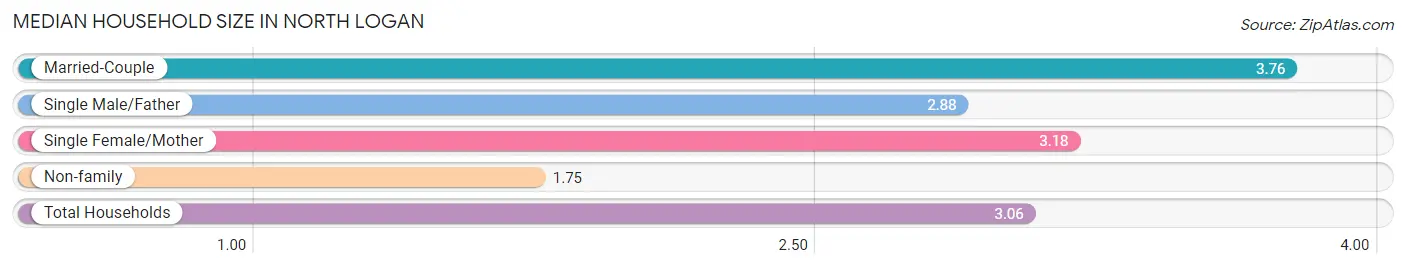
| Household Type | # Households | Household Size |
| Married-Couple | 1,942 (54.8%) | 3.76 |
| Single Male/Father | 217 (6.1%) | 2.88 |
| Single Female/Mother | 342 (9.6%) | 3.18 |
| Non-family | 1,045 (29.5%) | 1.75 |
| Total Households | 3,546 (100.0%) | 3.06 |
Household Size by Marriage Status in North Logan
Out of a total of 3,546 households in North Logan, 2,501 (70.5%) are family households, while 1,045 (29.5%) are nonfamily households. The most numerous type of family households are 2-person households, comprising 848, and the most common type of nonfamily households are 1-person households, comprising 612.
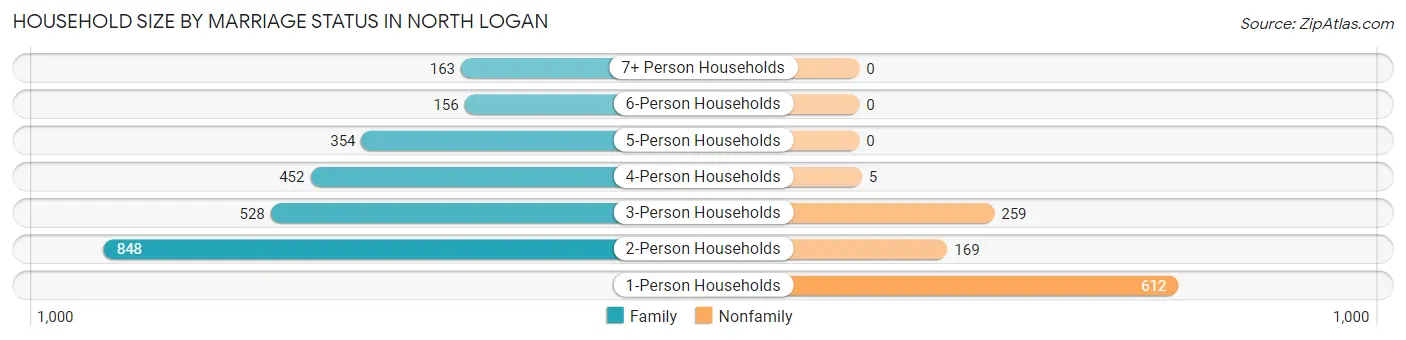
| Household Size | Family Households | Nonfamily Households |
| 1-Person Households | - | 612 (17.3%) |
| 2-Person Households | 848 (23.9%) | 169 (4.8%) |
| 3-Person Households | 528 (14.9%) | 259 (7.3%) |
| 4-Person Households | 452 (12.8%) | 5 (0.1%) |
| 5-Person Households | 354 (10.0%) | 0 (0.0%) |
| 6-Person Households | 156 (4.4%) | 0 (0.0%) |
| 7+ Person Households | 163 (4.6%) | 0 (0.0%) |
| Total | 2,501 (70.5%) | 1,045 (29.5%) |
Female Fertility in North Logan
Fertility by Age in North Logan
Average fertility rate in North Logan is 42.0 births per 1,000 women. Women in the age bracket of 20 to 34 years have the highest fertility rate with 67.0 births per 1,000 women. Women in the age bracket of 20 to 34 years acount for 83.6% of all women with births.
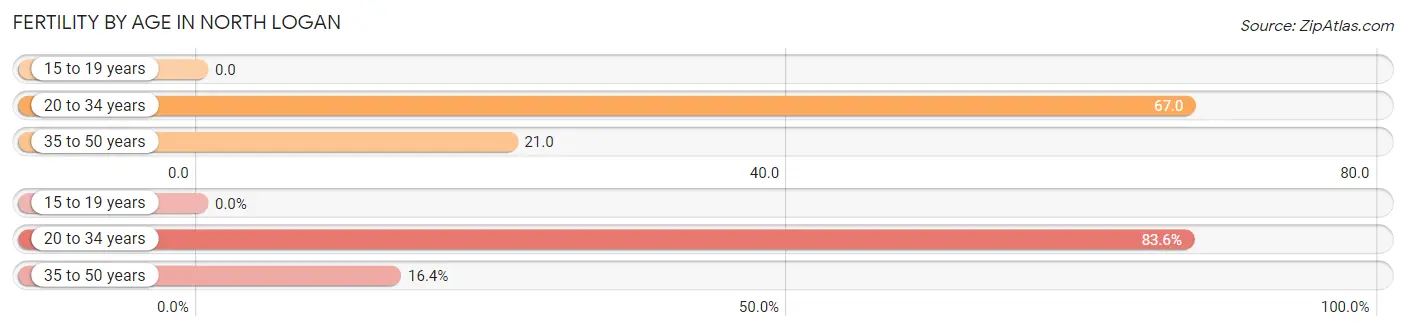
| Age Bracket | Women with Births | Births / 1,000 Women |
| 15 to 19 years | 0 (0.0%) | 0.0 |
| 20 to 34 years | 97 (83.6%) | 67.0 |
| 35 to 50 years | 19 (16.4%) | 21.0 |
| Total | 116 (100.0%) | 42.0 |
Fertility by Age by Marriage Status in North Logan
81.9% of women with births (116) in North Logan are married. The highest percentage of unmarried women with births falls into 20 to 34 years age bracket with 21.6% of them unmarried at the time of birth, while the lowest percentage of unmarried women with births belong to 35 to 50 years age bracket with 0.0% of them unmarried.
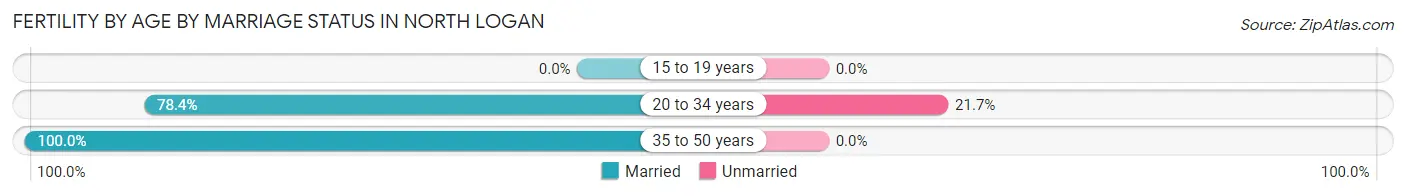
| Age Bracket | Married | Unmarried |
| 15 to 19 years | 0 (0.0%) | 0 (0.0%) |
| 20 to 34 years | 76 (78.3%) | 21 (21.6%) |
| 35 to 50 years | 19 (100.0%) | 0 (0.0%) |
| Total | 95 (81.9%) | 21 (18.1%) |
Fertility by Education in North Logan
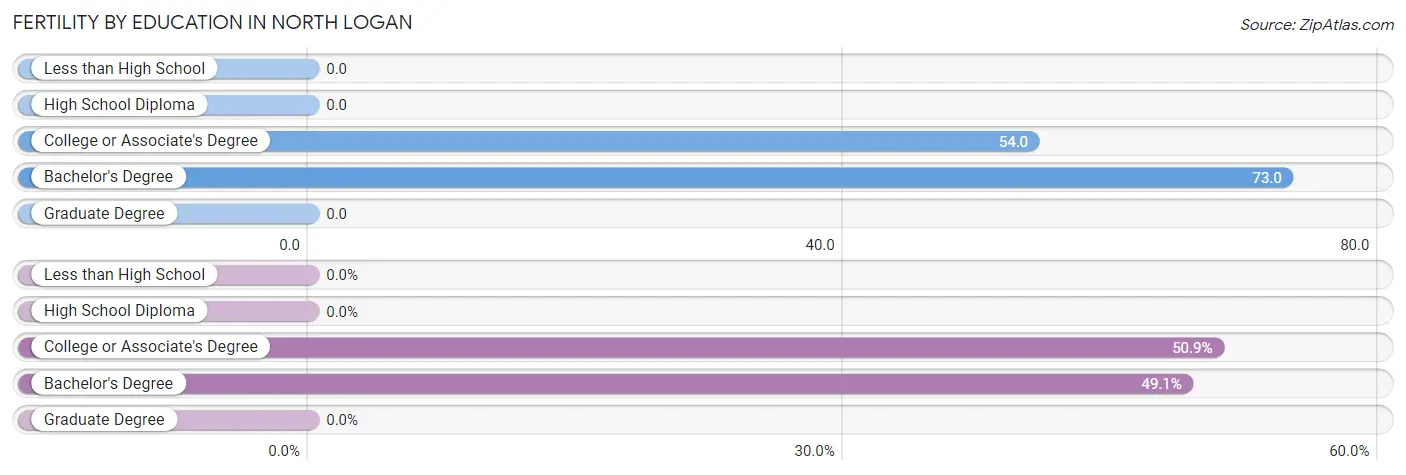
| Educational Attainment | Women with Births | Births / 1,000 Women |
| Less than High School | 0 (0.0%) | 0.0 |
| High School Diploma | 0 (0.0%) | 0.0 |
| College or Associate's Degree | 59 (50.9%) | 54.0 |
| Bachelor's Degree | 57 (49.1%) | 73.0 |
| Graduate Degree | 0 (0.0%) | 0.0 |
| Total | 116 (100.0%) | 42.0 |
Fertility by Education by Marriage Status in North Logan
18.1% of women with births in North Logan are unmarried. Women with the educational attainment of college or associate's degree are most likely to be married with 100.0% of them married at childbirth, while women with the educational attainment of bachelor's degree are least likely to be married with 36.8% of them unmarried at childbirth.

| Educational Attainment | Married | Unmarried |
| Less than High School | 0 (0.0%) | 0 (0.0%) |
| High School Diploma | 0 (0.0%) | 0 (0.0%) |
| College or Associate's Degree | 59 (100.0%) | 0 (0.0%) |
| Bachelor's Degree | 36 (63.2%) | 21 (36.8%) |
| Graduate Degree | 0 (0.0%) | 0 (0.0%) |
| Total | 95 (81.9%) | 21 (18.1%) |
Employment Characteristics in North Logan
Employment by Class of Employer in North Logan
Among the 5,449 employed individuals in North Logan, private company employees (3,508 | 64.4%), state government employees (586 | 10.7%), and local government employees (476 | 8.7%) make up the most common classes of employment.
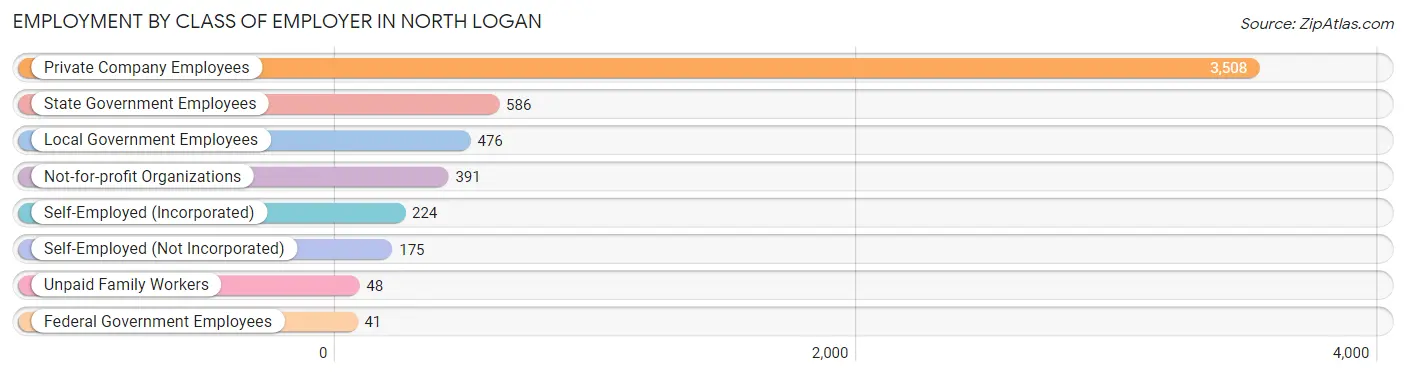
| Employer Class | # Employees | % Employees |
| Private Company Employees | 3,508 | 64.4% |
| Self-Employed (Incorporated) | 224 | 4.1% |
| Self-Employed (Not Incorporated) | 175 | 3.2% |
| Not-for-profit Organizations | 391 | 7.2% |
| Local Government Employees | 476 | 8.7% |
| State Government Employees | 586 | 10.7% |
| Federal Government Employees | 41 | 0.7% |
| Unpaid Family Workers | 48 | 0.9% |
| Total | 5,449 | 100.0% |
Employment Status by Age in North Logan
According to the labor force statistics for North Logan, out of the total population over 16 years of age (8,317), 67.7% or 5,631 individuals are in the labor force, with 2.2% or 124 of them unemployed. The age group with the highest labor force participation rate is 20 to 24 years, with 87.1% or 1,286 individuals in the labor force. Within the labor force, the 20 to 24 years age range has the highest percentage of unemployed individuals, with 6.0% or 77 of them being unemployed.
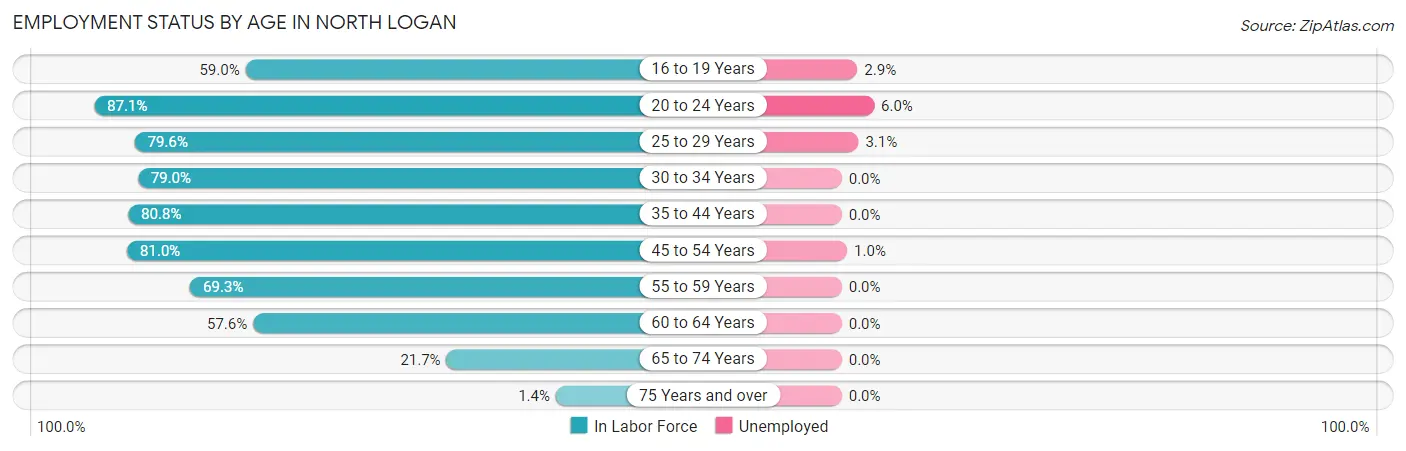
| Age Bracket | In Labor Force | Unemployed |
| 16 to 19 Years | 475 (59.0%) | 14 (2.9%) |
| 20 to 24 Years | 1,286 (87.1%) | 77 (6.0%) |
| 25 to 29 Years | 682 (79.6%) | 21 (3.1%) |
| 30 to 34 Years | 469 (79.0%) | 0 (0.0%) |
| 35 to 44 Years | 1,050 (80.8%) | 0 (0.0%) |
| 45 to 54 Years | 880 (81.0%) | 9 (1.0%) |
| 55 to 59 Years | 302 (69.3%) | 0 (0.0%) |
| 60 to 64 Years | 342 (57.6%) | 0 (0.0%) |
| 65 to 74 Years | 142 (21.7%) | 0 (0.0%) |
| 75 Years and over | 7 (1.4%) | 0 (0.0%) |
| Total | 5,631 (67.7%) | 124 (2.2%) |
Employment Status by Educational Attainment in North Logan
According to labor force statistics for North Logan, 76.5% of individuals (3,722) out of the total population between 25 and 64 years of age (4,866) are in the labor force, with 0.8% or 30 of them being unemployed. The group with the highest labor force participation rate are those with the educational attainment of less than high school, with 85.4% or 123 individuals in the labor force. Within the labor force, individuals with less than high school education have the highest percentage of unemployment, with 7.3% or 9 of them being unemployed.
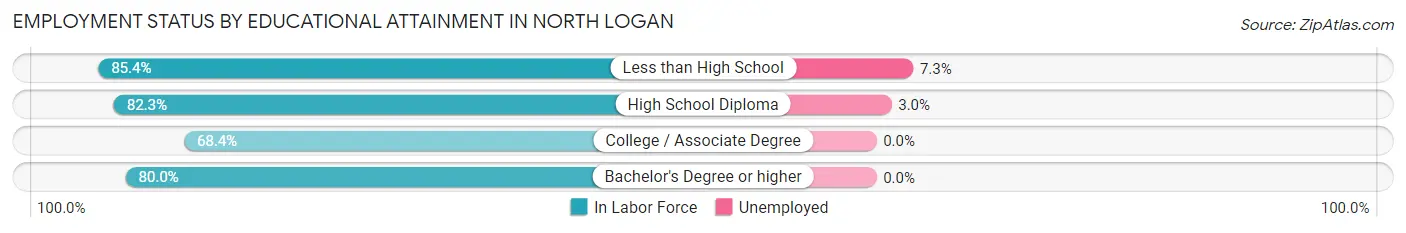
| Educational Attainment | In Labor Force | Unemployed |
| Less than High School | 123 (85.4%) | 11 (7.3%) |
| High School Diploma | 710 (82.3%) | 26 (3.0%) |
| College / Associate Degree | 1,148 (68.4%) | 0 (0.0%) |
| Bachelor's Degree or higher | 1,744 (80.0%) | 0 (0.0%) |
| Total | 3,722 (76.5%) | 39 (0.8%) |
Employment Occupations by Sex in North Logan
Management, Business, Science and Arts Occupations
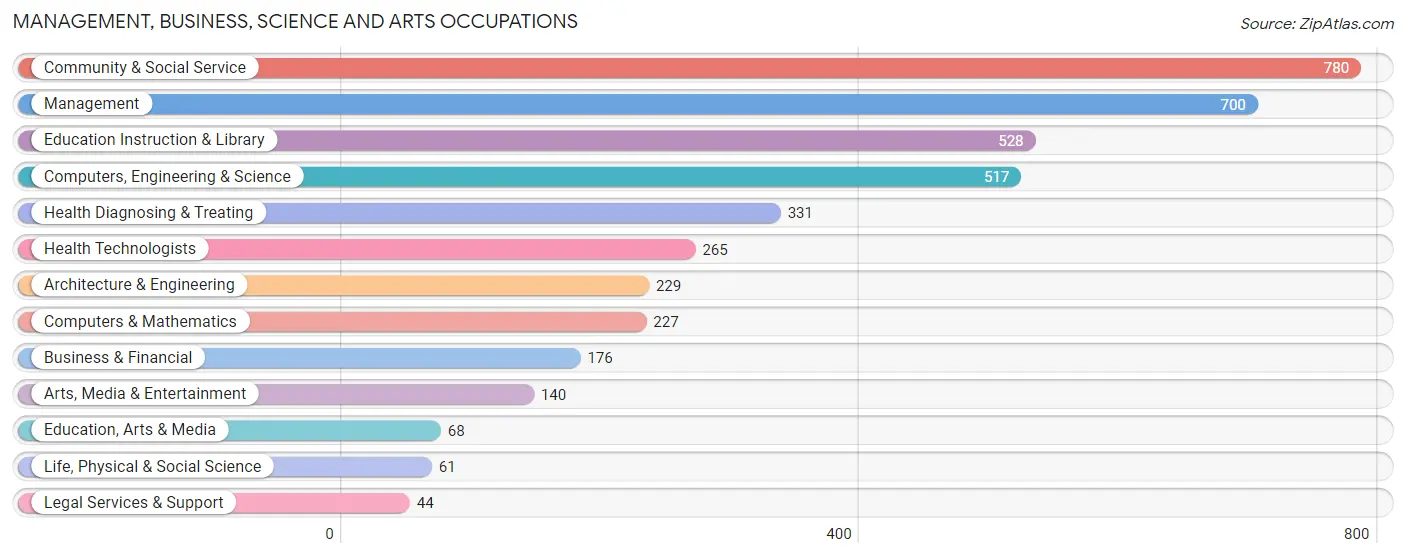
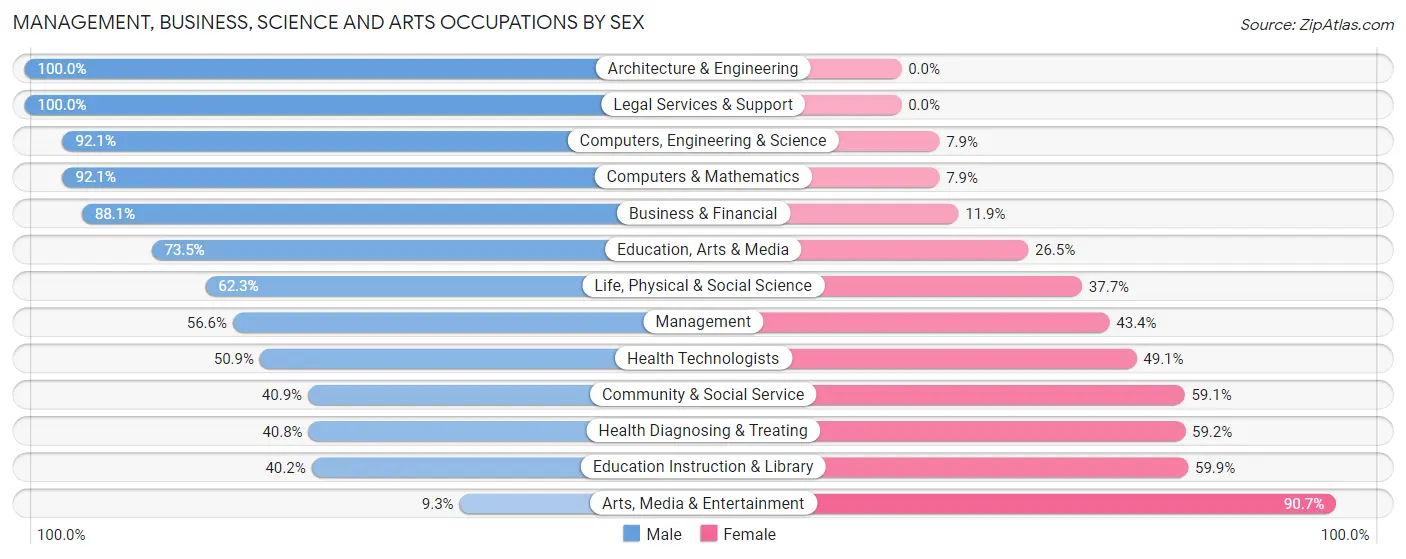
The most common Management, Business, Science and Arts occupations in North Logan are Community & Social Service (780 | 14.2%), Management (700 | 12.7%), Education Instruction & Library (528 | 9.6%), Computers, Engineering & Science (517 | 9.4%), and Health Diagnosing & Treating (331 | 6.0%).
Management, Business, Science and Arts Occupations by Sex
Within the Management, Business, Science and Arts occupations in North Logan, the most male-oriented occupations are Architecture & Engineering (100.0%), Legal Services & Support (100.0%), and Computers, Engineering & Science (92.1%), while the most female-oriented occupations are Arts, Media & Entertainment (90.7%), Education Instruction & Library (59.9%), and Health Diagnosing & Treating (59.2%).
| Occupation | Male | Female |
| Management | 396 (56.6%) | 304 (43.4%) |
| Business & Financial | 155 (88.1%) | 21 (11.9%) |
| Computers, Engineering & Science | 476 (92.1%) | 41 (7.9%) |
| Computers & Mathematics | 209 (92.1%) | 18 (7.9%) |
| Architecture & Engineering | 229 (100.0%) | 0 (0.0%) |
| Life, Physical & Social Science | 38 (62.3%) | 23 (37.7%) |
| Community & Social Service | 319 (40.9%) | 461 (59.1%) |
| Education, Arts & Media | 50 (73.5%) | 18 (26.5%) |
| Legal Services & Support | 44 (100.0%) | 0 (0.0%) |
| Education Instruction & Library | 212 (40.2%) | 316 (59.9%) |
| Arts, Media & Entertainment | 13 (9.3%) | 127 (90.7%) |
| Health Diagnosing & Treating | 135 (40.8%) | 196 (59.2%) |
| Health Technologists | 135 (50.9%) | 130 (49.1%) |
| Total (Category) | 1,481 (59.2%) | 1,023 (40.8%) |
| Total (Overall) | 3,072 (55.8%) | 2,430 (44.2%) |
Services Occupations
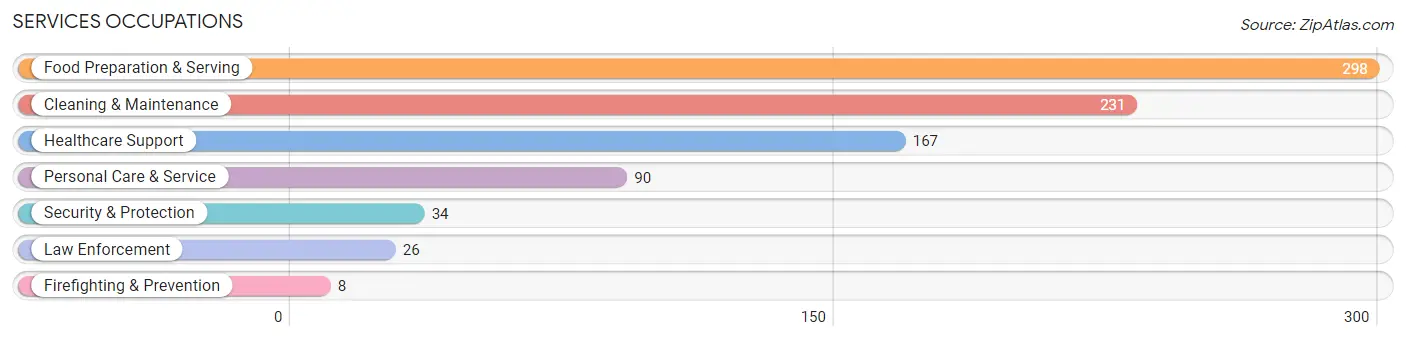
The most common Services occupations in North Logan are Food Preparation & Serving (298 | 5.4%), Cleaning & Maintenance (231 | 4.2%), Healthcare Support (167 | 3.0%), Personal Care & Service (90 | 1.6%), and Security & Protection (34 | 0.6%).
Services Occupations by Sex
Within the Services occupations in North Logan, the most male-oriented occupations are Security & Protection (100.0%), Firefighting & Prevention (100.0%), and Law Enforcement (100.0%), while the most female-oriented occupations are Healthcare Support (79.0%), Personal Care & Service (72.2%), and Food Preparation & Serving (62.7%).
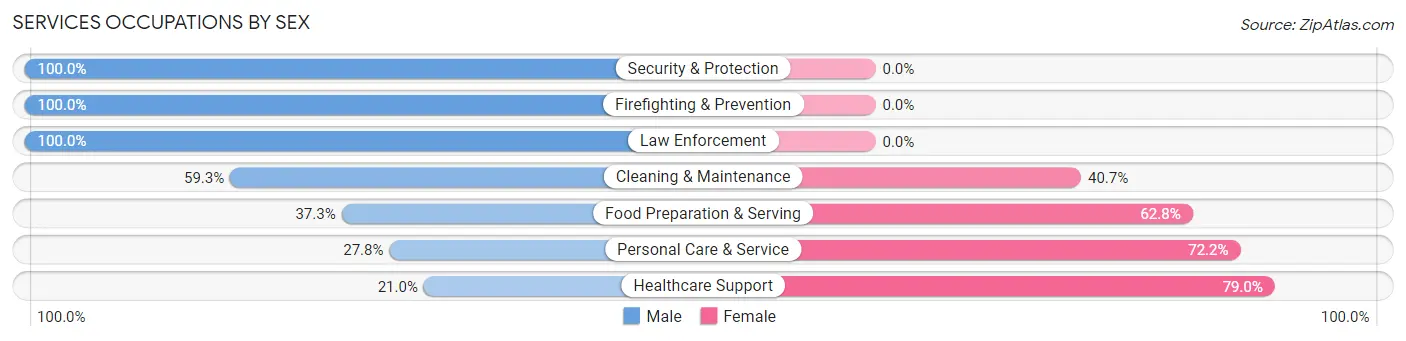
| Occupation | Male | Female |
| Healthcare Support | 35 (21.0%) | 132 (79.0%) |
| Security & Protection | 34 (100.0%) | 0 (0.0%) |
| Firefighting & Prevention | 8 (100.0%) | 0 (0.0%) |
| Law Enforcement | 26 (100.0%) | 0 (0.0%) |
| Food Preparation & Serving | 111 (37.2%) | 187 (62.7%) |
| Cleaning & Maintenance | 137 (59.3%) | 94 (40.7%) |
| Personal Care & Service | 25 (27.8%) | 65 (72.2%) |
| Total (Category) | 342 (41.7%) | 478 (58.3%) |
| Total (Overall) | 3,072 (55.8%) | 2,430 (44.2%) |
Sales and Office Occupations
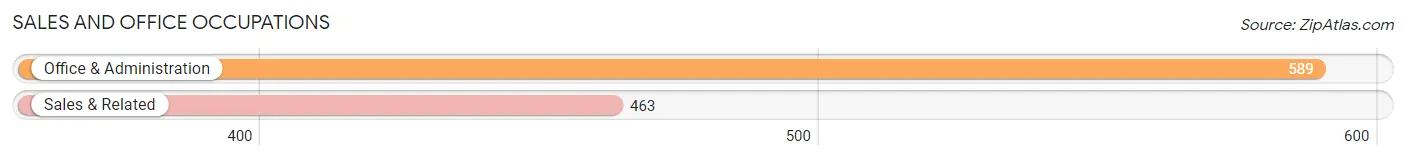
The most common Sales and Office occupations in North Logan are Office & Administration (589 | 10.7%), and Sales & Related (463 | 8.4%).
Sales and Office Occupations by Sex
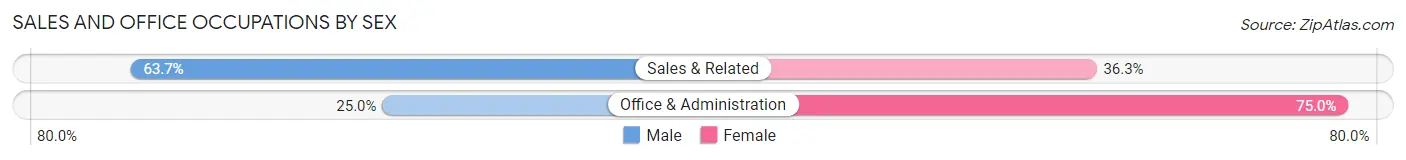
| Occupation | Male | Female |
| Sales & Related | 295 (63.7%) | 168 (36.3%) |
| Office & Administration | 147 (25.0%) | 442 (75.0%) |
| Total (Category) | 442 (42.0%) | 610 (58.0%) |
| Total (Overall) | 3,072 (55.8%) | 2,430 (44.2%) |
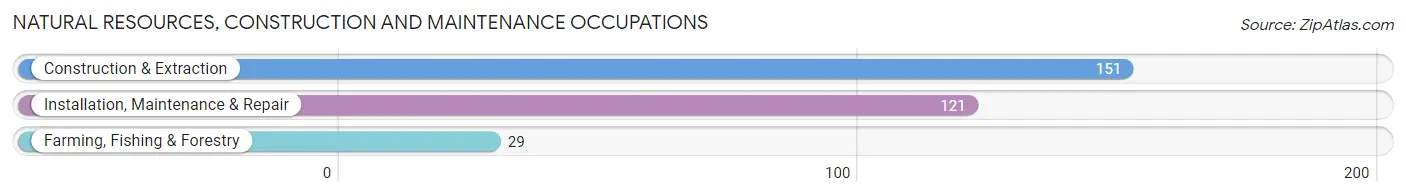
Natural Resources, Construction and Maintenance Occupations
The most common Natural Resources, Construction and Maintenance occupations in North Logan are Construction & Extraction (151 | 2.7%), Installation, Maintenance & Repair (121 | 2.2%), and Farming, Fishing & Forestry (29 | 0.5%).
Natural Resources, Construction and Maintenance Occupations by Sex
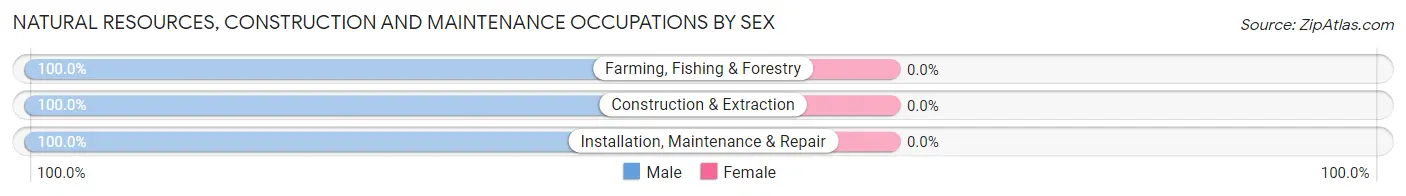
| Occupation | Male | Female |
| Farming, Fishing & Forestry | 29 (100.0%) | 0 (0.0%) |
| Construction & Extraction | 151 (100.0%) | 0 (0.0%) |
| Installation, Maintenance & Repair | 121 (100.0%) | 0 (0.0%) |
| Total (Category) | 301 (100.0%) | 0 (0.0%) |
| Total (Overall) | 3,072 (55.8%) | 2,430 (44.2%) |
Production, Transportation and Moving Occupations
The most common Production, Transportation and Moving occupations in North Logan are Material Moving (363 | 6.6%), Production (347 | 6.3%), and Transportation (115 | 2.1%).
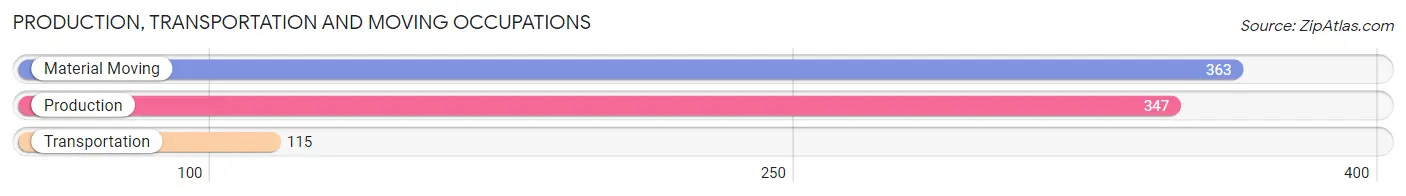
Production, Transportation and Moving Occupations by Sex
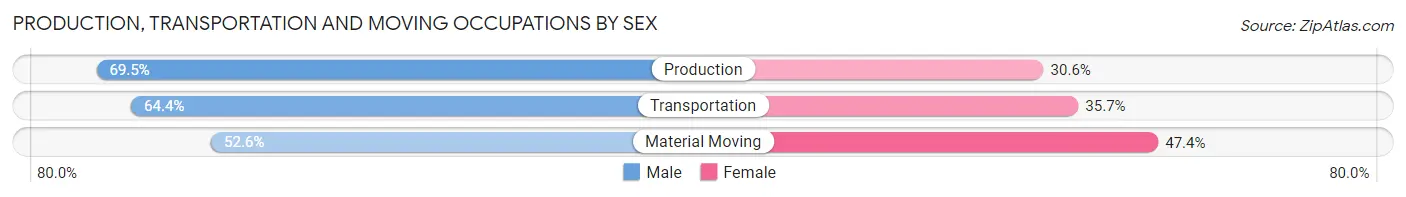
| Occupation | Male | Female |
| Production | 241 (69.5%) | 106 (30.5%) |
| Transportation | 74 (64.3%) | 41 (35.6%) |
| Material Moving | 191 (52.6%) | 172 (47.4%) |
| Total (Category) | 506 (61.3%) | 319 (38.7%) |
| Total (Overall) | 3,072 (55.8%) | 2,430 (44.2%) |
Employment Industries by Sex in North Logan
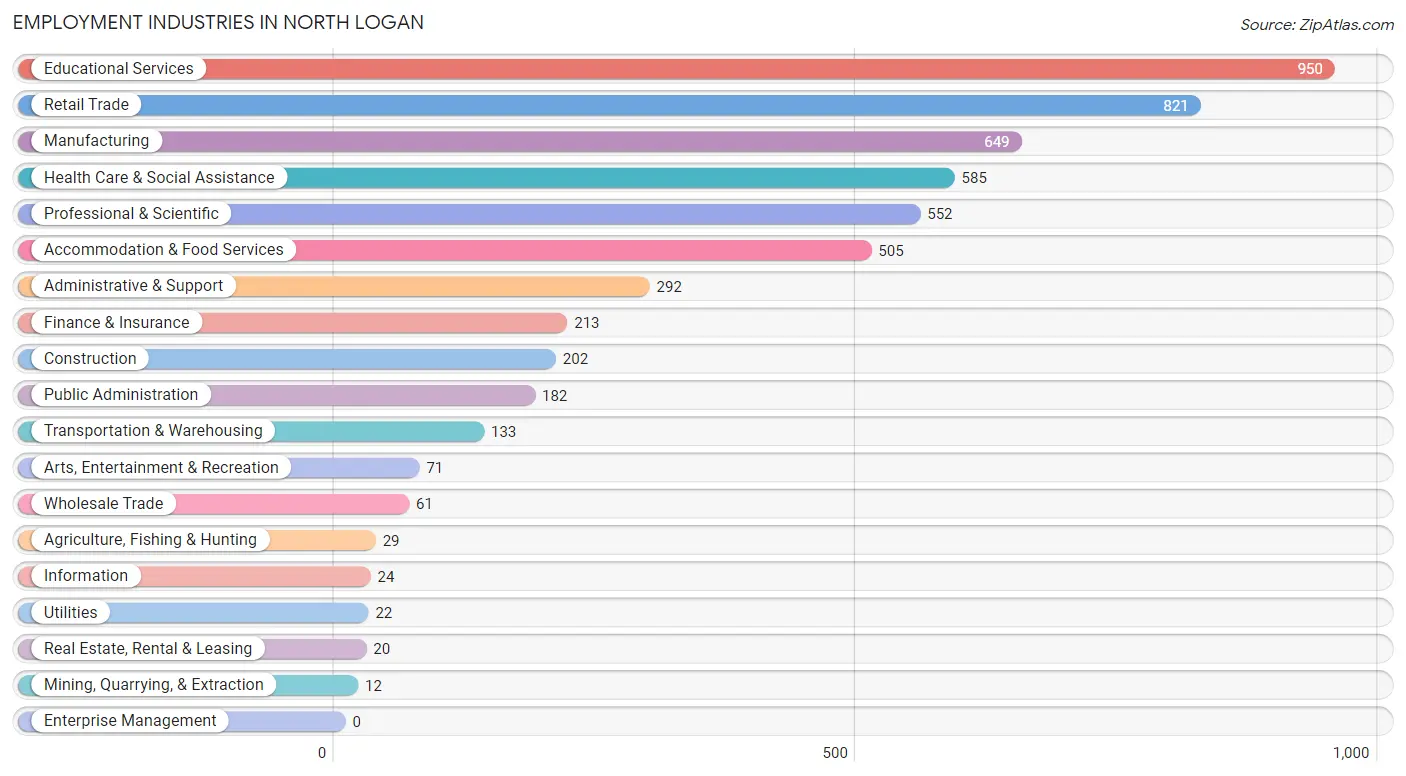
Employment Industries in North Logan
The major employment industries in North Logan include Educational Services (950 | 17.3%), Retail Trade (821 | 14.9%), Manufacturing (649 | 11.8%), Health Care & Social Assistance (585 | 10.6%), and Professional & Scientific (552 | 10.0%).
Employment Industries by Sex in North Logan
The North Logan industries that see more men than women are Agriculture, Fishing & Hunting (100.0%), Mining, Quarrying, & Extraction (100.0%), and Utilities (100.0%), whereas the industries that tend to have a higher number of women are Arts, Entertainment & Recreation (81.7%), Health Care & Social Assistance (64.6%), and Accommodation & Food Services (62.4%).
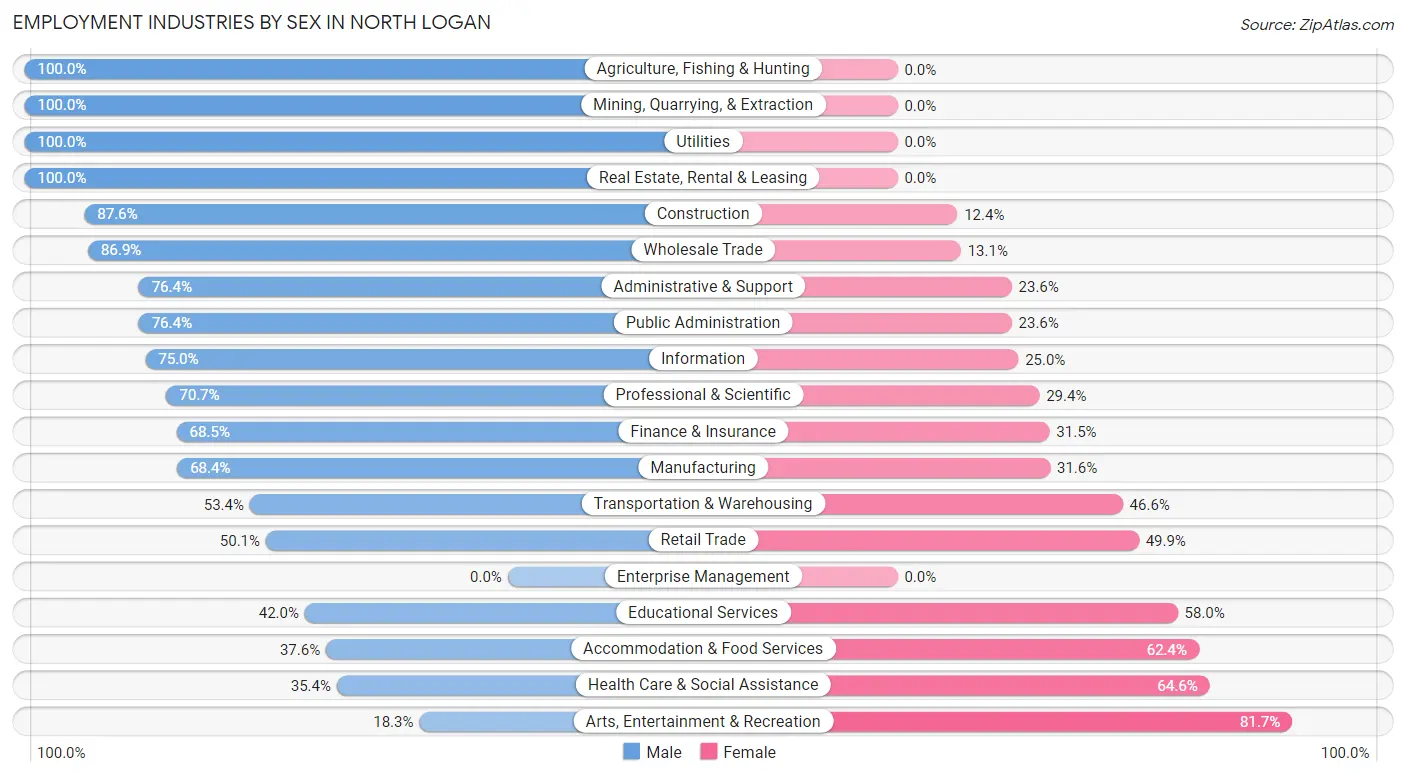
| Industry | Male | Female |
| Agriculture, Fishing & Hunting | 29 (100.0%) | 0 (0.0%) |
| Mining, Quarrying, & Extraction | 12 (100.0%) | 0 (0.0%) |
| Construction | 177 (87.6%) | 25 (12.4%) |
| Manufacturing | 444 (68.4%) | 205 (31.6%) |
| Wholesale Trade | 53 (86.9%) | 8 (13.1%) |
| Retail Trade | 411 (50.1%) | 410 (49.9%) |
| Transportation & Warehousing | 71 (53.4%) | 62 (46.6%) |
| Utilities | 22 (100.0%) | 0 (0.0%) |
| Information | 18 (75.0%) | 6 (25.0%) |
| Finance & Insurance | 146 (68.5%) | 67 (31.5%) |
| Real Estate, Rental & Leasing | 20 (100.0%) | 0 (0.0%) |
| Professional & Scientific | 390 (70.7%) | 162 (29.3%) |
| Enterprise Management | 0 (0.0%) | 0 (0.0%) |
| Administrative & Support | 223 (76.4%) | 69 (23.6%) |
| Educational Services | 399 (42.0%) | 551 (58.0%) |
| Health Care & Social Assistance | 207 (35.4%) | 378 (64.6%) |
| Arts, Entertainment & Recreation | 13 (18.3%) | 58 (81.7%) |
| Accommodation & Food Services | 190 (37.6%) | 315 (62.4%) |
| Public Administration | 139 (76.4%) | 43 (23.6%) |
| Total | 3,072 (55.8%) | 2,430 (44.2%) |
Education in North Logan
School Enrollment in North Logan
The most common levels of schooling among the 4,110 students in North Logan are college / undergraduate (1,299 | 31.6%), high school (858 | 20.9%), and middle school (738 | 18.0%).
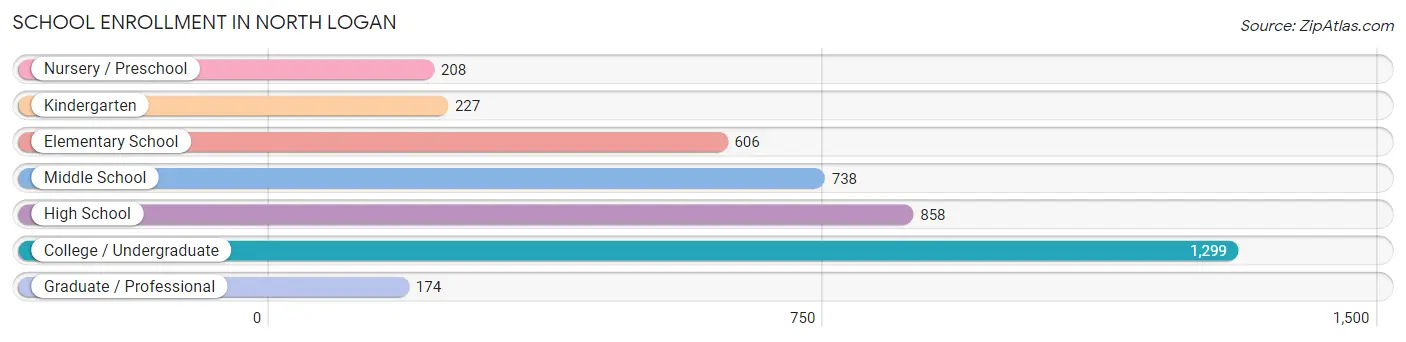
| School Level | # Students | % Students |
| Nursery / Preschool | 208 | 5.1% |
| Kindergarten | 227 | 5.5% |
| Elementary School | 606 | 14.7% |
| Middle School | 738 | 18.0% |
| High School | 858 | 20.9% |
| College / Undergraduate | 1,299 | 31.6% |
| Graduate / Professional | 174 | 4.2% |
| Total | 4,110 | 100.0% |
School Enrollment by Age by Funding Source in North Logan
Out of a total of 4,110 students who are enrolled in schools in North Logan, 448 (10.9%) attend a private institution, while the remaining 3,662 (89.1%) are enrolled in public schools. The age group of 3 to 4 year olds has the highest likelihood of being enrolled in private schools, with 72 (51.8% in the age bracket) enrolled. Conversely, the age group of 18 to 19 year olds has the lowest likelihood of being enrolled in a private school, with 304 (99.7% in the age bracket) attending a public institution.
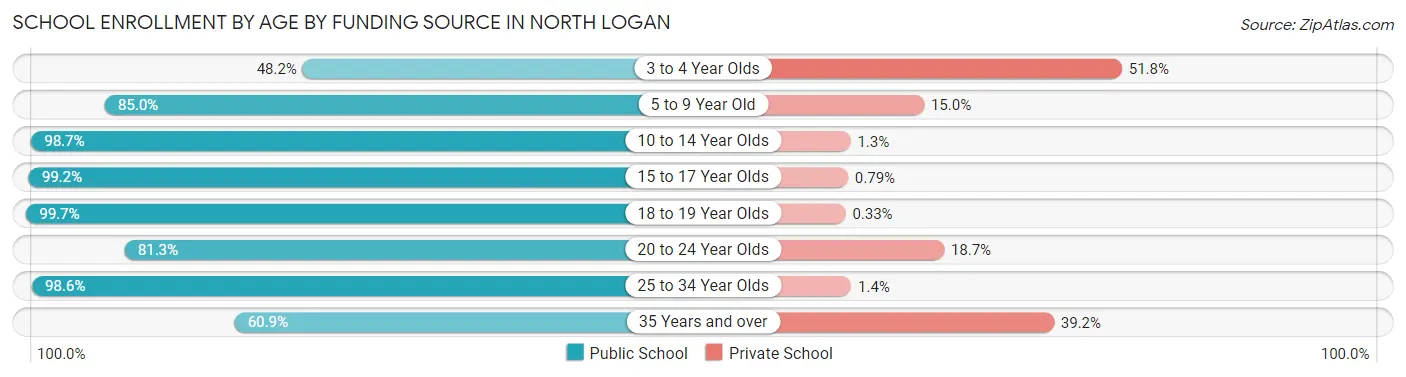
| Age Bracket | Public School | Private School |
| 3 to 4 Year Olds | 67 (48.2%) | 72 (51.8%) |
| 5 to 9 Year Old | 705 (85.0%) | 124 (15.0%) |
| 10 to 14 Year Olds | 939 (98.7%) | 12 (1.3%) |
| 15 to 17 Year Olds | 629 (99.2%) | 5 (0.8%) |
| 18 to 19 Year Olds | 304 (99.7%) | 1 (0.3%) |
| 20 to 24 Year Olds | 592 (81.3%) | 136 (18.7%) |
| 25 to 34 Year Olds | 285 (98.6%) | 4 (1.4%) |
| 35 Years and over | 143 (60.9%) | 92 (39.2%) |
| Total | 3,662 (89.1%) | 448 (10.9%) |
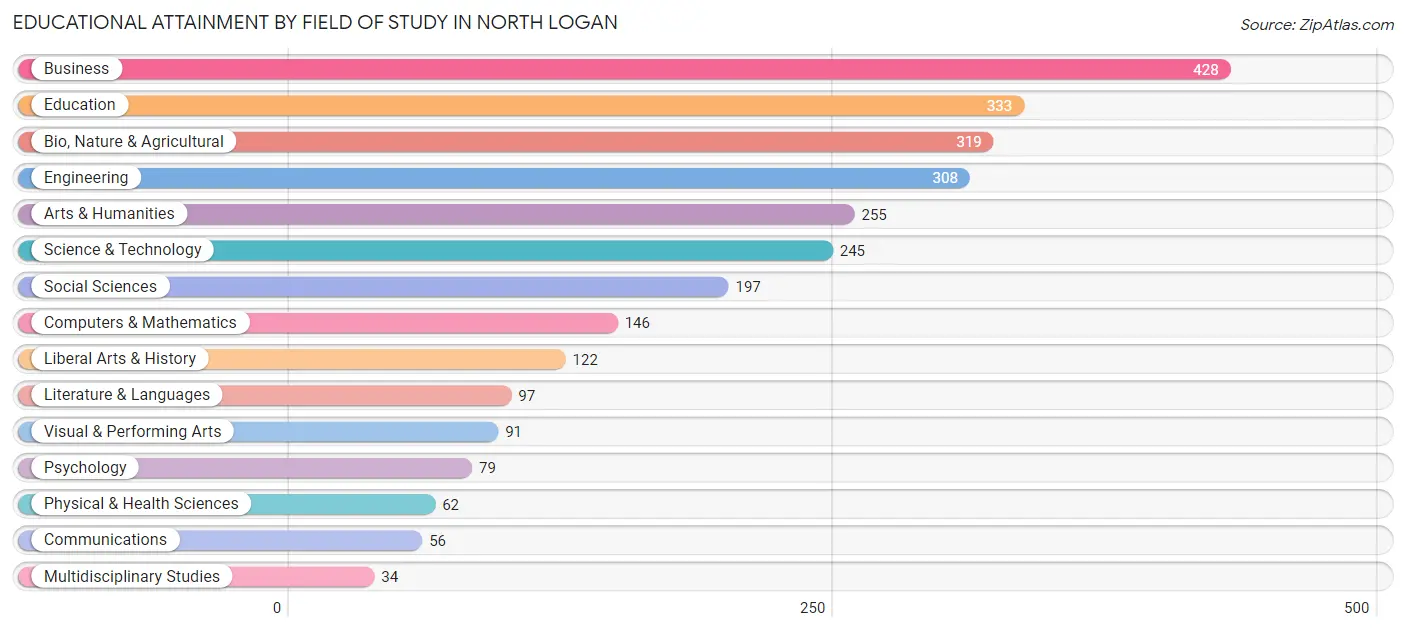
Educational Attainment by Field of Study in North Logan
Business (428 | 15.4%), education (333 | 12.0%), bio, nature & agricultural (319 | 11.5%), engineering (308 | 11.1%), and arts & humanities (255 | 9.2%) are the most common fields of study among 2,772 individuals in North Logan who have obtained a bachelor's degree or higher.
| Field of Study | # Graduates | % Graduates |
| Computers & Mathematics | 146 | 5.3% |
| Bio, Nature & Agricultural | 319 | 11.5% |
| Physical & Health Sciences | 62 | 2.2% |
| Psychology | 79 | 2.9% |
| Social Sciences | 197 | 7.1% |
| Engineering | 308 | 11.1% |
| Multidisciplinary Studies | 34 | 1.2% |
| Science & Technology | 245 | 8.8% |
| Business | 428 | 15.4% |
| Education | 333 | 12.0% |
| Literature & Languages | 97 | 3.5% |
| Liberal Arts & History | 122 | 4.4% |
| Visual & Performing Arts | 91 | 3.3% |
| Communications | 56 | 2.0% |
| Arts & Humanities | 255 | 9.2% |
| Total | 2,772 | 100.0% |
Transportation & Commute in North Logan
Vehicle Availability by Sex in North Logan
The most prevalent vehicle ownership categories in North Logan are males with 2 vehicles (1,195, accounting for 39.0%) and females with 2 vehicles (872, making up 50.2%).
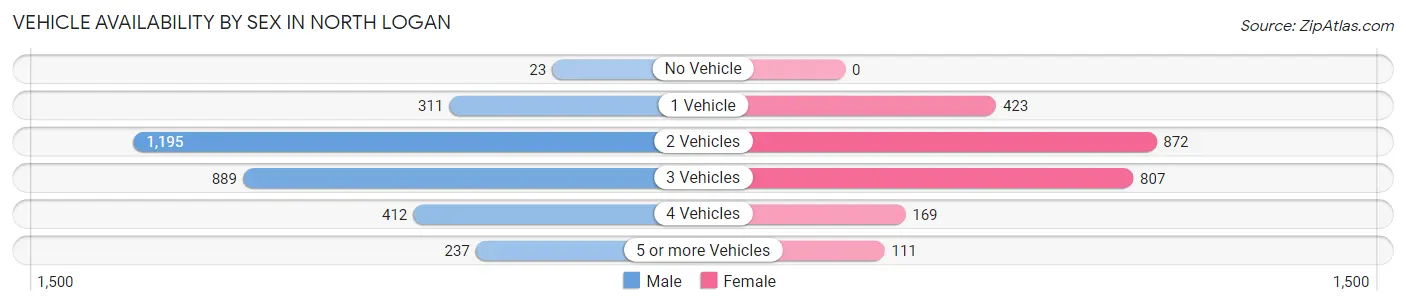
| Vehicles Available | Male | Female |
| No Vehicle | 23 (0.7%) | 0 (0.0%) |
| 1 Vehicle | 311 (10.1%) | 423 (17.8%) |
| 2 Vehicles | 1,195 (39.0%) | 872 (36.6%) |
| 3 Vehicles | 889 (29.0%) | 807 (33.9%) |
| 4 Vehicles | 412 (13.4%) | 169 (7.1%) |
| 5 or more Vehicles | 237 (7.7%) | 111 (4.7%) |
| Total | 3,067 (100.0%) | 2,382 (100.0%) |
Commute Time in North Logan
The most frequently occuring commute durations in North Logan are 10 to 14 minutes (1,401 commuters, 28.3%), 5 to 9 minutes (1,326 commuters, 26.8%), and 15 to 19 minutes (1,065 commuters, 21.5%).
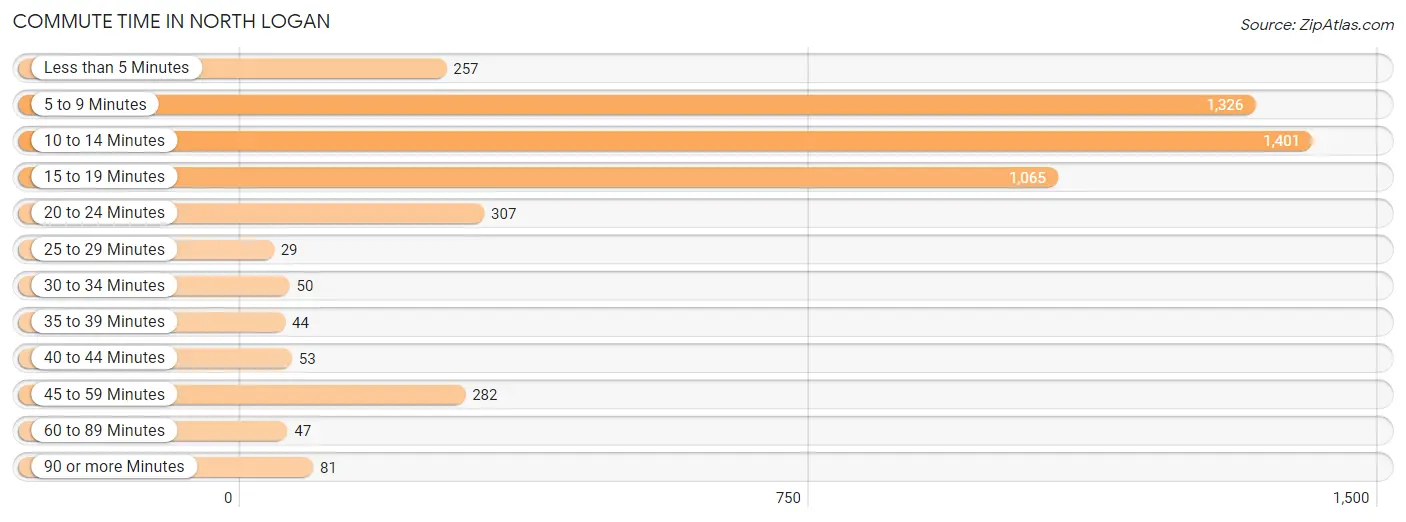
| Commute Time | # Commuters | % Commuters |
| Less than 5 Minutes | 257 | 5.2% |
| 5 to 9 Minutes | 1,326 | 26.8% |
| 10 to 14 Minutes | 1,401 | 28.3% |
| 15 to 19 Minutes | 1,065 | 21.5% |
| 20 to 24 Minutes | 307 | 6.2% |
| 25 to 29 Minutes | 29 | 0.6% |
| 30 to 34 Minutes | 50 | 1.0% |
| 35 to 39 Minutes | 44 | 0.9% |
| 40 to 44 Minutes | 53 | 1.1% |
| 45 to 59 Minutes | 282 | 5.7% |
| 60 to 89 Minutes | 47 | 0.9% |
| 90 or more Minutes | 81 | 1.6% |
Commute Time by Sex in North Logan
The most common commute times in North Logan are 10 to 14 minutes (793 commuters, 28.6%) for males and 10 to 14 minutes (608 commuters, 28.0%) for females.
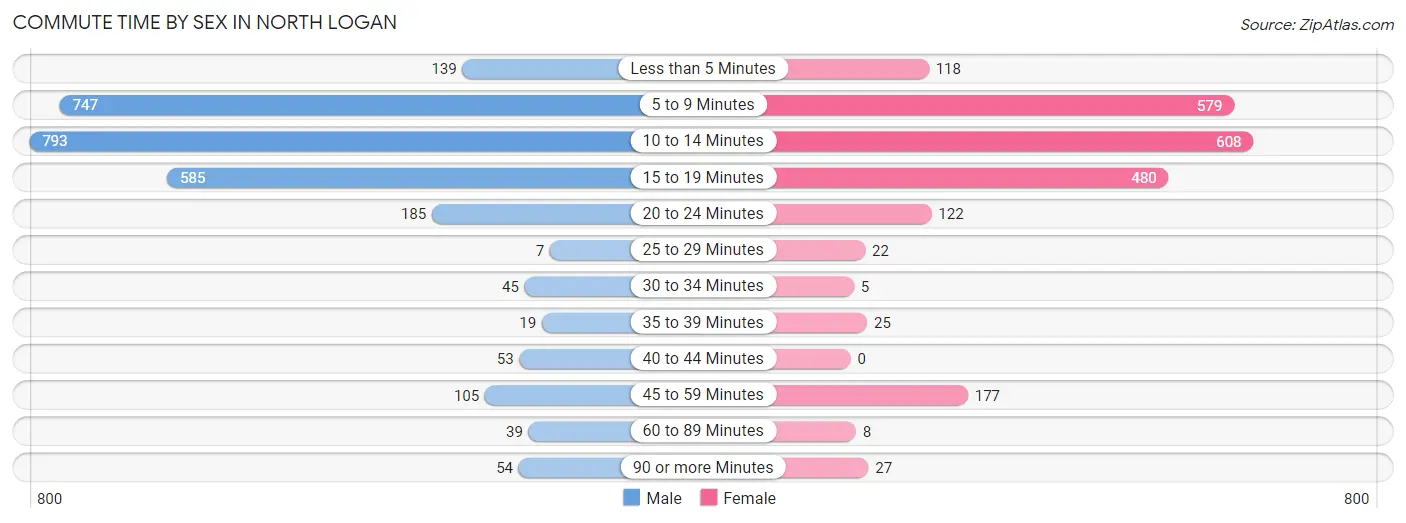
| Commute Time | Male | Female |
| Less than 5 Minutes | 139 (5.0%) | 118 (5.4%) |
| 5 to 9 Minutes | 747 (27.0%) | 579 (26.7%) |
| 10 to 14 Minutes | 793 (28.6%) | 608 (28.0%) |
| 15 to 19 Minutes | 585 (21.1%) | 480 (22.1%) |
| 20 to 24 Minutes | 185 (6.7%) | 122 (5.6%) |
| 25 to 29 Minutes | 7 (0.3%) | 22 (1.0%) |
| 30 to 34 Minutes | 45 (1.6%) | 5 (0.2%) |
| 35 to 39 Minutes | 19 (0.7%) | 25 (1.1%) |
| 40 to 44 Minutes | 53 (1.9%) | 0 (0.0%) |
| 45 to 59 Minutes | 105 (3.8%) | 177 (8.2%) |
| 60 to 89 Minutes | 39 (1.4%) | 8 (0.4%) |
| 90 or more Minutes | 54 (1.9%) | 27 (1.2%) |
Time of Departure to Work by Sex in North Logan
The most frequent times of departure to work in North Logan are 7:30 AM to 7:59 AM (435, 15.7%) for males and 12:00 PM to 3:59 PM (400, 18.4%) for females.
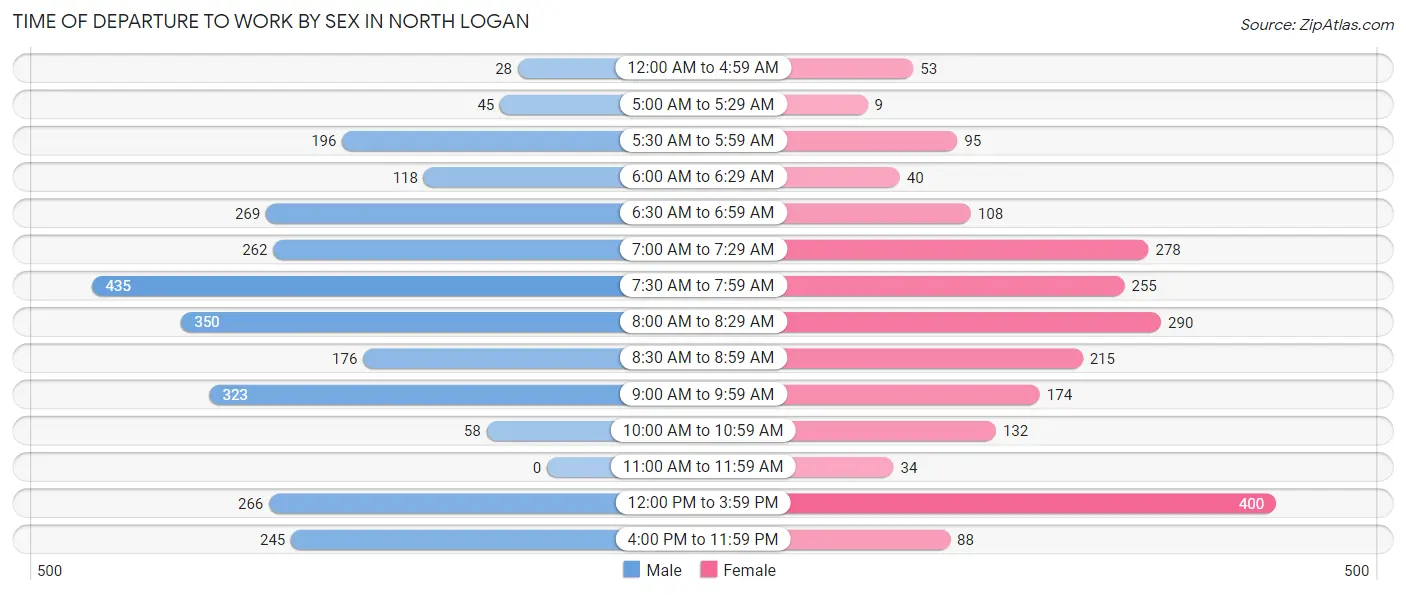
| Time of Departure | Male | Female |
| 12:00 AM to 4:59 AM | 28 (1.0%) | 53 (2.4%) |
| 5:00 AM to 5:29 AM | 45 (1.6%) | 9 (0.4%) |
| 5:30 AM to 5:59 AM | 196 (7.1%) | 95 (4.4%) |
| 6:00 AM to 6:29 AM | 118 (4.3%) | 40 (1.8%) |
| 6:30 AM to 6:59 AM | 269 (9.7%) | 108 (5.0%) |
| 7:00 AM to 7:29 AM | 262 (9.5%) | 278 (12.8%) |
| 7:30 AM to 7:59 AM | 435 (15.7%) | 255 (11.7%) |
| 8:00 AM to 8:29 AM | 350 (12.6%) | 290 (13.4%) |
| 8:30 AM to 8:59 AM | 176 (6.4%) | 215 (9.9%) |
| 9:00 AM to 9:59 AM | 323 (11.7%) | 174 (8.0%) |
| 10:00 AM to 10:59 AM | 58 (2.1%) | 132 (6.1%) |
| 11:00 AM to 11:59 AM | 0 (0.0%) | 34 (1.6%) |
| 12:00 PM to 3:59 PM | 266 (9.6%) | 400 (18.4%) |
| 4:00 PM to 11:59 PM | 245 (8.8%) | 88 (4.1%) |
| Total | 2,771 (100.0%) | 2,171 (100.0%) |
Housing Occupancy in North Logan
Occupancy by Ownership in North Logan
Of the total 3,546 dwellings in North Logan, owner-occupied units account for 2,016 (56.9%), while renter-occupied units make up 1,530 (43.1%).
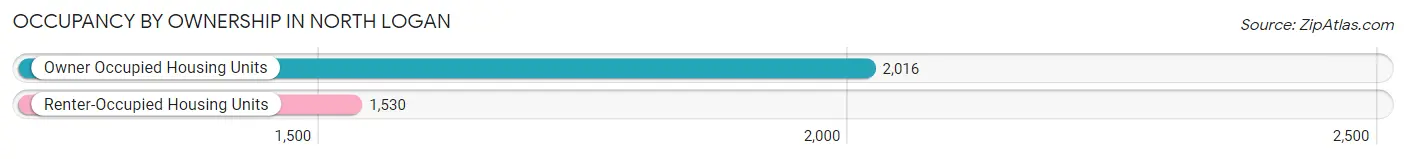
| Occupancy | # Housing Units | % Housing Units |
| Owner Occupied Housing Units | 2,016 | 56.9% |
| Renter-Occupied Housing Units | 1,530 | 43.1% |
| Total Occupied Housing Units | 3,546 | 100.0% |
Occupancy by Household Size in North Logan
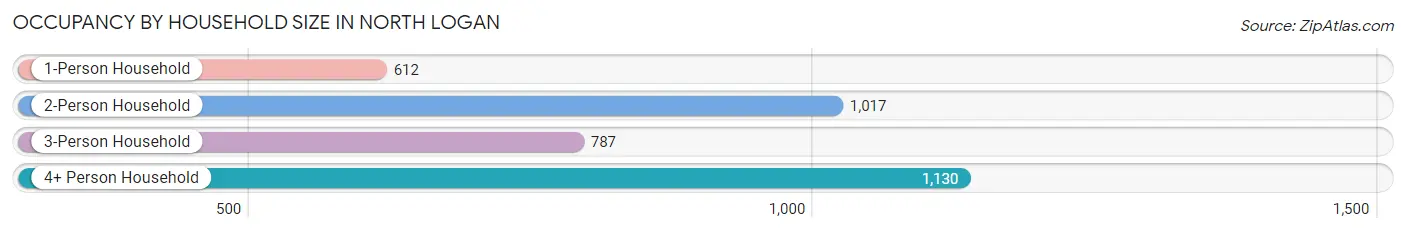
| Household Size | # Housing Units | % Housing Units |
| 1-Person Household | 612 | 17.3% |
| 2-Person Household | 1,017 | 28.7% |
| 3-Person Household | 787 | 22.2% |
| 4+ Person Household | 1,130 | 31.9% |
| Total Housing Units | 3,546 | 100.0% |
Occupancy by Ownership by Household Size in North Logan
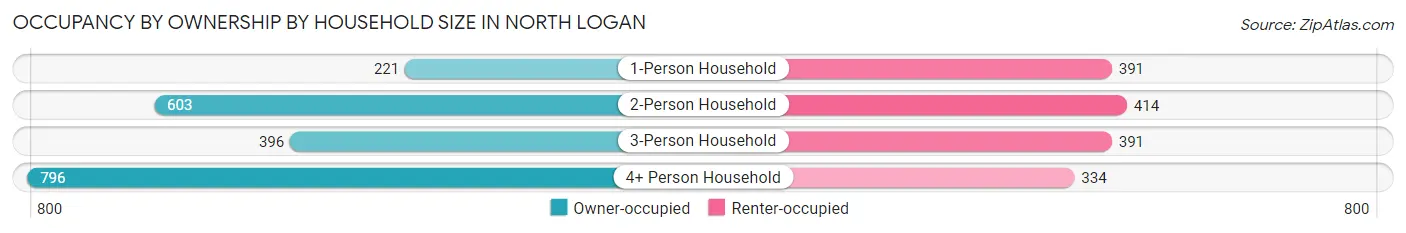
| Household Size | Owner-occupied | Renter-occupied |
| 1-Person Household | 221 (36.1%) | 391 (63.9%) |
| 2-Person Household | 603 (59.3%) | 414 (40.7%) |
| 3-Person Household | 396 (50.3%) | 391 (49.7%) |
| 4+ Person Household | 796 (70.4%) | 334 (29.6%) |
| Total Housing Units | 2,016 (56.9%) | 1,530 (43.1%) |
Occupancy by Educational Attainment in North Logan
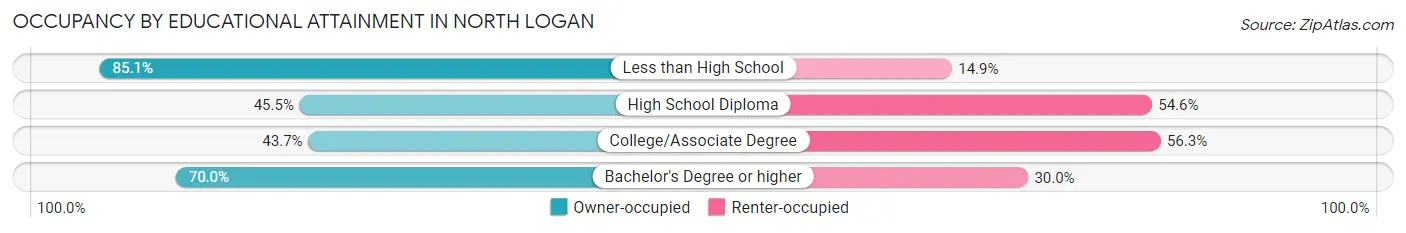
| Household Size | Owner-occupied | Renter-occupied |
| Less than High School | 40 (85.1%) | 7 (14.9%) |
| High School Diploma | 225 (45.5%) | 270 (54.5%) |
| College/Associate Degree | 586 (43.7%) | 754 (56.3%) |
| Bachelor's Degree or higher | 1,165 (70.0%) | 499 (30.0%) |
Occupancy by Age of Householder in North Logan
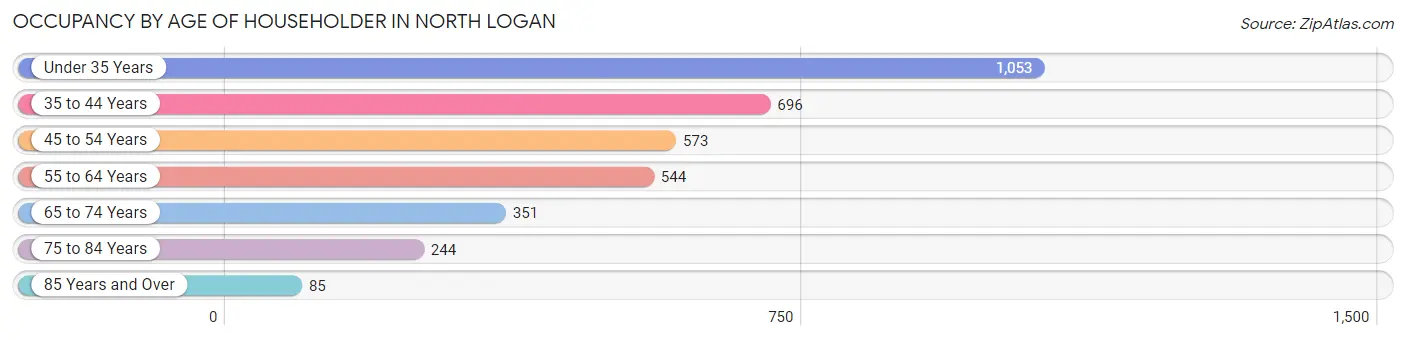
| Age Bracket | # Households | % Households |
| Under 35 Years | 1,053 | 29.7% |
| 35 to 44 Years | 696 | 19.6% |
| 45 to 54 Years | 573 | 16.2% |
| 55 to 64 Years | 544 | 15.3% |
| 65 to 74 Years | 351 | 9.9% |
| 75 to 84 Years | 244 | 6.9% |
| 85 Years and Over | 85 | 2.4% |
| Total | 3,546 | 100.0% |
Housing Finances in North Logan
Median Income by Occupancy in North Logan
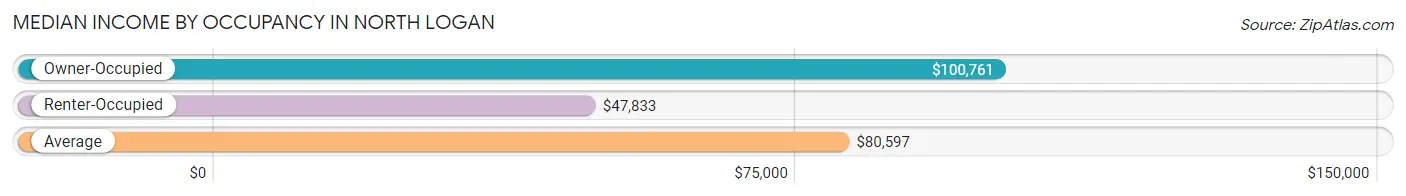
| Occupancy Type | # Households | Median Income |
| Owner-Occupied | 2,016 (56.9%) | $100,761 |
| Renter-Occupied | 1,530 (43.1%) | $47,833 |
| Average | 3,546 (100.0%) | $80,597 |
Occupancy by Householder Income Bracket in North Logan
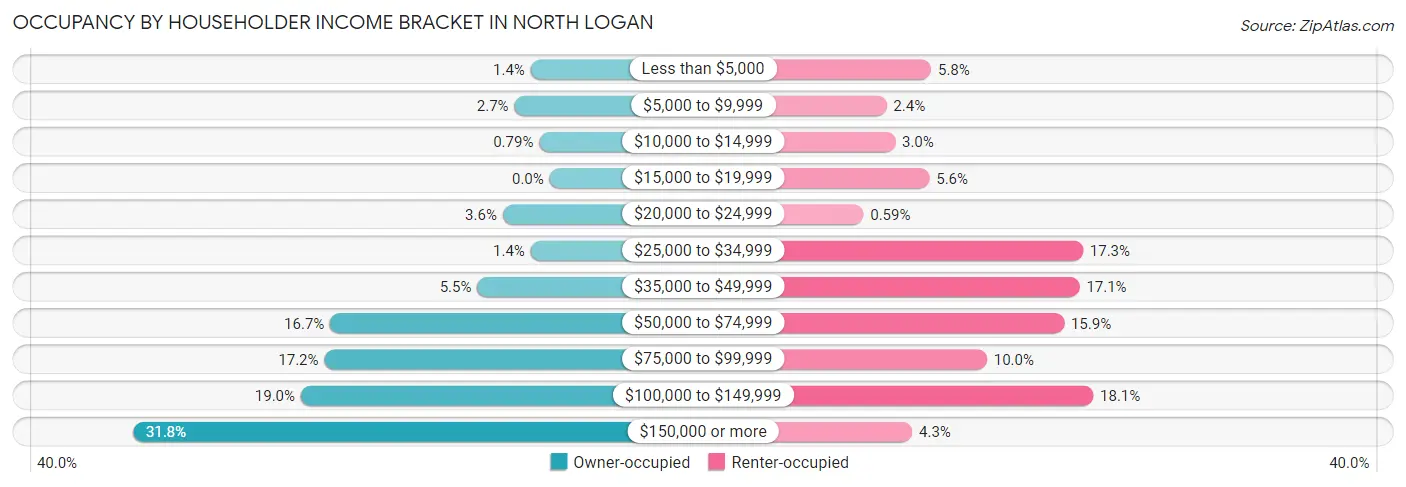
| Income Bracket | Owner-occupied | Renter-occupied |
| Less than $5,000 | 29 (1.4%) | 88 (5.8%) |
| $5,000 to $9,999 | 54 (2.7%) | 36 (2.4%) |
| $10,000 to $14,999 | 16 (0.8%) | 46 (3.0%) |
| $15,000 to $19,999 | 0 (0.0%) | 86 (5.6%) |
| $20,000 to $24,999 | 72 (3.6%) | 9 (0.6%) |
| $25,000 to $34,999 | 29 (1.4%) | 265 (17.3%) |
| $35,000 to $49,999 | 111 (5.5%) | 261 (17.1%) |
| $50,000 to $74,999 | 337 (16.7%) | 243 (15.9%) |
| $75,000 to $99,999 | 346 (17.2%) | 153 (10.0%) |
| $100,000 to $149,999 | 382 (19.0%) | 277 (18.1%) |
| $150,000 or more | 640 (31.8%) | 66 (4.3%) |
| Total | 2,016 (100.0%) | 1,530 (100.0%) |
Monthly Housing Cost Tiers in North Logan
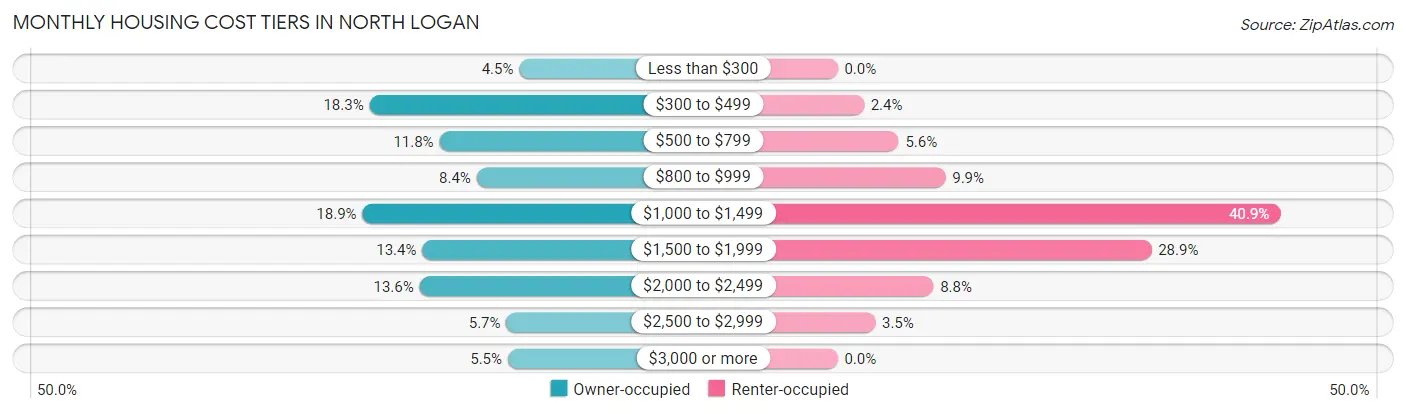
| Monthly Cost | Owner-occupied | Renter-occupied |
| Less than $300 | 90 (4.5%) | 0 (0.0%) |
| $300 to $499 | 368 (18.2%) | 37 (2.4%) |
| $500 to $799 | 238 (11.8%) | 86 (5.6%) |
| $800 to $999 | 169 (8.4%) | 152 (9.9%) |
| $1,000 to $1,499 | 381 (18.9%) | 625 (40.8%) |
| $1,500 to $1,999 | 270 (13.4%) | 442 (28.9%) |
| $2,000 to $2,499 | 275 (13.6%) | 135 (8.8%) |
| $2,500 to $2,999 | 114 (5.7%) | 53 (3.5%) |
| $3,000 or more | 111 (5.5%) | 0 (0.0%) |
| Total | 2,016 (100.0%) | 1,530 (100.0%) |
Physical Housing Characteristics in North Logan
Housing Structures in North Logan
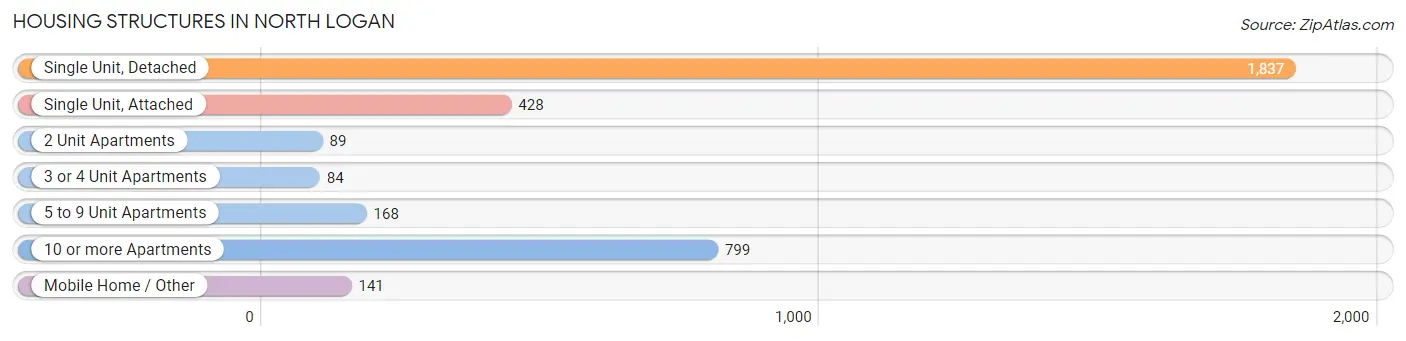
| Structure Type | # Housing Units | % Housing Units |
| Single Unit, Detached | 1,837 | 51.8% |
| Single Unit, Attached | 428 | 12.1% |
| 2 Unit Apartments | 89 | 2.5% |
| 3 or 4 Unit Apartments | 84 | 2.4% |
| 5 to 9 Unit Apartments | 168 | 4.7% |
| 10 or more Apartments | 799 | 22.5% |
| Mobile Home / Other | 141 | 4.0% |
| Total | 3,546 | 100.0% |
Housing Structures by Occupancy in North Logan
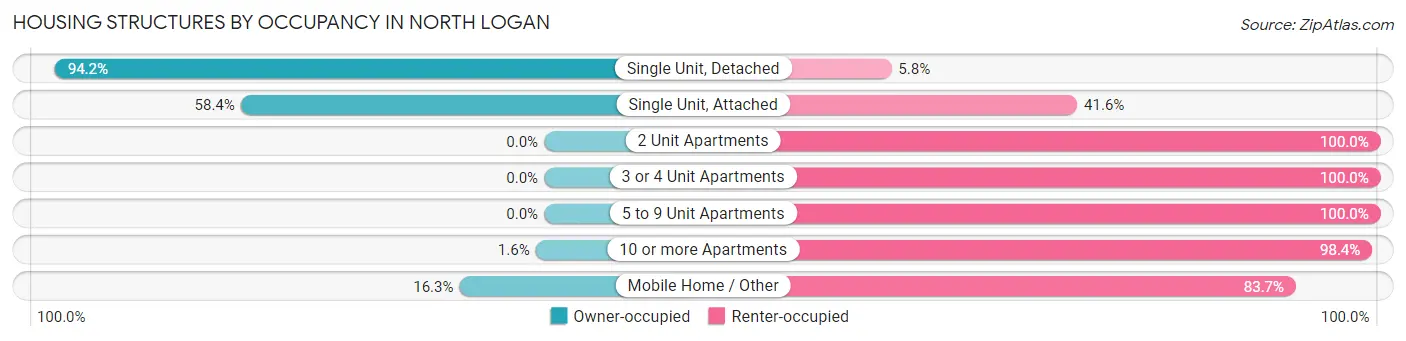
| Structure Type | Owner-occupied | Renter-occupied |
| Single Unit, Detached | 1,730 (94.2%) | 107 (5.8%) |
| Single Unit, Attached | 250 (58.4%) | 178 (41.6%) |
| 2 Unit Apartments | 0 (0.0%) | 89 (100.0%) |
| 3 or 4 Unit Apartments | 0 (0.0%) | 84 (100.0%) |
| 5 to 9 Unit Apartments | 0 (0.0%) | 168 (100.0%) |
| 10 or more Apartments | 13 (1.6%) | 786 (98.4%) |
| Mobile Home / Other | 23 (16.3%) | 118 (83.7%) |
| Total | 2,016 (56.9%) | 1,530 (43.1%) |
Housing Structures by Number of Rooms in North Logan
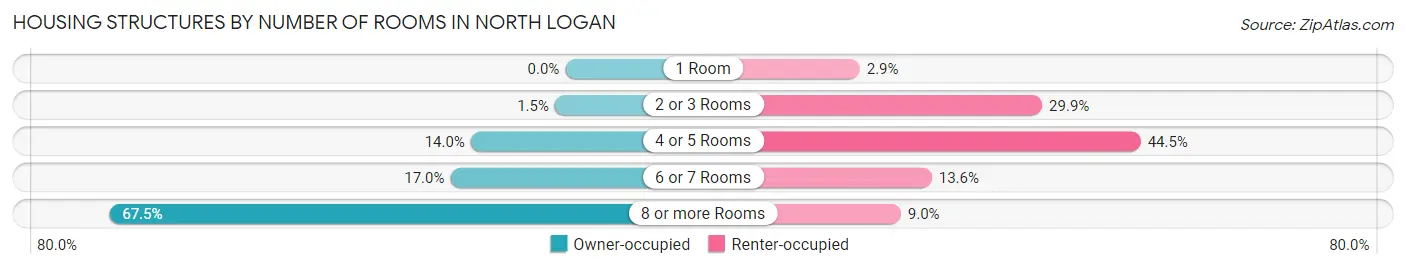
| Number of Rooms | Owner-occupied | Renter-occupied |
| 1 Room | 0 (0.0%) | 45 (2.9%) |
| 2 or 3 Rooms | 31 (1.5%) | 458 (29.9%) |
| 4 or 5 Rooms | 282 (14.0%) | 681 (44.5%) |
| 6 or 7 Rooms | 343 (17.0%) | 208 (13.6%) |
| 8 or more Rooms | 1,360 (67.5%) | 138 (9.0%) |
| Total | 2,016 (100.0%) | 1,530 (100.0%) |
Housing Structure by Heating Type in North Logan
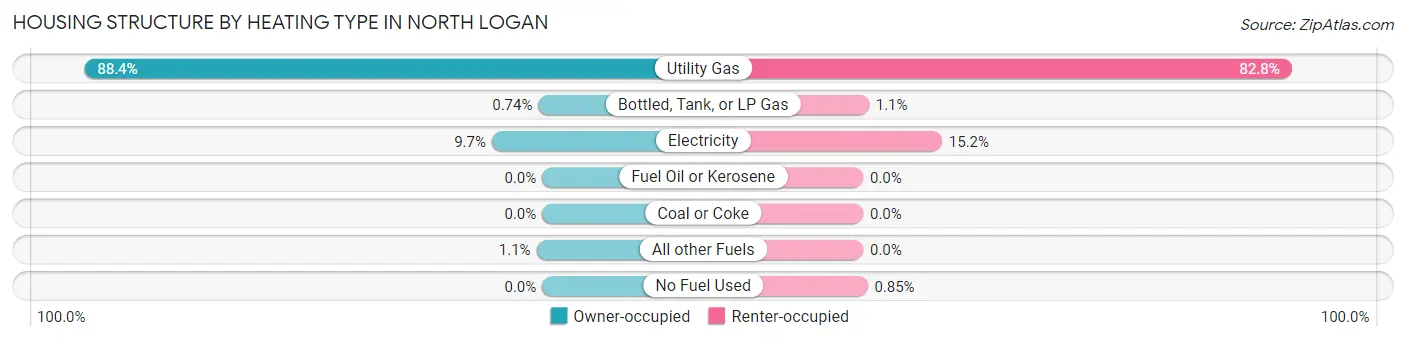
| Heating Type | Owner-occupied | Renter-occupied |
| Utility Gas | 1,783 (88.4%) | 1,267 (82.8%) |
| Bottled, Tank, or LP Gas | 15 (0.7%) | 17 (1.1%) |
| Electricity | 196 (9.7%) | 233 (15.2%) |
| Fuel Oil or Kerosene | 0 (0.0%) | 0 (0.0%) |
| Coal or Coke | 0 (0.0%) | 0 (0.0%) |
| All other Fuels | 22 (1.1%) | 0 (0.0%) |
| No Fuel Used | 0 (0.0%) | 13 (0.9%) |
| Total | 2,016 (100.0%) | 1,530 (100.0%) |
Household Vehicle Usage in North Logan
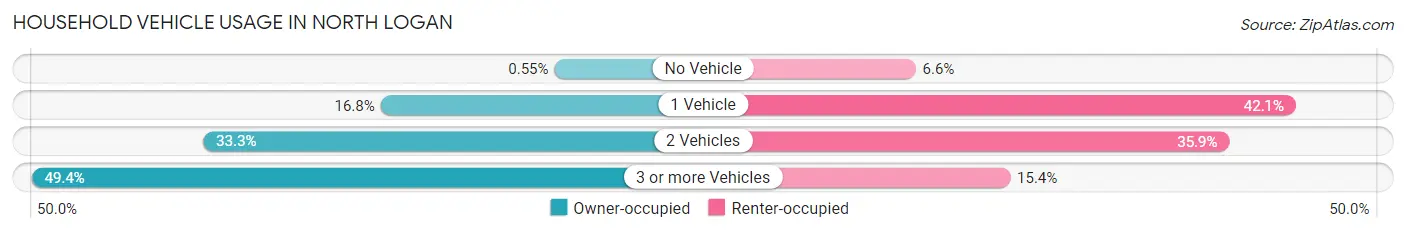
| Vehicles per Household | Owner-occupied | Renter-occupied |
| No Vehicle | 11 (0.5%) | 101 (6.6%) |
| 1 Vehicle | 338 (16.8%) | 644 (42.1%) |
| 2 Vehicles | 672 (33.3%) | 549 (35.9%) |
| 3 or more Vehicles | 995 (49.4%) | 236 (15.4%) |
| Total | 2,016 (100.0%) | 1,530 (100.0%) |
Real Estate & Mortgages in North Logan
Real Estate and Mortgage Overview in North Logan
| Characteristic | Without Mortgage | With Mortgage |
| Housing Units | 818 | 1,198 |
| Median Property Value | $383,300 | $425,000 |
| Median Household Income | $88,214 | $450 |
| Monthly Housing Costs | $482 | $111 |
| Real Estate Taxes | $2,030 | $16 |
Property Value by Mortgage Status in North Logan
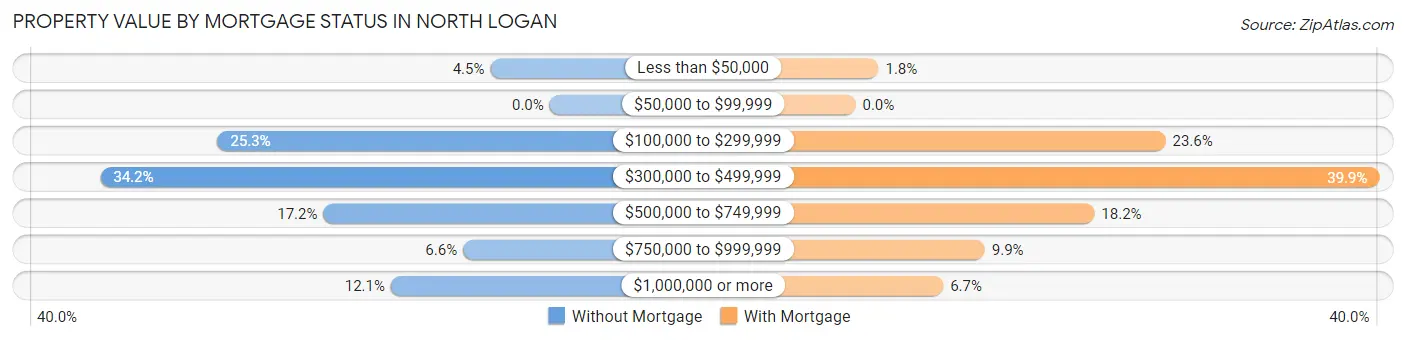
| Property Value | Without Mortgage | With Mortgage |
| Less than $50,000 | 37 (4.5%) | 21 (1.8%) |
| $50,000 to $99,999 | 0 (0.0%) | 0 (0.0%) |
| $100,000 to $299,999 | 207 (25.3%) | 283 (23.6%) |
| $300,000 to $499,999 | 280 (34.2%) | 478 (39.9%) |
| $500,000 to $749,999 | 141 (17.2%) | 218 (18.2%) |
| $750,000 to $999,999 | 54 (6.6%) | 118 (9.9%) |
| $1,000,000 or more | 99 (12.1%) | 80 (6.7%) |
| Total | 818 (100.0%) | 1,198 (100.0%) |
Household Income by Mortgage Status in North Logan
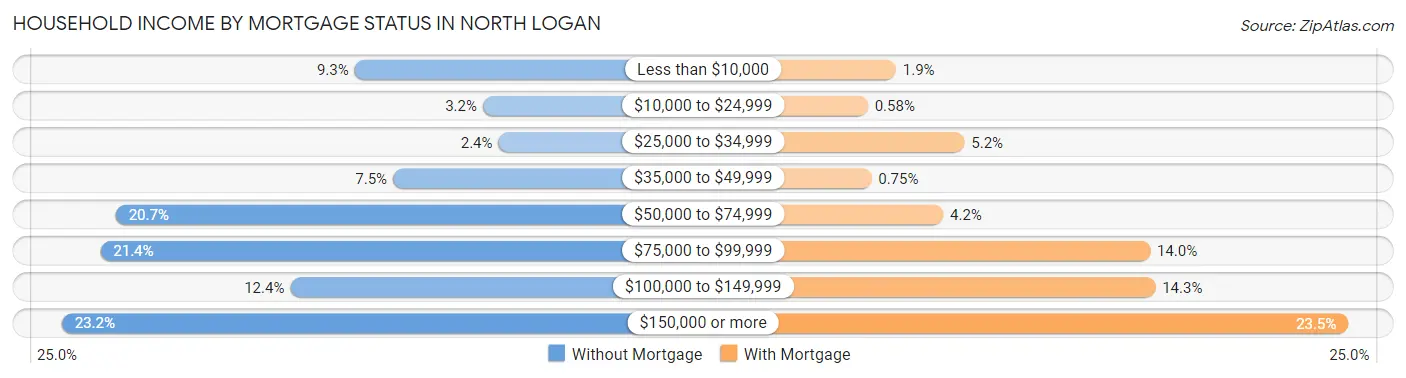
| Household Income | Without Mortgage | With Mortgage |
| Less than $10,000 | 76 (9.3%) | 23 (1.9%) |
| $10,000 to $24,999 | 26 (3.2%) | 7 (0.6%) |
| $25,000 to $34,999 | 20 (2.4%) | 62 (5.2%) |
| $35,000 to $49,999 | 61 (7.5%) | 9 (0.7%) |
| $50,000 to $74,999 | 169 (20.7%) | 50 (4.2%) |
| $75,000 to $99,999 | 175 (21.4%) | 168 (14.0%) |
| $100,000 to $149,999 | 101 (12.3%) | 171 (14.3%) |
| $150,000 or more | 190 (23.2%) | 281 (23.5%) |
| Total | 818 (100.0%) | 1,198 (100.0%) |
Property Value to Household Income Ratio in North Logan
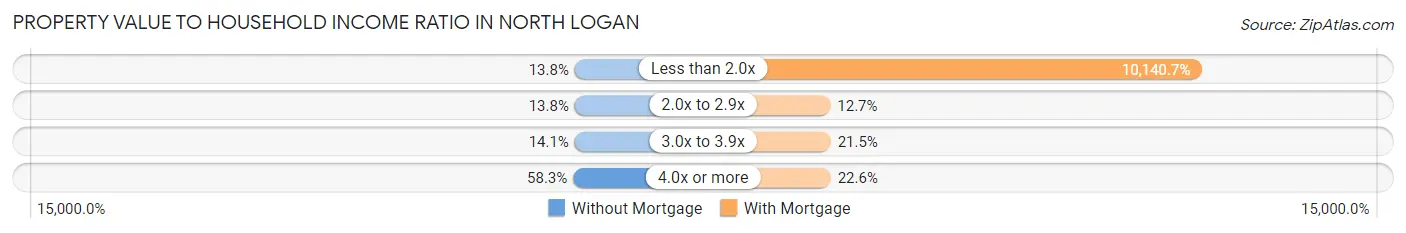
| Value-to-Income Ratio | Without Mortgage | With Mortgage |
| Less than 2.0x | 113 (13.8%) | 121,486 (10,140.7%) |
| 2.0x to 2.9x | 113 (13.8%) | 152 (12.7%) |
| 3.0x to 3.9x | 115 (14.1%) | 257 (21.4%) |
| 4.0x or more | 477 (58.3%) | 271 (22.6%) |
| Total | 818 (100.0%) | 1,198 (100.0%) |
Real Estate Taxes by Mortgage Status in North Logan
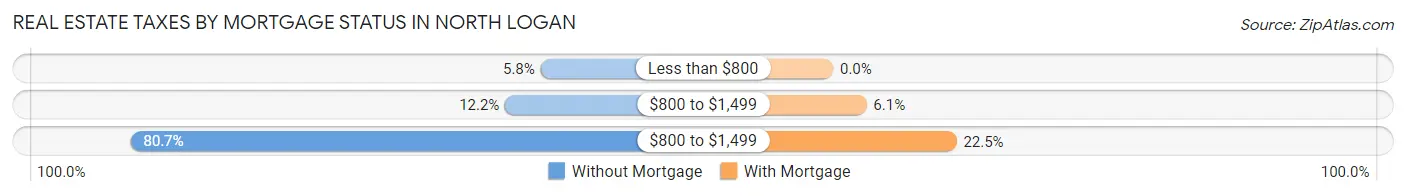
| Property Taxes | Without Mortgage | With Mortgage |
| Less than $800 | 47 (5.8%) | 0 (0.0%) |
| $800 to $1,499 | 100 (12.2%) | 73 (6.1%) |
| $800 to $1,499 | 660 (80.7%) | 270 (22.5%) |
| Total | 818 (100.0%) | 1,198 (100.0%) |
Health & Disability in North Logan
Health Insurance Coverage by Age in North Logan
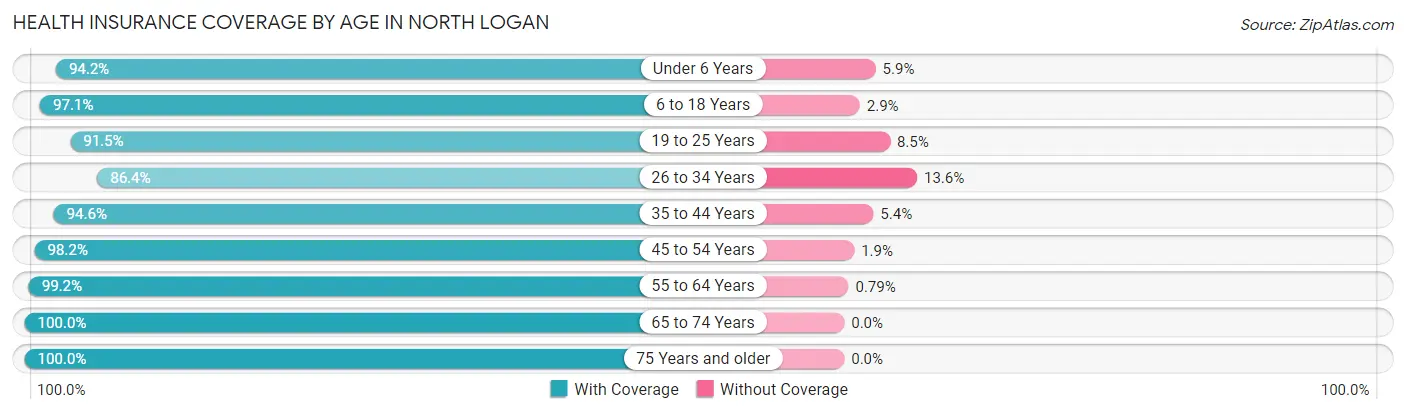
| Age Bracket | With Coverage | Without Coverage |
| Under 6 Years | 789 (94.2%) | 49 (5.9%) |
| 6 to 18 Years | 2,340 (97.1%) | 70 (2.9%) |
| 19 to 25 Years | 1,835 (91.5%) | 171 (8.5%) |
| 26 to 34 Years | 981 (86.4%) | 154 (13.6%) |
| 35 to 44 Years | 1,219 (94.6%) | 70 (5.4%) |
| 45 to 54 Years | 1,063 (98.2%) | 20 (1.8%) |
| 55 to 64 Years | 1,009 (99.2%) | 8 (0.8%) |
| 65 to 74 Years | 593 (100.0%) | 0 (0.0%) |
| 75 Years and older | 470 (100.0%) | 0 (0.0%) |
| Total | 10,299 (95.0%) | 542 (5.0%) |
Health Insurance Coverage by Citizenship Status in North Logan
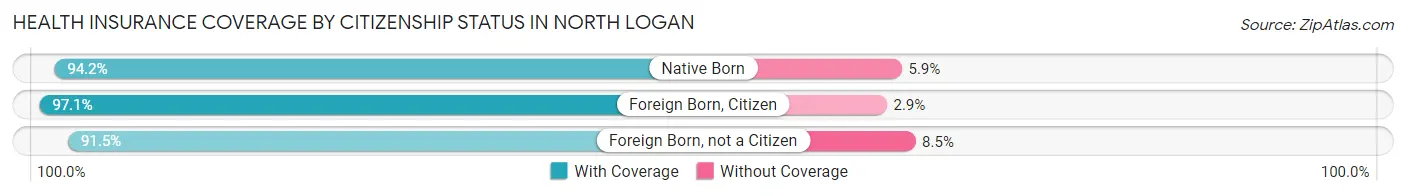
| Citizenship Status | With Coverage | Without Coverage |
| Native Born | 789 (94.2%) | 49 (5.9%) |
| Foreign Born, Citizen | 2,340 (97.1%) | 70 (2.9%) |
| Foreign Born, not a Citizen | 1,835 (91.5%) | 171 (8.5%) |
Health Insurance Coverage by Household Income in North Logan
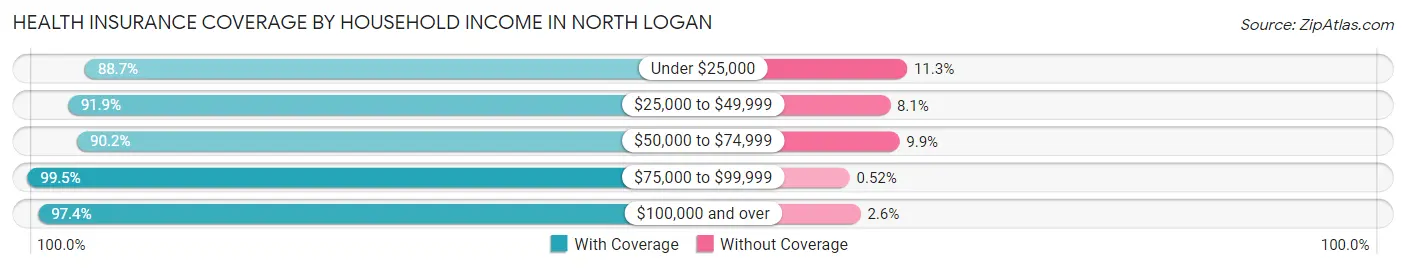
| Household Income | With Coverage | Without Coverage |
| Under $25,000 | 881 (88.7%) | 112 (11.3%) |
| $25,000 to $49,999 | 1,659 (91.9%) | 146 (8.1%) |
| $50,000 to $74,999 | 1,354 (90.1%) | 148 (9.9%) |
| $75,000 to $99,999 | 1,529 (99.5%) | 8 (0.5%) |
| $100,000 and over | 4,876 (97.4%) | 128 (2.6%) |
Public vs Private Health Insurance Coverage by Age in North Logan
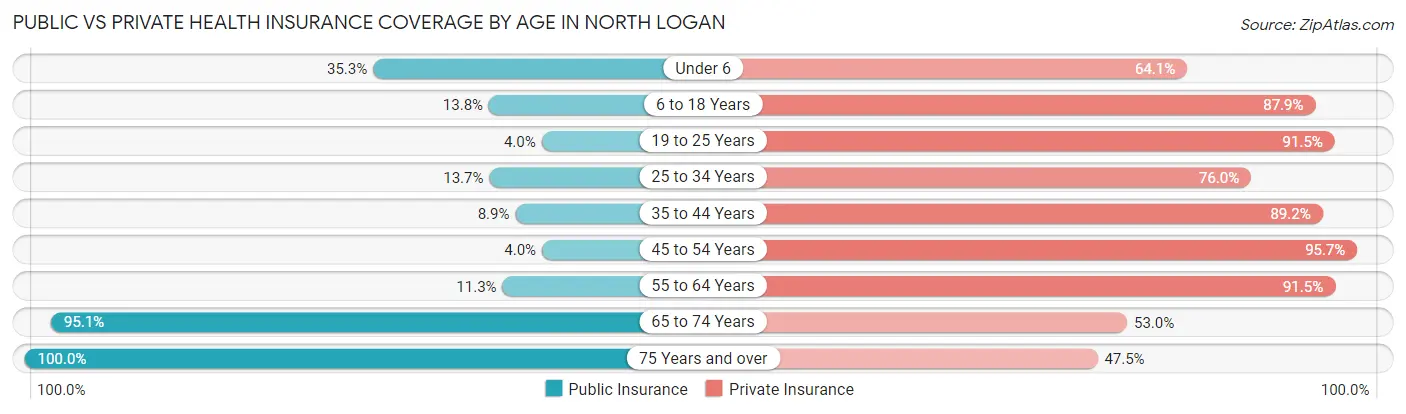
| Age Bracket | Public Insurance | Private Insurance |
| Under 6 | 296 (35.3%) | 537 (64.1%) |
| 6 to 18 Years | 333 (13.8%) | 2,118 (87.9%) |
| 19 to 25 Years | 81 (4.0%) | 1,835 (91.5%) |
| 25 to 34 Years | 156 (13.7%) | 862 (75.9%) |
| 35 to 44 Years | 115 (8.9%) | 1,150 (89.2%) |
| 45 to 54 Years | 43 (4.0%) | 1,036 (95.7%) |
| 55 to 64 Years | 115 (11.3%) | 931 (91.5%) |
| 65 to 74 Years | 564 (95.1%) | 314 (52.9%) |
| 75 Years and over | 470 (100.0%) | 223 (47.4%) |
| Total | 2,173 (20.0%) | 9,006 (83.1%) |
Disability Status by Sex by Age in North Logan
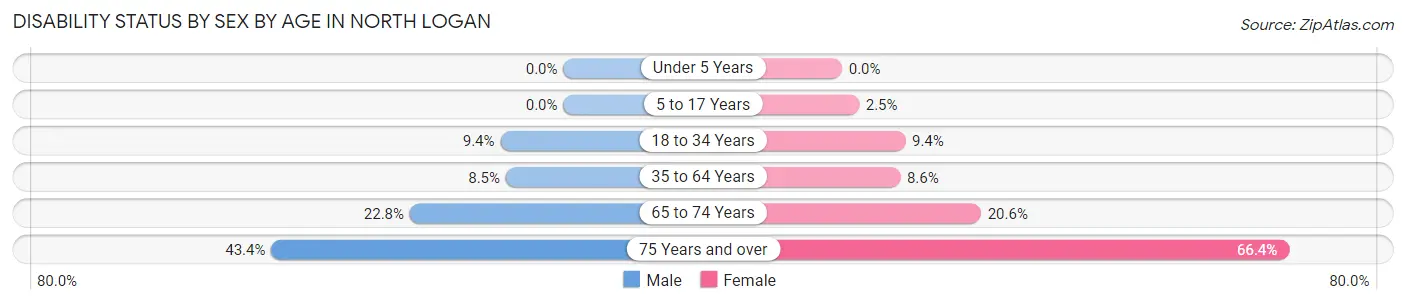
| Age Bracket | Male | Female |
| Under 5 Years | 0 (0.0%) | 0 (0.0%) |
| 5 to 17 Years | 0 (0.0%) | 29 (2.5%) |
| 18 to 34 Years | 163 (9.3%) | 145 (9.4%) |
| 35 to 64 Years | 153 (8.5%) | 138 (8.6%) |
| 65 to 74 Years | 49 (22.8%) | 78 (20.6%) |
| 75 Years and over | 85 (43.4%) | 182 (66.4%) |
Disability Class by Sex by Age in North Logan
Disability Class: Hearing Difficulty
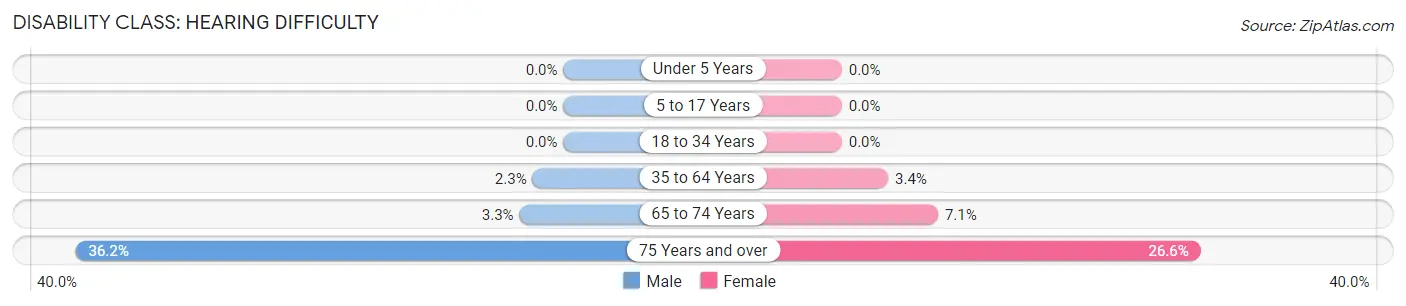
| Age Bracket | Male | Female |
| Under 5 Years | 0 (0.0%) | 0 (0.0%) |
| 5 to 17 Years | 0 (0.0%) | 0 (0.0%) |
| 18 to 34 Years | 0 (0.0%) | 0 (0.0%) |
| 35 to 64 Years | 41 (2.3%) | 55 (3.4%) |
| 65 to 74 Years | 7 (3.3%) | 27 (7.1%) |
| 75 Years and over | 71 (36.2%) | 73 (26.6%) |
Disability Class: Vision Difficulty
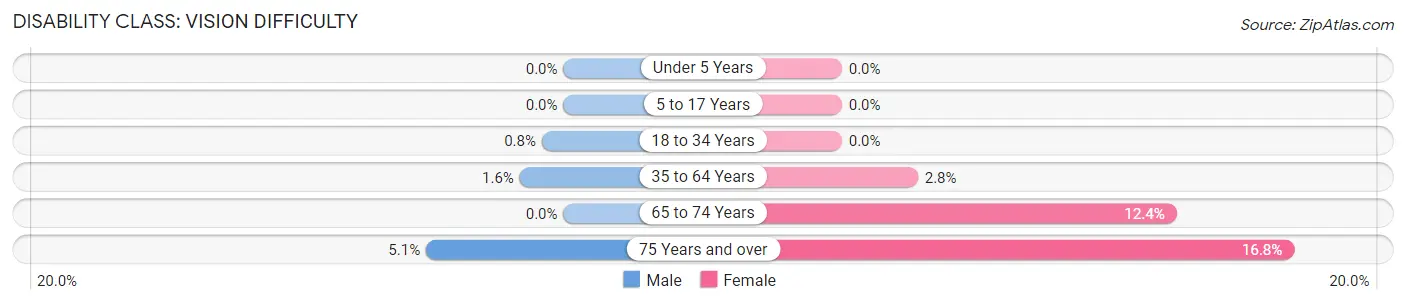
| Age Bracket | Male | Female |
| Under 5 Years | 0 (0.0%) | 0 (0.0%) |
| 5 to 17 Years | 0 (0.0%) | 0 (0.0%) |
| 18 to 34 Years | 14 (0.8%) | 0 (0.0%) |
| 35 to 64 Years | 29 (1.6%) | 45 (2.8%) |
| 65 to 74 Years | 0 (0.0%) | 47 (12.4%) |
| 75 Years and over | 10 (5.1%) | 46 (16.8%) |
Disability Class: Cognitive Difficulty
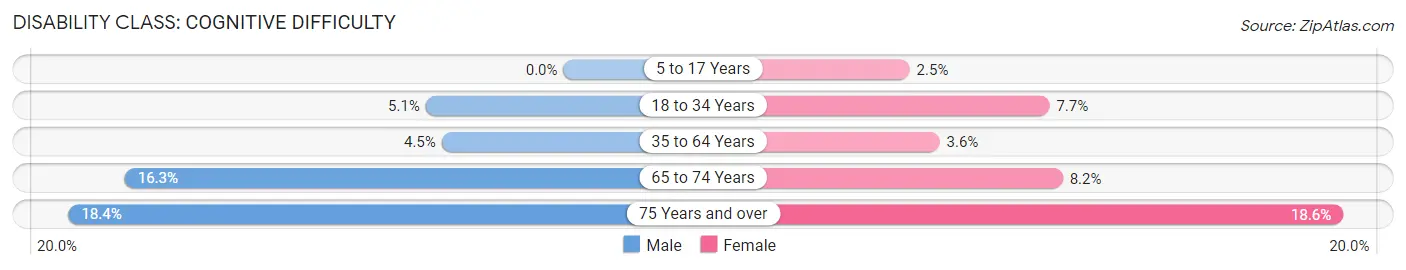
| Age Bracket | Male | Female |
| 5 to 17 Years | 0 (0.0%) | 29 (2.5%) |
| 18 to 34 Years | 89 (5.1%) | 119 (7.7%) |
| 35 to 64 Years | 81 (4.5%) | 58 (3.6%) |
| 65 to 74 Years | 35 (16.3%) | 31 (8.2%) |
| 75 Years and over | 36 (18.4%) | 51 (18.6%) |
Disability Class: Ambulatory Difficulty
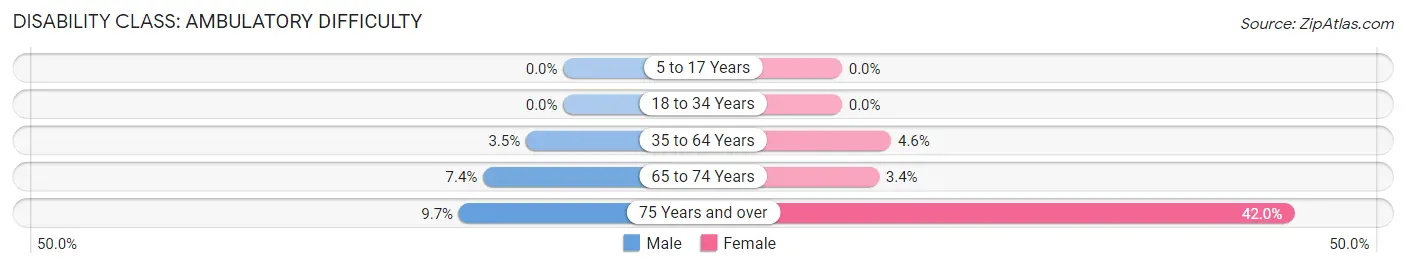
| Age Bracket | Male | Female |
| 5 to 17 Years | 0 (0.0%) | 0 (0.0%) |
| 18 to 34 Years | 0 (0.0%) | 0 (0.0%) |
| 35 to 64 Years | 62 (3.5%) | 73 (4.6%) |
| 65 to 74 Years | 16 (7.4%) | 13 (3.4%) |
| 75 Years and over | 19 (9.7%) | 115 (42.0%) |
Disability Class: Self-Care Difficulty
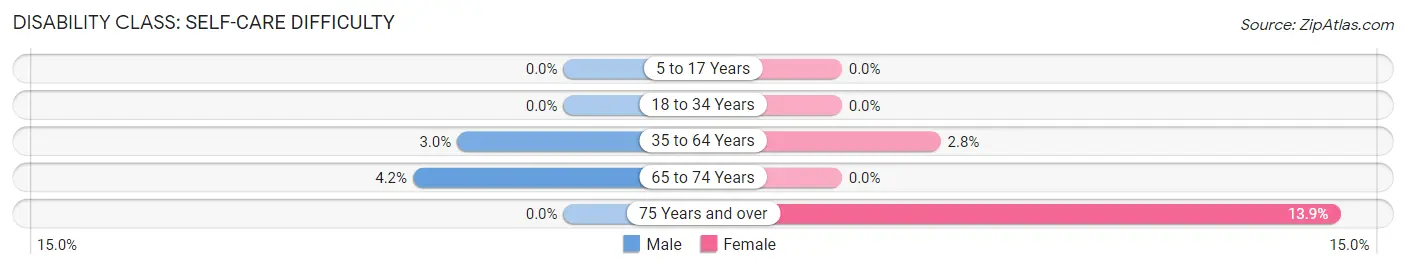
| Age Bracket | Male | Female |
| 5 to 17 Years | 0 (0.0%) | 0 (0.0%) |
| 18 to 34 Years | 0 (0.0%) | 0 (0.0%) |
| 35 to 64 Years | 53 (3.0%) | 44 (2.8%) |
| 65 to 74 Years | 9 (4.2%) | 0 (0.0%) |
| 75 Years and over | 0 (0.0%) | 38 (13.9%) |
Technology Access in North Logan
Computing Device Access in North Logan
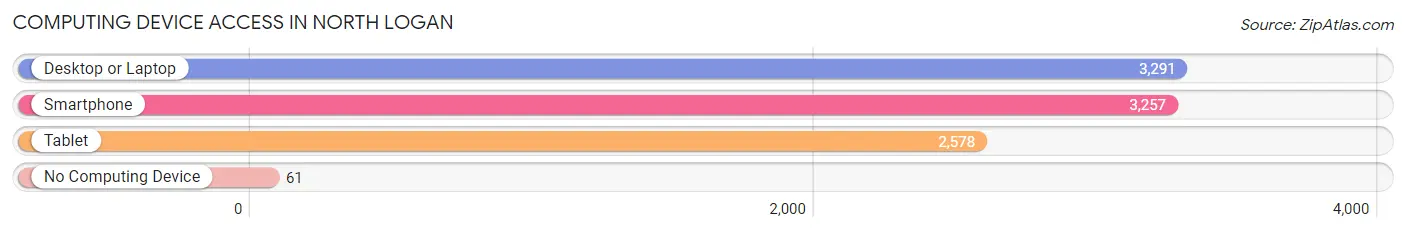
| Device Type | # Households | % Households |
| Desktop or Laptop | 3,291 | 92.8% |
| Smartphone | 3,257 | 91.8% |
| Tablet | 2,578 | 72.7% |
| No Computing Device | 61 | 1.7% |
| Total | 3,546 | 100.0% |
Internet Access in North Logan
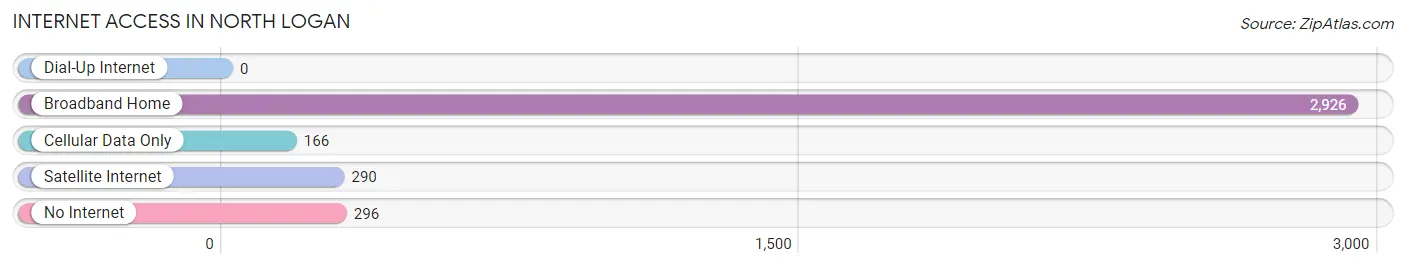
| Internet Type | # Households | % Households |
| Dial-Up Internet | 0 | 0.0% |
| Broadband Home | 2,926 | 82.5% |
| Cellular Data Only | 166 | 4.7% |
| Satellite Internet | 290 | 8.2% |
| No Internet | 296 | 8.4% |
| Total | 3,546 | 100.0% |
North Logan Summary
Logan, Utah is a city located in Cache County, Utah, United States. It is the county seat of Cache County and the principal city of the Logan, UT-ID Metropolitan Statistical Area, which includes Cache County and Franklin County, Idaho. The population of Logan was 48,174 at the 2010 census, with an estimated population of 49,919 in 2018.
History
The area that is now Logan was originally inhabited by the Shoshone and Ute Native American tribes. The first European settlers arrived in the area in 1859, led by Peter Maughan. Maughan and his group of settlers established a fort in the area, which they named Logan Fort. The fort was later abandoned in 1861, but the settlement of Logan was established in 1862.
The city was named after Ephraim Logan, a fur trapper who had been killed in the area in 1855. The city was incorporated in 1866 and was designated as the county seat of Cache County in 1868.
Geography
Logan is located in northern Utah, at the western edge of the Wasatch Range. It is situated at the junction of the Logan and Little Bear rivers, and is surrounded by mountains on all sides. The city is located approximately 85 miles north of Salt Lake City, and is about a two-hour drive from the Idaho border.
The city has a total area of 11.2 square miles, of which 11.1 square miles is land and 0.1 square miles is water.
Economy
Logan's economy is largely based on agriculture, manufacturing, and education. The city is home to Utah State University, which is the state's largest public university. The university is a major employer in the city, and provides a significant economic boost to the local economy.
The city is also home to several manufacturing companies, including a large paper mill and a large food processing plant. Agriculture is also an important part of the local economy, with dairy farming and cattle ranching being the two main agricultural activities.
Demographics
As of the 2010 census, there were 48,174 people, 14,845 households, and 9,945 families residing in the city. The population density was 4,310.3 people per square mile. The racial makeup of the city was 91.2% White, 0.7% African American, 0.7% Native American, 1.3% Asian, 0.2% Pacific Islander, 3.2% from other races, and 2.9% from two or more races. Hispanic or Latino of any race were 8.2% of the population.
The median income for a household in the city was $37,945, and the median income for a family was $48,945. The per capita income for the city was $17,945. About 11.2% of families and 16.2% of the population were below the poverty line, including 20.2% of those under age 18 and 8.2% of those age 65 or over.
Common Questions
What is Per Capita Income in North Logan?
Per Capita income in North Logan is $35,048.
What is the Median Family Income in North Logan?
Median Family Income in North Logan is $97,920.
What is the Median Household income in North Logan?
Median Household Income in North Logan is $80,597.
What is Income or Wage Gap in North Logan?
Income or Wage Gap in North Logan is 52.9%.
Women in North Logan earn 47.1 cents for every dollar earned by a man.
What is Inequality or Gini Index in North Logan?
Inequality or Gini Index in North Logan is 0.46.
What is the Total Population of North Logan?
Total Population of North Logan is 10,981.
What is the Total Male Population of North Logan?
Total Male Population of North Logan is 5,530.
What is the Total Female Population of North Logan?
Total Female Population of North Logan is 5,451.
What is the Ratio of Males per 100 Females in North Logan?
There are 101.45 Males per 100 Females in North Logan.
What is the Ratio of Females per 100 Males in North Logan?
There are 98.57 Females per 100 Males in North Logan.
What is the Median Population Age in North Logan?
Median Population Age in North Logan is 27.6 Years.
What is the Average Family Size in North Logan
Average Family Size in North Logan is 3.5 People.
What is the Average Household Size in North Logan
Average Household Size in North Logan is 3.1 People.
How Large is the Labor Force in North Logan?
There are 5,631 People in the Labor Forcein in North Logan.
What is the Percentage of People in the Labor Force in North Logan?
67.7% of People are in the Labor Force in North Logan.
What is the Unemployment Rate in North Logan?
Unemployment Rate in North Logan is 2.2%.