Zip Codes with the Highest Percentage of Population Employed in Food Preparation & Serving in Utah
RELATED REPORTS & OPTIONS
Food Preparation & Serving
Utah
Compare Zip Codes
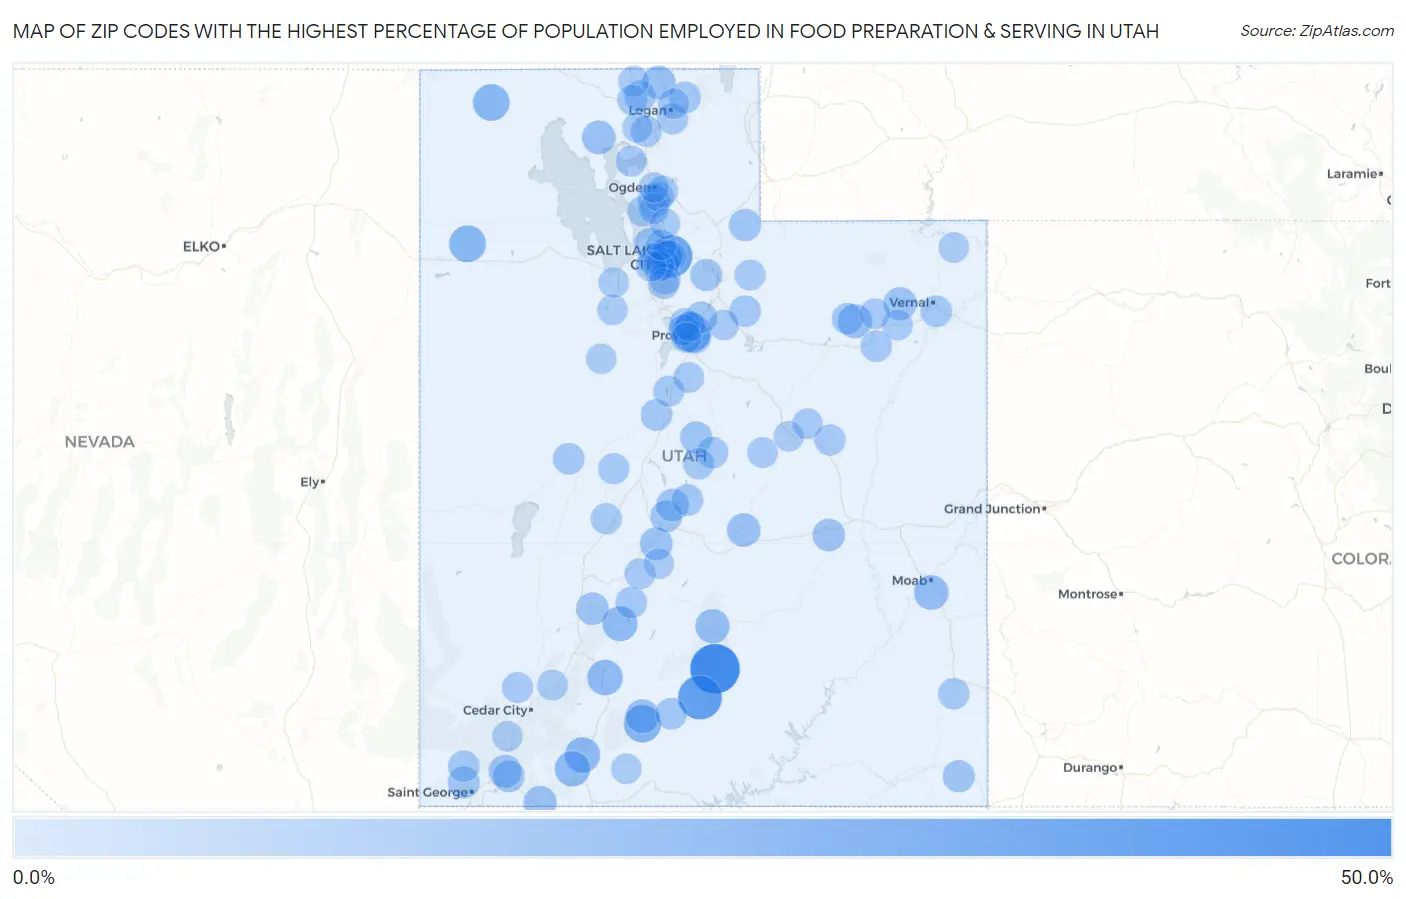
Map of Zip Codes with the Highest Percentage of Population Employed in Food Preparation & Serving in Utah
0.0%
50.0%
Zip Codes with the Highest Percentage of Population Employed in Food Preparation & Serving in Utah
| Zip Code | % Employed | vs State | vs National | |
| 1. | 84716 | 40.3% | 4.5%(+35.8)#1 | 5.3%(+35.1)#102 |
| 2. | 84726 | 29.7% | 4.5%(+25.1)#2 | 5.3%(+24.4)#220 |
| 3. | 84113 | 26.7% | 4.5%(+22.2)#3 | 5.3%(+21.4)#270 |
| 4. | 84602 | 20.7% | 4.5%(+16.2)#4 | 5.3%(+15.5)#465 |
| 5. | 84718 | 17.3% | 4.5%(+12.7)#5 | 5.3%(+12.0)#724 |
| 6. | 84083 | 16.3% | 4.5%(+11.8)#6 | 5.3%(+11.1)#816 |
| 7. | 84329 | 16.1% | 4.5%(+11.6)#7 | 5.3%(+10.8)#848 |
| 8. | 84729 | 13.8% | 4.5%(+9.28)#8 | 5.3%(+8.53)#1,203 |
| 9. | 84759 | 13.7% | 4.5%(+9.14)#9 | 5.3%(+8.39)#1,238 |
| 10. | 84758 | 13.7% | 4.5%(+9.12)#10 | 5.3%(+8.37)#1,240 |
| 11. | 84740 | 13.0% | 4.5%(+8.43)#11 | 5.3%(+7.68)#1,400 |
| 12. | 84532 | 12.3% | 4.5%(+7.77)#12 | 5.3%(+7.02)#1,566 |
| 13. | 84773 | 11.8% | 4.5%(+7.23)#13 | 5.3%(+6.48)#1,752 |
| 14. | 84007 | 11.4% | 4.5%(+6.86)#14 | 5.3%(+6.11)#1,880 |
| 15. | 84776 | 11.1% | 4.5%(+6.57)#15 | 5.3%(+5.83)#2,000 |
| 16. | 84307 | 10.6% | 4.5%(+6.04)#16 | 5.3%(+5.30)#2,279 |
| 17. | 84338 | 10.3% | 4.5%(+5.80)#17 | 5.3%(+5.05)#2,405 |
| 18. | 84522 | 10.3% | 4.5%(+5.75)#18 | 5.3%(+5.00)#2,432 |
| 19. | 84039 | 10.0% | 4.5%(+5.46)#19 | 5.3%(+4.71)#2,635 |
| 20. | 84784 | 9.6% | 4.5%(+5.08)#20 | 5.3%(+4.33)#2,952 |
| 21. | 84657 | 9.4% | 4.5%(+4.88)#21 | 5.3%(+4.13)#3,117 |
| 22. | 84774 | 9.4% | 4.5%(+4.83)#22 | 5.3%(+4.08)#3,172 |
| 23. | 84056 | 8.9% | 4.5%(+4.39)#23 | 5.3%(+3.65)#3,591 |
| 24. | 84111 | 8.7% | 4.5%(+4.16)#24 | 5.3%(+3.41)#3,863 |
| 25. | 84622 | 8.7% | 4.5%(+4.15)#25 | 5.3%(+3.40)#3,874 |
| 26. | 84525 | 8.7% | 4.5%(+4.14)#26 | 5.3%(+3.39)#3,884 |
| 27. | 84713 | 8.6% | 4.5%(+4.08)#27 | 5.3%(+3.33)#3,942 |
| 28. | 84112 | 8.6% | 4.5%(+4.03)#28 | 5.3%(+3.28)#4,005 |
| 29. | 84017 | 8.4% | 4.5%(+3.86)#29 | 5.3%(+3.11)#4,182 |
| 30. | 84646 | 8.0% | 4.5%(+3.48)#30 | 5.3%(+2.73)#4,702 |
| 31. | 84534 | 7.9% | 4.5%(+3.40)#31 | 5.3%(+2.65)#4,826 |
| 32. | 84745 | 7.8% | 4.5%(+3.25)#32 | 5.3%(+2.51)#5,073 |
| 33. | 84606 | 7.8% | 4.5%(+3.22)#33 | 5.3%(+2.47)#5,127 |
| 34. | 84060 | 7.7% | 4.5%(+3.20)#34 | 5.3%(+2.45)#5,160 |
| 35. | 84770 | 7.6% | 4.5%(+3.04)#35 | 5.3%(+2.29)#5,414 |
| 36. | 84115 | 7.5% | 4.5%(+2.93)#36 | 5.3%(+2.18)#5,628 |
| 37. | 84604 | 7.3% | 4.5%(+2.77)#37 | 5.3%(+2.02)#5,913 |
| 38. | 84652 | 7.3% | 4.5%(+2.76)#38 | 5.3%(+2.01)#5,933 |
| 39. | 84116 | 7.2% | 4.5%(+2.68)#39 | 5.3%(+1.93)#6,091 |
| 40. | 84104 | 7.2% | 4.5%(+2.61)#40 | 5.3%(+1.87)#6,227 |
| 41. | 84078 | 7.1% | 4.5%(+2.56)#41 | 5.3%(+1.81)#6,350 |
| 42. | 84648 | 7.0% | 4.5%(+2.47)#42 | 5.3%(+1.72)#6,558 |
| 43. | 84635 | 7.0% | 4.5%(+2.44)#43 | 5.3%(+1.70)#6,610 |
| 44. | 84643 | 7.0% | 4.5%(+2.42)#44 | 5.3%(+1.67)#6,663 |
| 45. | 84311 | 6.9% | 4.5%(+2.41)#45 | 5.3%(+1.66)#6,700 |
| 46. | 84032 | 6.9% | 4.5%(+2.40)#46 | 5.3%(+1.65)#6,716 |
| 47. | 84321 | 6.9% | 4.5%(+2.40)#47 | 5.3%(+1.65)#6,718 |
| 48. | 84783 | 6.9% | 4.5%(+2.38)#48 | 5.3%(+1.63)#6,784 |
| 49. | 84102 | 6.9% | 4.5%(+2.37)#49 | 5.3%(+1.62)#6,805 |
| 50. | 84736 | 6.9% | 4.5%(+2.36)#50 | 5.3%(+1.61)#6,833 |
| 51. | 84662 | 6.9% | 4.5%(+2.35)#51 | 5.3%(+1.60)#6,858 |
| 52. | 84750 | 6.8% | 4.5%(+2.31)#52 | 5.3%(+1.56)#6,939 |
| 53. | 84001 | 6.7% | 4.5%(+2.20)#53 | 5.3%(+1.45)#7,249 |
| 54. | 84052 | 6.5% | 4.5%(+1.95)#54 | 5.3%(+1.20)#7,925 |
| 55. | 84047 | 6.4% | 4.5%(+1.88)#55 | 5.3%(+1.13)#8,093 |
| 56. | 84535 | 6.4% | 4.5%(+1.82)#56 | 5.3%(+1.07)#8,261 |
| 57. | 84627 | 6.3% | 4.5%(+1.76)#57 | 5.3%(+1.01)#8,439 |
| 58. | 84649 | 6.1% | 4.5%(+1.52)#58 | 5.3%(+0.775)#9,139 |
| 59. | 84520 | 6.0% | 4.5%(+1.51)#59 | 5.3%(+0.758)#9,191 |
| 60. | 84057 | 6.0% | 4.5%(+1.49)#60 | 5.3%(+0.742)#9,247 |
| 61. | 84631 | 6.0% | 4.5%(+1.49)#61 | 5.3%(+0.738)#9,262 |
| 62. | 84645 | 6.0% | 4.5%(+1.43)#62 | 5.3%(+0.678)#9,460 |
| 63. | 84326 | 6.0% | 4.5%(+1.42)#63 | 5.3%(+0.672)#9,477 |
| 64. | 84302 | 5.9% | 4.5%(+1.37)#64 | 5.3%(+0.626)#9,634 |
| 65. | 84058 | 5.9% | 4.5%(+1.32)#65 | 5.3%(+0.576)#9,809 |
| 66. | 84403 | 5.8% | 4.5%(+1.25)#66 | 5.3%(+0.497)#10,085 |
| 67. | 84754 | 5.7% | 4.5%(+1.18)#67 | 5.3%(+0.428)#10,281 |
| 68. | 84721 | 5.7% | 4.5%(+1.14)#68 | 5.3%(+0.387)#10,448 |
| 69. | 84330 | 5.5% | 4.5%(+0.988)#69 | 5.3%(+0.239)#10,981 |
| 70. | 84026 | 5.5% | 4.5%(+0.971)#70 | 5.3%(+0.222)#11,039 |
| 71. | 84036 | 5.5% | 4.5%(+0.970)#71 | 5.3%(+0.221)#11,042 |
| 72. | 84119 | 5.5% | 4.5%(+0.956)#72 | 5.3%(+0.207)#11,087 |
| 73. | 84761 | 5.5% | 4.5%(+0.934)#73 | 5.3%(+0.185)#11,152 |
| 74. | 84070 | 5.5% | 4.5%(+0.920)#74 | 5.3%(+0.171)#11,196 |
| 75. | 84340 | 5.5% | 4.5%(+0.913)#75 | 5.3%(+0.164)#11,224 |
| 76. | 84341 | 5.3% | 4.5%(+0.793)#76 | 5.3%(+0.045)#11,650 |
| 77. | 84082 | 5.3% | 4.5%(+0.749)#77 | 5.3%(+0.000)#11,819 |
| 78. | 84120 | 5.2% | 4.5%(+0.662)#78 | 5.3%(-0.087)#12,145 |
| 79. | 84054 | 5.2% | 4.5%(+0.646)#79 | 5.3%(-0.103)#12,226 |
| 80. | 84312 | 5.2% | 4.5%(+0.632)#80 | 5.3%(-0.117)#12,280 |
| 81. | 84651 | 5.2% | 4.5%(+0.626)#81 | 5.3%(-0.122)#12,303 |
| 82. | 84542 | 5.2% | 4.5%(+0.614)#82 | 5.3%(-0.135)#12,356 |
| 83. | 84528 | 5.2% | 4.5%(+0.613)#83 | 5.3%(-0.135)#12,360 |
| 84. | 84075 | 5.1% | 4.5%(+0.524)#84 | 5.3%(-0.225)#12,685 |
| 85. | 84066 | 5.0% | 4.5%(+0.483)#85 | 5.3%(-0.266)#12,870 |
| 86. | 84041 | 5.0% | 4.5%(+0.473)#86 | 5.3%(-0.276)#12,910 |
| 87. | 84071 | 5.0% | 4.5%(+0.444)#87 | 5.3%(-0.305)#13,028 |
| 88. | 84701 | 4.9% | 4.5%(+0.398)#88 | 5.3%(-0.351)#13,207 |
| 89. | 84720 | 4.9% | 4.5%(+0.384)#89 | 5.3%(-0.365)#13,258 |
| 90. | 84501 | 4.9% | 4.5%(+0.383)#90 | 5.3%(-0.366)#13,262 |
| 91. | 84023 | 4.9% | 4.5%(+0.381)#91 | 5.3%(-0.368)#13,279 |
| 92. | 84097 | 4.9% | 4.5%(+0.367)#92 | 5.3%(-0.382)#13,327 |
| 93. | 84405 | 4.9% | 4.5%(+0.354)#93 | 5.3%(-0.395)#13,391 |
| 94. | 84301 | 4.9% | 4.5%(+0.315)#94 | 5.3%(-0.434)#13,554 |
| 95. | 84401 | 4.8% | 4.5%(+0.291)#95 | 5.3%(-0.457)#13,643 |
| 96. | 84025 | 4.8% | 4.5%(+0.286)#96 | 5.3%(-0.463)#13,666 |
| 97. | 84080 | 4.8% | 4.5%(+0.282)#97 | 5.3%(-0.467)#13,684 |
| 98. | 84601 | 4.8% | 4.5%(+0.236)#98 | 5.3%(-0.513)#13,853 |
| 99. | 84074 | 4.8% | 4.5%(+0.217)#99 | 5.3%(-0.532)#13,940 |
| 100. | 84741 | 4.7% | 4.5%(+0.116)#100 | 5.3%(-0.633)#14,352 |
Common Questions
What are the Top 10 Zip Codes with the Highest Percentage of Population Employed in Food Preparation & Serving in Utah?
Top 10 Zip Codes with the Highest Percentage of Population Employed in Food Preparation & Serving in Utah are:
What zip code has the Highest Percentage of Population Employed in Food Preparation & Serving in Utah?
84716 has the Highest Percentage of Population Employed in Food Preparation & Serving in Utah with 40.3%.
What is the Percentage of Population Employed in Food Preparation & Serving in the State of Utah?
Percentage of Population Employed in Food Preparation & Serving in Utah is 4.5%.
What is the Percentage of Population Employed in Food Preparation & Serving in the United States?
Percentage of Population Employed in Food Preparation & Serving in the United States is 5.3%.