Hoytsville, UT Map & Demographics
Hoytsville Map
Hoytsville Overview
$34,132
PER CAPITA INCOME
$85,547
AVG FAMILY INCOME
$67,708
AVG HOUSEHOLD INCOME
50.2%
WAGE / INCOME GAP [ % ]
49.8¢/ $1
WAGE / INCOME GAP [ $ ]
0.44
INEQUALITY / GINI INDEX
769
TOTAL POPULATION
400
MALE POPULATION
369
FEMALE POPULATION
108.40
MALES / 100 FEMALES
92.25
FEMALES / 100 MALES
48.6
MEDIAN AGE
3.1
AVG FAMILY SIZE
2.9
AVG HOUSEHOLD SIZE
252
LABOR FORCE [ PEOPLE ]
42.7%
PERCENT IN LABOR FORCE
6.0%
UNEMPLOYMENT RATE
Income in Hoytsville
Income Overview in Hoytsville
Per Capita Income in Hoytsville is $34,132, while median incomes of families and households are $85,547 and $67,708 respectively.
| Characteristic | Number | Measure |
| Per Capita Income | 769 | $34,132 |
| Median Family Income | 229 | $85,547 |
| Mean Family Income | 229 | $101,086 |
| Median Household Income | 269 | $67,708 |
| Mean Household Income | 269 | $95,245 |
| Income Deficit | 229 | $0 |
| Wage / Income Gap (%) | 769 | 50.17% |
| Wage / Income Gap ($) | 769 | 49.83¢ per $1 |
| Gini / Inequality Index | 769 | 0.44 |
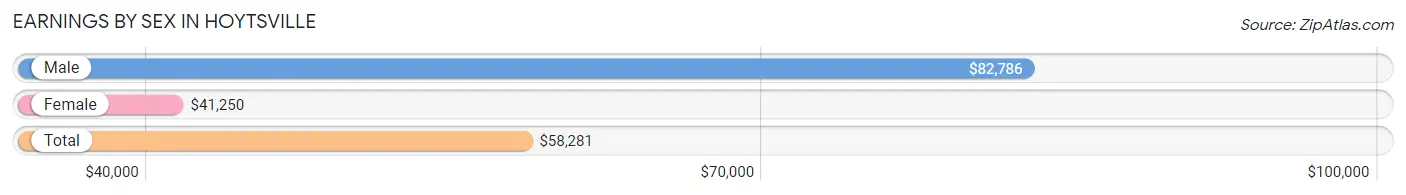
Earnings by Sex in Hoytsville
Average Earnings in Hoytsville are $58,281, $82,786 for men and $41,250 for women, a difference of 50.2%.
| Sex | Number | Average Earnings |
| Male | 172 (62.5%) | $82,786 |
| Female | 103 (37.4%) | $41,250 |
| Total | 275 (100.0%) | $58,281 |
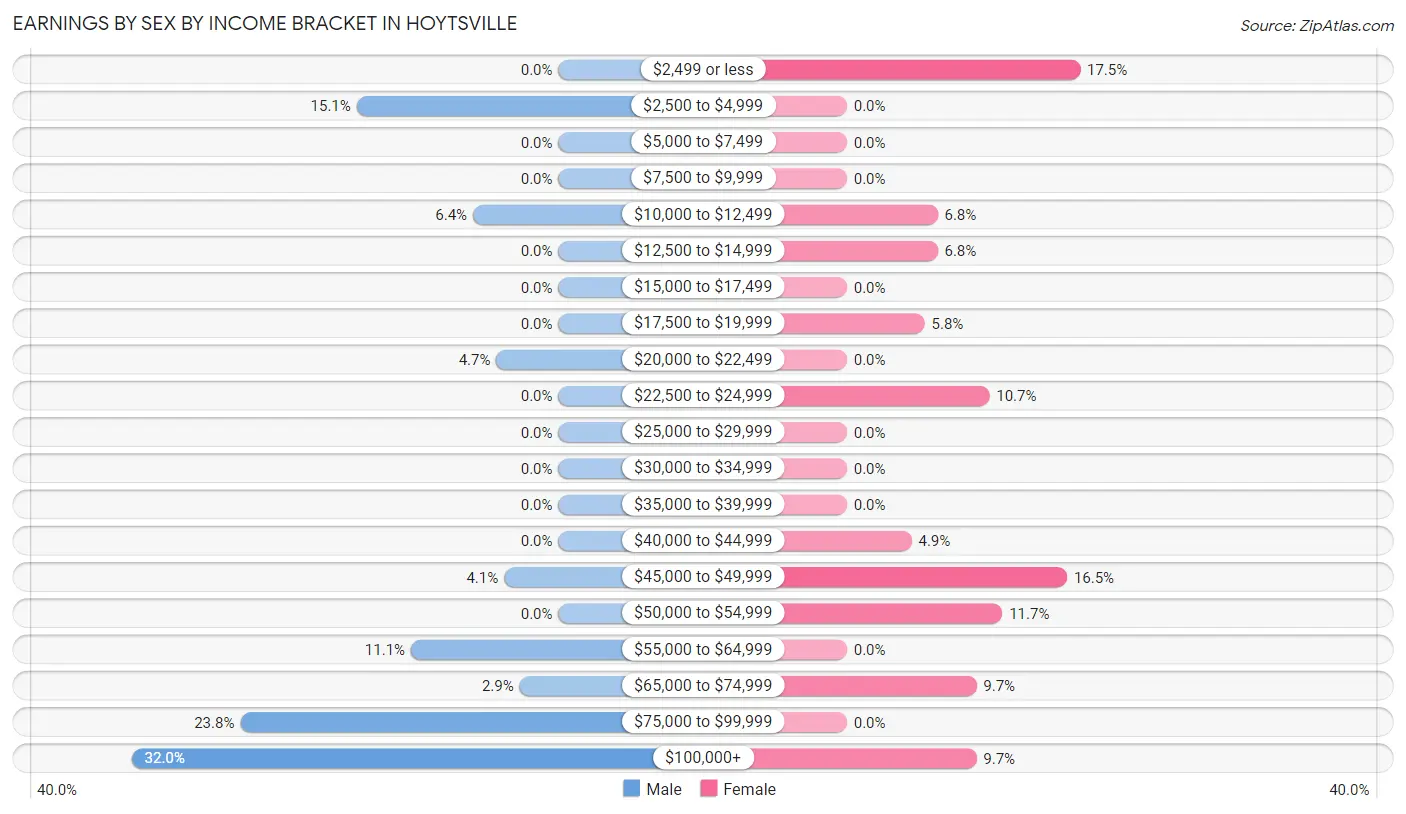
Earnings by Sex by Income Bracket in Hoytsville
The most common earnings brackets in Hoytsville are $100,000+ for men (55 | 32.0%) and $2,499 or less for women (18 | 17.5%).
| Income | Male | Female |
| $2,499 or less | 0 (0.0%) | 18 (17.5%) |
| $2,500 to $4,999 | 26 (15.1%) | 0 (0.0%) |
| $5,000 to $7,499 | 0 (0.0%) | 0 (0.0%) |
| $7,500 to $9,999 | 0 (0.0%) | 0 (0.0%) |
| $10,000 to $12,499 | 11 (6.4%) | 7 (6.8%) |
| $12,500 to $14,999 | 0 (0.0%) | 7 (6.8%) |
| $15,000 to $17,499 | 0 (0.0%) | 0 (0.0%) |
| $17,500 to $19,999 | 0 (0.0%) | 6 (5.8%) |
| $20,000 to $22,499 | 8 (4.6%) | 0 (0.0%) |
| $22,500 to $24,999 | 0 (0.0%) | 11 (10.7%) |
| $25,000 to $29,999 | 0 (0.0%) | 0 (0.0%) |
| $30,000 to $34,999 | 0 (0.0%) | 0 (0.0%) |
| $35,000 to $39,999 | 0 (0.0%) | 0 (0.0%) |
| $40,000 to $44,999 | 0 (0.0%) | 5 (4.9%) |
| $45,000 to $49,999 | 7 (4.1%) | 17 (16.5%) |
| $50,000 to $54,999 | 0 (0.0%) | 12 (11.7%) |
| $55,000 to $64,999 | 19 (11.1%) | 0 (0.0%) |
| $65,000 to $74,999 | 5 (2.9%) | 10 (9.7%) |
| $75,000 to $99,999 | 41 (23.8%) | 0 (0.0%) |
| $100,000+ | 55 (32.0%) | 10 (9.7%) |
| Total | 172 (100.0%) | 103 (100.0%) |
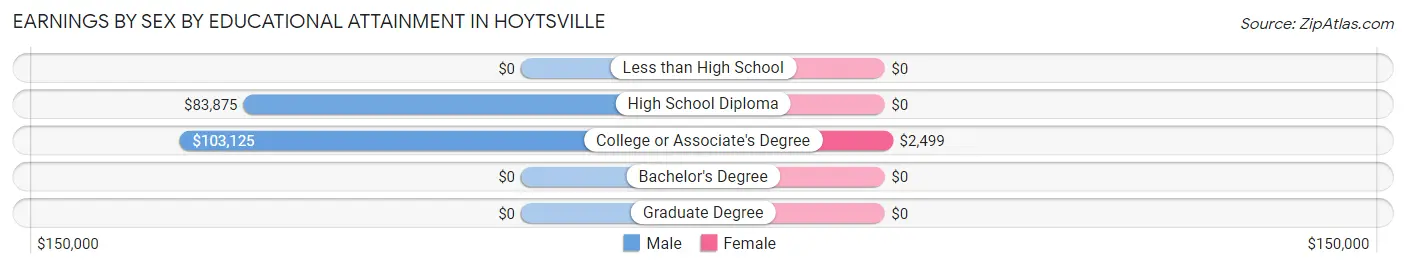
Earnings by Sex by Educational Attainment in Hoytsville
Average earnings in Hoytsville are $84,107 for men and $41,250 for women, a difference of 51.0%. Men with an educational attainment of college or associate's degree enjoy the highest average annual earnings of $103,125, while those with high school diploma education earn the least with $83,875. Women with an educational attainment of college or associate's degree earn the most with the average annual earnings of $2,499, while those with college or associate's degree education have the smallest earnings of $2,499.
| Educational Attainment | Male Income | Female Income |
| Less than High School | - | - |
| High School Diploma | $83,875 | $0 |
| College or Associate's Degree | $103,125 | $2,499 |
| Bachelor's Degree | - | - |
| Graduate Degree | - | - |
| Total | $84,107 | $41,250 |
Family Income in Hoytsville
Family Income Brackets in Hoytsville
According to the Hoytsville family income data, there are 77 families falling into the $25,000 to $34,999 income range, which is the most common income bracket and makes up 33.6% of all families.
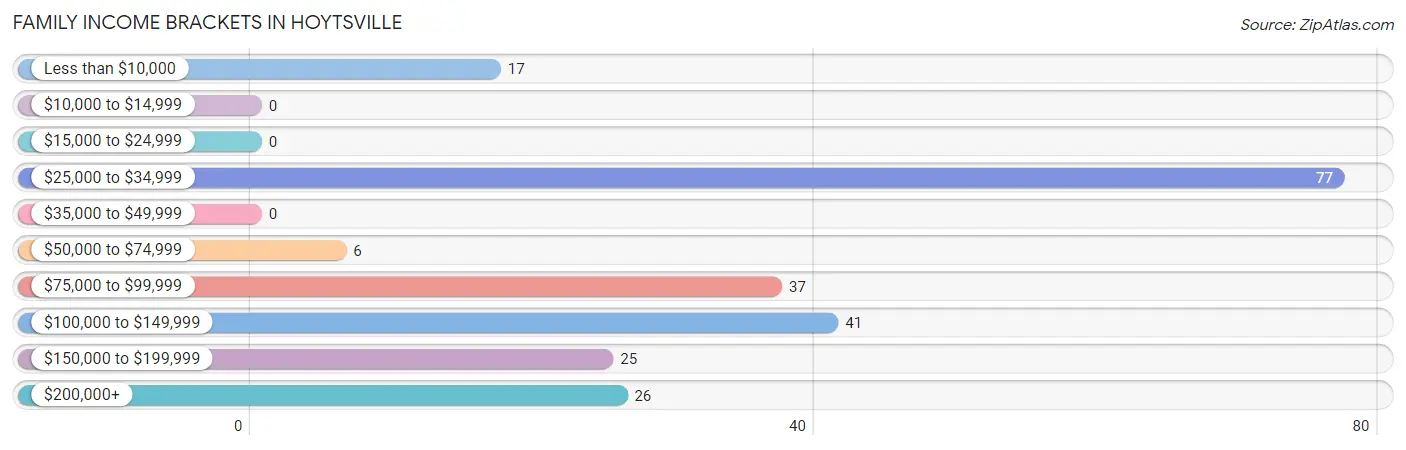
| Income Bracket | # Families | % Families |
| Less than $10,000 | 17 | 7.4% |
| $10,000 to $14,999 | 0 | 0.0% |
| $15,000 to $24,999 | 0 | 0.0% |
| $25,000 to $34,999 | 77 | 33.6% |
| $35,000 to $49,999 | 0 | 0.0% |
| $50,000 to $74,999 | 6 | 2.6% |
| $75,000 to $99,999 | 37 | 16.2% |
| $100,000 to $149,999 | 41 | 17.9% |
| $150,000 to $199,999 | 25 | 10.9% |
| $200,000+ | 26 | 11.4% |
Family Income by Famaliy Size in Hoytsville
4-person families (29 | 12.7%) account for the highest median family income in Hoytsville with $130,083 per family, while 4-person families (29 | 12.7%) have the highest median income of $32,521 per family member.
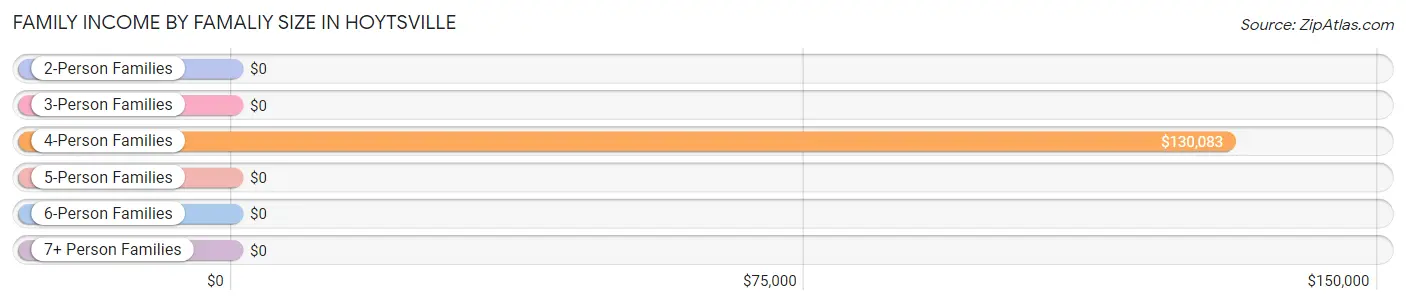
| Income Bracket | # Families | Median Income |
| 2-Person Families | 162 (70.7%) | $0 |
| 3-Person Families | 5 (2.2%) | $0 |
| 4-Person Families | 29 (12.7%) | $130,083 |
| 5-Person Families | 23 (10.0%) | $0 |
| 6-Person Families | 10 (4.4%) | $0 |
| 7+ Person Families | 0 (0.0%) | $0 |
| Total | 229 (100.0%) | $85,547 |
Family Income by Number of Earners in Hoytsville
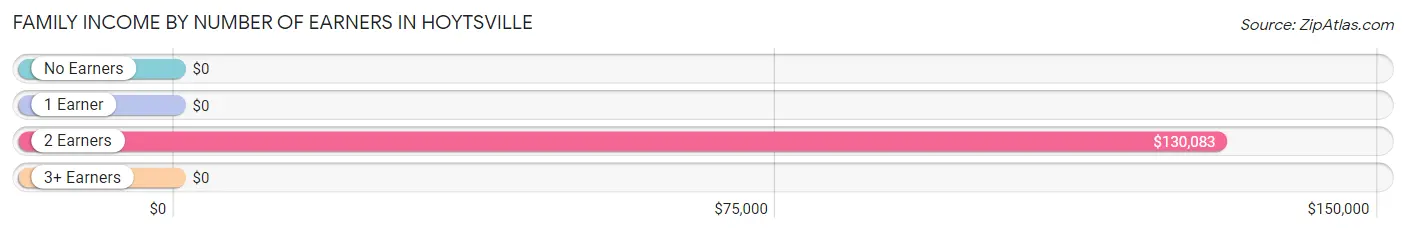
| Number of Earners | # Families | Median Income |
| No Earners | 102 (44.5%) | $0 |
| 1 Earner | 36 (15.7%) | $0 |
| 2 Earners | 83 (36.2%) | $130,083 |
| 3+ Earners | 8 (3.5%) | $0 |
| Total | 229 (100.0%) | $85,547 |
Household Income in Hoytsville
Household Income Brackets in Hoytsville
With 69 households falling in the category, the $25,000 to $34,999 income range is the most frequent in Hoytsville, accounting for 25.7% of all households.
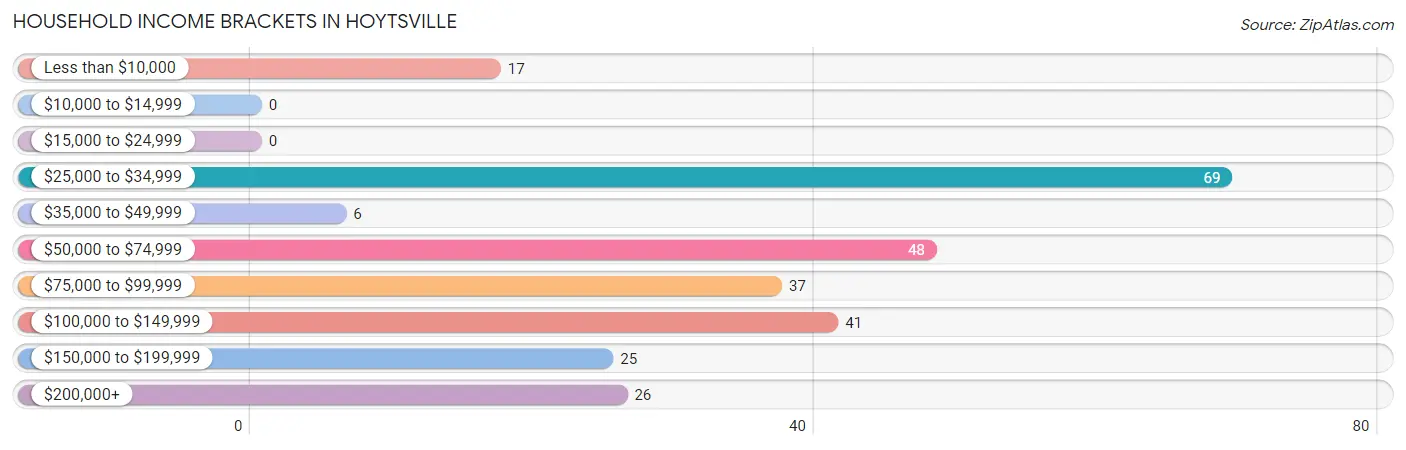
| Income Bracket | # Households | % Households |
| Less than $10,000 | 17 | 6.3% |
| $10,000 to $14,999 | 0 | 0.0% |
| $15,000 to $24,999 | 0 | 0.0% |
| $25,000 to $34,999 | 69 | 25.7% |
| $35,000 to $49,999 | 6 | 2.2% |
| $50,000 to $74,999 | 48 | 17.8% |
| $75,000 to $99,999 | 37 | 13.8% |
| $100,000 to $149,999 | 41 | 15.2% |
| $150,000 to $199,999 | 25 | 9.3% |
| $200,000+ | 26 | 9.7% |
Household Income by Householder Age in Hoytsville
The median household income in Hoytsville is $67,708, with the highest median household income of $77,292 found in the 25 to 44 years age bracket for the primary householder. A total of 57 households (21.2%) fall into this category.
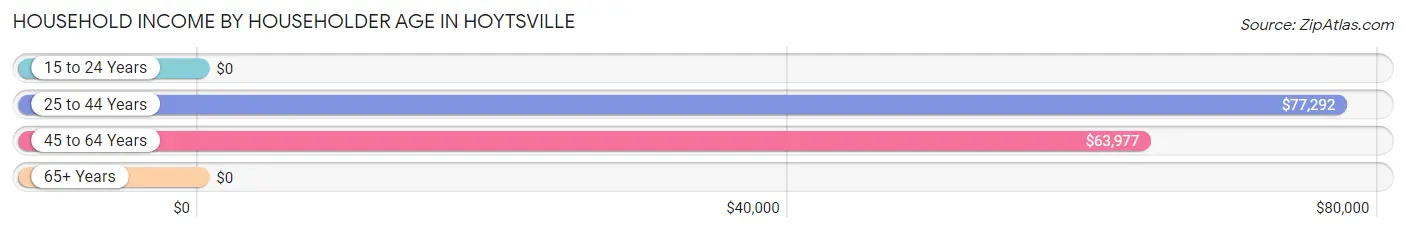
| Income Bracket | # Households | Median Income |
| 15 to 24 Years | 0 (0.0%) | $0 |
| 25 to 44 Years | 57 (21.2%) | $77,292 |
| 45 to 64 Years | 167 (62.1%) | $63,977 |
| 65+ Years | 45 (16.7%) | $0 |
| Total | 269 (100.0%) | $67,708 |
Poverty in Hoytsville
Income Below Poverty by Sex and Age in Hoytsville
With 17.7% poverty level for males and 10.0% for females among the residents of Hoytsville, 65 to 74 year old males and under 5 year old females are the most vulnerable to poverty, with 17 males (73.9%) and 10 females (27.0%) in their respective age groups living below the poverty level.
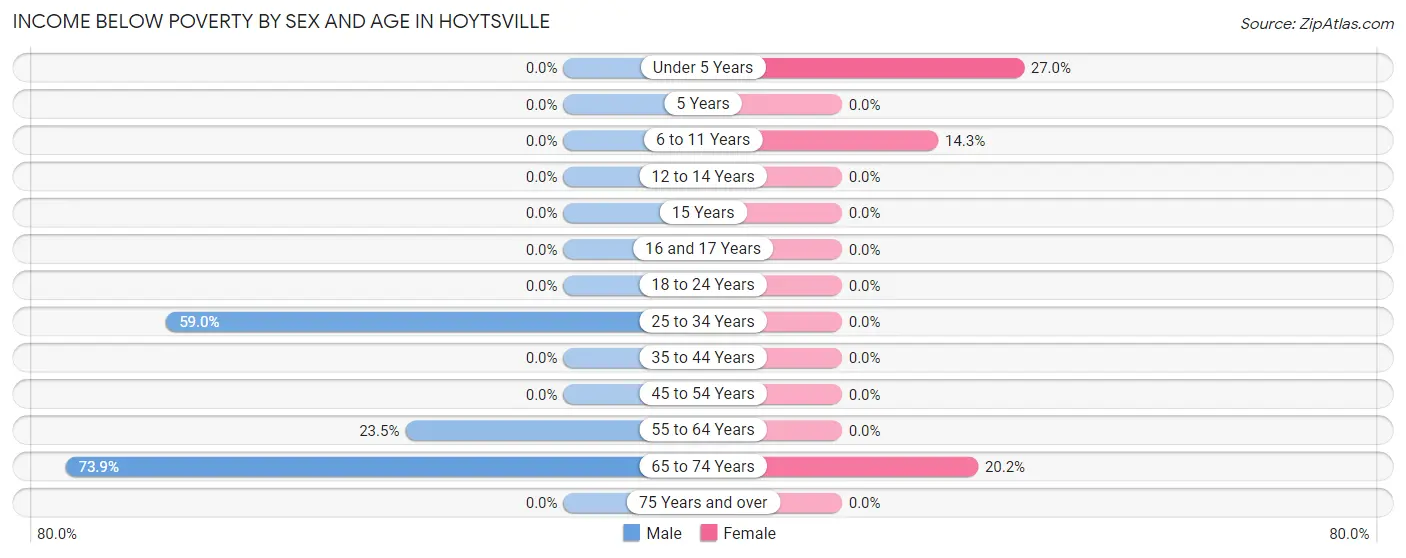
| Age Bracket | Male | Female |
| Under 5 Years | 0 (0.0%) | 10 (27.0%) |
| 5 Years | 0 (0.0%) | 0 (0.0%) |
| 6 to 11 Years | 0 (0.0%) | 9 (14.3%) |
| 12 to 14 Years | 0 (0.0%) | 0 (0.0%) |
| 15 Years | 0 (0.0%) | 0 (0.0%) |
| 16 and 17 Years | 0 (0.0%) | 0 (0.0%) |
| 18 to 24 Years | 0 (0.0%) | 0 (0.0%) |
| 25 to 34 Years | 23 (59.0%) | 0 (0.0%) |
| 35 to 44 Years | 0 (0.0%) | 0 (0.0%) |
| 45 to 54 Years | 0 (0.0%) | 0 (0.0%) |
| 55 to 64 Years | 31 (23.5%) | 0 (0.0%) |
| 65 to 74 Years | 17 (73.9%) | 18 (20.2%) |
| 75 Years and over | 0 (0.0%) | 0 (0.0%) |
| Total | 71 (17.7%) | 37 (10.0%) |
Income Above Poverty by Sex and Age in Hoytsville
According to the poverty statistics in Hoytsville, males aged under 5 years and females aged 5 years are the age groups that are most secure financially, with 100.0% of males and 100.0% of females in these age groups living above the poverty line.
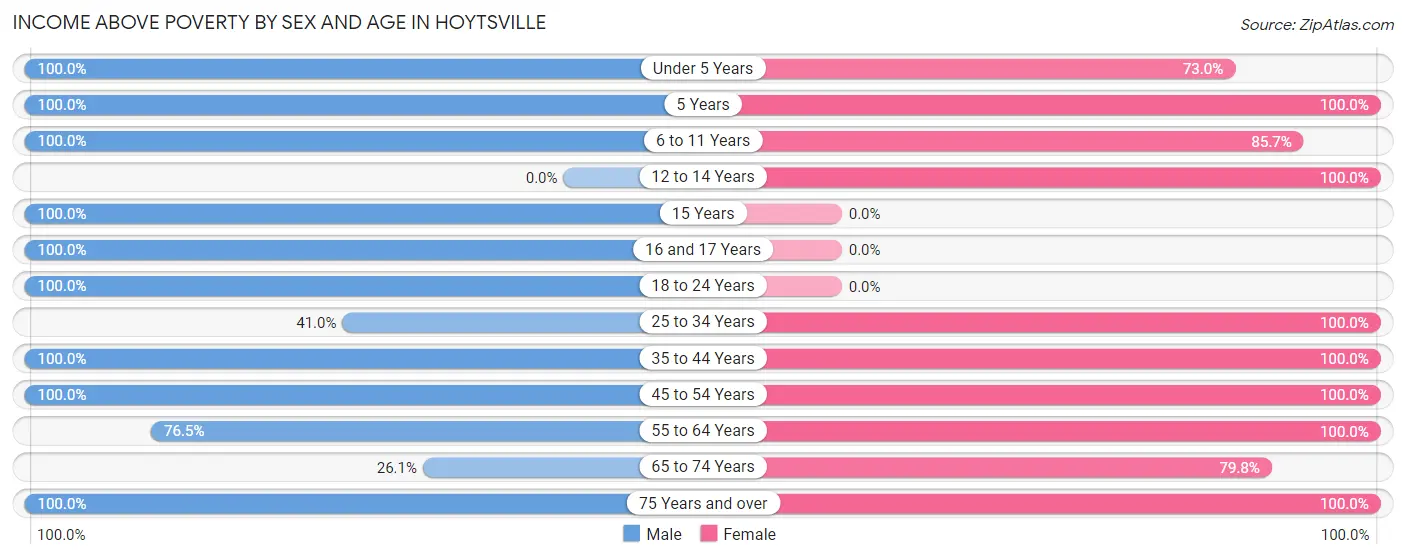
| Age Bracket | Male | Female |
| Under 5 Years | 8 (100.0%) | 27 (73.0%) |
| 5 Years | 12 (100.0%) | 6 (100.0%) |
| 6 to 11 Years | 12 (100.0%) | 54 (85.7%) |
| 12 to 14 Years | 0 (0.0%) | 15 (100.0%) |
| 15 Years | 26 (100.0%) | 0 (0.0%) |
| 16 and 17 Years | 40 (100.0%) | 0 (0.0%) |
| 18 to 24 Years | 11 (100.0%) | 0 (0.0%) |
| 25 to 34 Years | 16 (41.0%) | 37 (100.0%) |
| 35 to 44 Years | 21 (100.0%) | 24 (100.0%) |
| 45 to 54 Years | 53 (100.0%) | 29 (100.0%) |
| 55 to 64 Years | 101 (76.5%) | 47 (100.0%) |
| 65 to 74 Years | 6 (26.1%) | 71 (79.8%) |
| 75 Years and over | 23 (100.0%) | 22 (100.0%) |
| Total | 329 (82.3%) | 332 (90.0%) |
Income Below Poverty Among Married-Couple Families in Hoytsville
The poverty statistics for married-couple families in Hoytsville show that 8.1% or 17 of the total 210 families live below the poverty line. Families with no children have the highest poverty rate of 11.3%, comprising of 17 families. On the other hand, families with 1 or 2 children have the lowest poverty rate of 0.0%, which includes 0 families.
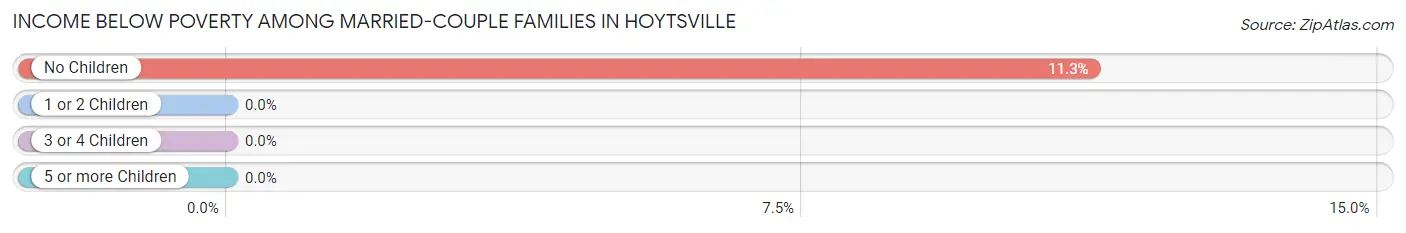
| Children | Above Poverty | Below Poverty |
| No Children | 134 (88.7%) | 17 (11.3%) |
| 1 or 2 Children | 31 (100.0%) | 0 (0.0%) |
| 3 or 4 Children | 28 (100.0%) | 0 (0.0%) |
| 5 or more Children | 0 (0.0%) | 0 (0.0%) |
| Total | 193 (91.9%) | 17 (8.1%) |
Income Below Poverty Among Single-Parent Households in Hoytsville
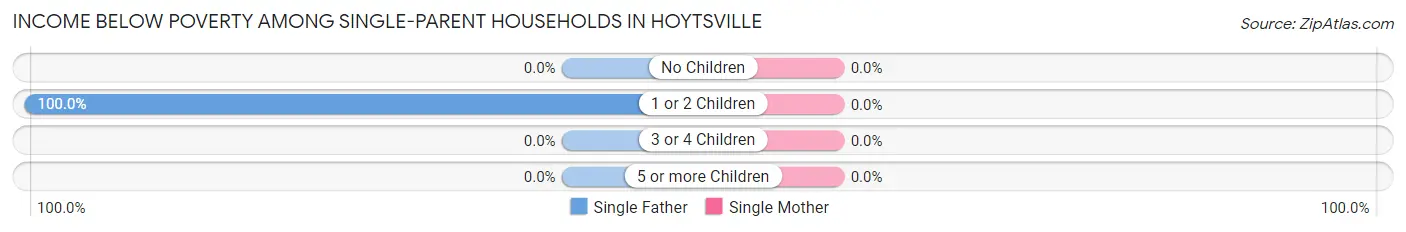
| Children | Single Father | Single Mother |
| No Children | 0 (0.0%) | 0 (0.0%) |
| 1 or 2 Children | 8 (100.0%) | 0 (0.0%) |
| 3 or 4 Children | 0 (0.0%) | 0 (0.0%) |
| 5 or more Children | 0 (0.0%) | 0 (0.0%) |
| Total | 8 (100.0%) | 0 (0.0%) |
Income Below Poverty Among Married-Couple vs Single-Parent Households in Hoytsville
The poverty data for Hoytsville shows that 17 of the married-couple family households (8.1%) and 8 of the single-parent households (42.1%) are living below the poverty level. Within the married-couple family households, those with no children have the highest poverty rate, with 17 households (11.3%) falling below the poverty line. Among the single-parent households, those with 1 or 2 children have the highest poverty rate, with 8 household (42.1%) living below poverty.
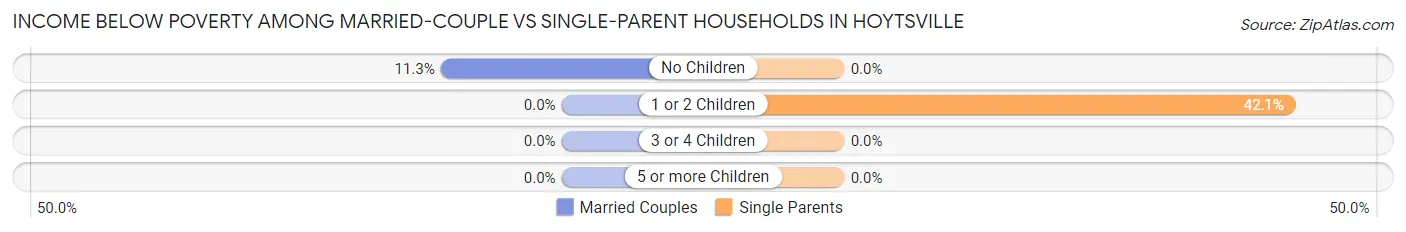
| Children | Married-Couple Families | Single-Parent Households |
| No Children | 17 (11.3%) | 0 (0.0%) |
| 1 or 2 Children | 0 (0.0%) | 8 (42.1%) |
| 3 or 4 Children | 0 (0.0%) | 0 (0.0%) |
| 5 or more Children | 0 (0.0%) | 0 (0.0%) |
| Total | 17 (8.1%) | 8 (42.1%) |
Race in Hoytsville
The most populous races in Hoytsville are White / Caucasian (746 | 97.0%), Hispanic or Latino (59 | 7.7%), and Two or more Races (23 | 3.0%).
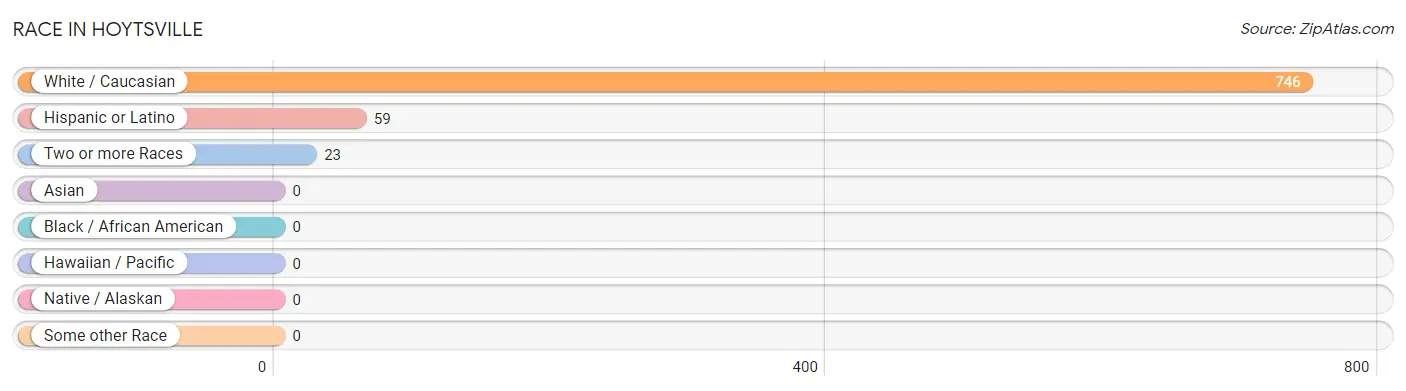
| Race | # Population | % Population |
| Asian | 0 | 0.0% |
| Black / African American | 0 | 0.0% |
| Hawaiian / Pacific | 0 | 0.0% |
| Hispanic or Latino | 59 | 7.7% |
| Native / Alaskan | 0 | 0.0% |
| White / Caucasian | 746 | 97.0% |
| Two or more Races | 23 | 3.0% |
| Some other Race | 0 | 0.0% |
| Total | 769 | 100.0% |
Ancestry in Hoytsville
The most populous ancestries reported in Hoytsville are English (314 | 40.8%), French (71 | 9.2%), Mexican (59 | 7.7%), Dutch (47 | 6.1%), and Irish (26 | 3.4%), together accounting for 67.2% of all Hoytsville residents.
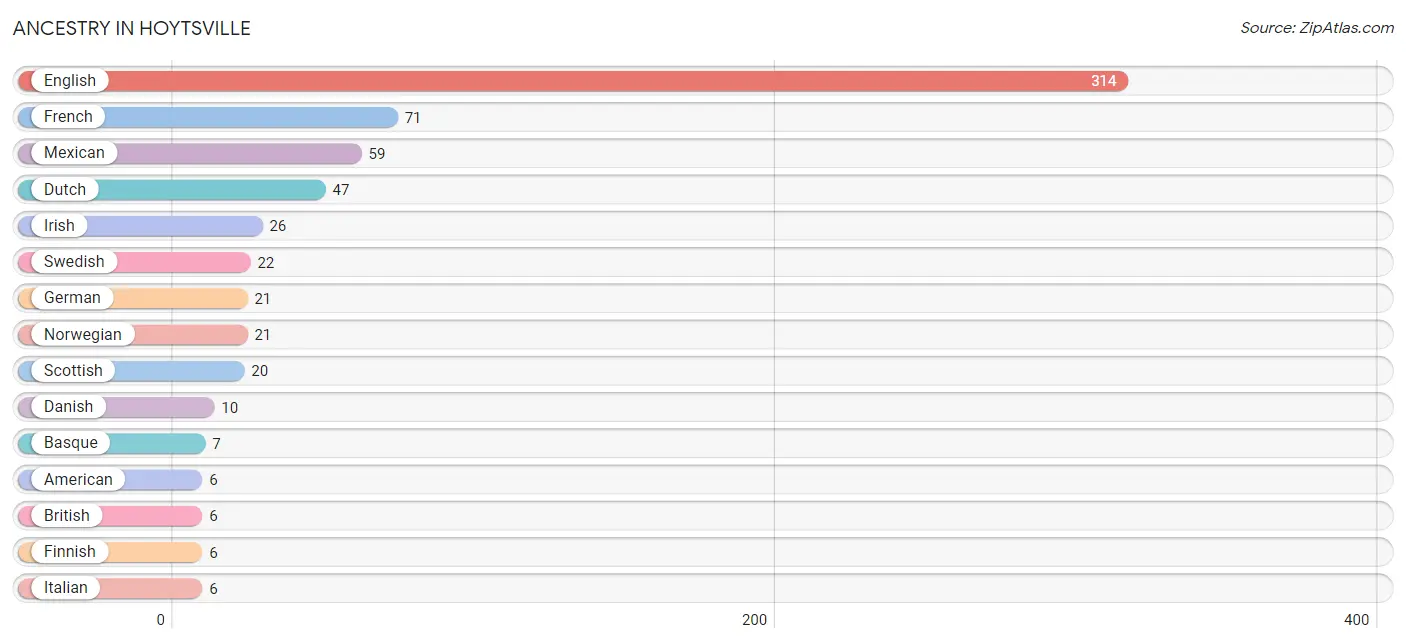
| Ancestry | # Population | % Population |
| American | 6 | 0.8% |
| Basque | 7 | 0.9% |
| British | 6 | 0.8% |
| Danish | 10 | 1.3% |
| Dutch | 47 | 6.1% |
| English | 314 | 40.8% |
| Finnish | 6 | 0.8% |
| French | 71 | 9.2% |
| German | 21 | 2.7% |
| Irish | 26 | 3.4% |
| Italian | 6 | 0.8% |
| Mexican | 59 | 7.7% |
| Norwegian | 21 | 2.7% |
| Scottish | 20 | 2.6% |
| Swedish | 22 | 2.9% |
| Welsh | 6 | 0.8% | View All 16 Rows |
Immigrants in Hoytsville
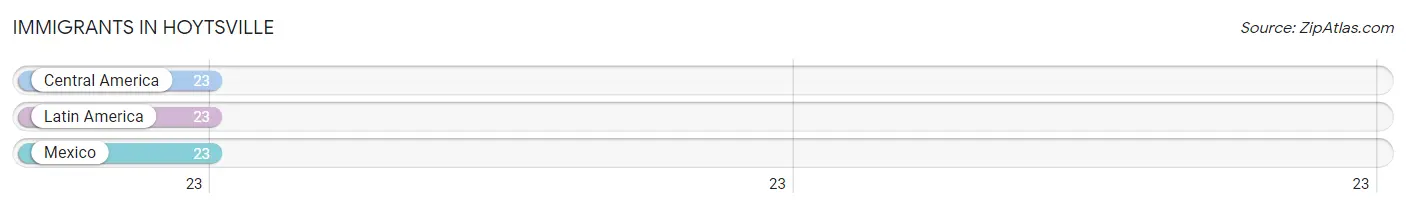
The most numerous immigrant groups reported in Hoytsville came from Central America (23 | 3.0%), Latin America (23 | 3.0%), and Mexico (23 | 3.0%), together accounting for 9.0% of all Hoytsville residents.
| Immigration Origin | # Population | % Population |
| Central America | 23 | 3.0% |
| Latin America | 23 | 3.0% |
| Mexico | 23 | 3.0% | View All 3 Rows |
Sex and Age in Hoytsville
Sex and Age in Hoytsville
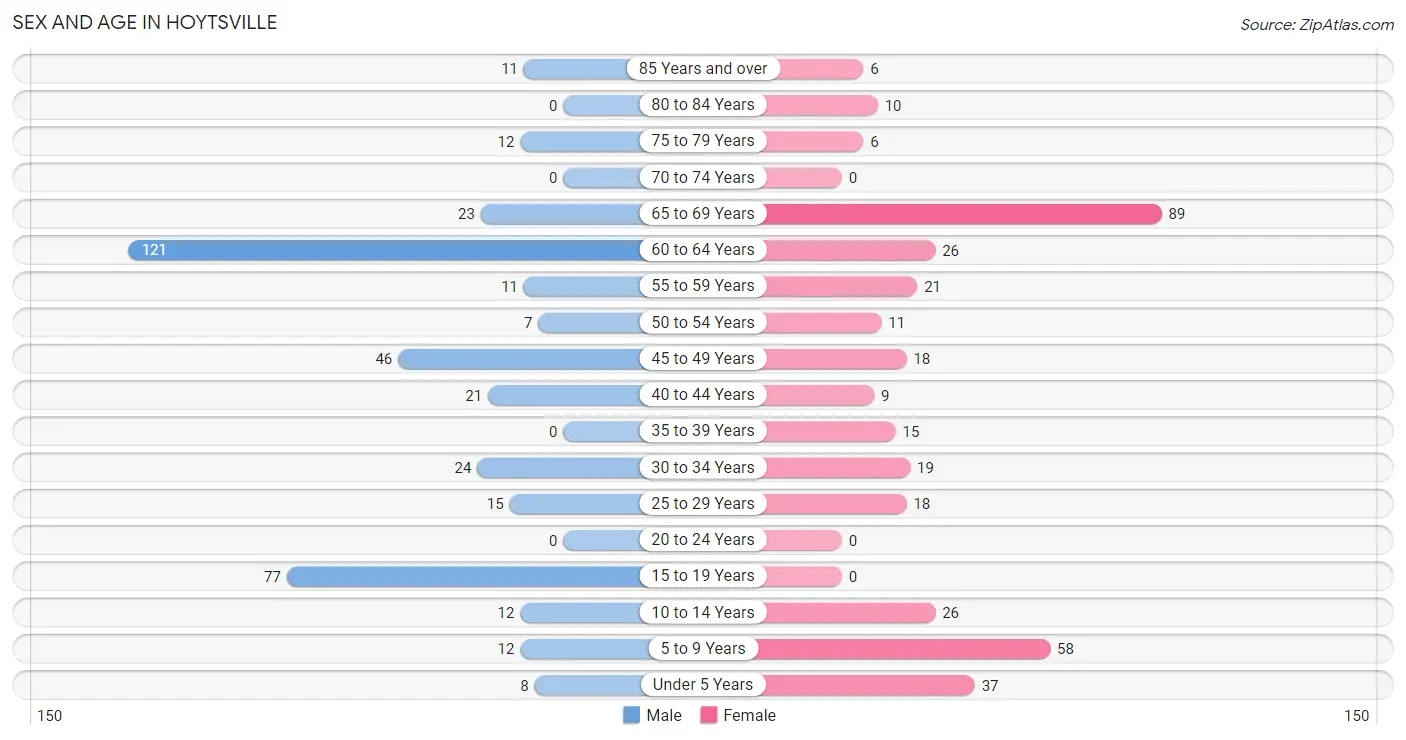
The most populous age groups in Hoytsville are 60 to 64 Years (121 | 30.2%) for men and 65 to 69 Years (89 | 24.1%) for women.
| Age Bracket | Male | Female |
| Under 5 Years | 8 (2.0%) | 37 (10.0%) |
| 5 to 9 Years | 12 (3.0%) | 58 (15.7%) |
| 10 to 14 Years | 12 (3.0%) | 26 (7.0%) |
| 15 to 19 Years | 77 (19.3%) | 0 (0.0%) |
| 20 to 24 Years | 0 (0.0%) | 0 (0.0%) |
| 25 to 29 Years | 15 (3.7%) | 18 (4.9%) |
| 30 to 34 Years | 24 (6.0%) | 19 (5.1%) |
| 35 to 39 Years | 0 (0.0%) | 15 (4.1%) |
| 40 to 44 Years | 21 (5.2%) | 9 (2.4%) |
| 45 to 49 Years | 46 (11.5%) | 18 (4.9%) |
| 50 to 54 Years | 7 (1.8%) | 11 (3.0%) |
| 55 to 59 Years | 11 (2.8%) | 21 (5.7%) |
| 60 to 64 Years | 121 (30.2%) | 26 (7.0%) |
| 65 to 69 Years | 23 (5.8%) | 89 (24.1%) |
| 70 to 74 Years | 0 (0.0%) | 0 (0.0%) |
| 75 to 79 Years | 12 (3.0%) | 6 (1.6%) |
| 80 to 84 Years | 0 (0.0%) | 10 (2.7%) |
| 85 Years and over | 11 (2.8%) | 6 (1.6%) |
| Total | 400 (100.0%) | 369 (100.0%) |
Families and Households in Hoytsville
Median Family Size in Hoytsville
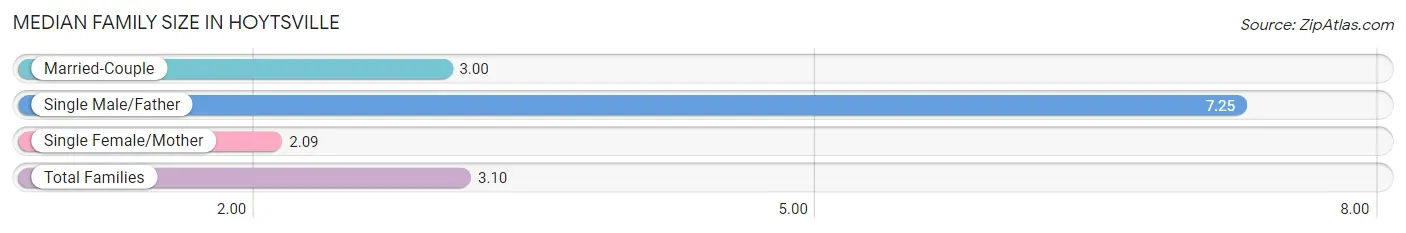
The median family size in Hoytsville is 3.10 persons per family, with single male/father families (8 | 3.5%) accounting for the largest median family size of 7.25 persons per family. On the other hand, single female/mother families (11 | 4.8%) represent the smallest median family size with 2.09 persons per family.
| Family Type | # Families | Family Size |
| Married-Couple | 210 (91.7%) | 3.00 |
| Single Male/Father | 8 (3.5%) | 7.25 |
| Single Female/Mother | 11 (4.8%) | 2.09 |
| Total Families | 229 (100.0%) | 3.10 |
Median Household Size in Hoytsville
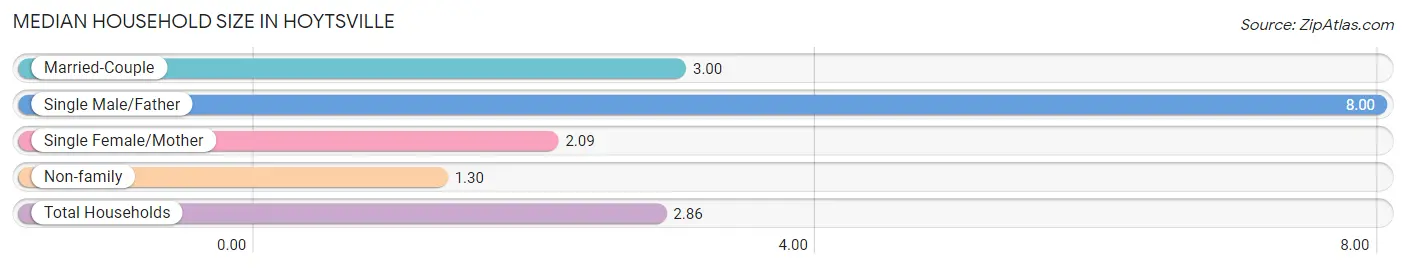
The median household size in Hoytsville is 2.86 persons per household, with single male/father households (8 | 3.0%) accounting for the largest median household size of 8 persons per household. non-family households (40 | 14.9%) represent the smallest median household size with 1.30 persons per household.
| Household Type | # Households | Household Size |
| Married-Couple | 210 (78.1%) | 3.00 |
| Single Male/Father | 8 (3.0%) | 8.00 |
| Single Female/Mother | 11 (4.1%) | 2.09 |
| Non-family | 40 (14.9%) | 1.30 |
| Total Households | 269 (100.0%) | 2.86 |
Household Size by Marriage Status in Hoytsville
Out of a total of 269 households in Hoytsville, 229 (85.1%) are family households, while 40 (14.9%) are nonfamily households. The most numerous type of family households are 2-person households, comprising 162, and the most common type of nonfamily households are 1-person households, comprising 25.
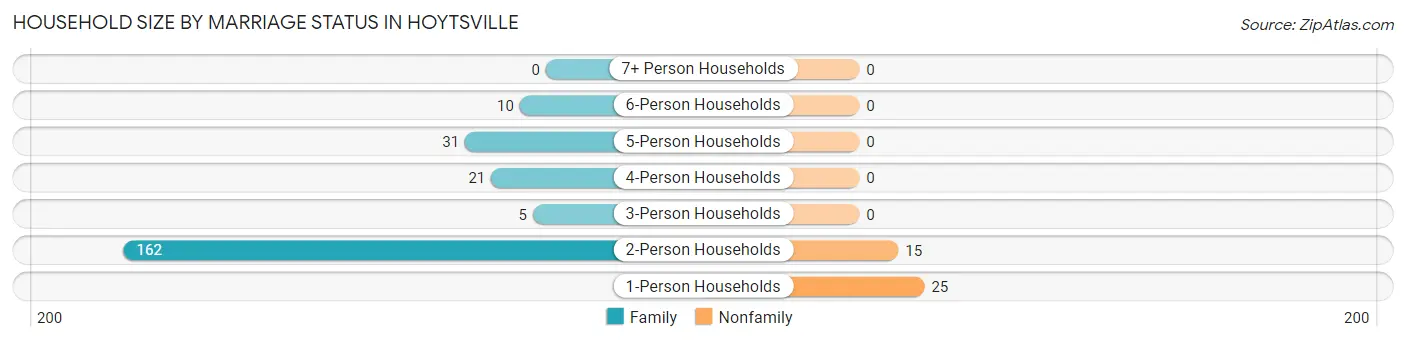
| Household Size | Family Households | Nonfamily Households |
| 1-Person Households | - | 25 (9.3%) |
| 2-Person Households | 162 (60.2%) | 15 (5.6%) |
| 3-Person Households | 5 (1.9%) | 0 (0.0%) |
| 4-Person Households | 21 (7.8%) | 0 (0.0%) |
| 5-Person Households | 31 (11.5%) | 0 (0.0%) |
| 6-Person Households | 10 (3.7%) | 0 (0.0%) |
| 7+ Person Households | 0 (0.0%) | 0 (0.0%) |
| Total | 229 (85.1%) | 40 (14.9%) |
Female Fertility in Hoytsville
Fertility by Age in Hoytsville
| Age Bracket | Women with Births | Births / 1,000 Women |
| 15 to 19 years | 0 (0.0%) | 0.0 |
| 20 to 34 years | 0 (0.0%) | 0.0 |
| 35 to 50 years | 0 (0.0%) | 0.0 |
| Total | 0 (0.0%) | 0.0 |
Fertility by Age by Marriage Status in Hoytsville
| Age Bracket | Married | Unmarried |
| 15 to 19 years | 0 (0.0%) | 0 (0.0%) |
| 20 to 34 years | 0 (0.0%) | 0 (0.0%) |
| 35 to 50 years | 0 (0.0%) | 0 (0.0%) |
| Total | 0 (0.0%) | 0 (0.0%) |
Fertility by Education in Hoytsville
| Educational Attainment | Women with Births | Births / 1,000 Women |
| Less than High School | 0 (0.0%) | 0.0 |
| High School Diploma | 0 (0.0%) | 0.0 |
| College or Associate's Degree | 0 (0.0%) | 0.0 |
| Bachelor's Degree | 0 (0.0%) | 0.0 |
| Graduate Degree | 0 (0.0%) | 0.0 |
| Total | 0 (0.0%) | 0.0 |
Fertility by Education by Marriage Status in Hoytsville
| Educational Attainment | Married | Unmarried |
| Less than High School | 0 (0.0%) | 0 (0.0%) |
| High School Diploma | 0 (0.0%) | 0 (0.0%) |
| College or Associate's Degree | 0 (0.0%) | 0 (0.0%) |
| Bachelor's Degree | 0 (0.0%) | 0 (0.0%) |
| Graduate Degree | 0 (0.0%) | 0 (0.0%) |
| Total | 0 (0.0%) | 0 (0.0%) |
Employment Characteristics in Hoytsville
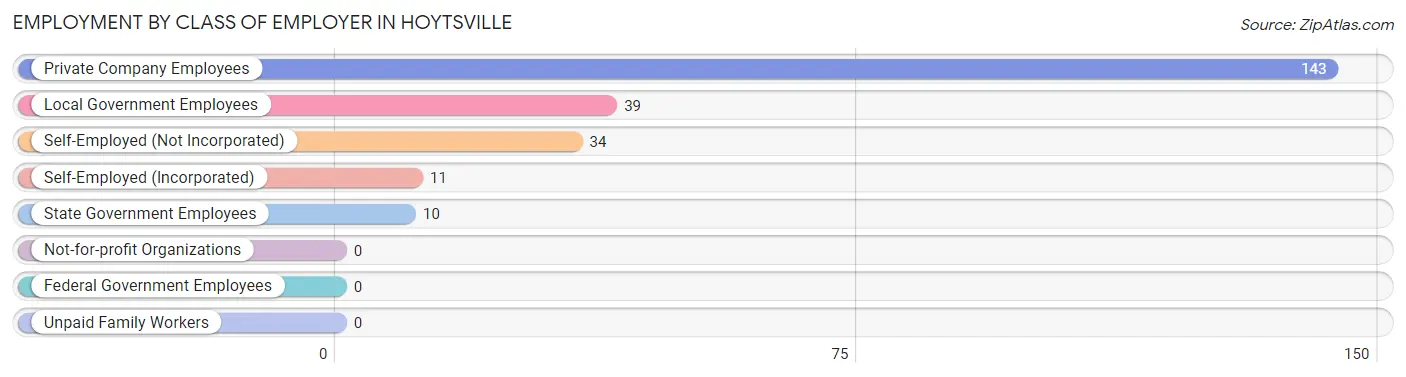
Employment by Class of Employer in Hoytsville
Among the 237 employed individuals in Hoytsville, private company employees (143 | 60.3%), local government employees (39 | 16.5%), and self-employed (not incorporated) (34 | 14.3%) make up the most common classes of employment.
| Employer Class | # Employees | % Employees |
| Private Company Employees | 143 | 60.3% |
| Self-Employed (Incorporated) | 11 | 4.6% |
| Self-Employed (Not Incorporated) | 34 | 14.3% |
| Not-for-profit Organizations | 0 | 0.0% |
| Local Government Employees | 39 | 16.5% |
| State Government Employees | 10 | 4.2% |
| Federal Government Employees | 0 | 0.0% |
| Unpaid Family Workers | 0 | 0.0% |
| Total | 237 | 100.0% |
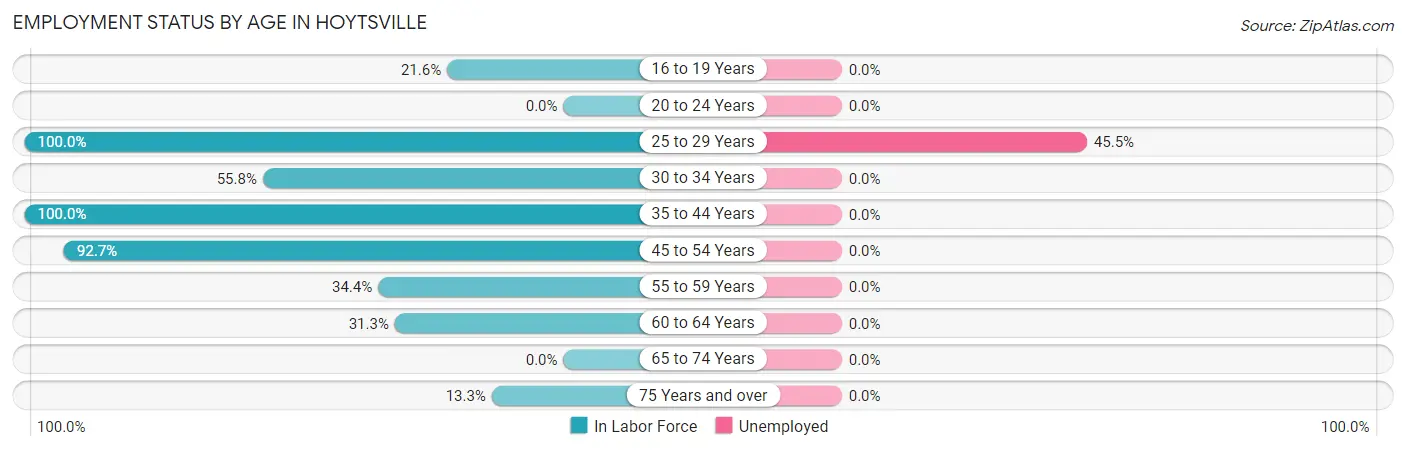
Employment Status by Age in Hoytsville
According to the labor force statistics for Hoytsville, out of the total population over 16 years of age (590), 42.7% or 252 individuals are in the labor force, with 6.0% or 15 of them unemployed. The age group with the highest labor force participation rate is 25 to 29 years, with 100.0% or 33 individuals in the labor force. Within the labor force, the 25 to 29 years age range has the highest percentage of unemployed individuals, with 45.5% or 15 of them being unemployed.
| Age Bracket | In Labor Force | Unemployed |
| 16 to 19 Years | 11 (21.6%) | 0 (0.0%) |
| 20 to 24 Years | 0 (0.0%) | 0 (0.0%) |
| 25 to 29 Years | 33 (100.0%) | 15 (45.5%) |
| 30 to 34 Years | 24 (55.8%) | 0 (0.0%) |
| 35 to 44 Years | 45 (100.0%) | 0 (0.0%) |
| 45 to 54 Years | 76 (92.7%) | 0 (0.0%) |
| 55 to 59 Years | 11 (34.4%) | 0 (0.0%) |
| 60 to 64 Years | 46 (31.3%) | 0 (0.0%) |
| 65 to 74 Years | 0 (0.0%) | 0 (0.0%) |
| 75 Years and over | 6 (13.3%) | 0 (0.0%) |
| Total | 252 (42.7%) | 15 (6.0%) |
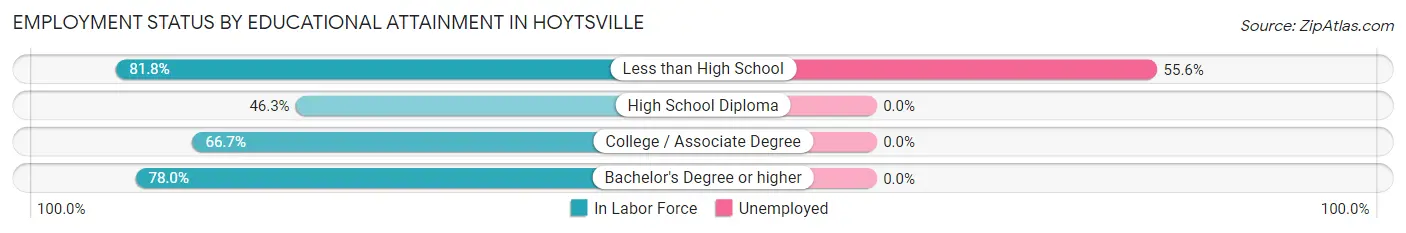
Employment Status by Educational Attainment in Hoytsville
According to labor force statistics for Hoytsville, 61.5% of individuals (235) out of the total population between 25 and 64 years of age (382) are in the labor force, with 6.4% or 15 of them being unemployed. The group with the highest labor force participation rate are those with the educational attainment of less than high school, with 81.8% or 27 individuals in the labor force. Within the labor force, individuals with less than high school education have the highest percentage of unemployment, with 55.6% or 15 of them being unemployed.
| Educational Attainment | In Labor Force | Unemployed |
| Less than High School | 27 (81.8%) | 18 (55.6%) |
| High School Diploma | 69 (46.3%) | 0 (0.0%) |
| College / Associate Degree | 100 (66.7%) | 0 (0.0%) |
| Bachelor's Degree or higher | 39 (78.0%) | 0 (0.0%) |
| Total | 235 (61.5%) | 24 (6.4%) |
Employment Occupations by Sex in Hoytsville
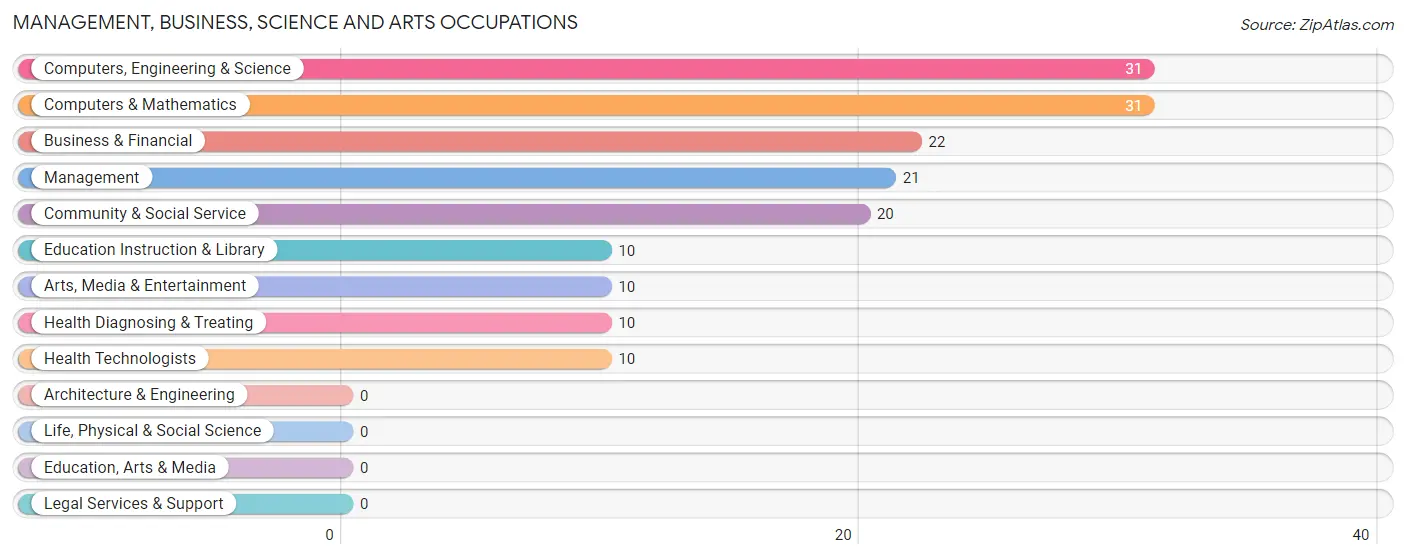
Management, Business, Science and Arts Occupations
The most common Management, Business, Science and Arts occupations in Hoytsville are Computers, Engineering & Science (31 | 13.1%), Computers & Mathematics (31 | 13.1%), Business & Financial (22 | 9.3%), Management (21 | 8.9%), and Community & Social Service (20 | 8.4%).
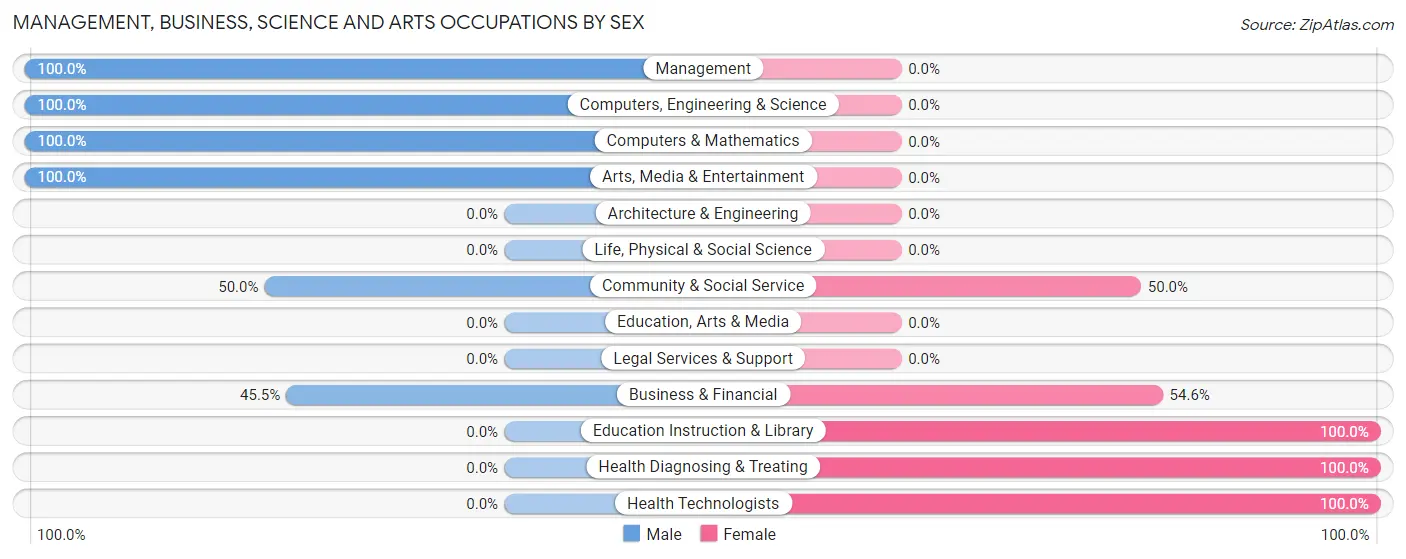
Management, Business, Science and Arts Occupations by Sex
Within the Management, Business, Science and Arts occupations in Hoytsville, the most male-oriented occupations are Management (100.0%), Computers, Engineering & Science (100.0%), and Computers & Mathematics (100.0%), while the most female-oriented occupations are Education Instruction & Library (100.0%), Health Diagnosing & Treating (100.0%), and Health Technologists (100.0%).
| Occupation | Male | Female |
| Management | 21 (100.0%) | 0 (0.0%) |
| Business & Financial | 10 (45.5%) | 12 (54.5%) |
| Computers, Engineering & Science | 31 (100.0%) | 0 (0.0%) |
| Computers & Mathematics | 31 (100.0%) | 0 (0.0%) |
| Architecture & Engineering | 0 (0.0%) | 0 (0.0%) |
| Life, Physical & Social Science | 0 (0.0%) | 0 (0.0%) |
| Community & Social Service | 10 (50.0%) | 10 (50.0%) |
| Education, Arts & Media | 0 (0.0%) | 0 (0.0%) |
| Legal Services & Support | 0 (0.0%) | 0 (0.0%) |
| Education Instruction & Library | 0 (0.0%) | 10 (100.0%) |
| Arts, Media & Entertainment | 10 (100.0%) | 0 (0.0%) |
| Health Diagnosing & Treating | 0 (0.0%) | 10 (100.0%) |
| Health Technologists | 0 (0.0%) | 10 (100.0%) |
| Total (Category) | 72 (69.2%) | 32 (30.8%) |
| Total (Overall) | 146 (61.6%) | 91 (38.4%) |
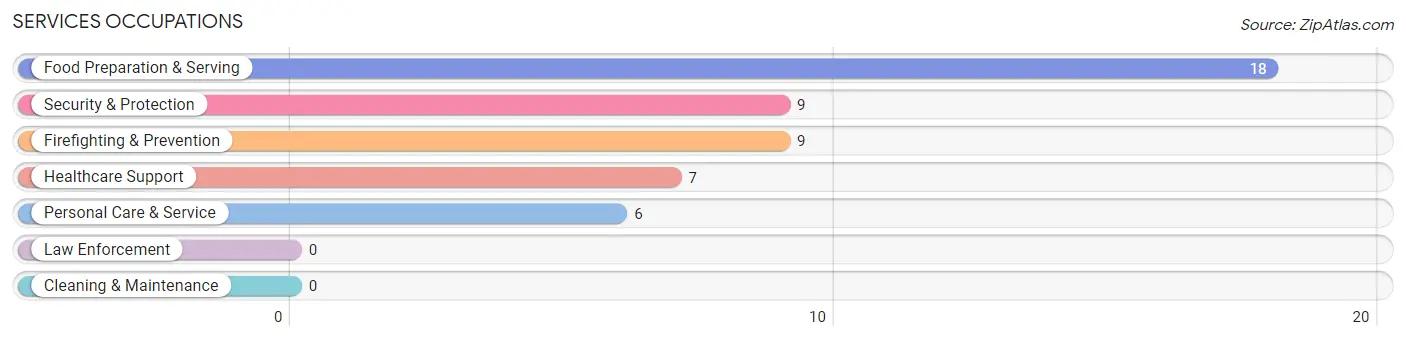
Services Occupations
The most common Services occupations in Hoytsville are Food Preparation & Serving (18 | 7.6%), Security & Protection (9 | 3.8%), Firefighting & Prevention (9 | 3.8%), Healthcare Support (7 | 2.9%), and Personal Care & Service (6 | 2.5%).
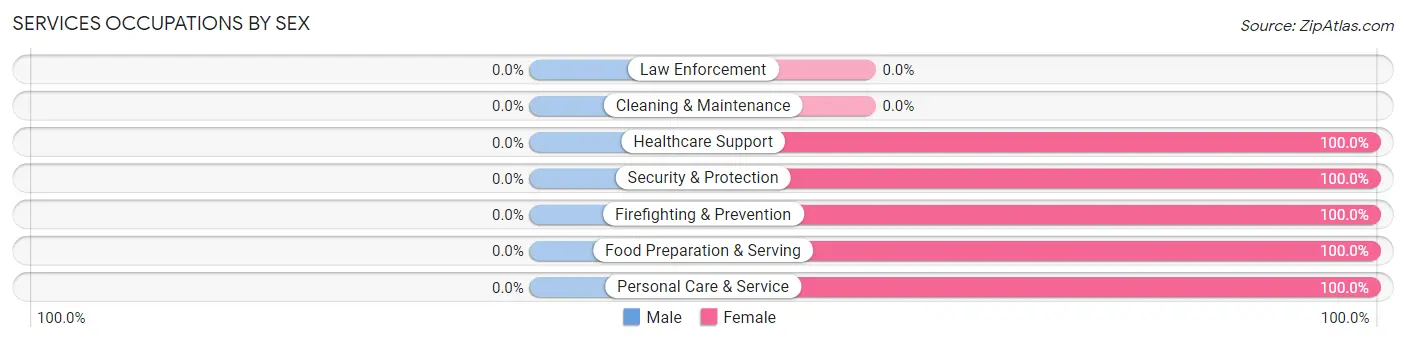
Services Occupations by Sex
| Occupation | Male | Female |
| Healthcare Support | 0 (0.0%) | 7 (100.0%) |
| Security & Protection | 0 (0.0%) | 9 (100.0%) |
| Firefighting & Prevention | 0 (0.0%) | 9 (100.0%) |
| Law Enforcement | 0 (0.0%) | 0 (0.0%) |
| Food Preparation & Serving | 0 (0.0%) | 18 (100.0%) |
| Cleaning & Maintenance | 0 (0.0%) | 0 (0.0%) |
| Personal Care & Service | 0 (0.0%) | 6 (100.0%) |
| Total (Category) | 0 (0.0%) | 40 (100.0%) |
| Total (Overall) | 146 (61.6%) | 91 (38.4%) |
Sales and Office Occupations
The most common Sales and Office occupations in Hoytsville are Office & Administration (14 | 5.9%), and Sales & Related (13 | 5.5%).
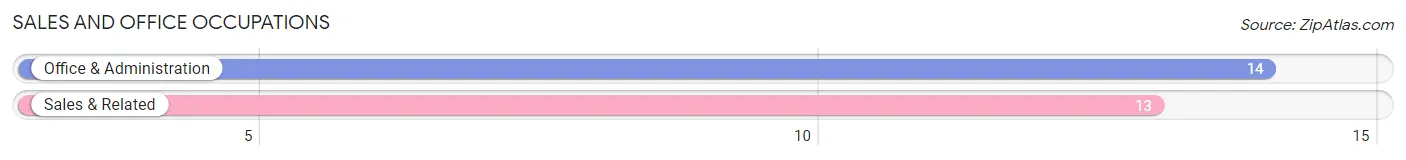
Sales and Office Occupations by Sex
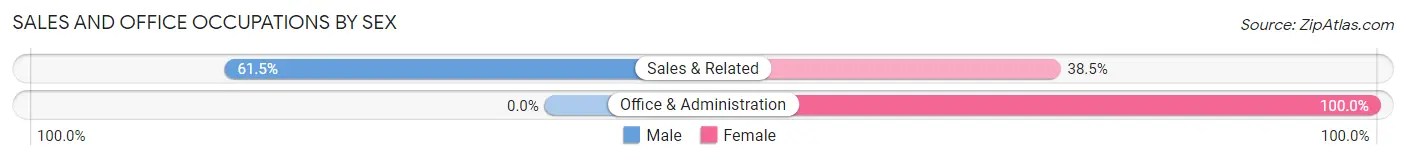
| Occupation | Male | Female |
| Sales & Related | 8 (61.5%) | 5 (38.5%) |
| Office & Administration | 0 (0.0%) | 14 (100.0%) |
| Total (Category) | 8 (29.6%) | 19 (70.4%) |
| Total (Overall) | 146 (61.6%) | 91 (38.4%) |
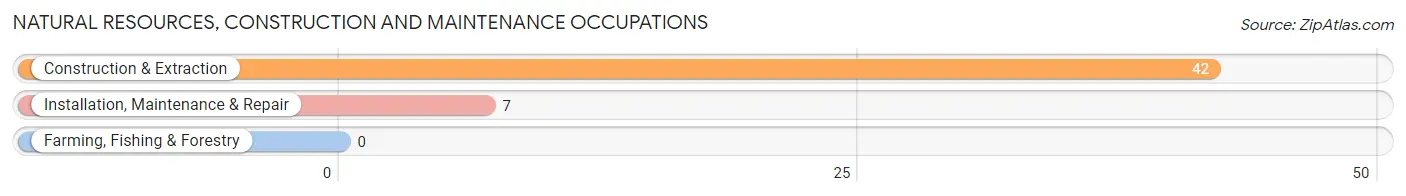
Natural Resources, Construction and Maintenance Occupations
The most common Natural Resources, Construction and Maintenance occupations in Hoytsville are Construction & Extraction (42 | 17.7%), and Installation, Maintenance & Repair (7 | 2.9%).
Natural Resources, Construction and Maintenance Occupations by Sex
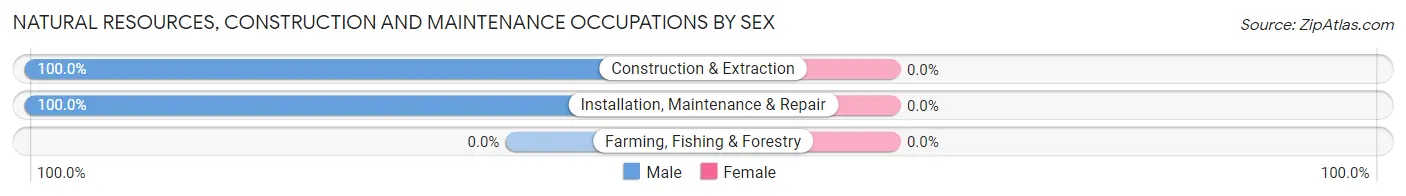
| Occupation | Male | Female |
| Farming, Fishing & Forestry | 0 (0.0%) | 0 (0.0%) |
| Construction & Extraction | 42 (100.0%) | 0 (0.0%) |
| Installation, Maintenance & Repair | 7 (100.0%) | 0 (0.0%) |
| Total (Category) | 49 (100.0%) | 0 (0.0%) |
| Total (Overall) | 146 (61.6%) | 91 (38.4%) |
Production, Transportation and Moving Occupations
The most common Production, Transportation and Moving occupations in Hoytsville are Transportation (11 | 4.6%), and Production (6 | 2.5%).
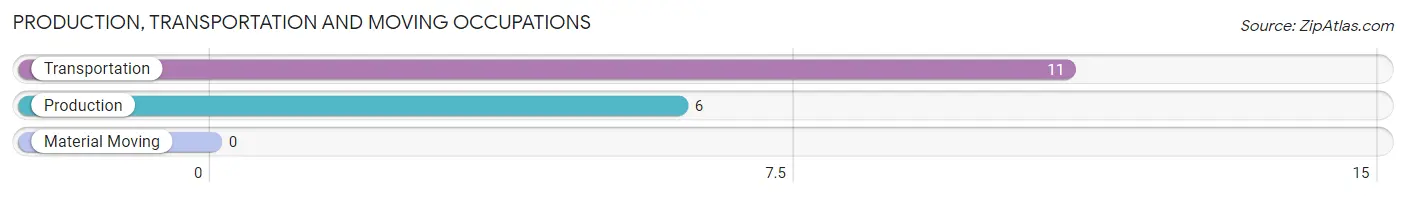
Production, Transportation and Moving Occupations by Sex
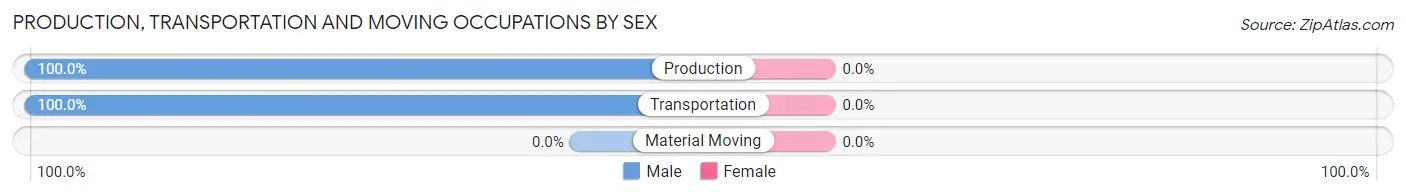
| Occupation | Male | Female |
| Production | 6 (100.0%) | 0 (0.0%) |
| Transportation | 11 (100.0%) | 0 (0.0%) |
| Material Moving | 0 (0.0%) | 0 (0.0%) |
| Total (Category) | 17 (100.0%) | 0 (0.0%) |
| Total (Overall) | 146 (61.6%) | 91 (38.4%) |
Employment Industries by Sex in Hoytsville
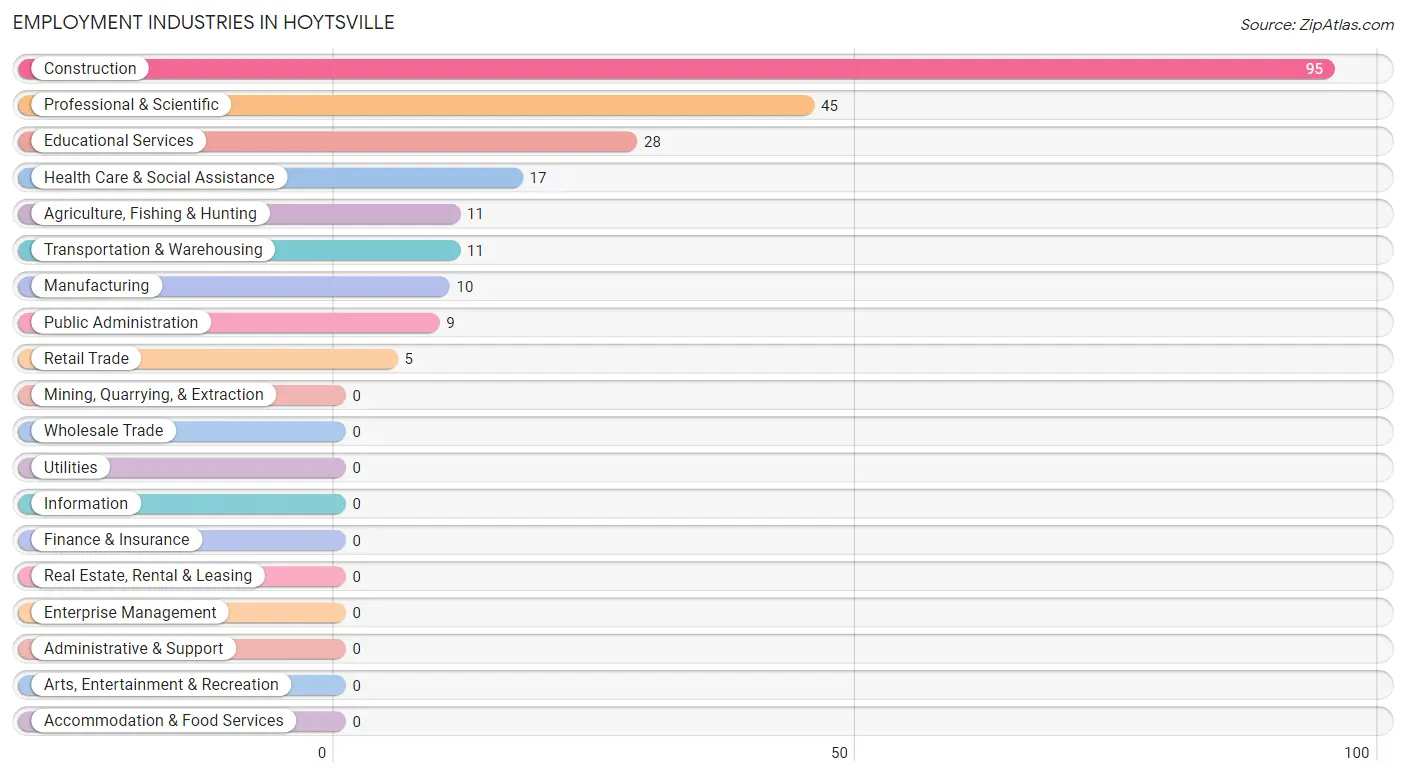
Employment Industries in Hoytsville
The major employment industries in Hoytsville include Construction (95 | 40.1%), Professional & Scientific (45 | 19.0%), Educational Services (28 | 11.8%), Health Care & Social Assistance (17 | 7.2%), and Agriculture, Fishing & Hunting (11 | 4.6%).
Employment Industries by Sex in Hoytsville
The Hoytsville industries that see more men than women are Agriculture, Fishing & Hunting (100.0%), Manufacturing (100.0%), and Transportation & Warehousing (100.0%), whereas the industries that tend to have a higher number of women are Retail Trade (100.0%), Educational Services (100.0%), and Health Care & Social Assistance (100.0%).
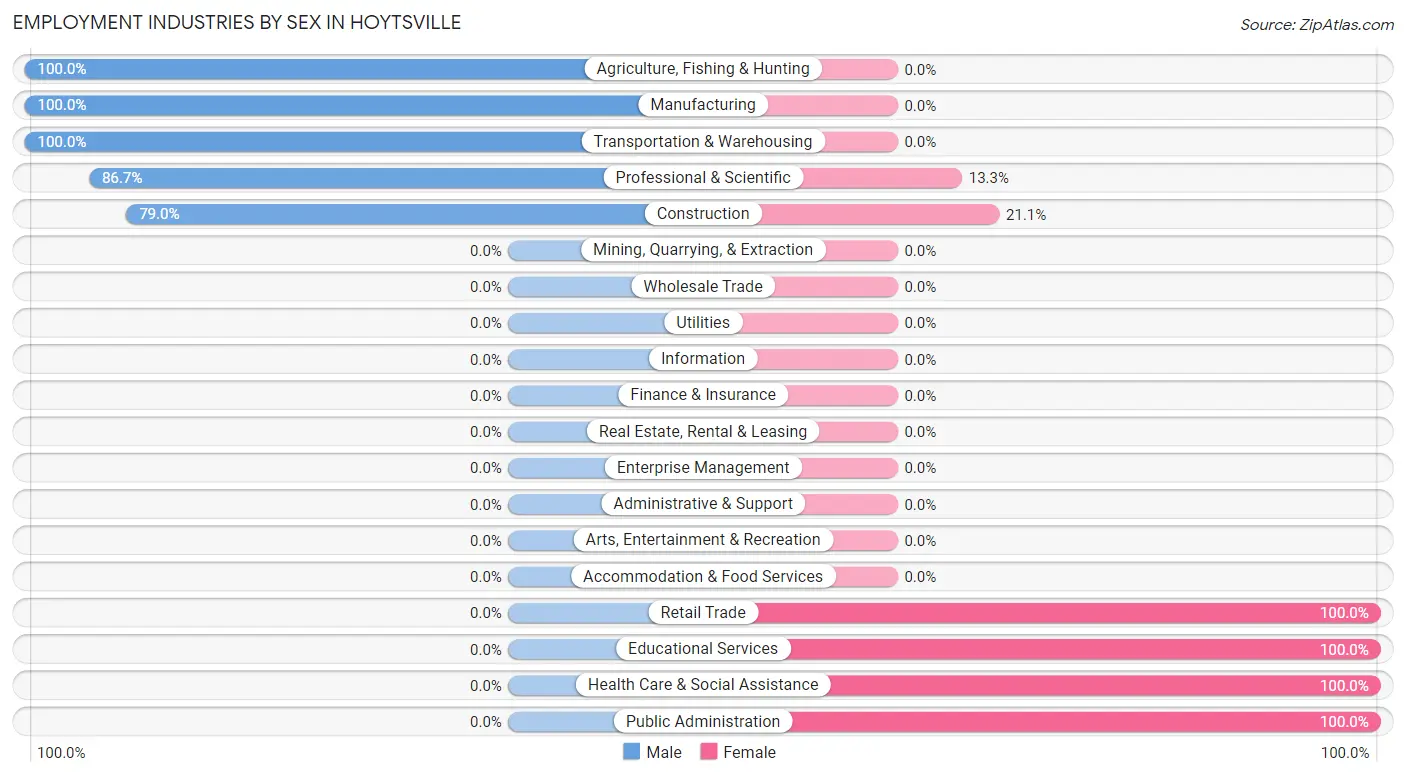
| Industry | Male | Female |
| Agriculture, Fishing & Hunting | 11 (100.0%) | 0 (0.0%) |
| Mining, Quarrying, & Extraction | 0 (0.0%) | 0 (0.0%) |
| Construction | 75 (78.9%) | 20 (21.0%) |
| Manufacturing | 10 (100.0%) | 0 (0.0%) |
| Wholesale Trade | 0 (0.0%) | 0 (0.0%) |
| Retail Trade | 0 (0.0%) | 5 (100.0%) |
| Transportation & Warehousing | 11 (100.0%) | 0 (0.0%) |
| Utilities | 0 (0.0%) | 0 (0.0%) |
| Information | 0 (0.0%) | 0 (0.0%) |
| Finance & Insurance | 0 (0.0%) | 0 (0.0%) |
| Real Estate, Rental & Leasing | 0 (0.0%) | 0 (0.0%) |
| Professional & Scientific | 39 (86.7%) | 6 (13.3%) |
| Enterprise Management | 0 (0.0%) | 0 (0.0%) |
| Administrative & Support | 0 (0.0%) | 0 (0.0%) |
| Educational Services | 0 (0.0%) | 28 (100.0%) |
| Health Care & Social Assistance | 0 (0.0%) | 17 (100.0%) |
| Arts, Entertainment & Recreation | 0 (0.0%) | 0 (0.0%) |
| Accommodation & Food Services | 0 (0.0%) | 0 (0.0%) |
| Public Administration | 0 (0.0%) | 9 (100.0%) |
| Total | 146 (61.6%) | 91 (38.4%) |
Education in Hoytsville
School Enrollment in Hoytsville
The most common levels of schooling among the 197 students in Hoytsville are high school (72 | 36.5%), elementary school (52 | 26.4%), and nursery / preschool (26 | 13.2%).
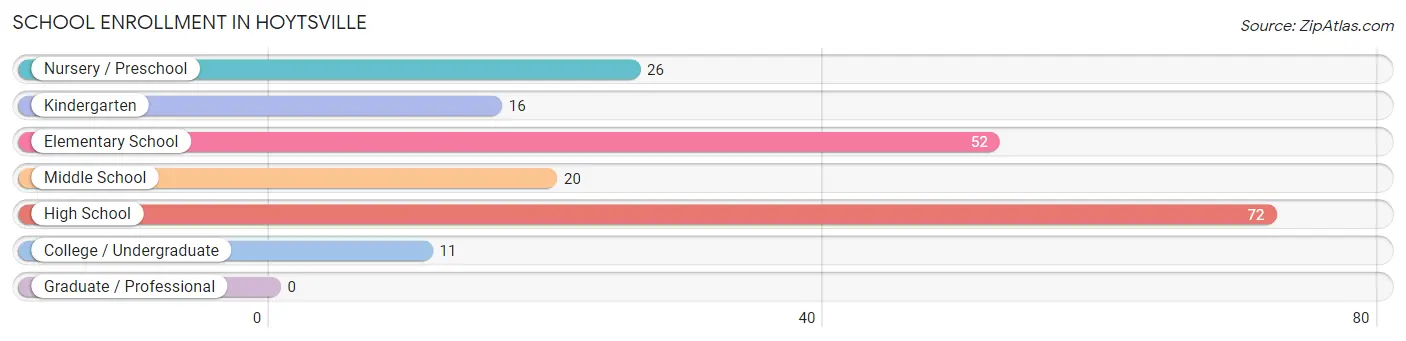
| School Level | # Students | % Students |
| Nursery / Preschool | 26 | 13.2% |
| Kindergarten | 16 | 8.1% |
| Elementary School | 52 | 26.4% |
| Middle School | 20 | 10.2% |
| High School | 72 | 36.5% |
| College / Undergraduate | 11 | 5.6% |
| Graduate / Professional | 0 | 0.0% |
| Total | 197 | 100.0% |
School Enrollment by Age by Funding Source in Hoytsville
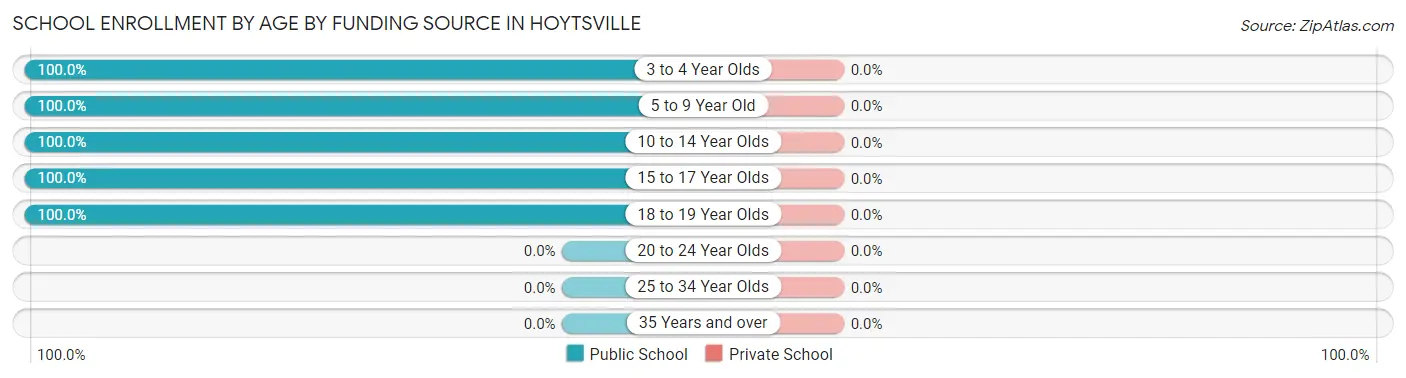
| Age Bracket | Public School | Private School |
| 3 to 4 Year Olds | 24 (100.0%) | 0 (0.0%) |
| 5 to 9 Year Old | 70 (100.0%) | 0 (0.0%) |
| 10 to 14 Year Olds | 26 (100.0%) | 0 (0.0%) |
| 15 to 17 Year Olds | 66 (100.0%) | 0 (0.0%) |
| 18 to 19 Year Olds | 11 (100.0%) | 0 (0.0%) |
| 20 to 24 Year Olds | 0 (0.0%) | 0 (0.0%) |
| 25 to 34 Year Olds | 0 (0.0%) | 0 (0.0%) |
| 35 Years and over | 0 (0.0%) | 0 (0.0%) |
| Total | 197 (100.0%) | 0 (0.0%) |
Educational Attainment by Field of Study in Hoytsville
Science & technology (33 | 44.6%), education (21 | 28.4%), business (8 | 10.8%), computers & mathematics (6 | 8.1%), and bio, nature & agricultural (6 | 8.1%) are the most common fields of study among 74 individuals in Hoytsville who have obtained a bachelor's degree or higher.
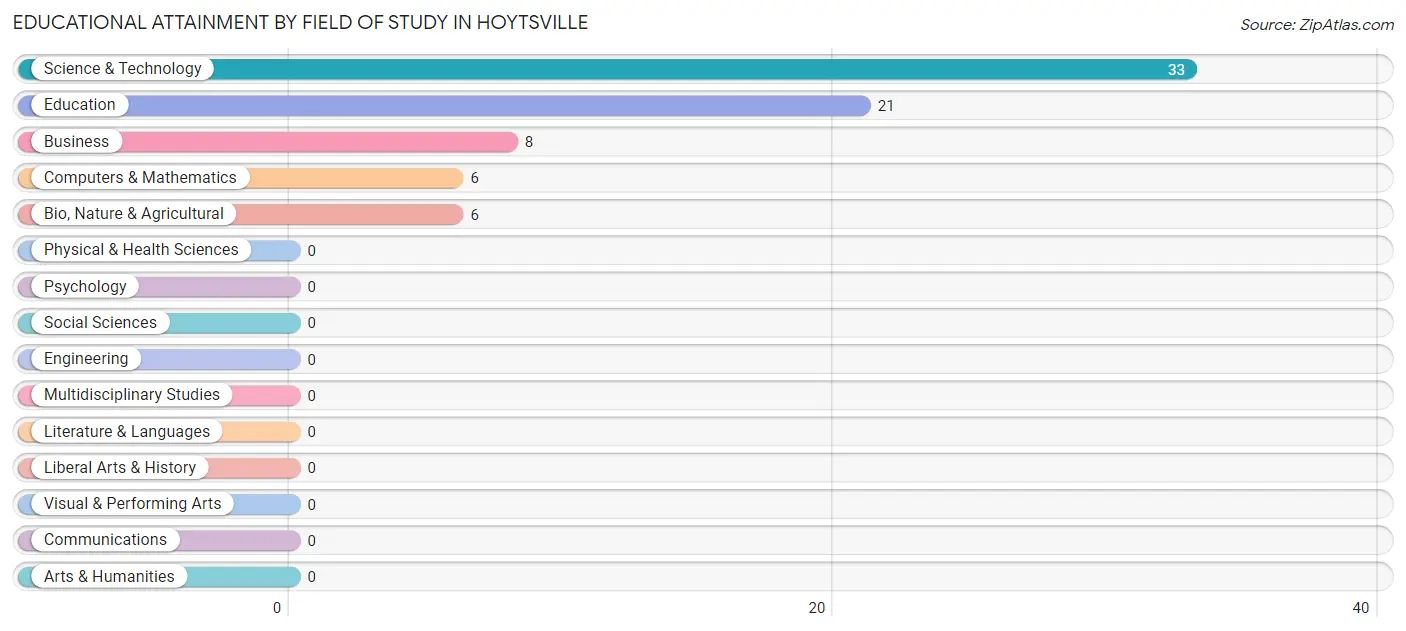
| Field of Study | # Graduates | % Graduates |
| Computers & Mathematics | 6 | 8.1% |
| Bio, Nature & Agricultural | 6 | 8.1% |
| Physical & Health Sciences | 0 | 0.0% |
| Psychology | 0 | 0.0% |
| Social Sciences | 0 | 0.0% |
| Engineering | 0 | 0.0% |
| Multidisciplinary Studies | 0 | 0.0% |
| Science & Technology | 33 | 44.6% |
| Business | 8 | 10.8% |
| Education | 21 | 28.4% |
| Literature & Languages | 0 | 0.0% |
| Liberal Arts & History | 0 | 0.0% |
| Visual & Performing Arts | 0 | 0.0% |
| Communications | 0 | 0.0% |
| Arts & Humanities | 0 | 0.0% |
| Total | 74 | 100.0% |
Transportation & Commute in Hoytsville
Vehicle Availability by Sex in Hoytsville
The most prevalent vehicle ownership categories in Hoytsville are males with 3 vehicles (41, accounting for 28.1%) and females with 3 vehicles (35, making up 45.1%).
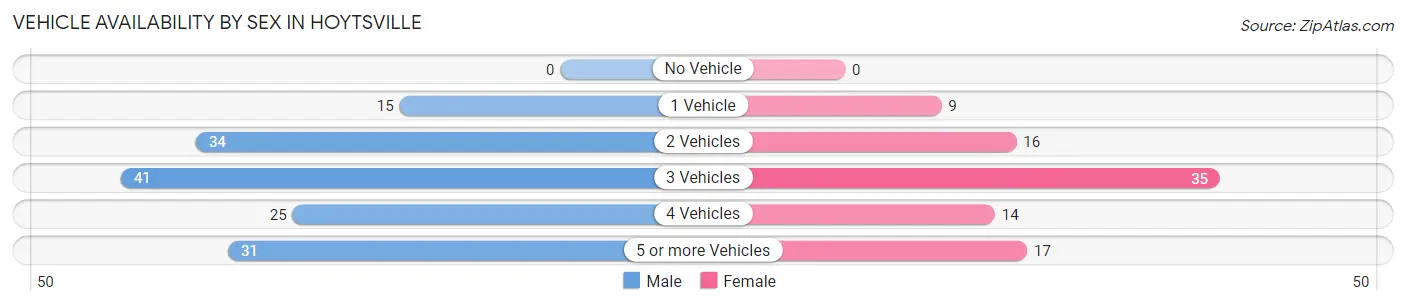
| Vehicles Available | Male | Female |
| No Vehicle | 0 (0.0%) | 0 (0.0%) |
| 1 Vehicle | 15 (10.3%) | 9 (9.9%) |
| 2 Vehicles | 34 (23.3%) | 16 (17.6%) |
| 3 Vehicles | 41 (28.1%) | 35 (38.5%) |
| 4 Vehicles | 25 (17.1%) | 14 (15.4%) |
| 5 or more Vehicles | 31 (21.2%) | 17 (18.7%) |
| Total | 146 (100.0%) | 91 (100.0%) |
Commute Time in Hoytsville
The most frequently occuring commute durations in Hoytsville are 5 to 9 minutes (69 commuters, 32.4%), 45 to 59 minutes (56 commuters, 26.3%), and 25 to 29 minutes (19 commuters, 8.9%).
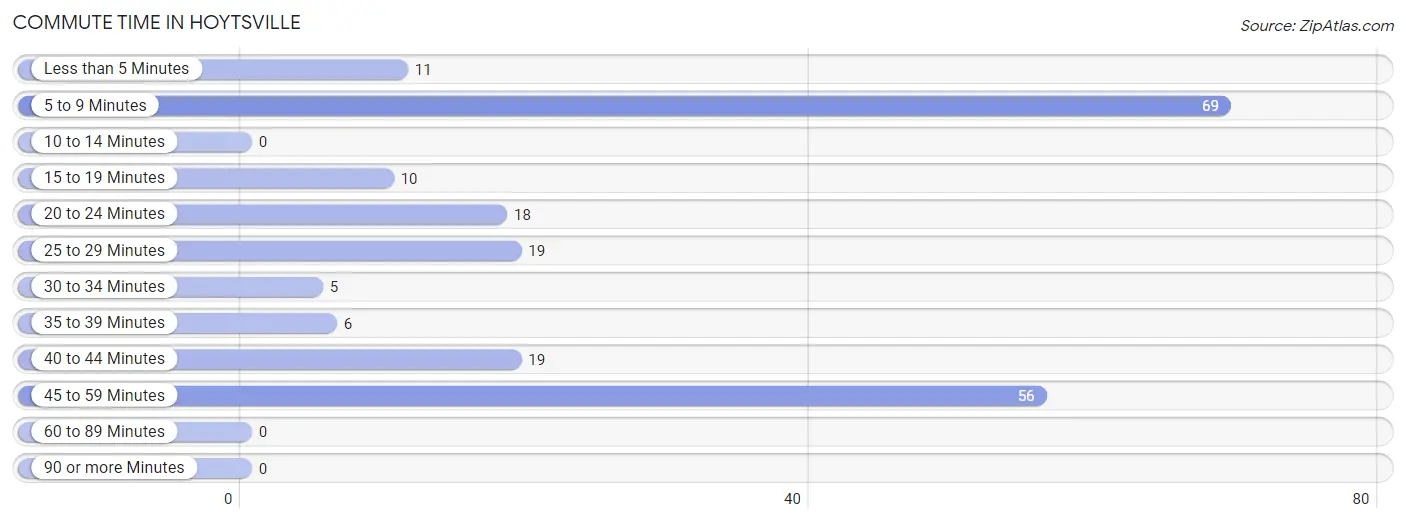
| Commute Time | # Commuters | % Commuters |
| Less than 5 Minutes | 11 | 5.2% |
| 5 to 9 Minutes | 69 | 32.4% |
| 10 to 14 Minutes | 0 | 0.0% |
| 15 to 19 Minutes | 10 | 4.7% |
| 20 to 24 Minutes | 18 | 8.5% |
| 25 to 29 Minutes | 19 | 8.9% |
| 30 to 34 Minutes | 5 | 2.4% |
| 35 to 39 Minutes | 6 | 2.8% |
| 40 to 44 Minutes | 19 | 8.9% |
| 45 to 59 Minutes | 56 | 26.3% |
| 60 to 89 Minutes | 0 | 0.0% |
| 90 or more Minutes | 0 | 0.0% |
Commute Time by Sex in Hoytsville
The most common commute times in Hoytsville are 45 to 59 minutes (44 commuters, 32.4%) for males and 5 to 9 minutes (40 commuters, 51.9%) for females.
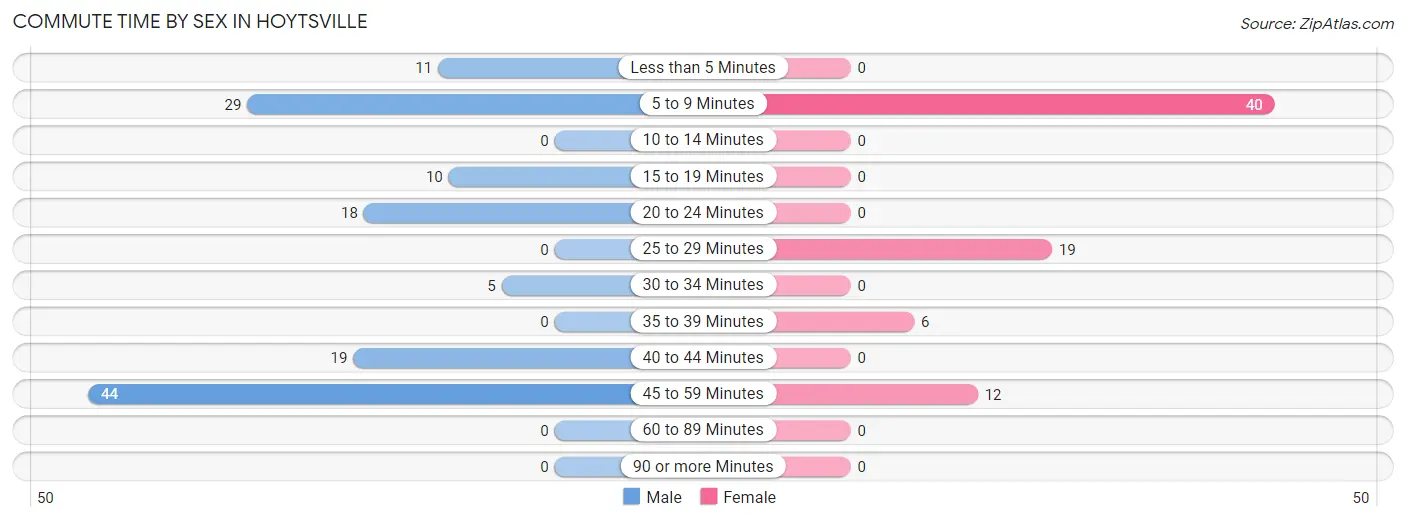
| Commute Time | Male | Female |
| Less than 5 Minutes | 11 (8.1%) | 0 (0.0%) |
| 5 to 9 Minutes | 29 (21.3%) | 40 (51.9%) |
| 10 to 14 Minutes | 0 (0.0%) | 0 (0.0%) |
| 15 to 19 Minutes | 10 (7.3%) | 0 (0.0%) |
| 20 to 24 Minutes | 18 (13.2%) | 0 (0.0%) |
| 25 to 29 Minutes | 0 (0.0%) | 19 (24.7%) |
| 30 to 34 Minutes | 5 (3.7%) | 0 (0.0%) |
| 35 to 39 Minutes | 0 (0.0%) | 6 (7.8%) |
| 40 to 44 Minutes | 19 (14.0%) | 0 (0.0%) |
| 45 to 59 Minutes | 44 (32.4%) | 12 (15.6%) |
| 60 to 89 Minutes | 0 (0.0%) | 0 (0.0%) |
| 90 or more Minutes | 0 (0.0%) | 0 (0.0%) |
Time of Departure to Work by Sex in Hoytsville
The most frequent times of departure to work in Hoytsville are 7:00 AM to 7:29 AM (45, 33.1%) for males and 7:00 AM to 7:29 AM (20, 26.0%) for females.
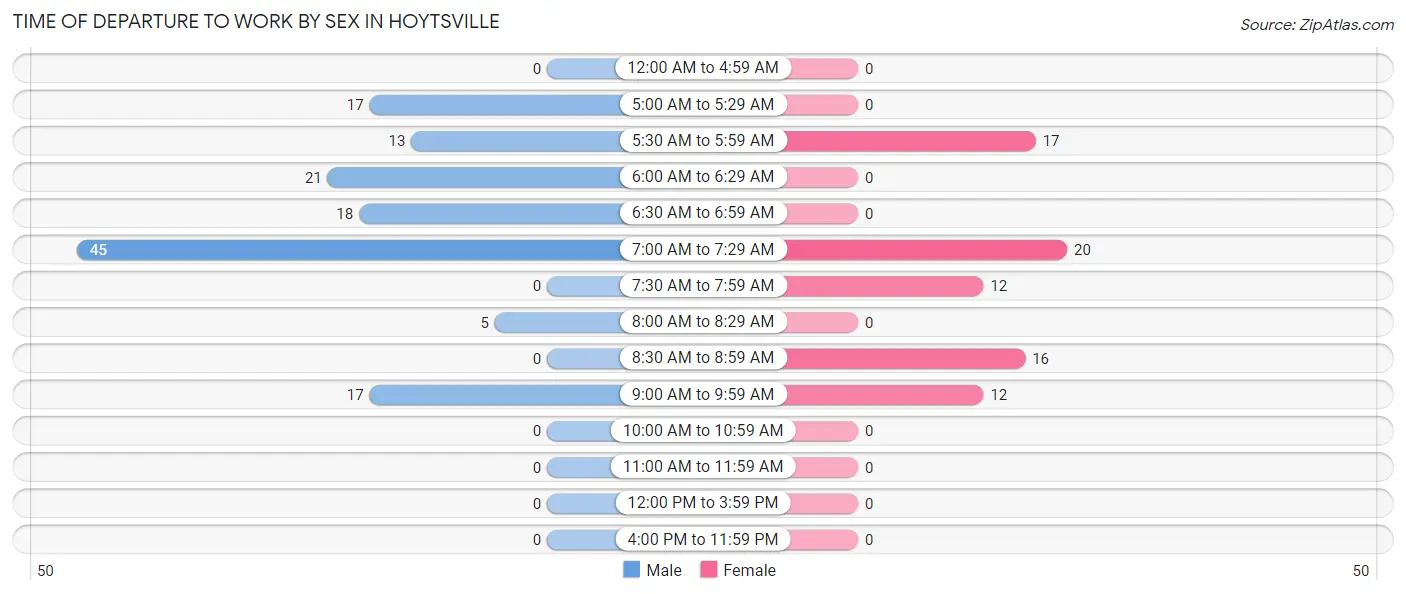
| Time of Departure | Male | Female |
| 12:00 AM to 4:59 AM | 0 (0.0%) | 0 (0.0%) |
| 5:00 AM to 5:29 AM | 17 (12.5%) | 0 (0.0%) |
| 5:30 AM to 5:59 AM | 13 (9.6%) | 17 (22.1%) |
| 6:00 AM to 6:29 AM | 21 (15.4%) | 0 (0.0%) |
| 6:30 AM to 6:59 AM | 18 (13.2%) | 0 (0.0%) |
| 7:00 AM to 7:29 AM | 45 (33.1%) | 20 (26.0%) |
| 7:30 AM to 7:59 AM | 0 (0.0%) | 12 (15.6%) |
| 8:00 AM to 8:29 AM | 5 (3.7%) | 0 (0.0%) |
| 8:30 AM to 8:59 AM | 0 (0.0%) | 16 (20.8%) |
| 9:00 AM to 9:59 AM | 17 (12.5%) | 12 (15.6%) |
| 10:00 AM to 10:59 AM | 0 (0.0%) | 0 (0.0%) |
| 11:00 AM to 11:59 AM | 0 (0.0%) | 0 (0.0%) |
| 12:00 PM to 3:59 PM | 0 (0.0%) | 0 (0.0%) |
| 4:00 PM to 11:59 PM | 0 (0.0%) | 0 (0.0%) |
| Total | 136 (100.0%) | 77 (100.0%) |
Housing Occupancy in Hoytsville
Occupancy by Ownership in Hoytsville
Of the total 269 dwellings in Hoytsville, owner-occupied units account for 149 (55.4%), while renter-occupied units make up 120 (44.6%).
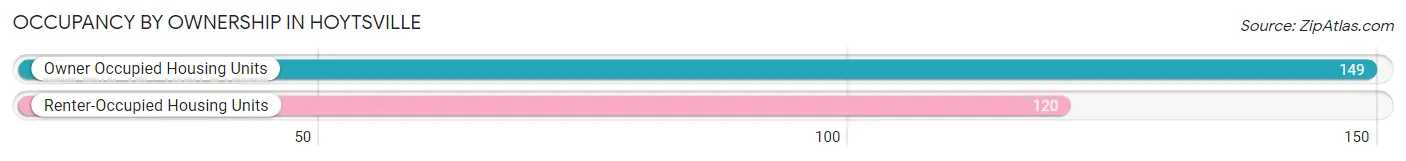
| Occupancy | # Housing Units | % Housing Units |
| Owner Occupied Housing Units | 149 | 55.4% |
| Renter-Occupied Housing Units | 120 | 44.6% |
| Total Occupied Housing Units | 269 | 100.0% |
Occupancy by Household Size in Hoytsville
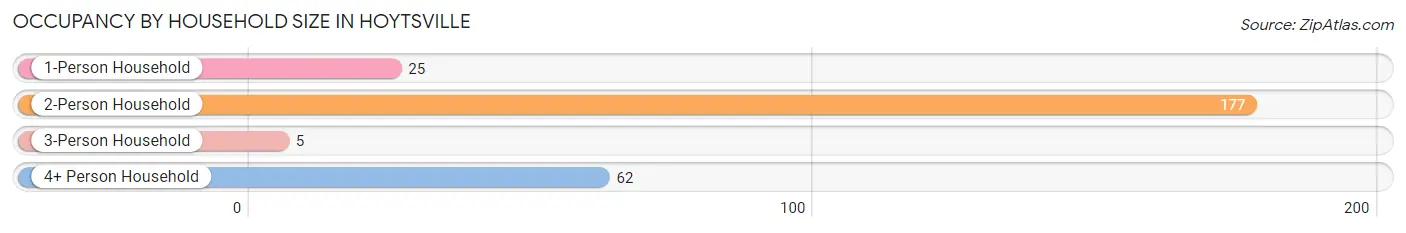
| Household Size | # Housing Units | % Housing Units |
| 1-Person Household | 25 | 9.3% |
| 2-Person Household | 177 | 65.8% |
| 3-Person Household | 5 | 1.9% |
| 4+ Person Household | 62 | 23.1% |
| Total Housing Units | 269 | 100.0% |
Occupancy by Ownership by Household Size in Hoytsville
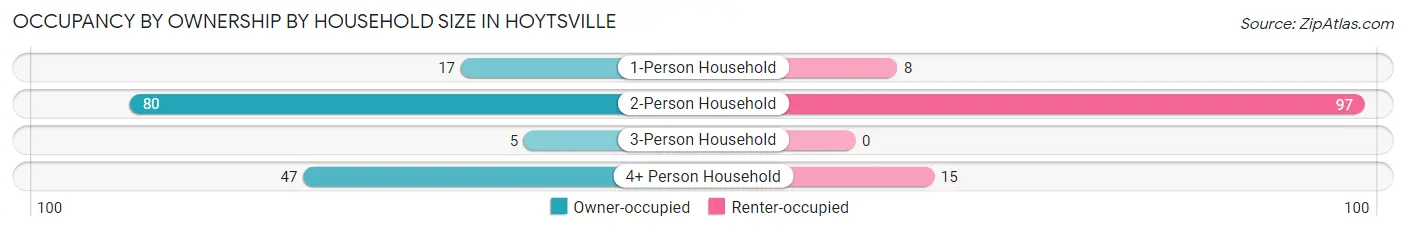
| Household Size | Owner-occupied | Renter-occupied |
| 1-Person Household | 17 (68.0%) | 8 (32.0%) |
| 2-Person Household | 80 (45.2%) | 97 (54.8%) |
| 3-Person Household | 5 (100.0%) | 0 (0.0%) |
| 4+ Person Household | 47 (75.8%) | 15 (24.2%) |
| Total Housing Units | 149 (55.4%) | 120 (44.6%) |
Occupancy by Educational Attainment in Hoytsville
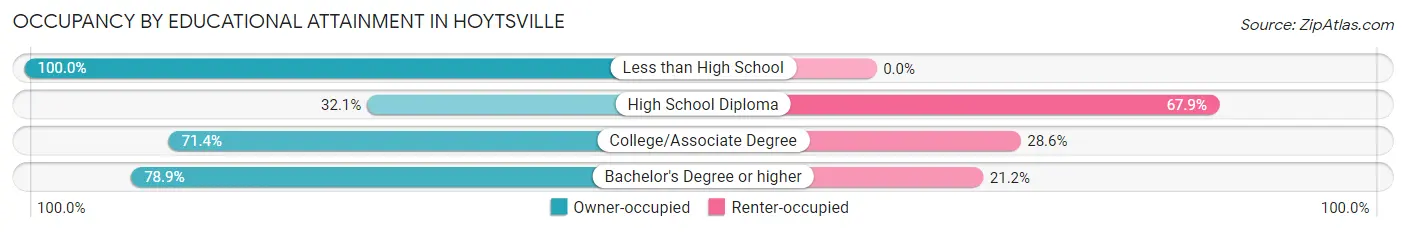
| Household Size | Owner-occupied | Renter-occupied |
| Less than High School | 20 (100.0%) | 0 (0.0%) |
| High School Diploma | 43 (32.1%) | 91 (67.9%) |
| College/Associate Degree | 45 (71.4%) | 18 (28.6%) |
| Bachelor's Degree or higher | 41 (78.8%) | 11 (21.1%) |
Occupancy by Age of Householder in Hoytsville
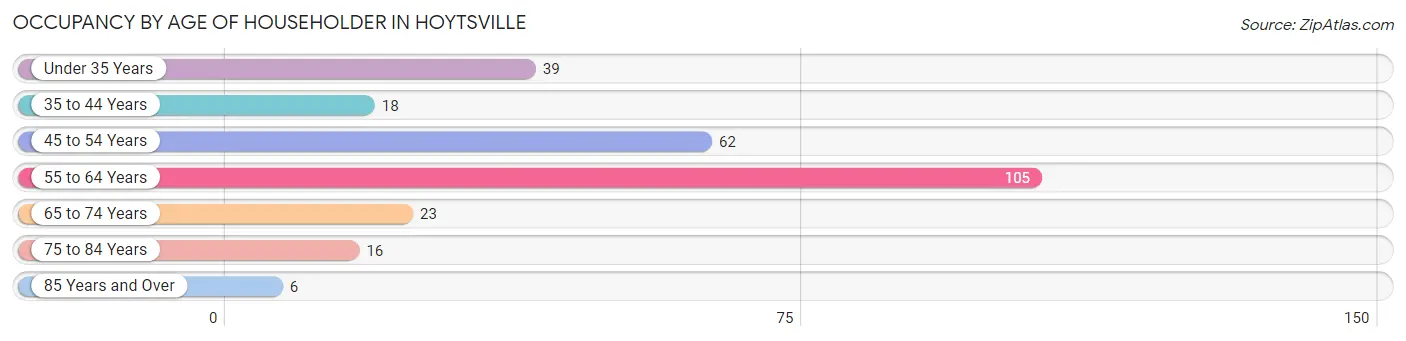
| Age Bracket | # Households | % Households |
| Under 35 Years | 39 | 14.5% |
| 35 to 44 Years | 18 | 6.7% |
| 45 to 54 Years | 62 | 23.1% |
| 55 to 64 Years | 105 | 39.0% |
| 65 to 74 Years | 23 | 8.6% |
| 75 to 84 Years | 16 | 5.9% |
| 85 Years and Over | 6 | 2.2% |
| Total | 269 | 100.0% |
Housing Finances in Hoytsville
Median Income by Occupancy in Hoytsville
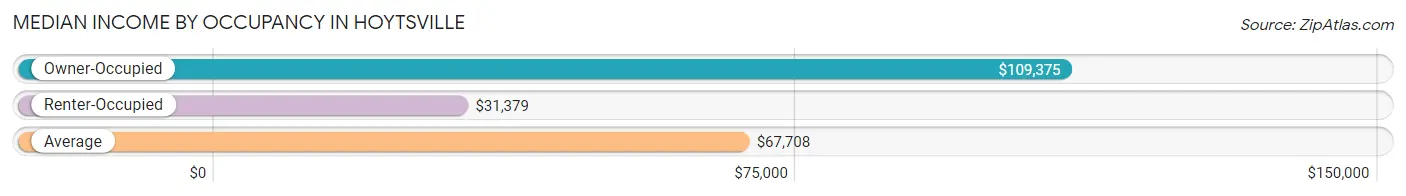
| Occupancy Type | # Households | Median Income |
| Owner-Occupied | 149 (55.4%) | $109,375 |
| Renter-Occupied | 120 (44.6%) | $31,379 |
| Average | 269 (100.0%) | $67,708 |
Occupancy by Householder Income Bracket in Hoytsville
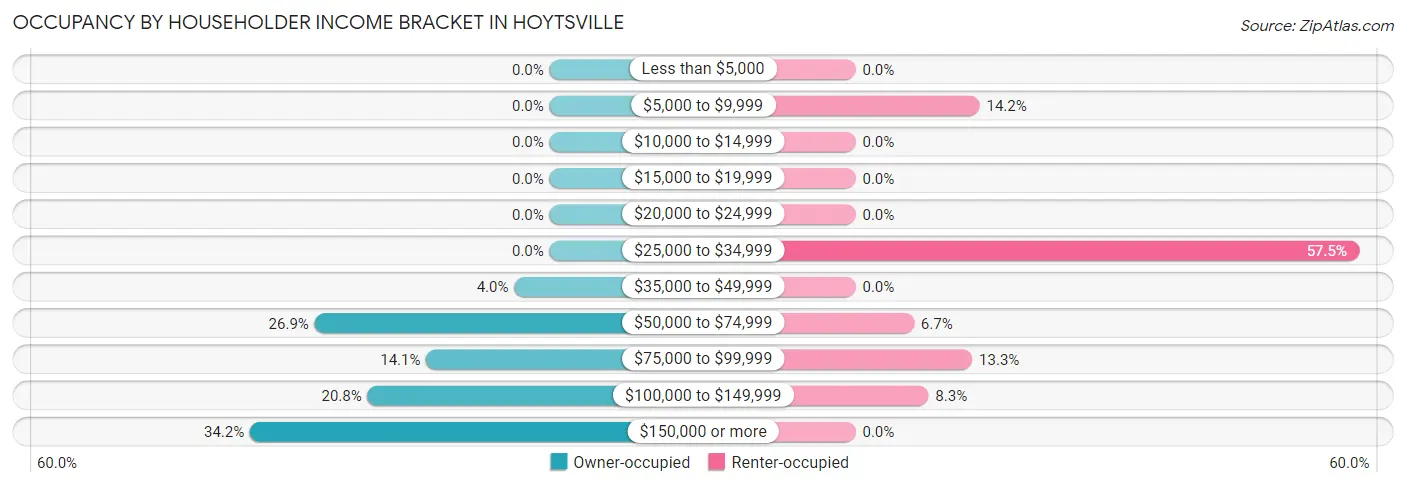
| Income Bracket | Owner-occupied | Renter-occupied |
| Less than $5,000 | 0 (0.0%) | 0 (0.0%) |
| $5,000 to $9,999 | 0 (0.0%) | 17 (14.2%) |
| $10,000 to $14,999 | 0 (0.0%) | 0 (0.0%) |
| $15,000 to $19,999 | 0 (0.0%) | 0 (0.0%) |
| $20,000 to $24,999 | 0 (0.0%) | 0 (0.0%) |
| $25,000 to $34,999 | 0 (0.0%) | 69 (57.5%) |
| $35,000 to $49,999 | 6 (4.0%) | 0 (0.0%) |
| $50,000 to $74,999 | 40 (26.9%) | 8 (6.7%) |
| $75,000 to $99,999 | 21 (14.1%) | 16 (13.3%) |
| $100,000 to $149,999 | 31 (20.8%) | 10 (8.3%) |
| $150,000 or more | 51 (34.2%) | 0 (0.0%) |
| Total | 149 (100.0%) | 120 (100.0%) |
Monthly Housing Cost Tiers in Hoytsville
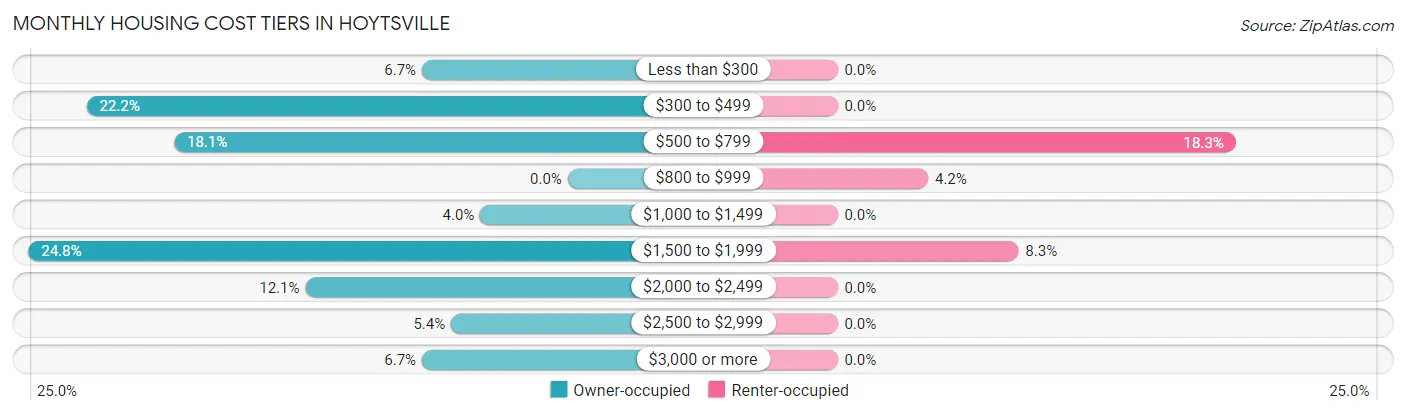
| Monthly Cost | Owner-occupied | Renter-occupied |
| Less than $300 | 10 (6.7%) | 0 (0.0%) |
| $300 to $499 | 33 (22.2%) | 0 (0.0%) |
| $500 to $799 | 27 (18.1%) | 22 (18.3%) |
| $800 to $999 | 0 (0.0%) | 5 (4.2%) |
| $1,000 to $1,499 | 6 (4.0%) | 0 (0.0%) |
| $1,500 to $1,999 | 37 (24.8%) | 10 (8.3%) |
| $2,000 to $2,499 | 18 (12.1%) | 0 (0.0%) |
| $2,500 to $2,999 | 8 (5.4%) | 0 (0.0%) |
| $3,000 or more | 10 (6.7%) | 0 (0.0%) |
| Total | 149 (100.0%) | 120 (100.0%) |
Physical Housing Characteristics in Hoytsville
Housing Structures in Hoytsville
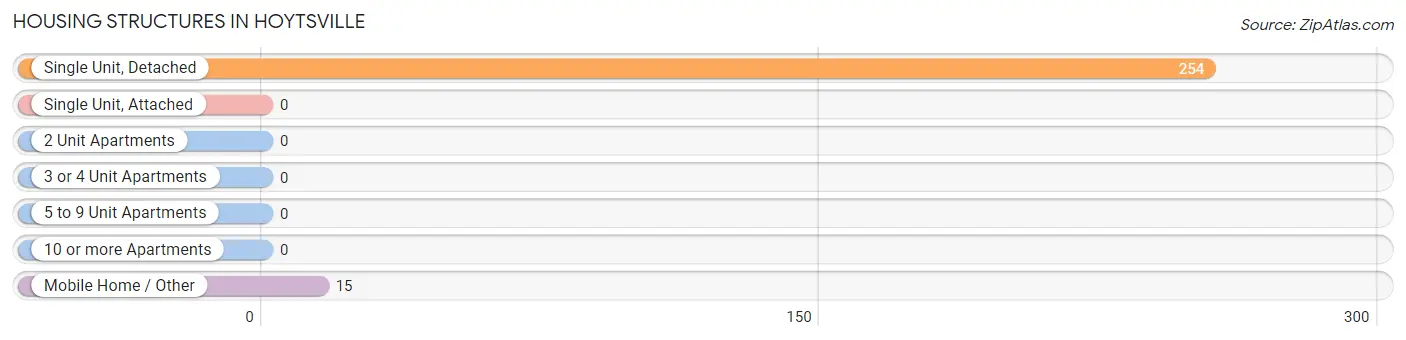
| Structure Type | # Housing Units | % Housing Units |
| Single Unit, Detached | 254 | 94.4% |
| Single Unit, Attached | 0 | 0.0% |
| 2 Unit Apartments | 0 | 0.0% |
| 3 or 4 Unit Apartments | 0 | 0.0% |
| 5 to 9 Unit Apartments | 0 | 0.0% |
| 10 or more Apartments | 0 | 0.0% |
| Mobile Home / Other | 15 | 5.6% |
| Total | 269 | 100.0% |
Housing Structures by Occupancy in Hoytsville
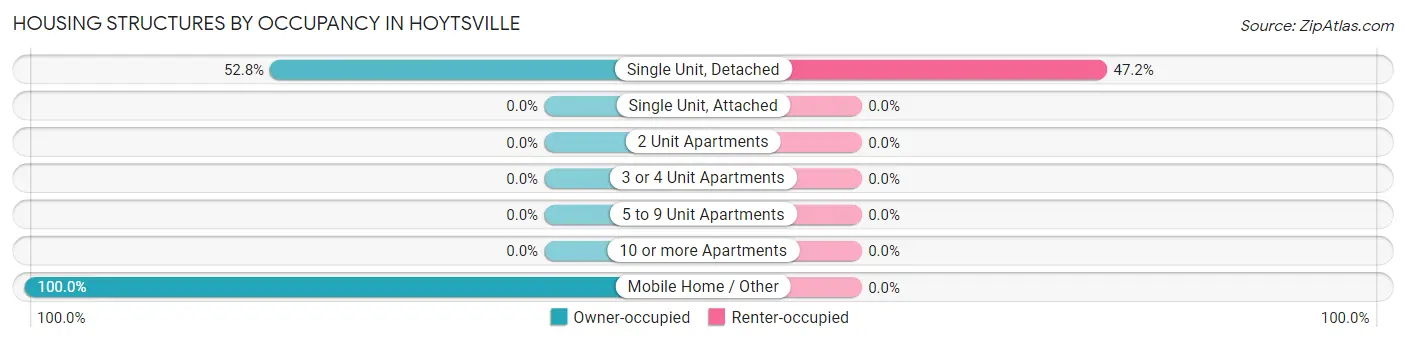
| Structure Type | Owner-occupied | Renter-occupied |
| Single Unit, Detached | 134 (52.8%) | 120 (47.2%) |
| Single Unit, Attached | 0 (0.0%) | 0 (0.0%) |
| 2 Unit Apartments | 0 (0.0%) | 0 (0.0%) |
| 3 or 4 Unit Apartments | 0 (0.0%) | 0 (0.0%) |
| 5 to 9 Unit Apartments | 0 (0.0%) | 0 (0.0%) |
| 10 or more Apartments | 0 (0.0%) | 0 (0.0%) |
| Mobile Home / Other | 15 (100.0%) | 0 (0.0%) |
| Total | 149 (55.4%) | 120 (44.6%) |
Housing Structures by Number of Rooms in Hoytsville
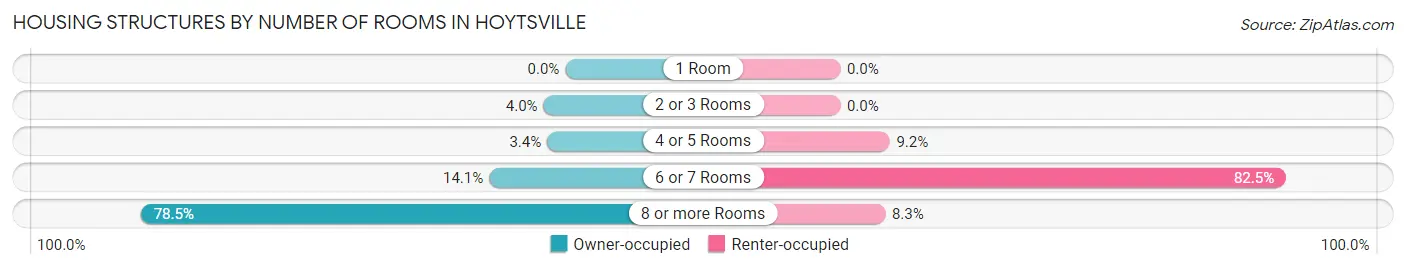
| Number of Rooms | Owner-occupied | Renter-occupied |
| 1 Room | 0 (0.0%) | 0 (0.0%) |
| 2 or 3 Rooms | 6 (4.0%) | 0 (0.0%) |
| 4 or 5 Rooms | 5 (3.4%) | 11 (9.2%) |
| 6 or 7 Rooms | 21 (14.1%) | 99 (82.5%) |
| 8 or more Rooms | 117 (78.5%) | 10 (8.3%) |
| Total | 149 (100.0%) | 120 (100.0%) |
Housing Structure by Heating Type in Hoytsville
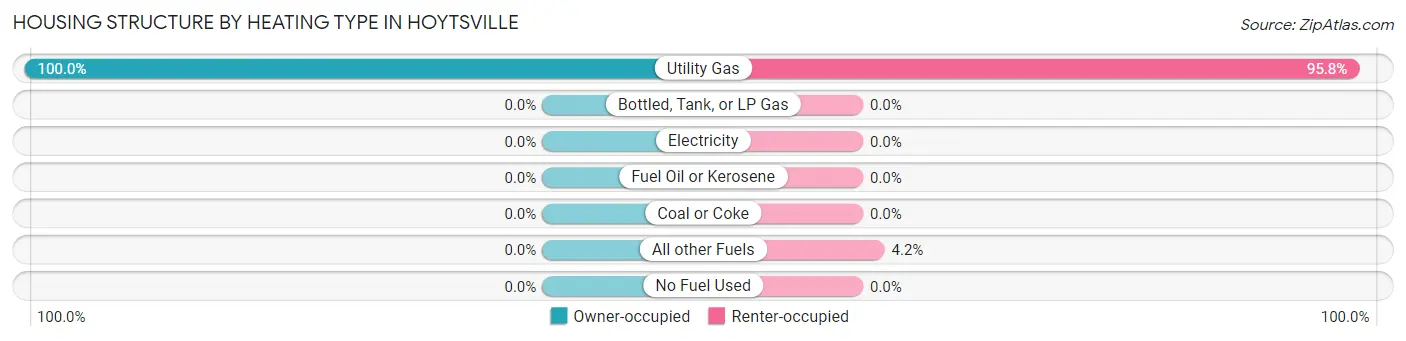
| Heating Type | Owner-occupied | Renter-occupied |
| Utility Gas | 149 (100.0%) | 115 (95.8%) |
| Bottled, Tank, or LP Gas | 0 (0.0%) | 0 (0.0%) |
| Electricity | 0 (0.0%) | 0 (0.0%) |
| Fuel Oil or Kerosene | 0 (0.0%) | 0 (0.0%) |
| Coal or Coke | 0 (0.0%) | 0 (0.0%) |
| All other Fuels | 0 (0.0%) | 5 (4.2%) |
| No Fuel Used | 0 (0.0%) | 0 (0.0%) |
| Total | 149 (100.0%) | 120 (100.0%) |
Household Vehicle Usage in Hoytsville
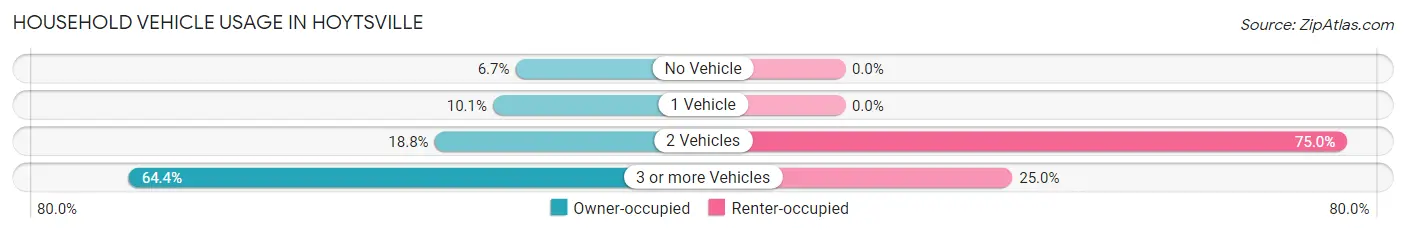
| Vehicles per Household | Owner-occupied | Renter-occupied |
| No Vehicle | 10 (6.7%) | 0 (0.0%) |
| 1 Vehicle | 15 (10.1%) | 0 (0.0%) |
| 2 Vehicles | 28 (18.8%) | 90 (75.0%) |
| 3 or more Vehicles | 96 (64.4%) | 30 (25.0%) |
| Total | 149 (100.0%) | 120 (100.0%) |
Real Estate & Mortgages in Hoytsville
Real Estate and Mortgage Overview in Hoytsville
| Characteristic | Without Mortgage | With Mortgage |
| Housing Units | 70 | 79 |
| Median Property Value | $461,300 | $590,600 |
| Median Household Income | - | - |
| Monthly Housing Costs | $465 | $10 |
| Real Estate Taxes | $1,574 | $0 |
Property Value by Mortgage Status in Hoytsville
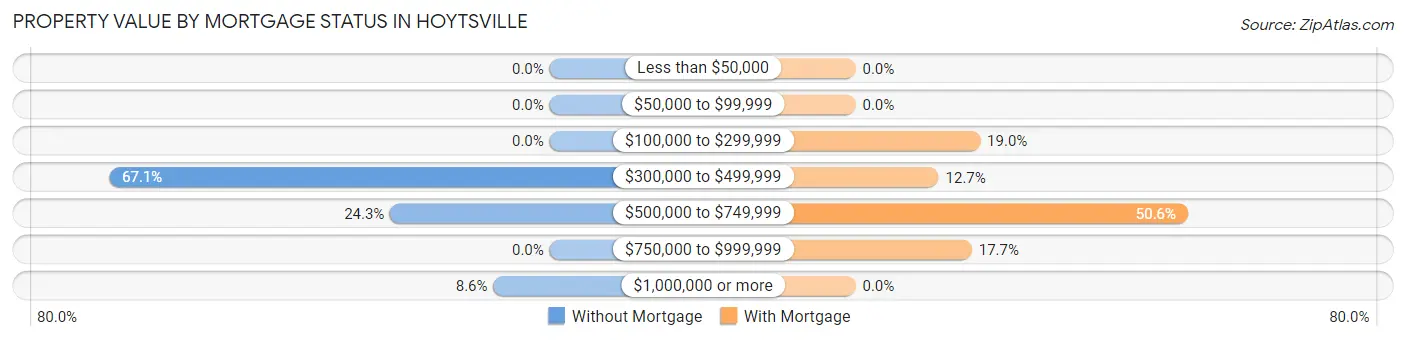
| Property Value | Without Mortgage | With Mortgage |
| Less than $50,000 | 0 (0.0%) | 0 (0.0%) |
| $50,000 to $99,999 | 0 (0.0%) | 0 (0.0%) |
| $100,000 to $299,999 | 0 (0.0%) | 15 (19.0%) |
| $300,000 to $499,999 | 47 (67.1%) | 10 (12.7%) |
| $500,000 to $749,999 | 17 (24.3%) | 40 (50.6%) |
| $750,000 to $999,999 | 0 (0.0%) | 14 (17.7%) |
| $1,000,000 or more | 6 (8.6%) | 0 (0.0%) |
| Total | 70 (100.0%) | 79 (100.0%) |
Household Income by Mortgage Status in Hoytsville
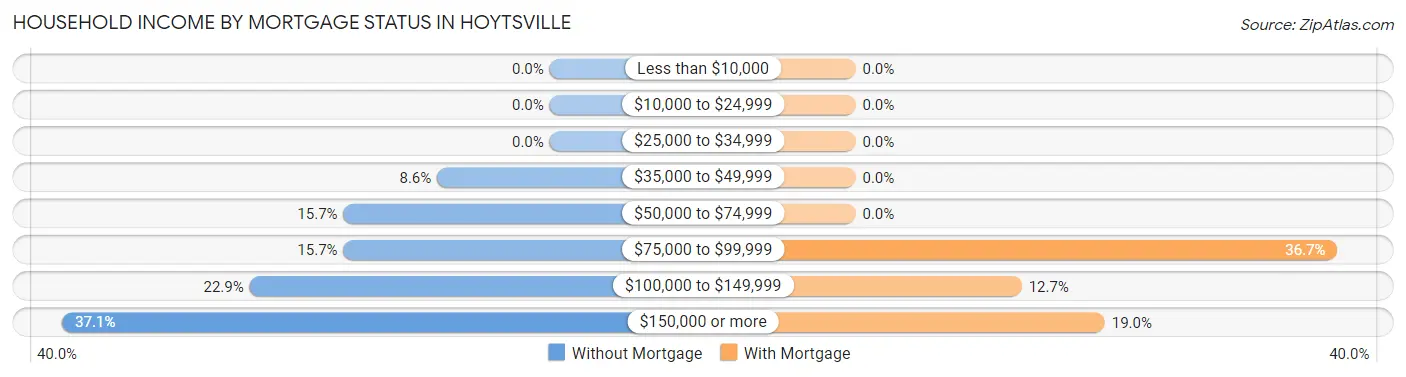
| Household Income | Without Mortgage | With Mortgage |
| Less than $10,000 | 0 (0.0%) | 0 (0.0%) |
| $10,000 to $24,999 | 0 (0.0%) | 0 (0.0%) |
| $25,000 to $34,999 | 0 (0.0%) | 0 (0.0%) |
| $35,000 to $49,999 | 6 (8.6%) | 0 (0.0%) |
| $50,000 to $74,999 | 11 (15.7%) | 0 (0.0%) |
| $75,000 to $99,999 | 11 (15.7%) | 29 (36.7%) |
| $100,000 to $149,999 | 16 (22.9%) | 10 (12.7%) |
| $150,000 or more | 26 (37.1%) | 15 (19.0%) |
| Total | 70 (100.0%) | 79 (100.0%) |
Property Value to Household Income Ratio in Hoytsville
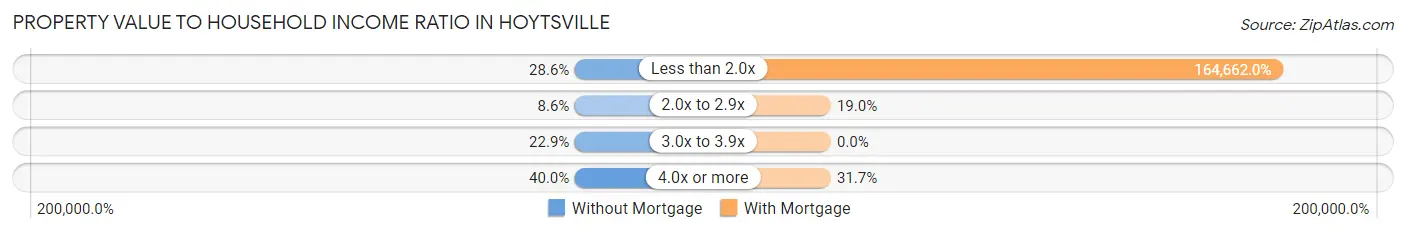
| Value-to-Income Ratio | Without Mortgage | With Mortgage |
| Less than 2.0x | 20 (28.6%) | 130,083 (164,662.0%) |
| 2.0x to 2.9x | 6 (8.6%) | 15 (19.0%) |
| 3.0x to 3.9x | 16 (22.9%) | 0 (0.0%) |
| 4.0x or more | 28 (40.0%) | 25 (31.7%) |
| Total | 70 (100.0%) | 79 (100.0%) |
Real Estate Taxes by Mortgage Status in Hoytsville
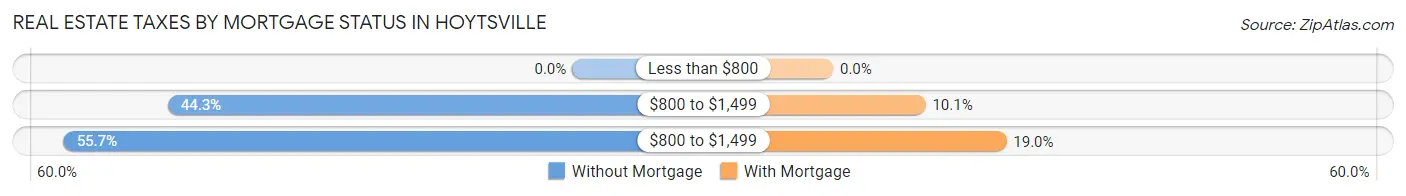
| Property Taxes | Without Mortgage | With Mortgage |
| Less than $800 | 0 (0.0%) | 0 (0.0%) |
| $800 to $1,499 | 31 (44.3%) | 8 (10.1%) |
| $800 to $1,499 | 39 (55.7%) | 15 (19.0%) |
| Total | 70 (100.0%) | 79 (100.0%) |
Health & Disability in Hoytsville
Health Insurance Coverage by Age in Hoytsville
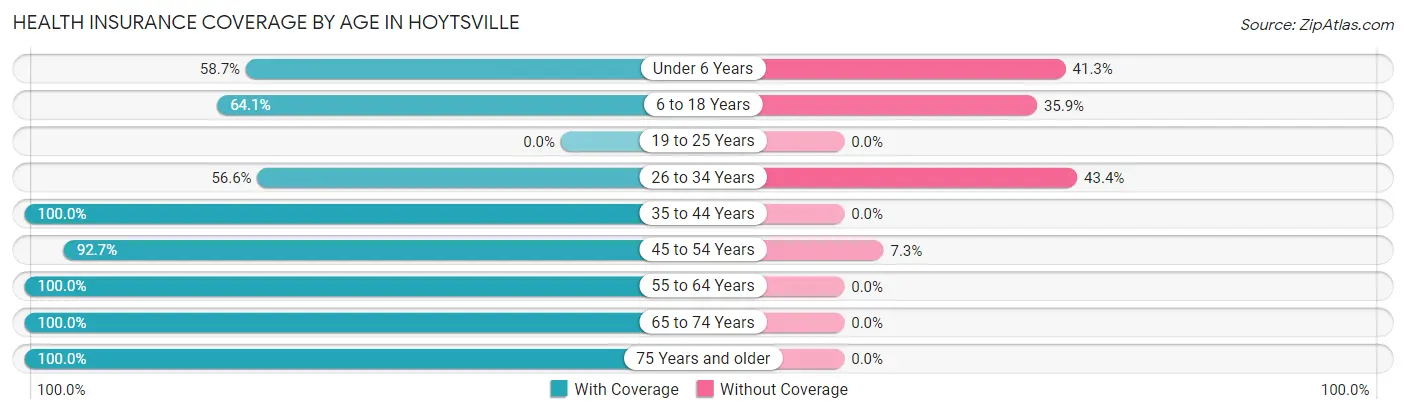
| Age Bracket | With Coverage | Without Coverage |
| Under 6 Years | 37 (58.7%) | 26 (41.3%) |
| 6 to 18 Years | 107 (64.1%) | 60 (35.9%) |
| 19 to 25 Years | 0 (0.0%) | 0 (0.0%) |
| 26 to 34 Years | 43 (56.6%) | 33 (43.4%) |
| 35 to 44 Years | 45 (100.0%) | 0 (0.0%) |
| 45 to 54 Years | 76 (92.7%) | 6 (7.3%) |
| 55 to 64 Years | 179 (100.0%) | 0 (0.0%) |
| 65 to 74 Years | 112 (100.0%) | 0 (0.0%) |
| 75 Years and older | 45 (100.0%) | 0 (0.0%) |
| Total | 644 (83.8%) | 125 (16.3%) |
Health Insurance Coverage by Citizenship Status in Hoytsville
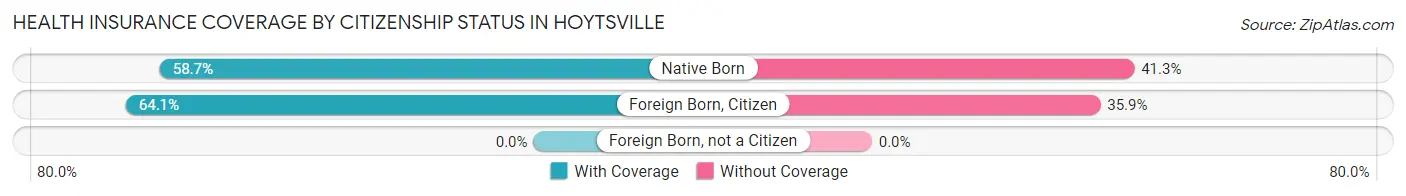
| Citizenship Status | With Coverage | Without Coverage |
| Native Born | 37 (58.7%) | 26 (41.3%) |
| Foreign Born, Citizen | 107 (64.1%) | 60 (35.9%) |
| Foreign Born, not a Citizen | 0 (0.0%) | 0 (0.0%) |
Health Insurance Coverage by Household Income in Hoytsville
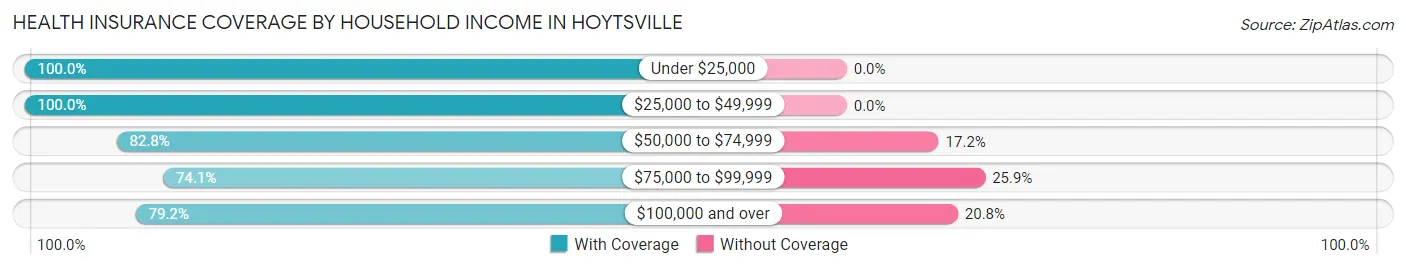
| Household Income | With Coverage | Without Coverage |
| Under $25,000 | 35 (100.0%) | 0 (0.0%) |
| $25,000 to $49,999 | 152 (100.0%) | 0 (0.0%) |
| $50,000 to $74,999 | 101 (82.8%) | 21 (17.2%) |
| $75,000 to $99,999 | 120 (74.1%) | 42 (25.9%) |
| $100,000 and over | 236 (79.2%) | 62 (20.8%) |
Public vs Private Health Insurance Coverage by Age in Hoytsville
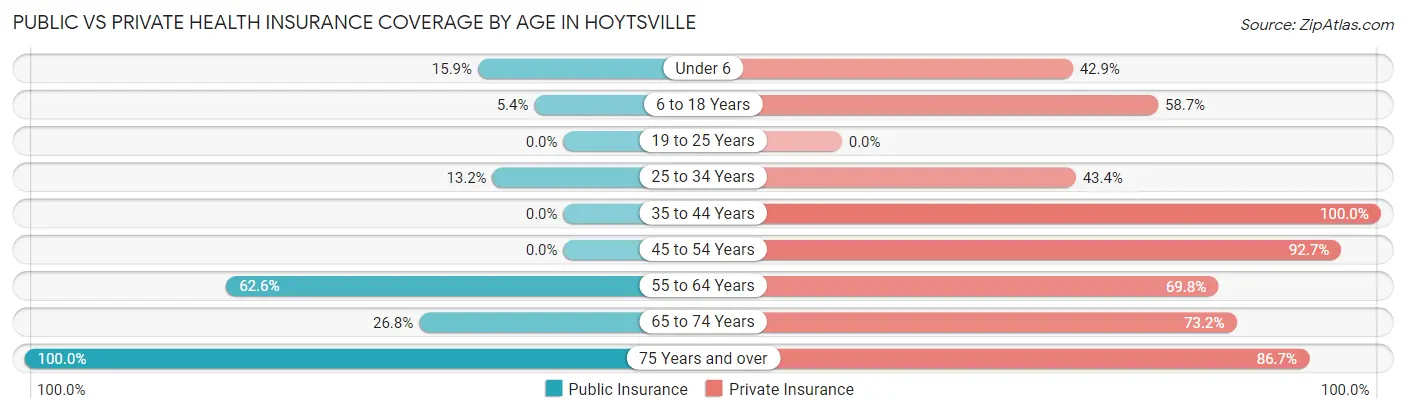
| Age Bracket | Public Insurance | Private Insurance |
| Under 6 | 10 (15.9%) | 27 (42.9%) |
| 6 to 18 Years | 9 (5.4%) | 98 (58.7%) |
| 19 to 25 Years | 0 (0.0%) | 0 (0.0%) |
| 25 to 34 Years | 10 (13.2%) | 33 (43.4%) |
| 35 to 44 Years | 0 (0.0%) | 45 (100.0%) |
| 45 to 54 Years | 0 (0.0%) | 76 (92.7%) |
| 55 to 64 Years | 112 (62.6%) | 125 (69.8%) |
| 65 to 74 Years | 30 (26.8%) | 82 (73.2%) |
| 75 Years and over | 45 (100.0%) | 39 (86.7%) |
| Total | 216 (28.1%) | 525 (68.3%) |
Disability Status by Sex by Age in Hoytsville
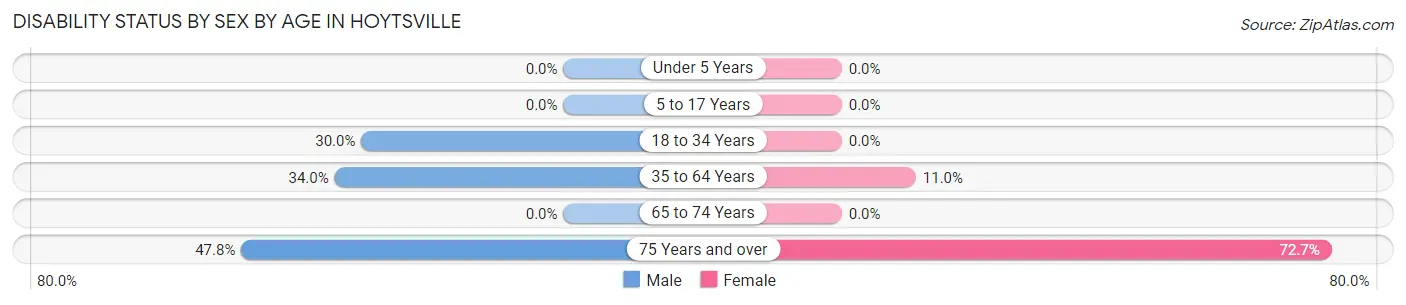
| Age Bracket | Male | Female |
| Under 5 Years | 0 (0.0%) | 0 (0.0%) |
| 5 to 17 Years | 0 (0.0%) | 0 (0.0%) |
| 18 to 34 Years | 15 (30.0%) | 0 (0.0%) |
| 35 to 64 Years | 70 (34.0%) | 11 (11.0%) |
| 65 to 74 Years | 0 (0.0%) | 0 (0.0%) |
| 75 Years and over | 11 (47.8%) | 16 (72.7%) |
Disability Class by Sex by Age in Hoytsville
Disability Class: Hearing Difficulty
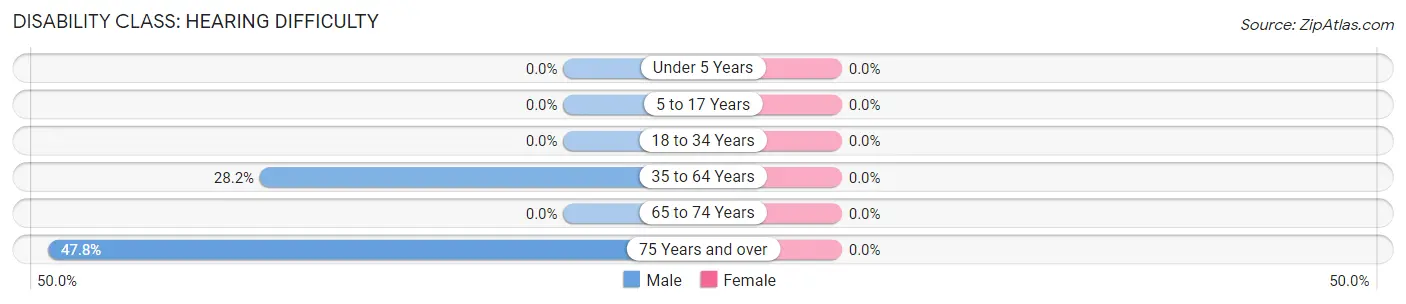
| Age Bracket | Male | Female |
| Under 5 Years | 0 (0.0%) | 0 (0.0%) |
| 5 to 17 Years | 0 (0.0%) | 0 (0.0%) |
| 18 to 34 Years | 0 (0.0%) | 0 (0.0%) |
| 35 to 64 Years | 58 (28.2%) | 0 (0.0%) |
| 65 to 74 Years | 0 (0.0%) | 0 (0.0%) |
| 75 Years and over | 11 (47.8%) | 0 (0.0%) |
Disability Class: Vision Difficulty
| Age Bracket | Male | Female |
| Under 5 Years | 0 (0.0%) | 0 (0.0%) |
| 5 to 17 Years | 0 (0.0%) | 0 (0.0%) |
| 18 to 34 Years | 0 (0.0%) | 0 (0.0%) |
| 35 to 64 Years | 0 (0.0%) | 0 (0.0%) |
| 65 to 74 Years | 0 (0.0%) | 0 (0.0%) |
| 75 Years and over | 0 (0.0%) | 0 (0.0%) |
Disability Class: Cognitive Difficulty
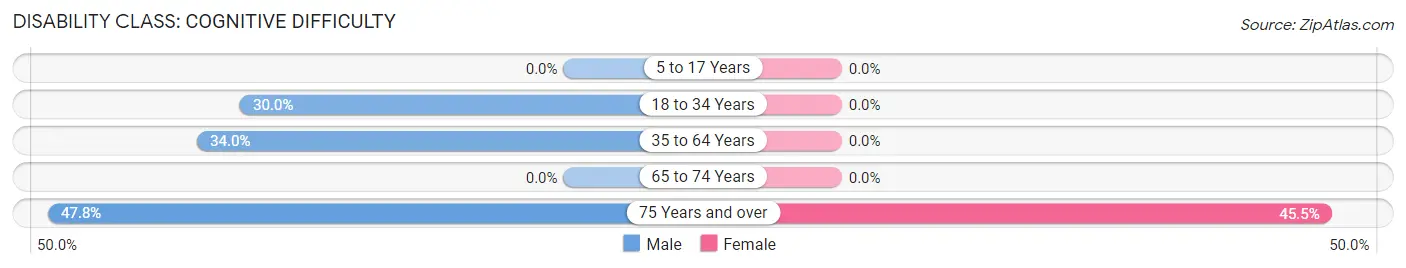
| Age Bracket | Male | Female |
| 5 to 17 Years | 0 (0.0%) | 0 (0.0%) |
| 18 to 34 Years | 15 (30.0%) | 0 (0.0%) |
| 35 to 64 Years | 70 (34.0%) | 0 (0.0%) |
| 65 to 74 Years | 0 (0.0%) | 0 (0.0%) |
| 75 Years and over | 11 (47.8%) | 10 (45.5%) |
Disability Class: Ambulatory Difficulty
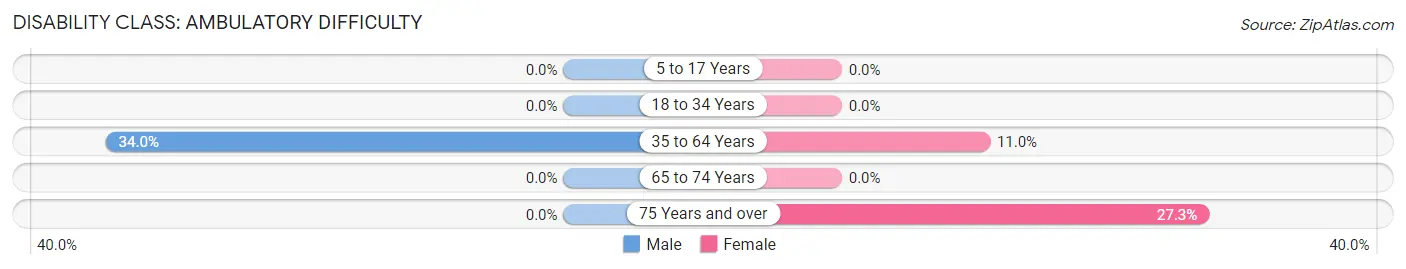
| Age Bracket | Male | Female |
| 5 to 17 Years | 0 (0.0%) | 0 (0.0%) |
| 18 to 34 Years | 0 (0.0%) | 0 (0.0%) |
| 35 to 64 Years | 70 (34.0%) | 11 (11.0%) |
| 65 to 74 Years | 0 (0.0%) | 0 (0.0%) |
| 75 Years and over | 0 (0.0%) | 6 (27.3%) |
Disability Class: Self-Care Difficulty
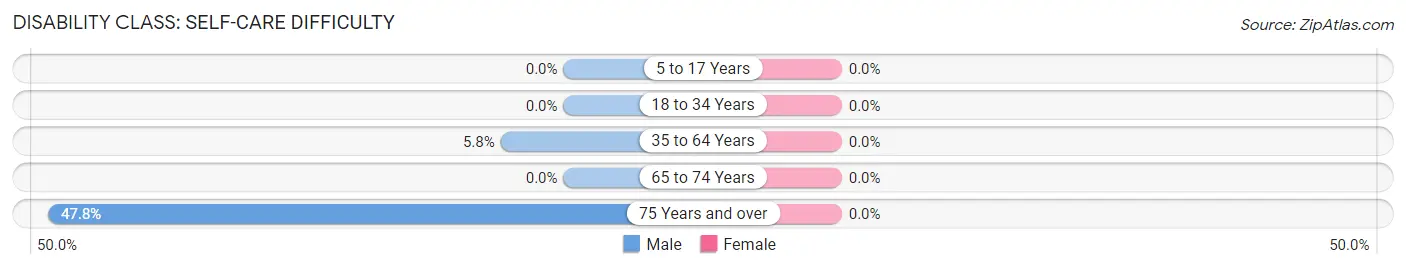
| Age Bracket | Male | Female |
| 5 to 17 Years | 0 (0.0%) | 0 (0.0%) |
| 18 to 34 Years | 0 (0.0%) | 0 (0.0%) |
| 35 to 64 Years | 12 (5.8%) | 0 (0.0%) |
| 65 to 74 Years | 0 (0.0%) | 0 (0.0%) |
| 75 Years and over | 11 (47.8%) | 0 (0.0%) |
Technology Access in Hoytsville
Computing Device Access in Hoytsville
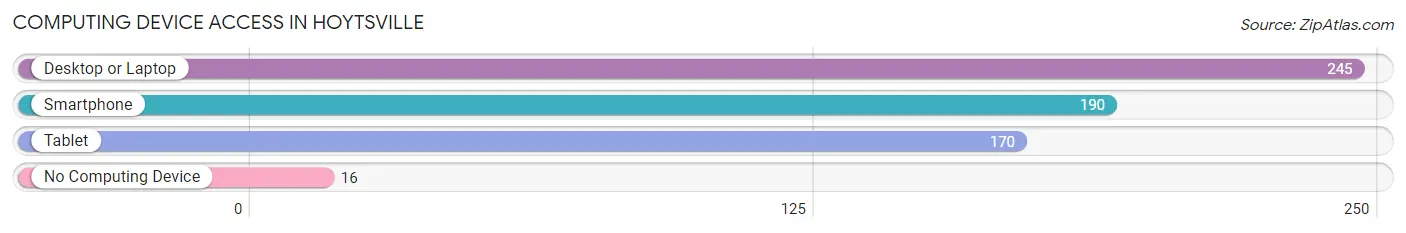
| Device Type | # Households | % Households |
| Desktop or Laptop | 245 | 91.1% |
| Smartphone | 190 | 70.6% |
| Tablet | 170 | 63.2% |
| No Computing Device | 16 | 5.9% |
| Total | 269 | 100.0% |
Internet Access in Hoytsville
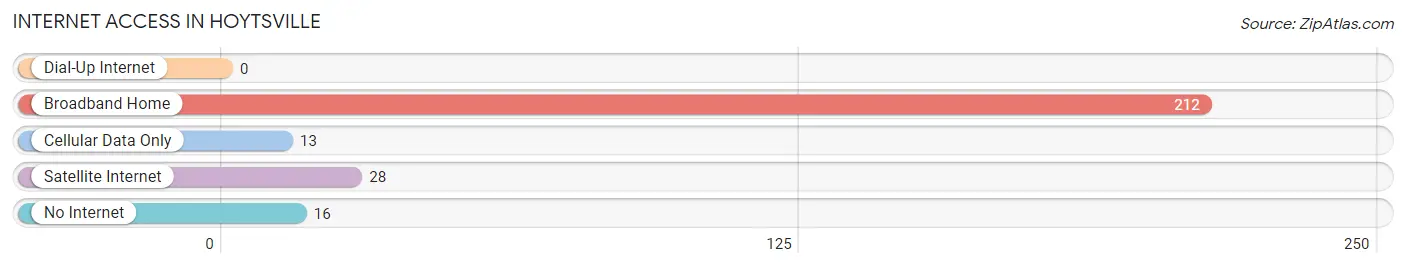
| Internet Type | # Households | % Households |
| Dial-Up Internet | 0 | 0.0% |
| Broadband Home | 212 | 78.8% |
| Cellular Data Only | 13 | 4.8% |
| Satellite Internet | 28 | 10.4% |
| No Internet | 16 | 5.9% |
| Total | 269 | 100.0% |
Hoytsville Summary
Hoytsville is a small town located in Summit County, Utah, United States. It is situated in the Wasatch Mountains, approximately 20 miles east of Park City and 30 miles southeast of Salt Lake City. The population of Hoytsville was estimated to be 545 in 2019.
History
Hoytsville was first settled in 1868 by a group of Mormon pioneers led by John Hoyt. The town was named after Hoyt, who was a prominent leader in the Church of Jesus Christ of Latter-day Saints. The town was originally a farming community, but it soon became a mining town when silver and lead were discovered in the area. The mining industry was the main source of income for the town until the early 1900s, when the mines began to close.
In the early 1900s, the town began to transition to a more rural lifestyle. The town was home to a number of small businesses, including a general store, a blacksmith shop, and a sawmill. The town also had a post office, which was established in 1891.
Geography
Hoytsville is located in Summit County, Utah, in the Wasatch Mountains. The town is situated at an elevation of 6,400 feet above sea level. The town is surrounded by mountains, including the Uinta Mountains to the east and the Wasatch Range to the west. The town is located near the Weber River, which flows through the area.
The climate in Hoytsville is generally mild, with cold winters and warm summers. The average annual temperature is around 40 degrees Fahrenheit. The average annual precipitation is around 20 inches.
Economy
Hoytsville is a small, rural town with a limited economy. The town is home to a few small businesses, including a general store, a gas station, and a few restaurants. The town is also home to a few small farms, which produce hay, vegetables, and livestock.
The town is also home to a few tourist attractions, including the Hoytsville Historical Museum and the Hoytsville Hot Springs. The town is also home to a few outdoor recreation areas, including the Hoytsville State Park and the Hoytsville National Forest.
Demographics
Hoytsville is a small, rural town with a population of 545 in 2019. The town is predominantly white, with a small Hispanic population. The median household income in Hoytsville is around $50,000, and the median home value is around $200,000. The town has a low unemployment rate, and the majority of the population is employed in the service industry.
Common Questions
What is Per Capita Income in Hoytsville?
Per Capita income in Hoytsville is $34,132.
What is the Median Family Income in Hoytsville?
Median Family Income in Hoytsville is $85,547.
What is the Median Household income in Hoytsville?
Median Household Income in Hoytsville is $67,708.
What is Income or Wage Gap in Hoytsville?
Income or Wage Gap in Hoytsville is 50.2%.
Women in Hoytsville earn 49.8 cents for every dollar earned by a man.
What is Inequality or Gini Index in Hoytsville?
Inequality or Gini Index in Hoytsville is 0.44.
What is the Total Population of Hoytsville?
Total Population of Hoytsville is 769.
What is the Total Male Population of Hoytsville?
Total Male Population of Hoytsville is 400.
What is the Total Female Population of Hoytsville?
Total Female Population of Hoytsville is 369.
What is the Ratio of Males per 100 Females in Hoytsville?
There are 108.40 Males per 100 Females in Hoytsville.
What is the Ratio of Females per 100 Males in Hoytsville?
There are 92.25 Females per 100 Males in Hoytsville.
What is the Median Population Age in Hoytsville?
Median Population Age in Hoytsville is 48.6 Years.
What is the Average Family Size in Hoytsville
Average Family Size in Hoytsville is 3.1 People.
What is the Average Household Size in Hoytsville
Average Household Size in Hoytsville is 2.9 People.
How Large is the Labor Force in Hoytsville?
There are 252 People in the Labor Forcein in Hoytsville.
What is the Percentage of People in the Labor Force in Hoytsville?
42.7% of People are in the Labor Force in Hoytsville.
What is the Unemployment Rate in Hoytsville?
Unemployment Rate in Hoytsville is 6.0%.