Hildale, UT Map & Demographics
Hildale Map
Hildale Overview
$16,797
PER CAPITA INCOME
$61,389
AVG FAMILY INCOME
$65,179
AVG HOUSEHOLD INCOME
47.4%
WAGE / INCOME GAP [ % ]
52.6¢/ $1
WAGE / INCOME GAP [ $ ]
0.50
INEQUALITY / GINI INDEX
1,076
TOTAL POPULATION
520
MALE POPULATION
556
FEMALE POPULATION
93.53
MALES / 100 FEMALES
106.92
FEMALES / 100 MALES
26.1
MEDIAN AGE
5.9
AVG FAMILY SIZE
6.2
AVG HOUSEHOLD SIZE
422
LABOR FORCE [ PEOPLE ]
58.4%
PERCENT IN LABOR FORCE
6.4%
UNEMPLOYMENT RATE
Hildale Zip Codes
Hildale Area Codes
Income in Hildale
Income Overview in Hildale
Per Capita Income in Hildale is $16,797, while median incomes of families and households are $61,389 and $65,179 respectively.
| Characteristic | Number | Measure |
| Per Capita Income | 1,076 | $16,797 |
| Median Family Income | 166 | $61,389 |
| Mean Family Income | 166 | $83,030 |
| Median Household Income | 173 | $65,179 |
| Mean Household Income | 173 | $88,796 |
| Income Deficit | 166 | $0 |
| Wage / Income Gap (%) | 1,076 | 47.41% |
| Wage / Income Gap ($) | 1,076 | 52.59¢ per $1 |
| Gini / Inequality Index | 1,076 | 0.50 |
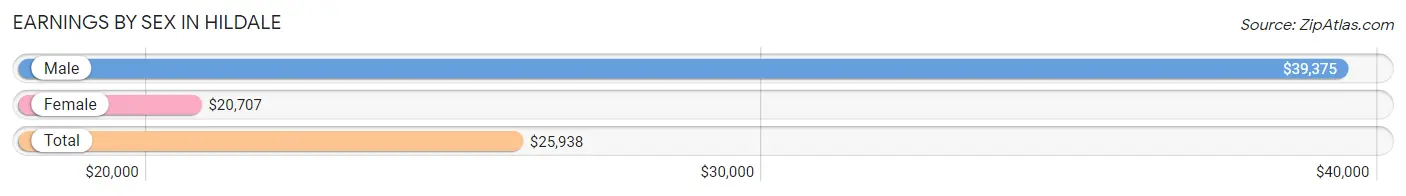
Earnings by Sex in Hildale
Average Earnings in Hildale are $25,938, $39,375 for men and $20,707 for women, a difference of 47.4%.
| Sex | Number | Average Earnings |
| Male | 222 (50.4%) | $39,375 |
| Female | 218 (49.5%) | $20,707 |
| Total | 440 (100.0%) | $25,938 |
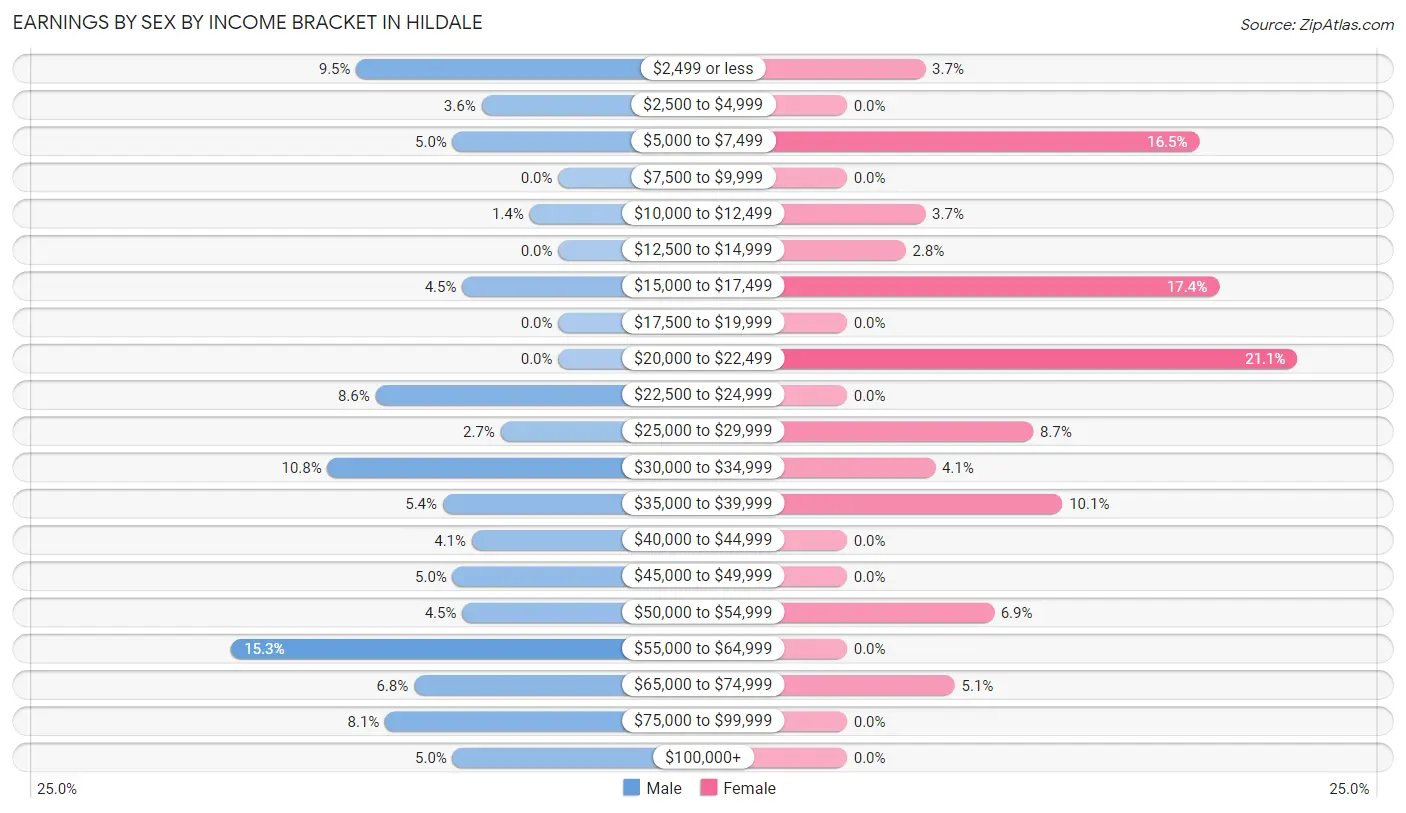
Earnings by Sex by Income Bracket in Hildale
The most common earnings brackets in Hildale are $55,000 to $64,999 for men (34 | 15.3%) and $20,000 to $22,499 for women (46 | 21.1%).
| Income | Male | Female |
| $2,499 or less | 21 (9.5%) | 8 (3.7%) |
| $2,500 to $4,999 | 8 (3.6%) | 0 (0.0%) |
| $5,000 to $7,499 | 11 (5.0%) | 36 (16.5%) |
| $7,500 to $9,999 | 0 (0.0%) | 0 (0.0%) |
| $10,000 to $12,499 | 3 (1.3%) | 8 (3.7%) |
| $12,500 to $14,999 | 0 (0.0%) | 6 (2.8%) |
| $15,000 to $17,499 | 10 (4.5%) | 38 (17.4%) |
| $17,500 to $19,999 | 0 (0.0%) | 0 (0.0%) |
| $20,000 to $22,499 | 0 (0.0%) | 46 (21.1%) |
| $22,500 to $24,999 | 19 (8.6%) | 0 (0.0%) |
| $25,000 to $29,999 | 6 (2.7%) | 19 (8.7%) |
| $30,000 to $34,999 | 24 (10.8%) | 9 (4.1%) |
| $35,000 to $39,999 | 12 (5.4%) | 22 (10.1%) |
| $40,000 to $44,999 | 9 (4.1%) | 0 (0.0%) |
| $45,000 to $49,999 | 11 (5.0%) | 0 (0.0%) |
| $50,000 to $54,999 | 10 (4.5%) | 15 (6.9%) |
| $55,000 to $64,999 | 34 (15.3%) | 0 (0.0%) |
| $65,000 to $74,999 | 15 (6.8%) | 11 (5.1%) |
| $75,000 to $99,999 | 18 (8.1%) | 0 (0.0%) |
| $100,000+ | 11 (5.0%) | 0 (0.0%) |
| Total | 222 (100.0%) | 218 (100.0%) |
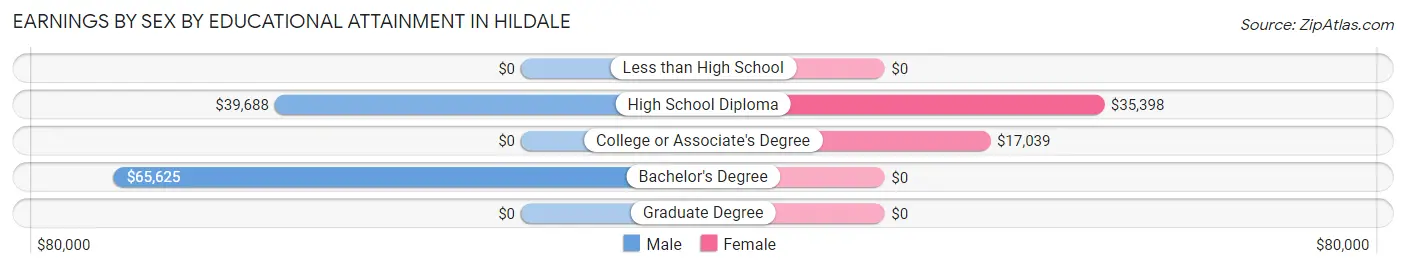
Earnings by Sex by Educational Attainment in Hildale
Average earnings in Hildale are $51,125 for men and $21,146 for women, a difference of 58.6%. Men with an educational attainment of bachelor's degree enjoy the highest average annual earnings of $65,625, while those with high school diploma education earn the least with $39,688. Women with an educational attainment of high school diploma earn the most with the average annual earnings of $35,398, while those with college or associate's degree education have the smallest earnings of $17,039.
| Educational Attainment | Male Income | Female Income |
| Less than High School | - | - |
| High School Diploma | $39,688 | $35,398 |
| College or Associate's Degree | - | - |
| Bachelor's Degree | $65,625 | $0 |
| Graduate Degree | - | - |
| Total | $51,125 | $21,146 |
Family Income in Hildale
Family Income Brackets in Hildale
According to the Hildale family income data, there are 36 families falling into the $50,000 to $74,999 income range, which is the most common income bracket and makes up 21.7% of all families. Conversely, the $150,000 to $199,999 income bracket is the least frequent group with only 7 families (4.2%) belonging to this category.
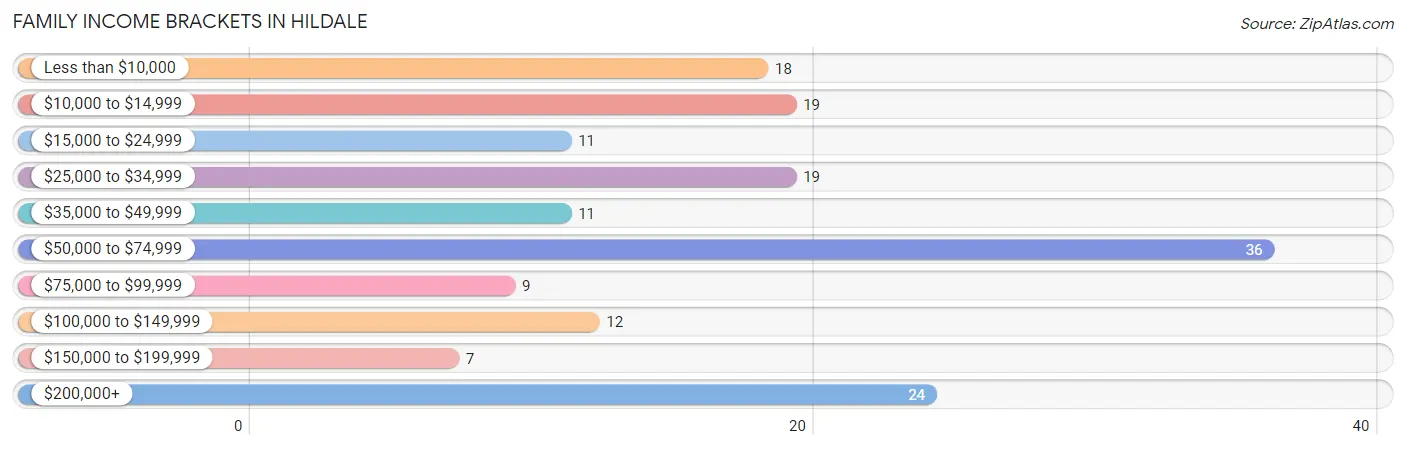
| Income Bracket | # Families | % Families |
| Less than $10,000 | 18 | 10.8% |
| $10,000 to $14,999 | 19 | 11.4% |
| $15,000 to $24,999 | 11 | 6.6% |
| $25,000 to $34,999 | 19 | 11.4% |
| $35,000 to $49,999 | 11 | 6.6% |
| $50,000 to $74,999 | 36 | 21.7% |
| $75,000 to $99,999 | 9 | 5.4% |
| $100,000 to $149,999 | 12 | 7.2% |
| $150,000 to $199,999 | 7 | 4.2% |
| $200,000+ | 24 | 14.5% |
Family Income by Famaliy Size in Hildale
4-person families (74 | 44.6%) account for the highest median family income in Hildale with $48,864 per family, while 4-person families (74 | 44.6%) have the highest median income of $12,216 per family member.
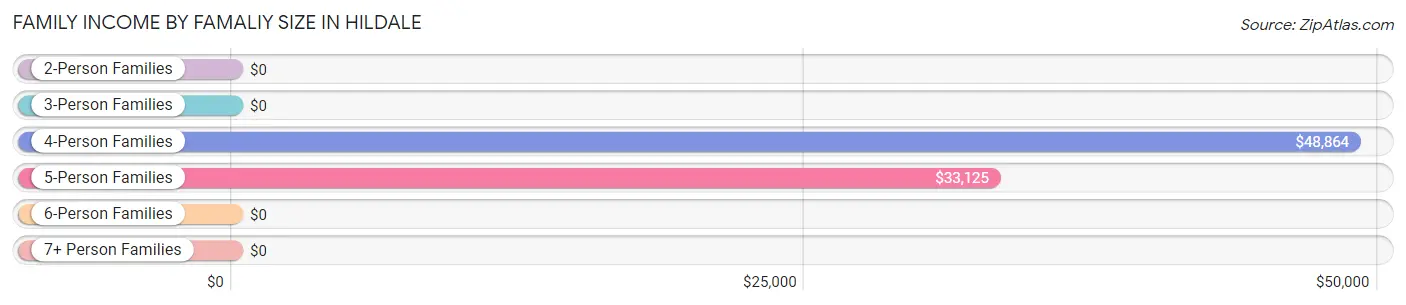
| Income Bracket | # Families | Median Income |
| 2-Person Families | 17 (10.2%) | $0 |
| 3-Person Families | 7 (4.2%) | $0 |
| 4-Person Families | 74 (44.6%) | $48,864 |
| 5-Person Families | 28 (16.9%) | $33,125 |
| 6-Person Families | 10 (6.0%) | $0 |
| 7+ Person Families | 30 (18.1%) | $0 |
| Total | 166 (100.0%) | $61,389 |
Family Income by Number of Earners in Hildale
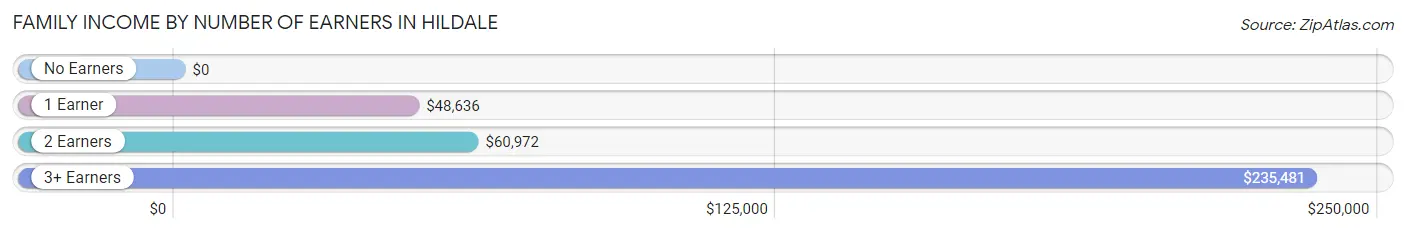
| Number of Earners | # Families | Median Income |
| No Earners | 28 (16.9%) | $0 |
| 1 Earner | 66 (39.8%) | $48,636 |
| 2 Earners | 29 (17.5%) | $60,972 |
| 3+ Earners | 43 (25.9%) | $235,481 |
| Total | 166 (100.0%) | $61,389 |
Household Income in Hildale
Household Income Brackets in Hildale
With 45 households falling in the category, the $50,000 to $74,999 income range is the most frequent in Hildale, accounting for 26.0% of all households. In contrast, only 7 households (4.1%) fall into the $150,000 to $199,999 income bracket, making it the least populous group.
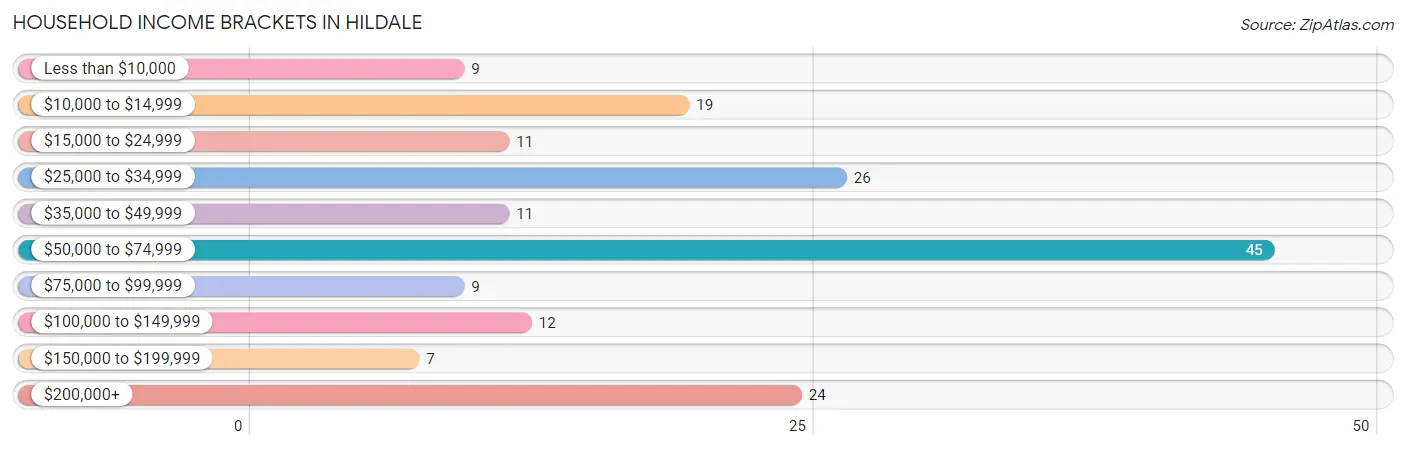
| Income Bracket | # Households | % Households |
| Less than $10,000 | 9 | 5.2% |
| $10,000 to $14,999 | 19 | 11.0% |
| $15,000 to $24,999 | 11 | 6.4% |
| $25,000 to $34,999 | 26 | 15.0% |
| $35,000 to $49,999 | 11 | 6.4% |
| $50,000 to $74,999 | 45 | 26.0% |
| $75,000 to $99,999 | 9 | 5.2% |
| $100,000 to $149,999 | 12 | 6.9% |
| $150,000 to $199,999 | 7 | 4.0% |
| $200,000+ | 24 | 13.9% |
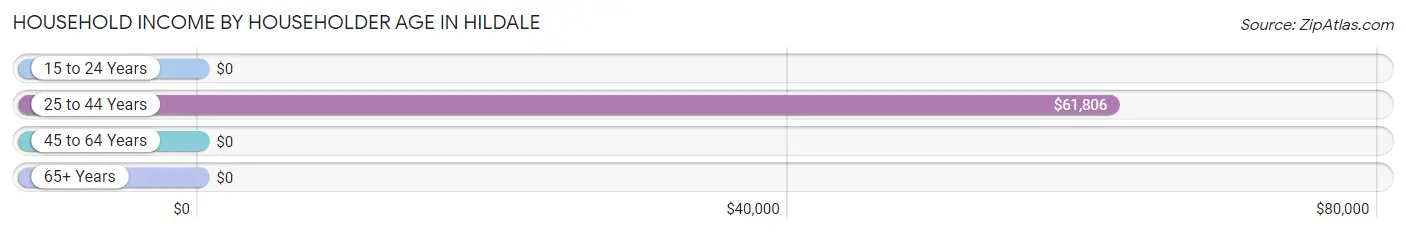
Household Income by Householder Age in Hildale
The median household income in Hildale is $65,179, with the highest median household income of $61,806 found in the 25 to 44 years age bracket for the primary householder. A total of 109 households (63.0%) fall into this category.
| Income Bracket | # Households | Median Income |
| 15 to 24 Years | 0 (0.0%) | $0 |
| 25 to 44 Years | 109 (63.0%) | $61,806 |
| 45 to 64 Years | 51 (29.5%) | $0 |
| 65+ Years | 13 (7.5%) | $0 |
| Total | 173 (100.0%) | $65,179 |
Poverty in Hildale
Income Below Poverty by Sex and Age in Hildale
With 27.3% poverty level for males and 30.0% for females among the residents of Hildale, 12 to 14 year old males and under 5 year old females are the most vulnerable to poverty, with 28 males (100.0%) and 23 females (60.5%) in their respective age groups living below the poverty level.
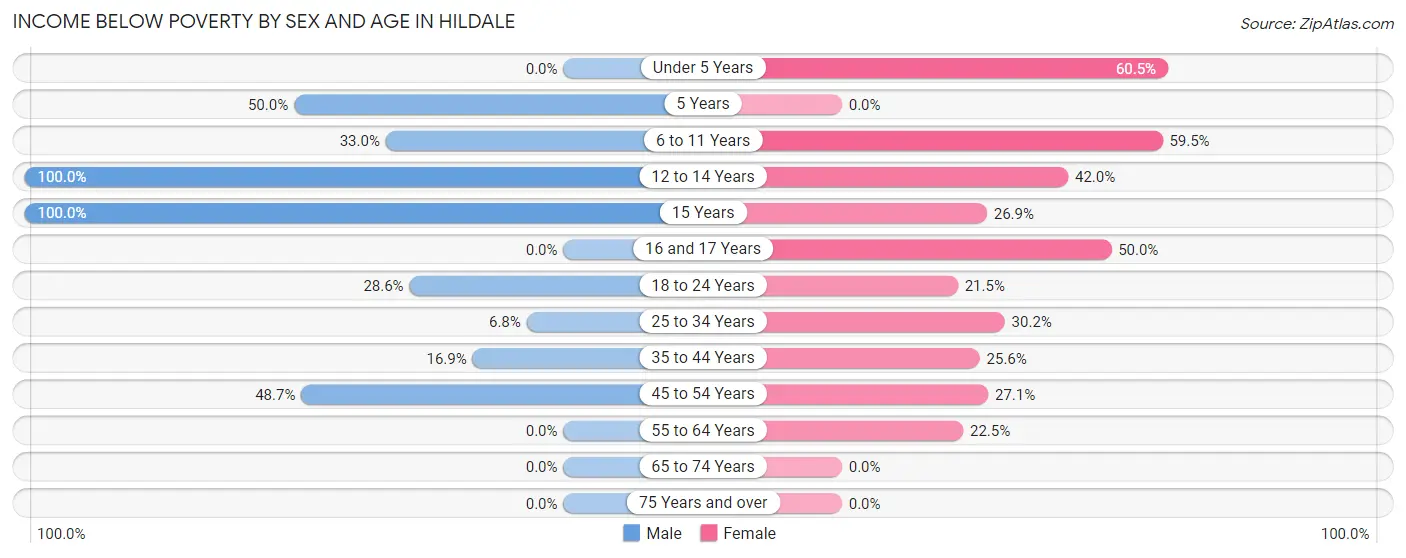
| Age Bracket | Male | Female |
| Under 5 Years | 0 (0.0%) | 23 (60.5%) |
| 5 Years | 8 (50.0%) | 0 (0.0%) |
| 6 to 11 Years | 30 (33.0%) | 25 (59.5%) |
| 12 to 14 Years | 28 (100.0%) | 21 (42.0%) |
| 15 Years | 19 (100.0%) | 7 (26.9%) |
| 16 and 17 Years | 0 (0.0%) | 9 (50.0%) |
| 18 to 24 Years | 18 (28.6%) | 17 (21.5%) |
| 25 to 34 Years | 6 (6.8%) | 26 (30.2%) |
| 35 to 44 Years | 15 (16.9%) | 11 (25.6%) |
| 45 to 54 Years | 18 (48.6%) | 19 (27.1%) |
| 55 to 64 Years | 0 (0.0%) | 9 (22.5%) |
| 65 to 74 Years | 0 (0.0%) | 0 (0.0%) |
| 75 Years and over | 0 (0.0%) | 0 (0.0%) |
| Total | 142 (27.3%) | 167 (30.0%) |
Income Above Poverty by Sex and Age in Hildale
According to the poverty statistics in Hildale, males aged under 5 years and females aged 5 years are the age groups that are most secure financially, with 100.0% of males and 100.0% of females in these age groups living above the poverty line.
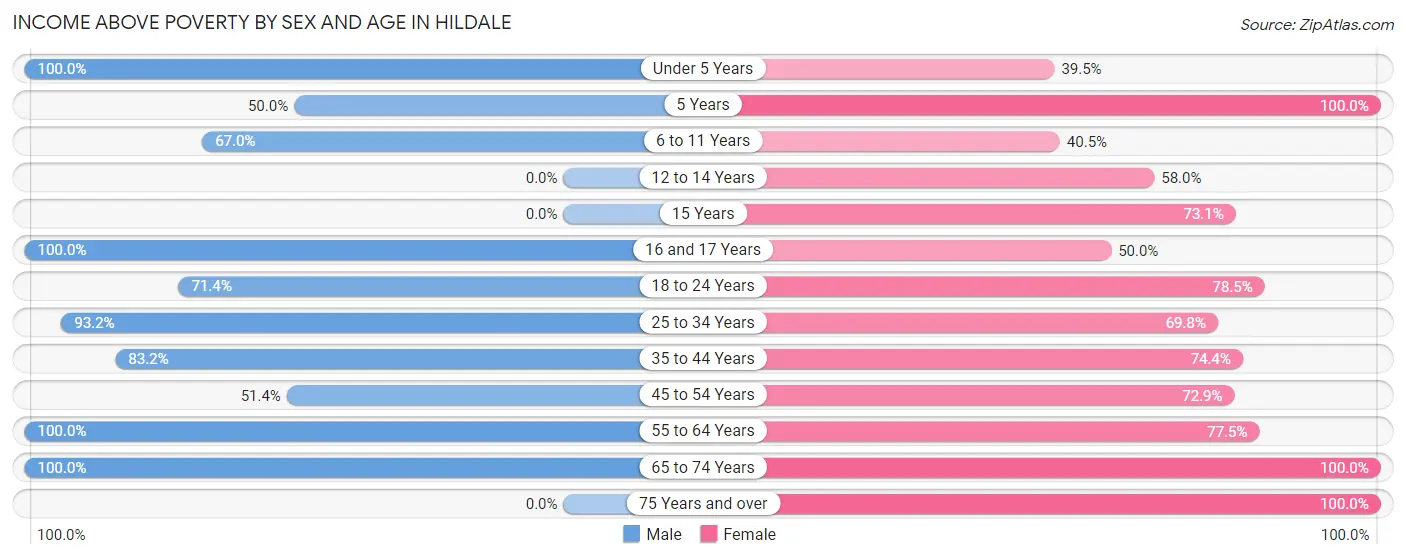
| Age Bracket | Male | Female |
| Under 5 Years | 34 (100.0%) | 15 (39.5%) |
| 5 Years | 8 (50.0%) | 10 (100.0%) |
| 6 to 11 Years | 61 (67.0%) | 17 (40.5%) |
| 12 to 14 Years | 0 (0.0%) | 29 (58.0%) |
| 15 Years | 0 (0.0%) | 19 (73.1%) |
| 16 and 17 Years | 19 (100.0%) | 9 (50.0%) |
| 18 to 24 Years | 45 (71.4%) | 62 (78.5%) |
| 25 to 34 Years | 82 (93.2%) | 60 (69.8%) |
| 35 to 44 Years | 74 (83.2%) | 32 (74.4%) |
| 45 to 54 Years | 19 (51.3%) | 51 (72.9%) |
| 55 to 64 Years | 23 (100.0%) | 31 (77.5%) |
| 65 to 74 Years | 13 (100.0%) | 16 (100.0%) |
| 75 Years and over | 0 (0.0%) | 38 (100.0%) |
| Total | 378 (72.7%) | 389 (70.0%) |
Income Below Poverty Among Married-Couple Families in Hildale
The poverty statistics for married-couple families in Hildale show that 22.1% or 19 of the total 86 families live below the poverty line. Families with 3 or 4 children have the highest poverty rate of 45.2%, comprising of 19 families. On the other hand, families with 1 or 2 children have the lowest poverty rate of 0.0%, which includes 0 families.
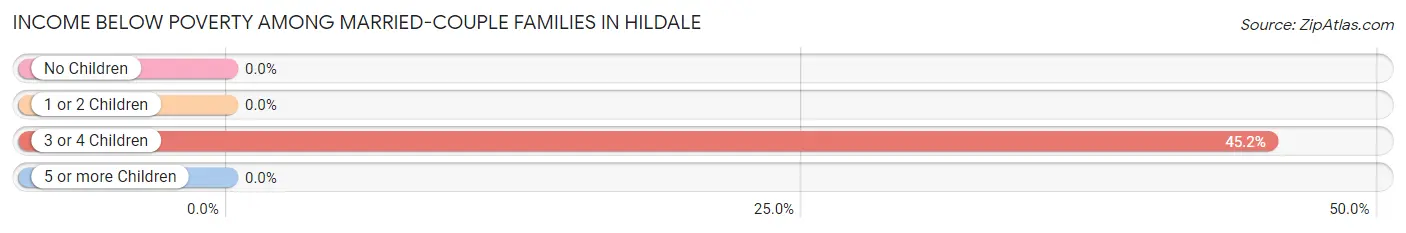
| Children | Above Poverty | Below Poverty |
| No Children | 0 (0.0%) | 0 (0.0%) |
| 1 or 2 Children | 44 (100.0%) | 0 (0.0%) |
| 3 or 4 Children | 23 (54.8%) | 19 (45.2%) |
| 5 or more Children | 0 (0.0%) | 0 (0.0%) |
| Total | 67 (77.9%) | 19 (22.1%) |
Income Below Poverty Among Single-Parent Households in Hildale
According to the poverty data in Hildale, 32.4% or 11 single-father households and 63.0% or 29 single-mother households are living below the poverty line. Among single-father households, those with no children have the highest poverty rate, with 8 households (47.1%) experiencing poverty. Likewise, among single-mother households, those with 3 or 4 children have the highest poverty rate, with 29 households (78.4%) falling below the poverty line.
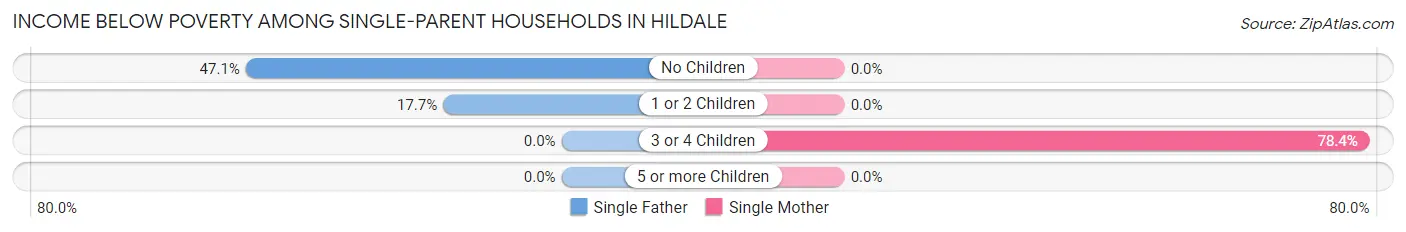
| Children | Single Father | Single Mother |
| No Children | 8 (47.1%) | 0 (0.0%) |
| 1 or 2 Children | 3 (17.6%) | 0 (0.0%) |
| 3 or 4 Children | 0 (0.0%) | 29 (78.4%) |
| 5 or more Children | 0 (0.0%) | 0 (0.0%) |
| Total | 11 (32.4%) | 29 (63.0%) |
Income Below Poverty Among Married-Couple vs Single-Parent Households in Hildale
The poverty data for Hildale shows that 19 of the married-couple family households (22.1%) and 40 of the single-parent households (50.0%) are living below the poverty level. Within the married-couple family households, those with 3 or 4 children have the highest poverty rate, with 19 households (45.2%) falling below the poverty line. Among the single-parent households, those with 3 or 4 children have the highest poverty rate, with 29 household (78.4%) living below poverty.
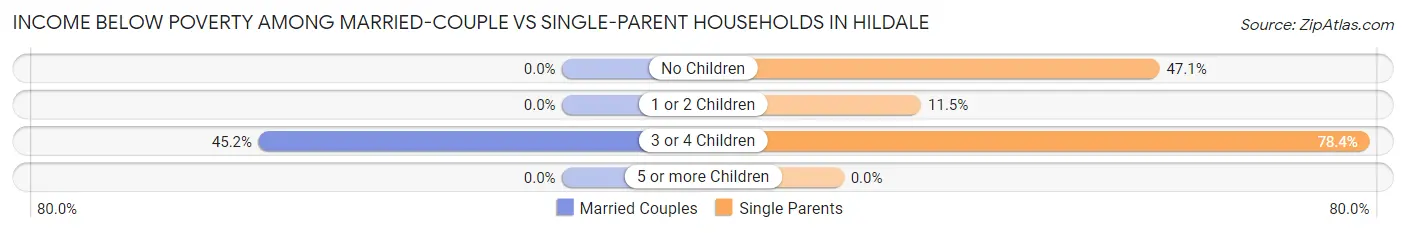
| Children | Married-Couple Families | Single-Parent Households |
| No Children | 0 (0.0%) | 8 (47.1%) |
| 1 or 2 Children | 0 (0.0%) | 3 (11.5%) |
| 3 or 4 Children | 19 (45.2%) | 29 (78.4%) |
| 5 or more Children | 0 (0.0%) | 0 (0.0%) |
| Total | 19 (22.1%) | 40 (50.0%) |
Race in Hildale
The most populous races in Hildale are White / Caucasian (1,002 | 93.1%), Two or more Races (74 | 6.9%), and Hispanic or Latino (66 | 6.1%).
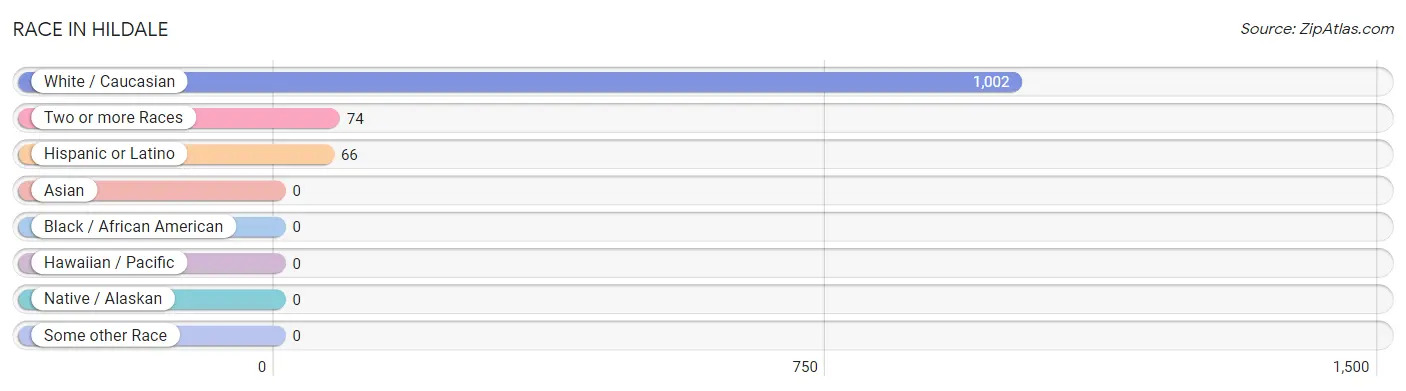
| Race | # Population | % Population |
| Asian | 0 | 0.0% |
| Black / African American | 0 | 0.0% |
| Hawaiian / Pacific | 0 | 0.0% |
| Hispanic or Latino | 66 | 6.1% |
| Native / Alaskan | 0 | 0.0% |
| White / Caucasian | 1,002 | 93.1% |
| Two or more Races | 74 | 6.9% |
| Some other Race | 0 | 0.0% |
| Total | 1,076 | 100.0% |
Ancestry in Hildale
The most populous ancestries reported in Hildale are European (372 | 34.6%), English (363 | 33.7%), German (80 | 7.4%), American (68 | 6.3%), and Mexican (66 | 6.1%), together accounting for 88.2% of all Hildale residents.
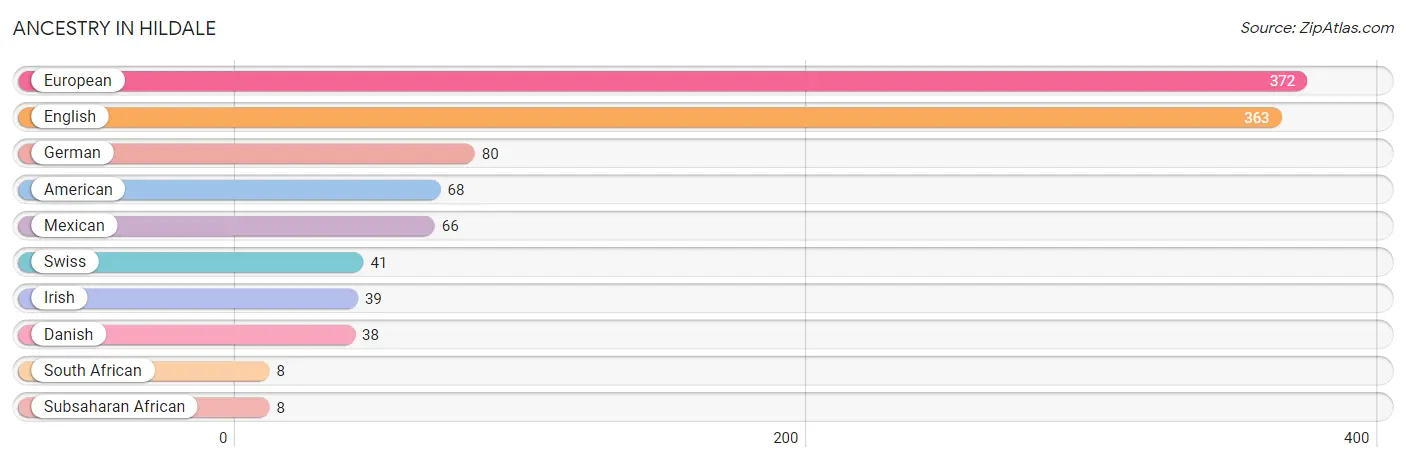
| Ancestry | # Population | % Population |
| American | 68 | 6.3% |
| Danish | 38 | 3.5% |
| English | 363 | 33.7% |
| European | 372 | 34.6% |
| German | 80 | 7.4% |
| Irish | 39 | 3.6% |
| Mexican | 66 | 6.1% |
| South African | 8 | 0.7% |
| Subsaharan African | 8 | 0.7% |
| Swiss | 41 | 3.8% | View All 10 Rows |
Immigrants in Hildale
The most numerous immigrant groups reported in Hildale came from , and Africa (8 | 0.7%), together accounting for 0.7% of all Hildale residents.

| Immigration Origin | # Population | % Population |
| Africa | 8 | 0.7% | View All 1 Rows |
Sex and Age in Hildale
Sex and Age in Hildale
The most populous age groups in Hildale are 35 to 39 Years (80 | 15.4%) for men and 10 to 14 Years (76 | 13.7%) for women.
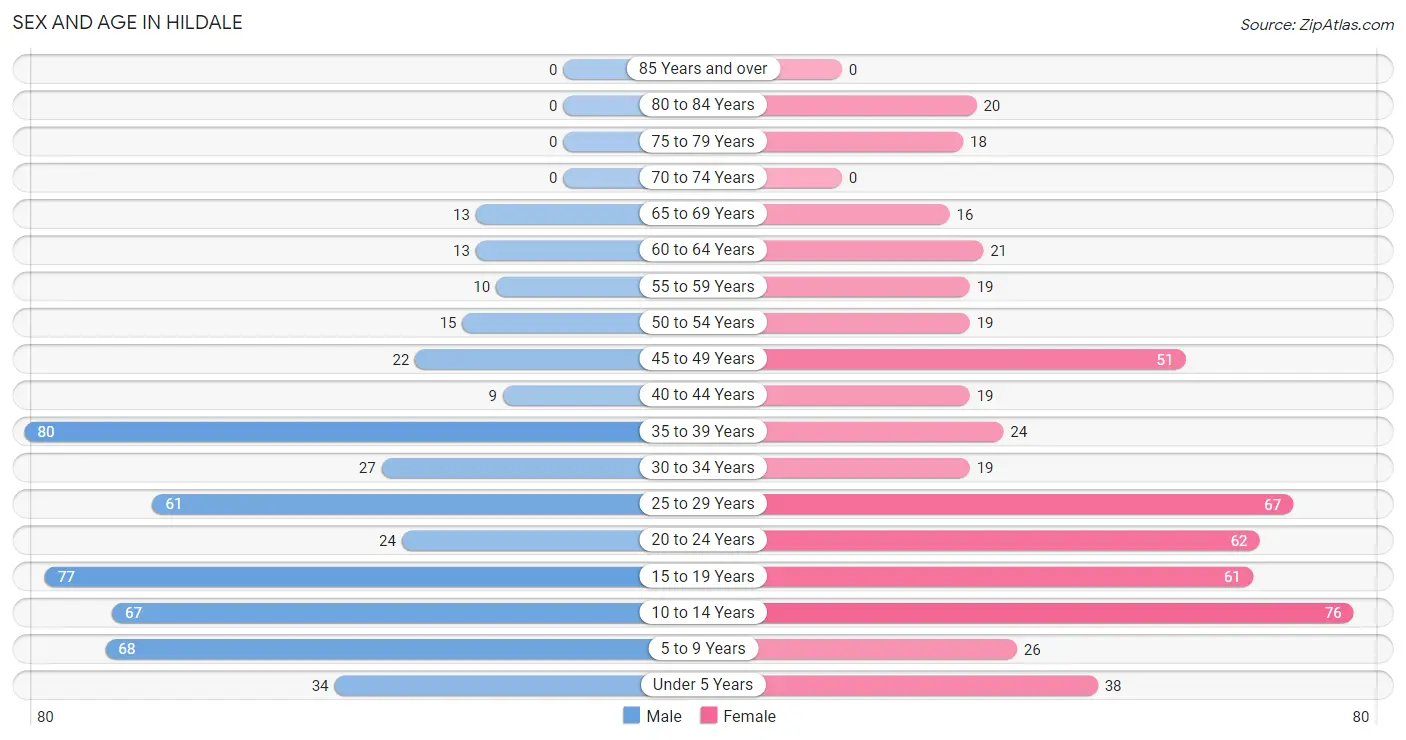
| Age Bracket | Male | Female |
| Under 5 Years | 34 (6.5%) | 38 (6.8%) |
| 5 to 9 Years | 68 (13.1%) | 26 (4.7%) |
| 10 to 14 Years | 67 (12.9%) | 76 (13.7%) |
| 15 to 19 Years | 77 (14.8%) | 61 (11.0%) |
| 20 to 24 Years | 24 (4.6%) | 62 (11.2%) |
| 25 to 29 Years | 61 (11.7%) | 67 (12.0%) |
| 30 to 34 Years | 27 (5.2%) | 19 (3.4%) |
| 35 to 39 Years | 80 (15.4%) | 24 (4.3%) |
| 40 to 44 Years | 9 (1.7%) | 19 (3.4%) |
| 45 to 49 Years | 22 (4.2%) | 51 (9.2%) |
| 50 to 54 Years | 15 (2.9%) | 19 (3.4%) |
| 55 to 59 Years | 10 (1.9%) | 19 (3.4%) |
| 60 to 64 Years | 13 (2.5%) | 21 (3.8%) |
| 65 to 69 Years | 13 (2.5%) | 16 (2.9%) |
| 70 to 74 Years | 0 (0.0%) | 0 (0.0%) |
| 75 to 79 Years | 0 (0.0%) | 18 (3.2%) |
| 80 to 84 Years | 0 (0.0%) | 20 (3.6%) |
| 85 Years and over | 0 (0.0%) | 0 (0.0%) |
| Total | 520 (100.0%) | 556 (100.0%) |
Families and Households in Hildale
Median Family Size in Hildale
The median family size in Hildale is 5.92 persons per family, with married-couple families (86 | 51.8%) accounting for the largest median family size of 7.73 persons per family. On the other hand, single female/mother families (46 | 27.7%) represent the smallest median family size with 3.85 persons per family.
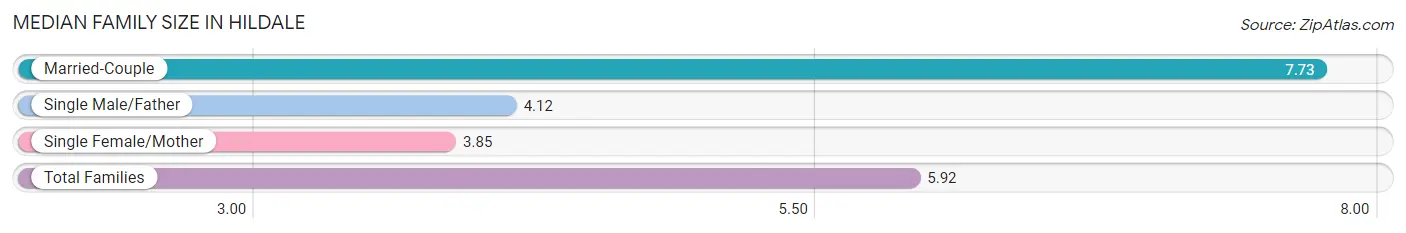
| Family Type | # Families | Family Size |
| Married-Couple | 86 (51.8%) | 7.73 |
| Single Male/Father | 34 (20.5%) | 4.12 |
| Single Female/Mother | 46 (27.7%) | 3.85 |
| Total Families | 166 (100.0%) | 5.92 |
Median Household Size in Hildale
The median household size in Hildale is 6.22 persons per household, with married-couple households (86 | 49.7%) accounting for the largest median household size of 8.17 persons per household. non-family households (7 | 4.1%) represent the smallest median household size with 2.43 persons per household.
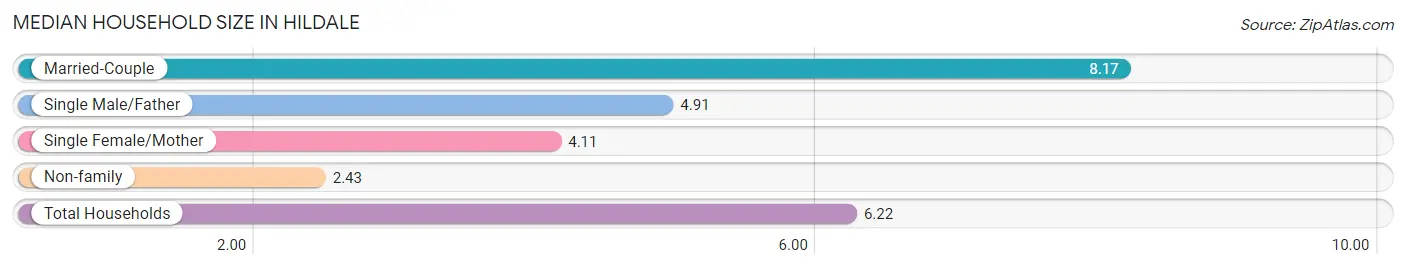
| Household Type | # Households | Household Size |
| Married-Couple | 86 (49.7%) | 8.17 |
| Single Male/Father | 34 (19.7%) | 4.91 |
| Single Female/Mother | 46 (26.6%) | 4.11 |
| Non-family | 7 (4.1%) | 2.43 |
| Total Households | 173 (100.0%) | 6.22 |
Household Size by Marriage Status in Hildale
Out of a total of 173 households in Hildale, 166 (96.0%) are family households, while 7 (4.1%) are nonfamily households. The most numerous type of family households are 4-person households, comprising 72, and the most common type of nonfamily households are 2-person households, comprising 7.
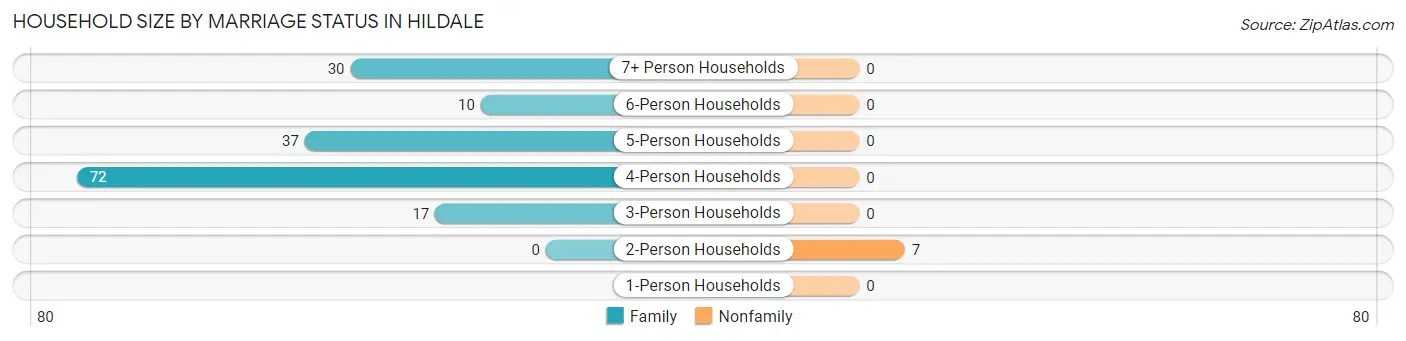
| Household Size | Family Households | Nonfamily Households |
| 1-Person Households | - | 0 (0.0%) |
| 2-Person Households | 0 (0.0%) | 7 (4.1%) |
| 3-Person Households | 17 (9.8%) | 0 (0.0%) |
| 4-Person Households | 72 (41.6%) | 0 (0.0%) |
| 5-Person Households | 37 (21.4%) | 0 (0.0%) |
| 6-Person Households | 10 (5.8%) | 0 (0.0%) |
| 7+ Person Households | 30 (17.3%) | 0 (0.0%) |
| Total | 166 (96.0%) | 7 (4.1%) |
Female Fertility in Hildale
Fertility by Age in Hildale
Average fertility rate in Hildale is 79.0 births per 1,000 women. Women in the age bracket of 20 to 34 years have the highest fertility rate with 162.0 births per 1,000 women. Women in the age bracket of 20 to 34 years acount for 100.0% of all women with births.
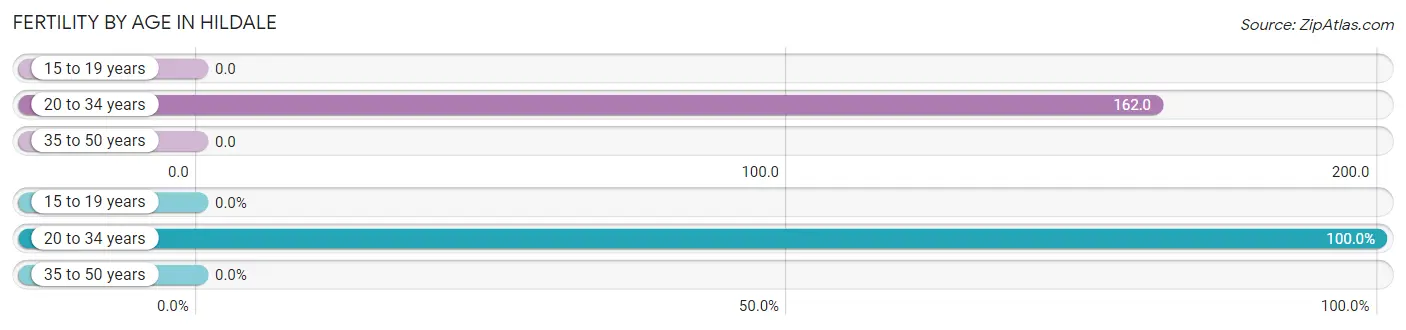
| Age Bracket | Women with Births | Births / 1,000 Women |
| 15 to 19 years | 0 (0.0%) | 0.0 |
| 20 to 34 years | 24 (100.0%) | 162.0 |
| 35 to 50 years | 0 (0.0%) | 0.0 |
| Total | 24 (100.0%) | 79.0 |
Fertility by Age by Marriage Status in Hildale
54.2% of women with births (24) in Hildale are married. The highest percentage of unmarried women with births falls into 20 to 34 years age bracket with 45.8% of them unmarried at the time of birth, while the lowest percentage of unmarried women with births belong to 20 to 34 years age bracket with 45.8% of them unmarried.
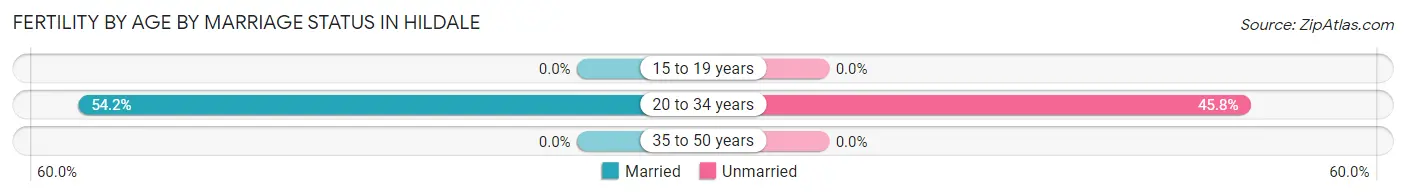
| Age Bracket | Married | Unmarried |
| 15 to 19 years | 0 (0.0%) | 0 (0.0%) |
| 20 to 34 years | 13 (54.2%) | 11 (45.8%) |
| 35 to 50 years | 0 (0.0%) | 0 (0.0%) |
| Total | 13 (54.2%) | 11 (45.8%) |
Fertility by Education in Hildale
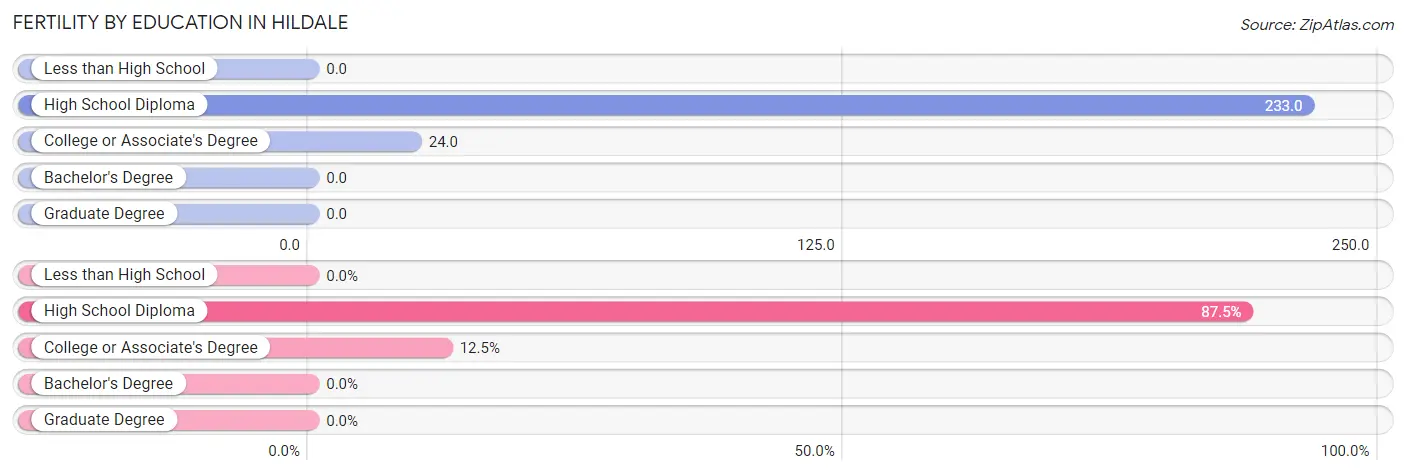
| Educational Attainment | Women with Births | Births / 1,000 Women |
| Less than High School | 0 (0.0%) | 0.0 |
| High School Diploma | 21 (87.5%) | 233.0 |
| College or Associate's Degree | 3 (12.5%) | 24.0 |
| Bachelor's Degree | 0 (0.0%) | 0.0 |
| Graduate Degree | 0 (0.0%) | 0.0 |
| Total | 24 (100.0%) | 79.0 |
Fertility by Education by Marriage Status in Hildale
45.8% of women with births in Hildale are unmarried. Women with the educational attainment of college or associate's degree are most likely to be married with 100.0% of them married at childbirth, while women with the educational attainment of high school diploma are least likely to be married with 52.4% of them unmarried at childbirth.
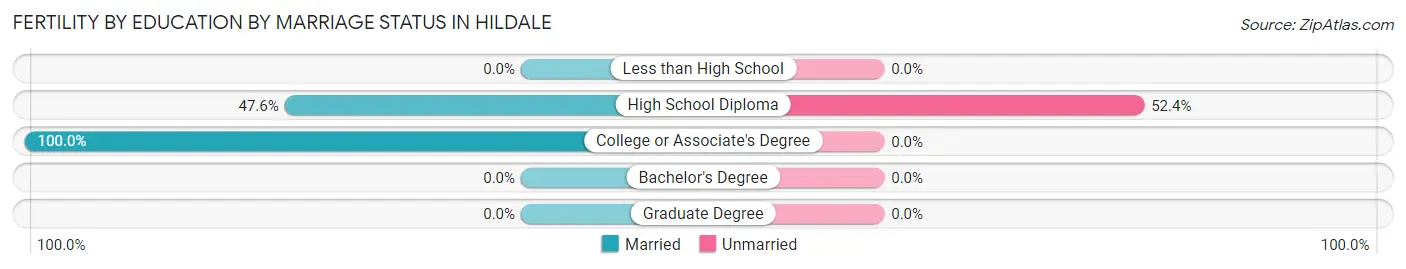
| Educational Attainment | Married | Unmarried |
| Less than High School | 0 (0.0%) | 0 (0.0%) |
| High School Diploma | 10 (47.6%) | 11 (52.4%) |
| College or Associate's Degree | 3 (100.0%) | 0 (0.0%) |
| Bachelor's Degree | 0 (0.0%) | 0 (0.0%) |
| Graduate Degree | 0 (0.0%) | 0 (0.0%) |
| Total | 13 (54.2%) | 11 (45.8%) |
Employment Characteristics in Hildale
Employment by Class of Employer in Hildale
Among the 395 employed individuals in Hildale, private company employees (265 | 67.1%), not-for-profit organizations (34 | 8.6%), and local government employees (31 | 7.9%) make up the most common classes of employment.
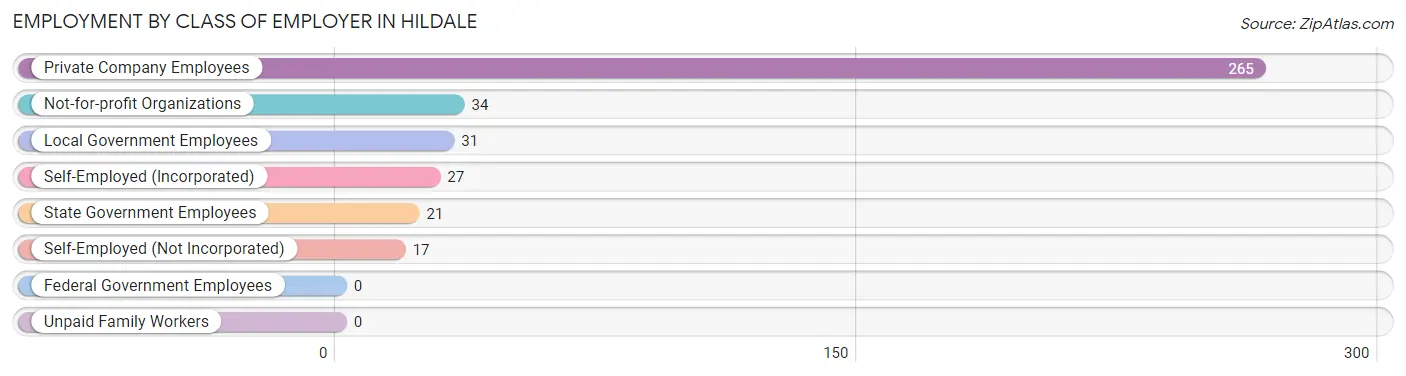
| Employer Class | # Employees | % Employees |
| Private Company Employees | 265 | 67.1% |
| Self-Employed (Incorporated) | 27 | 6.8% |
| Self-Employed (Not Incorporated) | 17 | 4.3% |
| Not-for-profit Organizations | 34 | 8.6% |
| Local Government Employees | 31 | 7.9% |
| State Government Employees | 21 | 5.3% |
| Federal Government Employees | 0 | 0.0% |
| Unpaid Family Workers | 0 | 0.0% |
| Total | 395 | 100.0% |
Employment Status by Age in Hildale
According to the labor force statistics for Hildale, out of the total population over 16 years of age (722), 58.4% or 422 individuals are in the labor force, with 6.4% or 27 of them unemployed. The age group with the highest labor force participation rate is 20 to 24 years, with 88.4% or 76 individuals in the labor force. Within the labor force, the 30 to 34 years age range has the highest percentage of unemployed individuals, with 25.0% or 9 of them being unemployed.
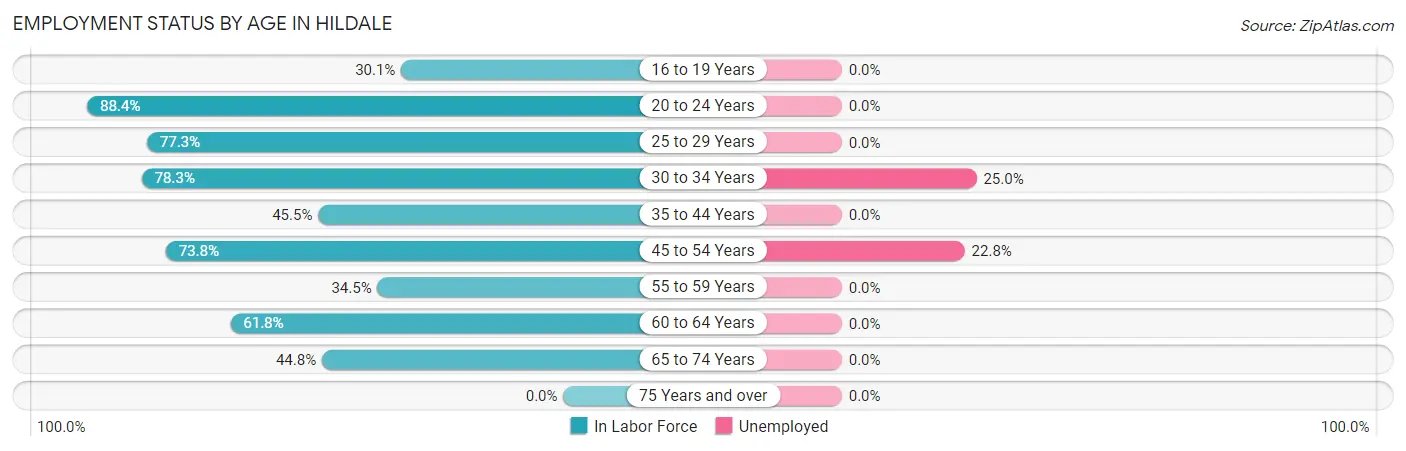
| Age Bracket | In Labor Force | Unemployed |
| 16 to 19 Years | 28 (30.1%) | 0 (0.0%) |
| 20 to 24 Years | 76 (88.4%) | 0 (0.0%) |
| 25 to 29 Years | 99 (77.3%) | 0 (0.0%) |
| 30 to 34 Years | 36 (78.3%) | 9 (25.0%) |
| 35 to 44 Years | 60 (45.5%) | 0 (0.0%) |
| 45 to 54 Years | 79 (73.8%) | 18 (22.8%) |
| 55 to 59 Years | 10 (34.5%) | 0 (0.0%) |
| 60 to 64 Years | 21 (61.8%) | 0 (0.0%) |
| 65 to 74 Years | 13 (44.8%) | 0 (0.0%) |
| 75 Years and over | 0 (0.0%) | 0 (0.0%) |
| Total | 422 (58.4%) | 27 (6.4%) |
Employment Status by Educational Attainment in Hildale
According to labor force statistics for Hildale, 64.1% of individuals (305) out of the total population between 25 and 64 years of age (476) are in the labor force, with 8.9% or 27 of them being unemployed. The group with the highest labor force participation rate are those with the educational attainment of bachelor's degree or higher, with 80.5% or 70 individuals in the labor force. Within the labor force, individuals with high school diploma education have the highest percentage of unemployment, with 22.0% or 18 of them being unemployed.
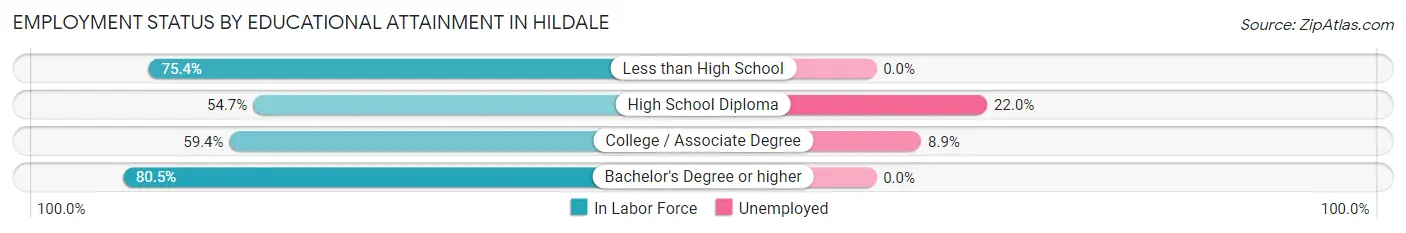
| Educational Attainment | In Labor Force | Unemployed |
| Less than High School | 52 (75.4%) | 0 (0.0%) |
| High School Diploma | 82 (54.7%) | 33 (22.0%) |
| College / Associate Degree | 101 (59.4%) | 15 (8.9%) |
| Bachelor's Degree or higher | 70 (80.5%) | 0 (0.0%) |
| Total | 305 (64.1%) | 42 (8.9%) |
Employment Occupations by Sex in Hildale
Management, Business, Science and Arts Occupations
The most common Management, Business, Science and Arts occupations in Hildale are Community & Social Service (34 | 8.6%), Management (31 | 7.9%), Education Instruction & Library (26 | 6.6%), Business & Financial (11 | 2.8%), and Education, Arts & Media (8 | 2.0%).
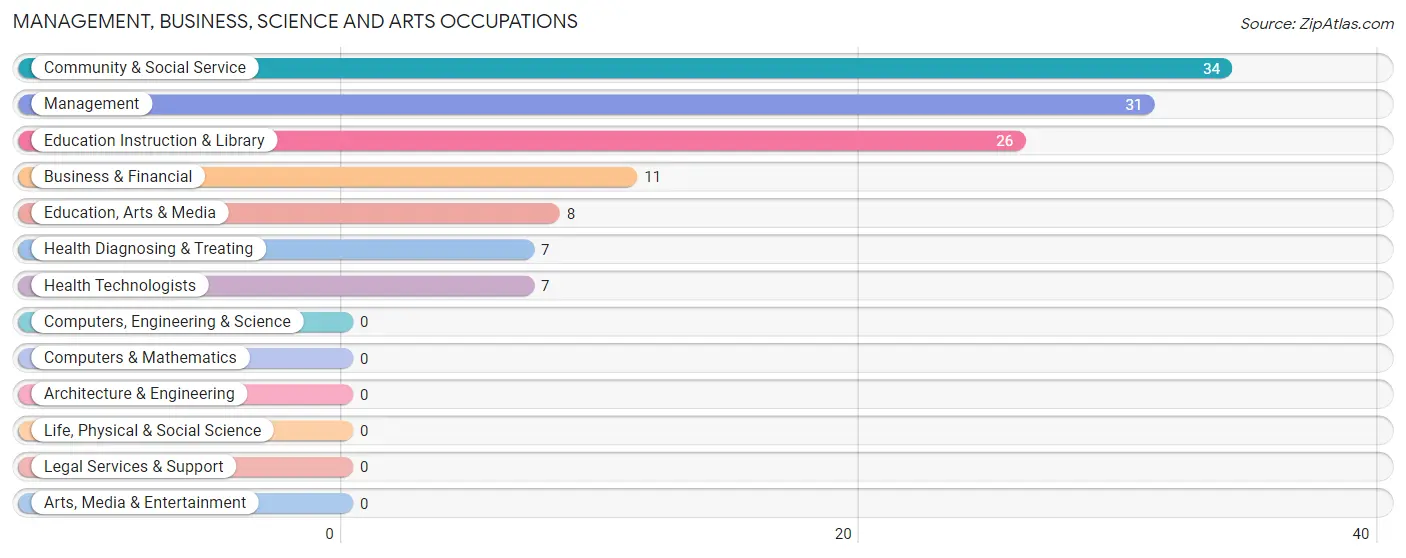
Management, Business, Science and Arts Occupations by Sex
Within the Management, Business, Science and Arts occupations in Hildale, the most male-oriented occupations are Business & Financial (100.0%), Health Diagnosing & Treating (100.0%), and Health Technologists (100.0%), while the most female-oriented occupations are Community & Social Service (100.0%), Education, Arts & Media (100.0%), and Education Instruction & Library (100.0%).
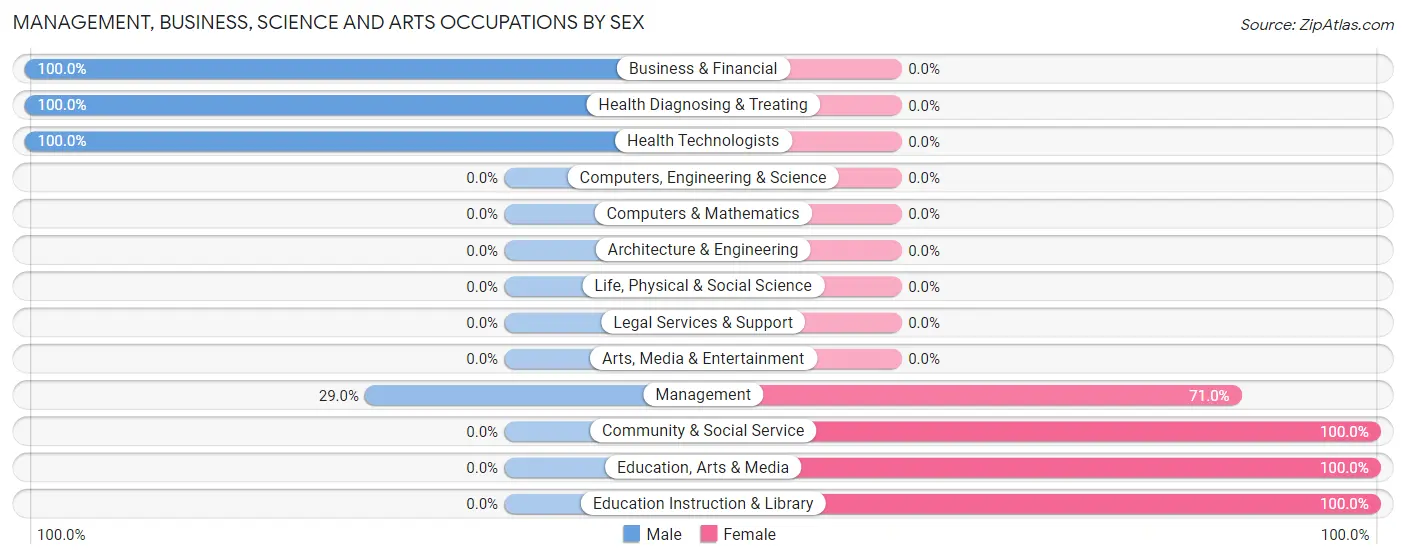
| Occupation | Male | Female |
| Management | 9 (29.0%) | 22 (71.0%) |
| Business & Financial | 11 (100.0%) | 0 (0.0%) |
| Computers, Engineering & Science | 0 (0.0%) | 0 (0.0%) |
| Computers & Mathematics | 0 (0.0%) | 0 (0.0%) |
| Architecture & Engineering | 0 (0.0%) | 0 (0.0%) |
| Life, Physical & Social Science | 0 (0.0%) | 0 (0.0%) |
| Community & Social Service | 0 (0.0%) | 34 (100.0%) |
| Education, Arts & Media | 0 (0.0%) | 8 (100.0%) |
| Legal Services & Support | 0 (0.0%) | 0 (0.0%) |
| Education Instruction & Library | 0 (0.0%) | 26 (100.0%) |
| Arts, Media & Entertainment | 0 (0.0%) | 0 (0.0%) |
| Health Diagnosing & Treating | 7 (100.0%) | 0 (0.0%) |
| Health Technologists | 7 (100.0%) | 0 (0.0%) |
| Total (Category) | 27 (32.5%) | 56 (67.5%) |
| Total (Overall) | 202 (51.1%) | 193 (48.9%) |
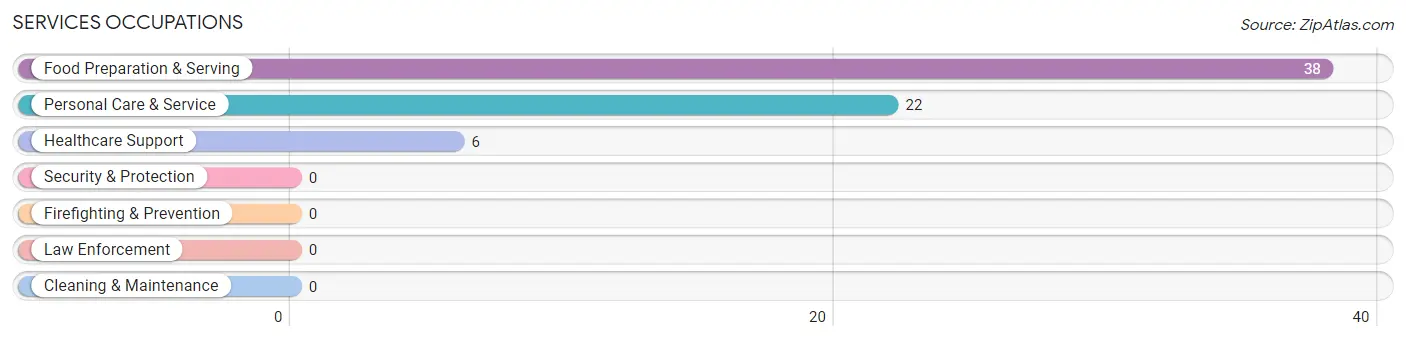
Services Occupations
The most common Services occupations in Hildale are Food Preparation & Serving (38 | 9.6%), Personal Care & Service (22 | 5.6%), and Healthcare Support (6 | 1.5%).
Services Occupations by Sex
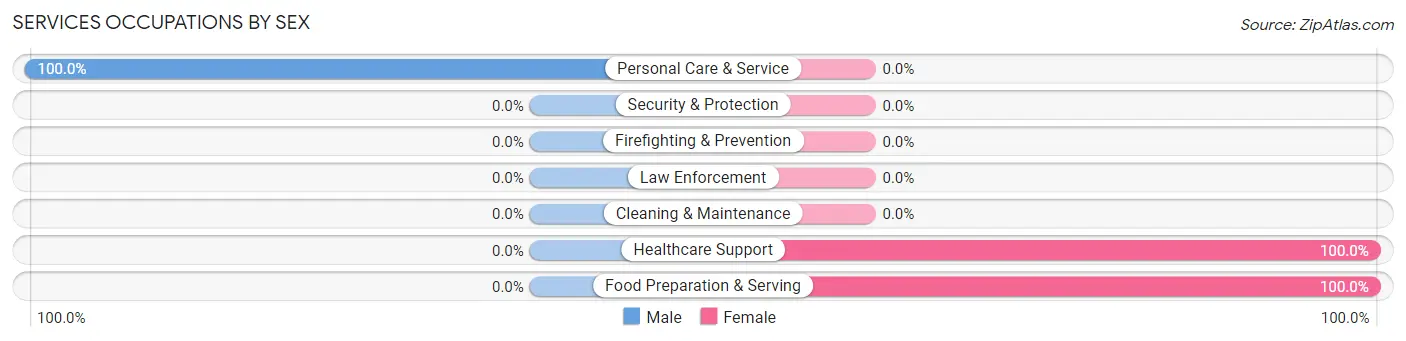
| Occupation | Male | Female |
| Healthcare Support | 0 (0.0%) | 6 (100.0%) |
| Security & Protection | 0 (0.0%) | 0 (0.0%) |
| Firefighting & Prevention | 0 (0.0%) | 0 (0.0%) |
| Law Enforcement | 0 (0.0%) | 0 (0.0%) |
| Food Preparation & Serving | 0 (0.0%) | 38 (100.0%) |
| Cleaning & Maintenance | 0 (0.0%) | 0 (0.0%) |
| Personal Care & Service | 22 (100.0%) | 0 (0.0%) |
| Total (Category) | 22 (33.3%) | 44 (66.7%) |
| Total (Overall) | 202 (51.1%) | 193 (48.9%) |
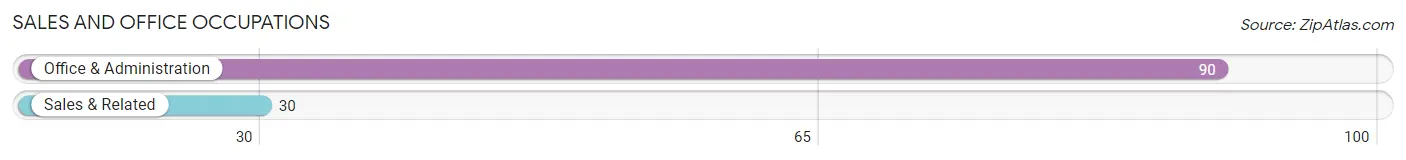
Sales and Office Occupations
The most common Sales and Office occupations in Hildale are Office & Administration (90 | 22.8%), and Sales & Related (30 | 7.6%).
Sales and Office Occupations by Sex
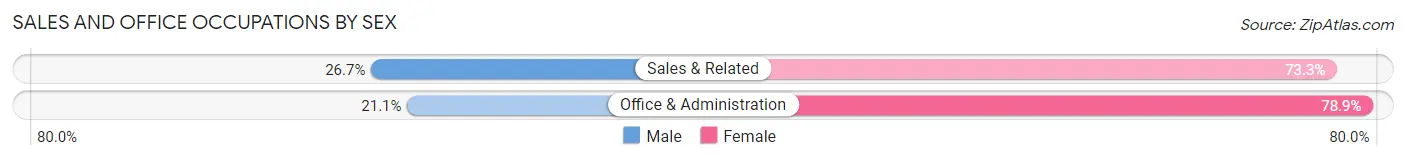
| Occupation | Male | Female |
| Sales & Related | 8 (26.7%) | 22 (73.3%) |
| Office & Administration | 19 (21.1%) | 71 (78.9%) |
| Total (Category) | 27 (22.5%) | 93 (77.5%) |
| Total (Overall) | 202 (51.1%) | 193 (48.9%) |
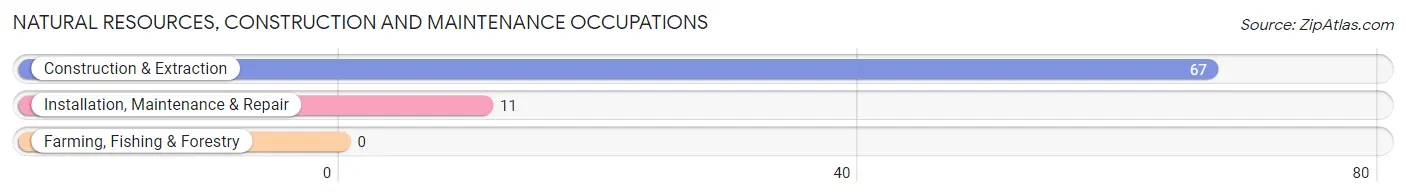
Natural Resources, Construction and Maintenance Occupations
The most common Natural Resources, Construction and Maintenance occupations in Hildale are Construction & Extraction (67 | 17.0%), and Installation, Maintenance & Repair (11 | 2.8%).
Natural Resources, Construction and Maintenance Occupations by Sex
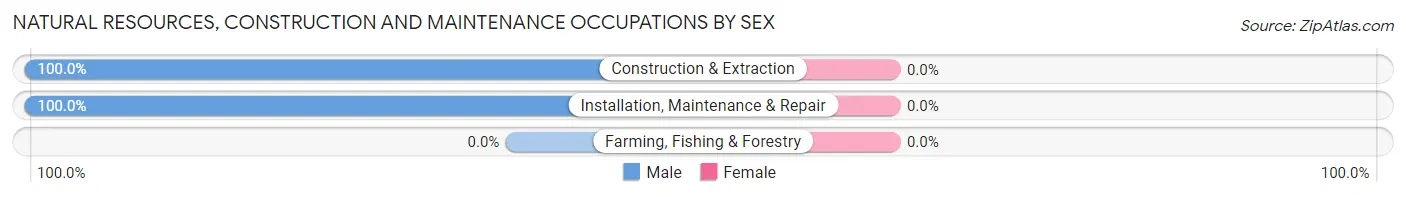
| Occupation | Male | Female |
| Farming, Fishing & Forestry | 0 (0.0%) | 0 (0.0%) |
| Construction & Extraction | 67 (100.0%) | 0 (0.0%) |
| Installation, Maintenance & Repair | 11 (100.0%) | 0 (0.0%) |
| Total (Category) | 78 (100.0%) | 0 (0.0%) |
| Total (Overall) | 202 (51.1%) | 193 (48.9%) |
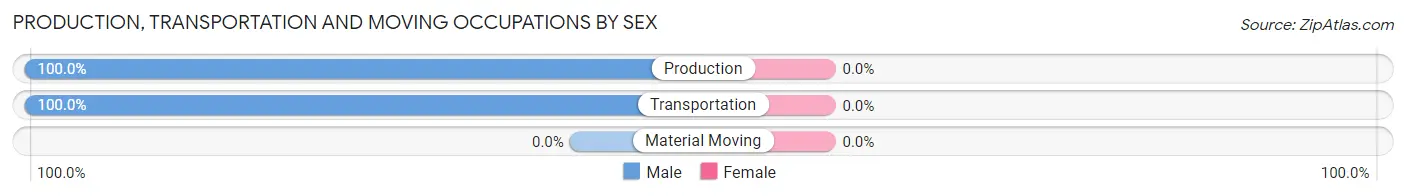
Production, Transportation and Moving Occupations
The most common Production, Transportation and Moving occupations in Hildale are Transportation (26 | 6.6%), and Production (22 | 5.6%).
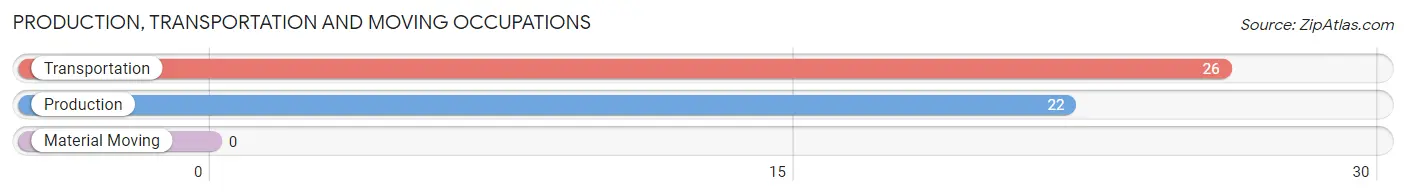
Production, Transportation and Moving Occupations by Sex
| Occupation | Male | Female |
| Production | 22 (100.0%) | 0 (0.0%) |
| Transportation | 26 (100.0%) | 0 (0.0%) |
| Material Moving | 0 (0.0%) | 0 (0.0%) |
| Total (Category) | 48 (100.0%) | 0 (0.0%) |
| Total (Overall) | 202 (51.1%) | 193 (48.9%) |
Employment Industries by Sex in Hildale
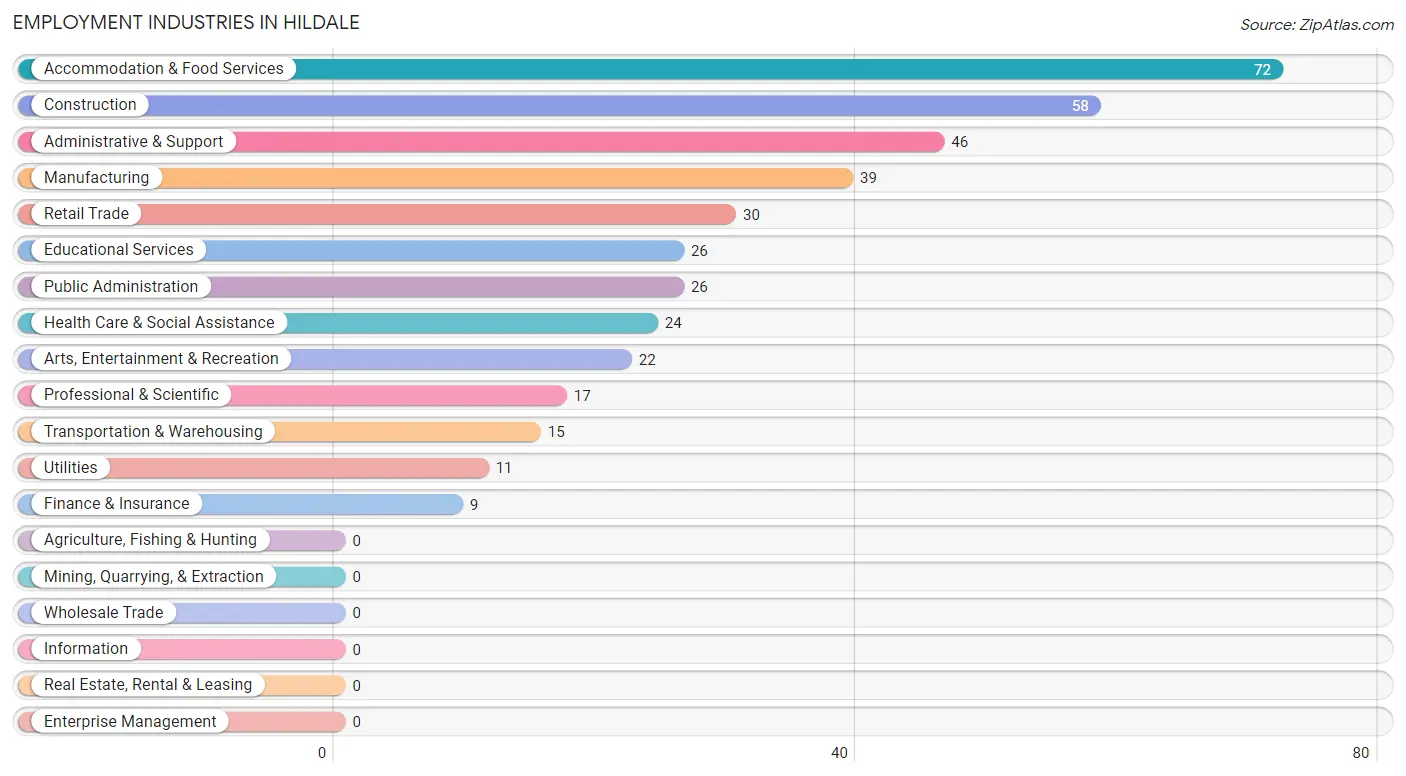
Employment Industries in Hildale
The major employment industries in Hildale include Accommodation & Food Services (72 | 18.2%), Construction (58 | 14.7%), Administrative & Support (46 | 11.7%), Manufacturing (39 | 9.9%), and Retail Trade (30 | 7.6%).
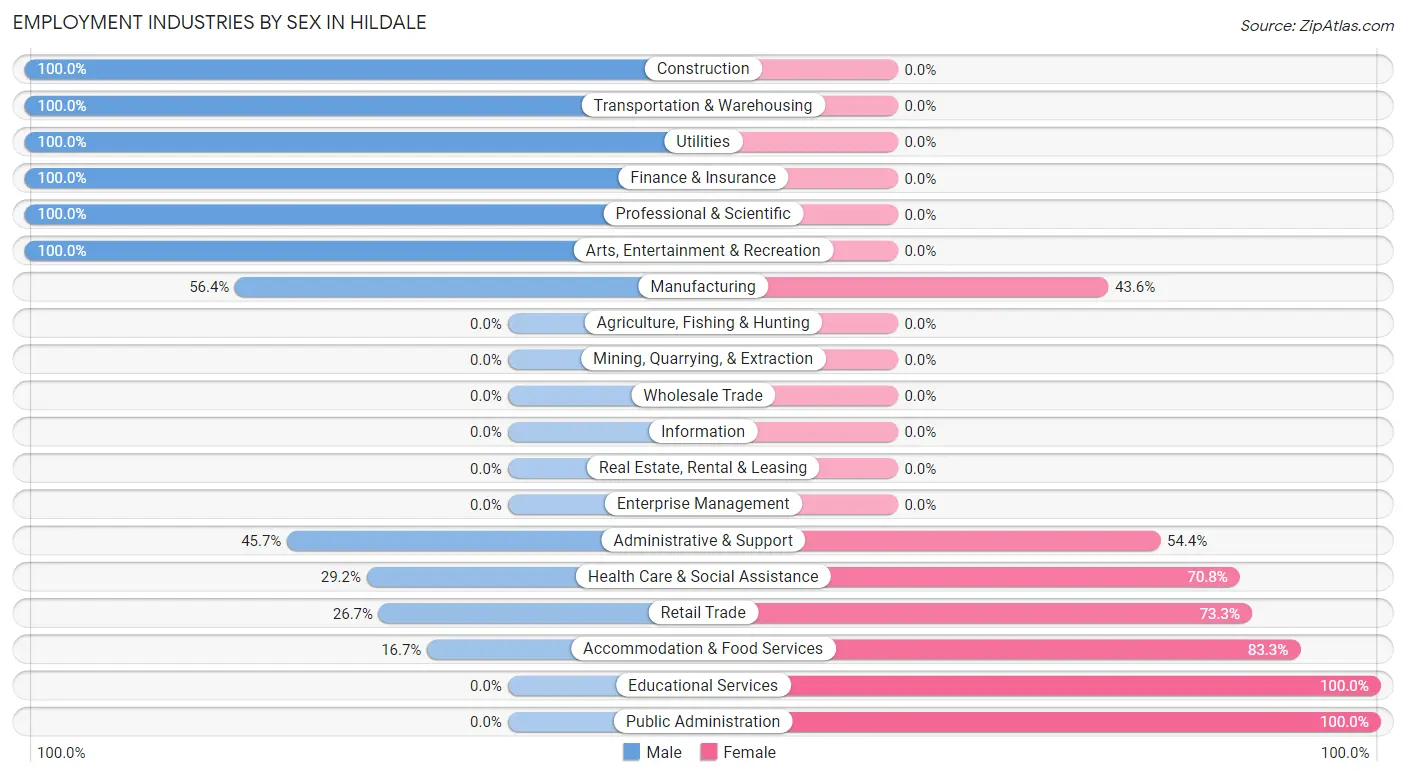
Employment Industries by Sex in Hildale
The Hildale industries that see more men than women are Construction (100.0%), Transportation & Warehousing (100.0%), and Utilities (100.0%), whereas the industries that tend to have a higher number of women are Educational Services (100.0%), Public Administration (100.0%), and Accommodation & Food Services (83.3%).
| Industry | Male | Female |
| Agriculture, Fishing & Hunting | 0 (0.0%) | 0 (0.0%) |
| Mining, Quarrying, & Extraction | 0 (0.0%) | 0 (0.0%) |
| Construction | 58 (100.0%) | 0 (0.0%) |
| Manufacturing | 22 (56.4%) | 17 (43.6%) |
| Wholesale Trade | 0 (0.0%) | 0 (0.0%) |
| Retail Trade | 8 (26.7%) | 22 (73.3%) |
| Transportation & Warehousing | 15 (100.0%) | 0 (0.0%) |
| Utilities | 11 (100.0%) | 0 (0.0%) |
| Information | 0 (0.0%) | 0 (0.0%) |
| Finance & Insurance | 9 (100.0%) | 0 (0.0%) |
| Real Estate, Rental & Leasing | 0 (0.0%) | 0 (0.0%) |
| Professional & Scientific | 17 (100.0%) | 0 (0.0%) |
| Enterprise Management | 0 (0.0%) | 0 (0.0%) |
| Administrative & Support | 21 (45.7%) | 25 (54.3%) |
| Educational Services | 0 (0.0%) | 26 (100.0%) |
| Health Care & Social Assistance | 7 (29.2%) | 17 (70.8%) |
| Arts, Entertainment & Recreation | 22 (100.0%) | 0 (0.0%) |
| Accommodation & Food Services | 12 (16.7%) | 60 (83.3%) |
| Public Administration | 0 (0.0%) | 26 (100.0%) |
| Total | 202 (51.1%) | 193 (48.9%) |
Education in Hildale
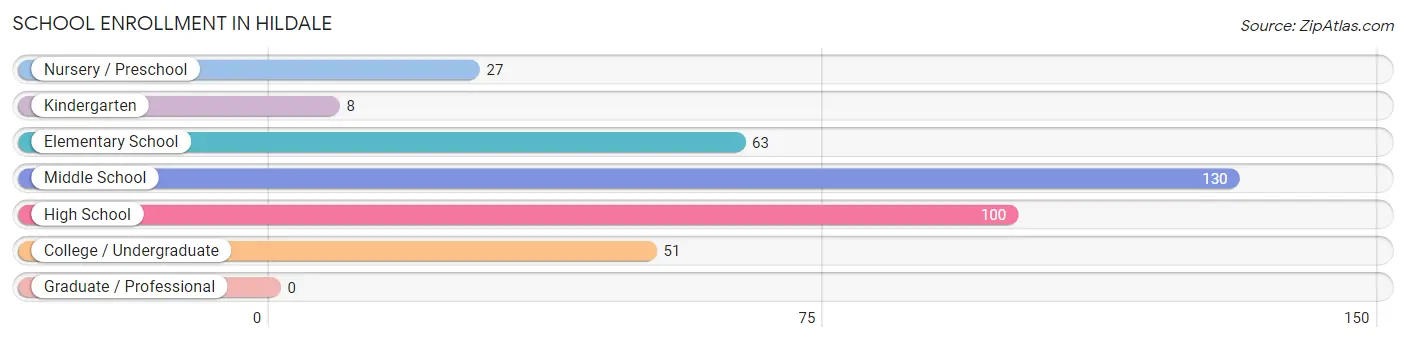
School Enrollment in Hildale
The most common levels of schooling among the 379 students in Hildale are middle school (130 | 34.3%), high school (100 | 26.4%), and elementary school (63 | 16.6%).
| School Level | # Students | % Students |
| Nursery / Preschool | 27 | 7.1% |
| Kindergarten | 8 | 2.1% |
| Elementary School | 63 | 16.6% |
| Middle School | 130 | 34.3% |
| High School | 100 | 26.4% |
| College / Undergraduate | 51 | 13.5% |
| Graduate / Professional | 0 | 0.0% |
| Total | 379 | 100.0% |
School Enrollment by Age by Funding Source in Hildale
Out of a total of 379 students who are enrolled in schools in Hildale, 63 (16.6%) attend a private institution, while the remaining 316 (83.4%) are enrolled in public schools. The age group of 5 to 9 year old has the highest likelihood of being enrolled in private schools, with 23 (25.8% in the age bracket) enrolled. Conversely, the age group of 3 to 4 year olds has the lowest likelihood of being enrolled in a private school, with 9 (100.0% in the age bracket) attending a public institution.
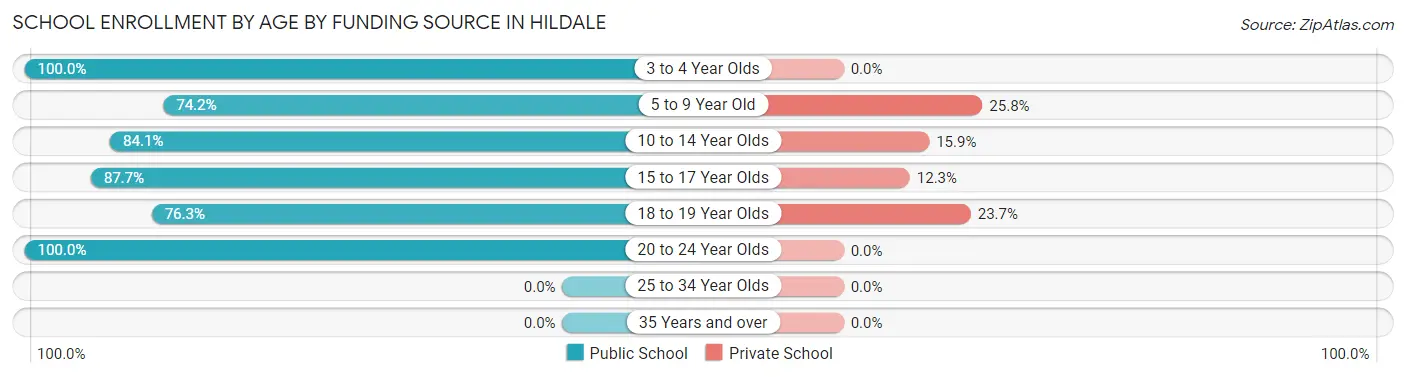
| Age Bracket | Public School | Private School |
| 3 to 4 Year Olds | 9 (100.0%) | 0 (0.0%) |
| 5 to 9 Year Old | 66 (74.2%) | 23 (25.8%) |
| 10 to 14 Year Olds | 116 (84.1%) | 22 (15.9%) |
| 15 to 17 Year Olds | 64 (87.7%) | 9 (12.3%) |
| 18 to 19 Year Olds | 29 (76.3%) | 9 (23.7%) |
| 20 to 24 Year Olds | 32 (100.0%) | 0 (0.0%) |
| 25 to 34 Year Olds | 0 (0.0%) | 0 (0.0%) |
| 35 Years and over | 0 (0.0%) | 0 (0.0%) |
| Total | 316 (83.4%) | 63 (16.6%) |
Educational Attainment by Field of Study in Hildale
Education (40 | 33.9%), psychology (22 | 18.6%), literature & languages (15 | 12.7%), business (11 | 9.3%), and physical & health sciences (8 | 6.8%) are the most common fields of study among 118 individuals in Hildale who have obtained a bachelor's degree or higher.
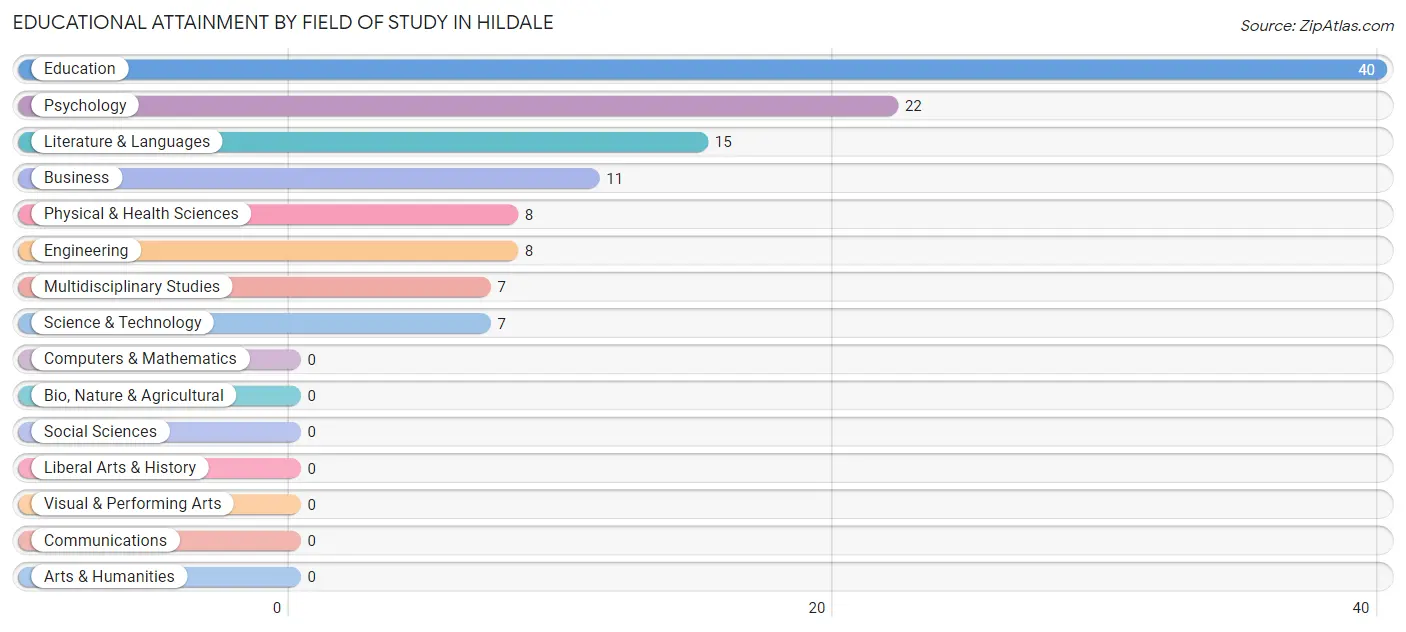
| Field of Study | # Graduates | % Graduates |
| Computers & Mathematics | 0 | 0.0% |
| Bio, Nature & Agricultural | 0 | 0.0% |
| Physical & Health Sciences | 8 | 6.8% |
| Psychology | 22 | 18.6% |
| Social Sciences | 0 | 0.0% |
| Engineering | 8 | 6.8% |
| Multidisciplinary Studies | 7 | 5.9% |
| Science & Technology | 7 | 5.9% |
| Business | 11 | 9.3% |
| Education | 40 | 33.9% |
| Literature & Languages | 15 | 12.7% |
| Liberal Arts & History | 0 | 0.0% |
| Visual & Performing Arts | 0 | 0.0% |
| Communications | 0 | 0.0% |
| Arts & Humanities | 0 | 0.0% |
| Total | 118 | 100.0% |
Transportation & Commute in Hildale
Vehicle Availability by Sex in Hildale
The most prevalent vehicle ownership categories in Hildale are males with 4 vehicles (57, accounting for 28.2%) and females with 4 vehicles (35, making up 29.5%).
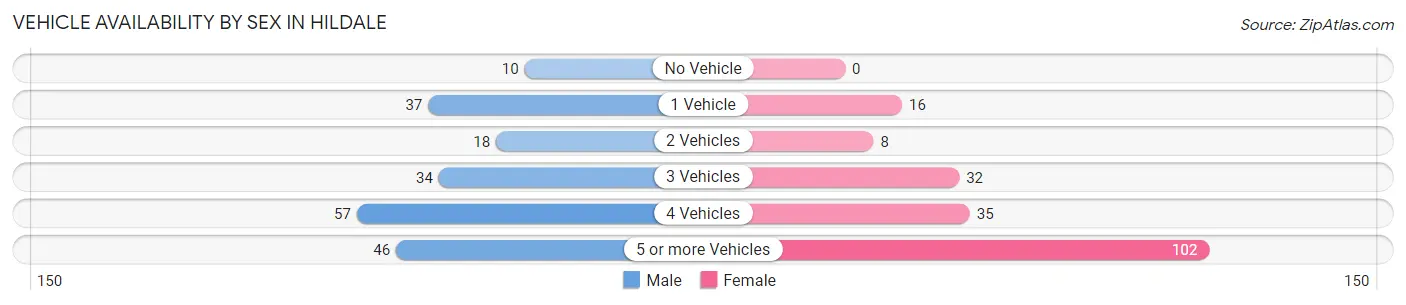
| Vehicles Available | Male | Female |
| No Vehicle | 10 (5.0%) | 0 (0.0%) |
| 1 Vehicle | 37 (18.3%) | 16 (8.3%) |
| 2 Vehicles | 18 (8.9%) | 8 (4.2%) |
| 3 Vehicles | 34 (16.8%) | 32 (16.6%) |
| 4 Vehicles | 57 (28.2%) | 35 (18.1%) |
| 5 or more Vehicles | 46 (22.8%) | 102 (52.8%) |
| Total | 202 (100.0%) | 193 (100.0%) |
Commute Time in Hildale
The most frequently occuring commute durations in Hildale are less than 5 minutes (100 commuters, 26.6%), 10 to 14 minutes (88 commuters, 23.4%), and 20 to 24 minutes (65 commuters, 17.3%).
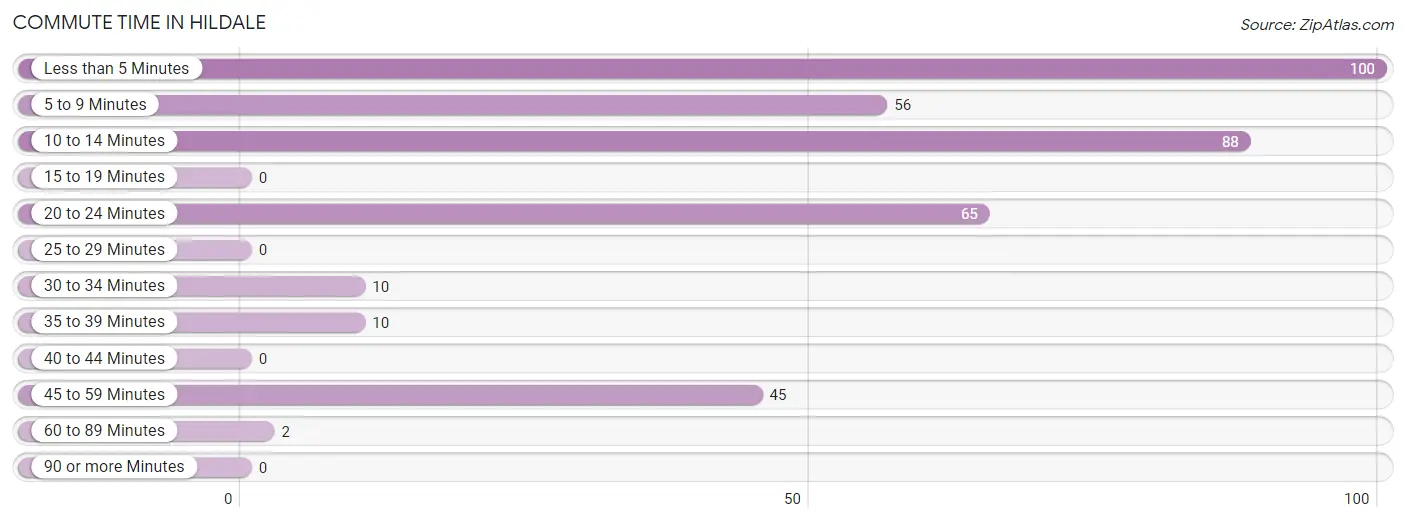
| Commute Time | # Commuters | % Commuters |
| Less than 5 Minutes | 100 | 26.6% |
| 5 to 9 Minutes | 56 | 14.9% |
| 10 to 14 Minutes | 88 | 23.4% |
| 15 to 19 Minutes | 0 | 0.0% |
| 20 to 24 Minutes | 65 | 17.3% |
| 25 to 29 Minutes | 0 | 0.0% |
| 30 to 34 Minutes | 10 | 2.7% |
| 35 to 39 Minutes | 10 | 2.7% |
| 40 to 44 Minutes | 0 | 0.0% |
| 45 to 59 Minutes | 45 | 12.0% |
| 60 to 89 Minutes | 2 | 0.5% |
| 90 or more Minutes | 0 | 0.0% |
Commute Time by Sex in Hildale
The most common commute times in Hildale are 10 to 14 minutes (62 commuters, 33.9%) for males and less than 5 minutes (100 commuters, 51.8%) for females.
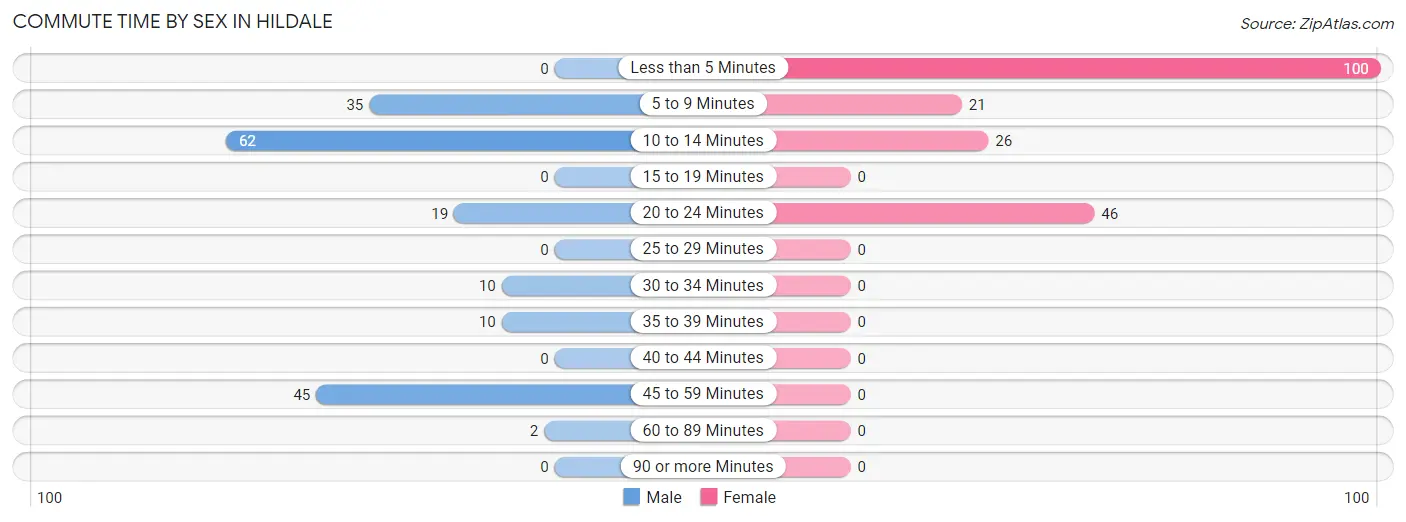
| Commute Time | Male | Female |
| Less than 5 Minutes | 0 (0.0%) | 100 (51.8%) |
| 5 to 9 Minutes | 35 (19.1%) | 21 (10.9%) |
| 10 to 14 Minutes | 62 (33.9%) | 26 (13.5%) |
| 15 to 19 Minutes | 0 (0.0%) | 0 (0.0%) |
| 20 to 24 Minutes | 19 (10.4%) | 46 (23.8%) |
| 25 to 29 Minutes | 0 (0.0%) | 0 (0.0%) |
| 30 to 34 Minutes | 10 (5.5%) | 0 (0.0%) |
| 35 to 39 Minutes | 10 (5.5%) | 0 (0.0%) |
| 40 to 44 Minutes | 0 (0.0%) | 0 (0.0%) |
| 45 to 59 Minutes | 45 (24.6%) | 0 (0.0%) |
| 60 to 89 Minutes | 2 (1.1%) | 0 (0.0%) |
| 90 or more Minutes | 0 (0.0%) | 0 (0.0%) |
Time of Departure to Work by Sex in Hildale
The most frequent times of departure to work in Hildale are 5:00 AM to 5:29 AM (60, 32.8%) for males and 8:00 AM to 8:29 AM (74, 38.3%) for females.
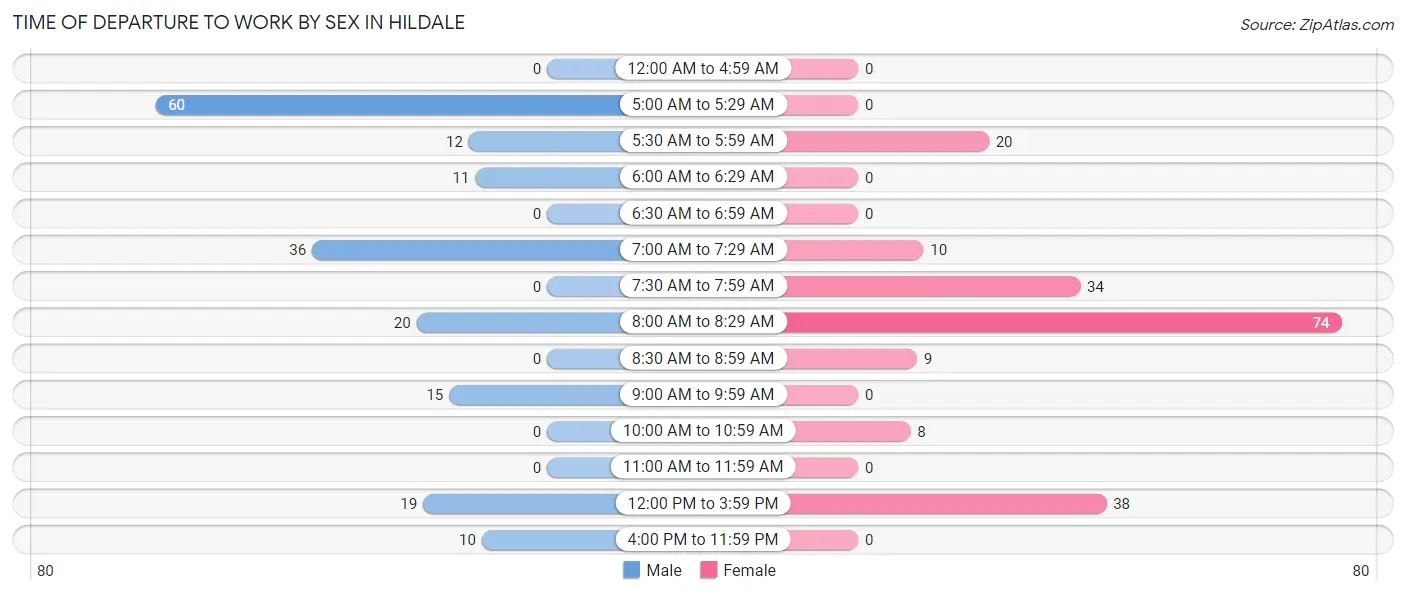
| Time of Departure | Male | Female |
| 12:00 AM to 4:59 AM | 0 (0.0%) | 0 (0.0%) |
| 5:00 AM to 5:29 AM | 60 (32.8%) | 0 (0.0%) |
| 5:30 AM to 5:59 AM | 12 (6.6%) | 20 (10.4%) |
| 6:00 AM to 6:29 AM | 11 (6.0%) | 0 (0.0%) |
| 6:30 AM to 6:59 AM | 0 (0.0%) | 0 (0.0%) |
| 7:00 AM to 7:29 AM | 36 (19.7%) | 10 (5.2%) |
| 7:30 AM to 7:59 AM | 0 (0.0%) | 34 (17.6%) |
| 8:00 AM to 8:29 AM | 20 (10.9%) | 74 (38.3%) |
| 8:30 AM to 8:59 AM | 0 (0.0%) | 9 (4.7%) |
| 9:00 AM to 9:59 AM | 15 (8.2%) | 0 (0.0%) |
| 10:00 AM to 10:59 AM | 0 (0.0%) | 8 (4.2%) |
| 11:00 AM to 11:59 AM | 0 (0.0%) | 0 (0.0%) |
| 12:00 PM to 3:59 PM | 19 (10.4%) | 38 (19.7%) |
| 4:00 PM to 11:59 PM | 10 (5.5%) | 0 (0.0%) |
| Total | 183 (100.0%) | 193 (100.0%) |
Housing Occupancy in Hildale
Occupancy by Ownership in Hildale
Of the total 173 dwellings in Hildale, owner-occupied units account for 78 (45.1%), while renter-occupied units make up 95 (54.9%).
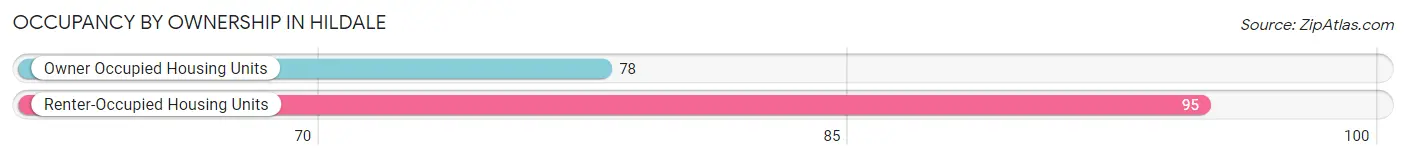
| Occupancy | # Housing Units | % Housing Units |
| Owner Occupied Housing Units | 78 | 45.1% |
| Renter-Occupied Housing Units | 95 | 54.9% |
| Total Occupied Housing Units | 173 | 100.0% |
Occupancy by Household Size in Hildale
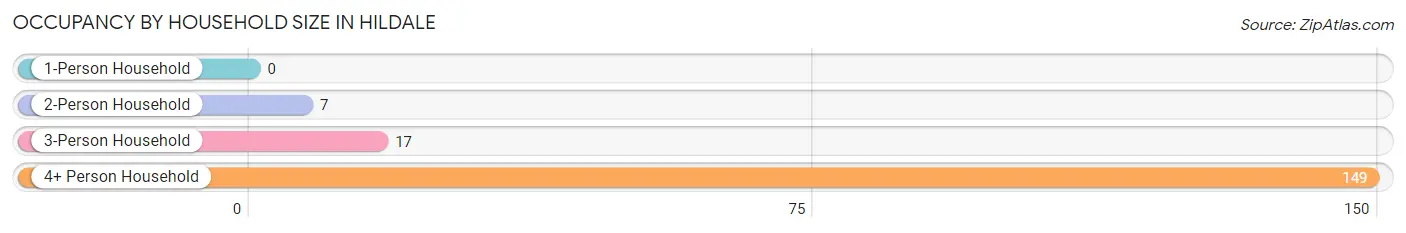
| Household Size | # Housing Units | % Housing Units |
| 1-Person Household | 0 | 0.0% |
| 2-Person Household | 7 | 4.1% |
| 3-Person Household | 17 | 9.8% |
| 4+ Person Household | 149 | 86.1% |
| Total Housing Units | 173 | 100.0% |
Occupancy by Ownership by Household Size in Hildale
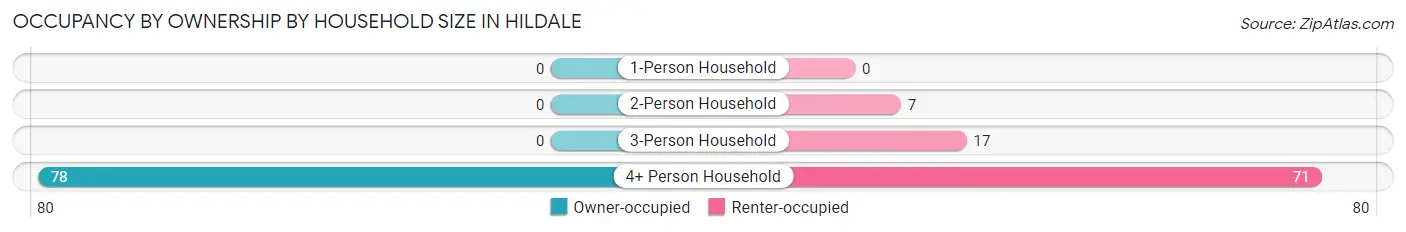
| Household Size | Owner-occupied | Renter-occupied |
| 1-Person Household | 0 (0.0%) | 0 (0.0%) |
| 2-Person Household | 0 (0.0%) | 7 (100.0%) |
| 3-Person Household | 0 (0.0%) | 17 (100.0%) |
| 4+ Person Household | 78 (52.3%) | 71 (47.6%) |
| Total Housing Units | 78 (45.1%) | 95 (54.9%) |
Occupancy by Educational Attainment in Hildale
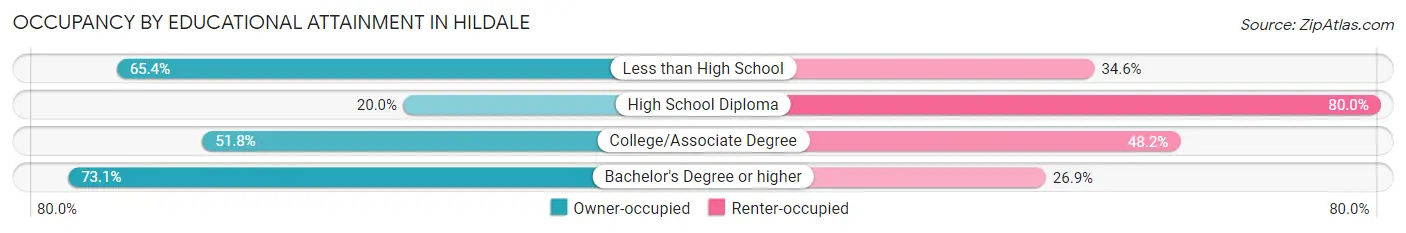
| Household Size | Owner-occupied | Renter-occupied |
| Less than High School | 17 (65.4%) | 9 (34.6%) |
| High School Diploma | 13 (20.0%) | 52 (80.0%) |
| College/Associate Degree | 29 (51.8%) | 27 (48.2%) |
| Bachelor's Degree or higher | 19 (73.1%) | 7 (26.9%) |
Occupancy by Age of Householder in Hildale
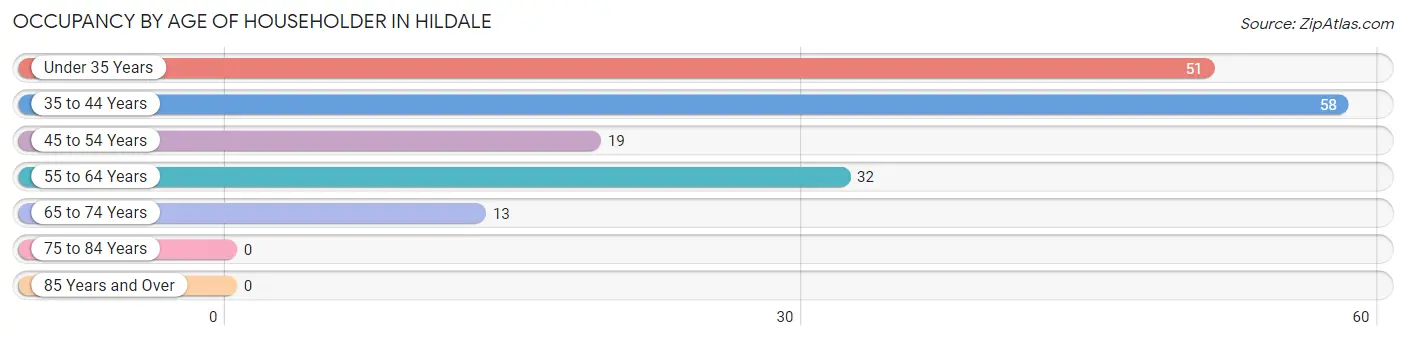
| Age Bracket | # Households | % Households |
| Under 35 Years | 51 | 29.5% |
| 35 to 44 Years | 58 | 33.5% |
| 45 to 54 Years | 19 | 11.0% |
| 55 to 64 Years | 32 | 18.5% |
| 65 to 74 Years | 13 | 7.5% |
| 75 to 84 Years | 0 | 0.0% |
| 85 Years and Over | 0 | 0.0% |
| Total | 173 | 100.0% |
Housing Finances in Hildale
Median Income by Occupancy in Hildale
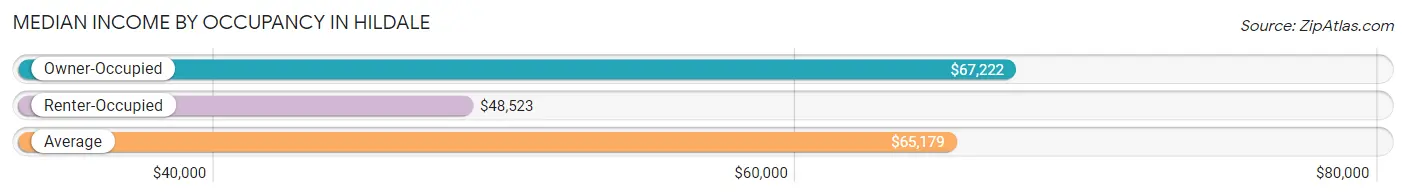
| Occupancy Type | # Households | Median Income |
| Owner-Occupied | 78 (45.1%) | $67,222 |
| Renter-Occupied | 95 (54.9%) | $48,523 |
| Average | 173 (100.0%) | $65,179 |
Occupancy by Householder Income Bracket in Hildale
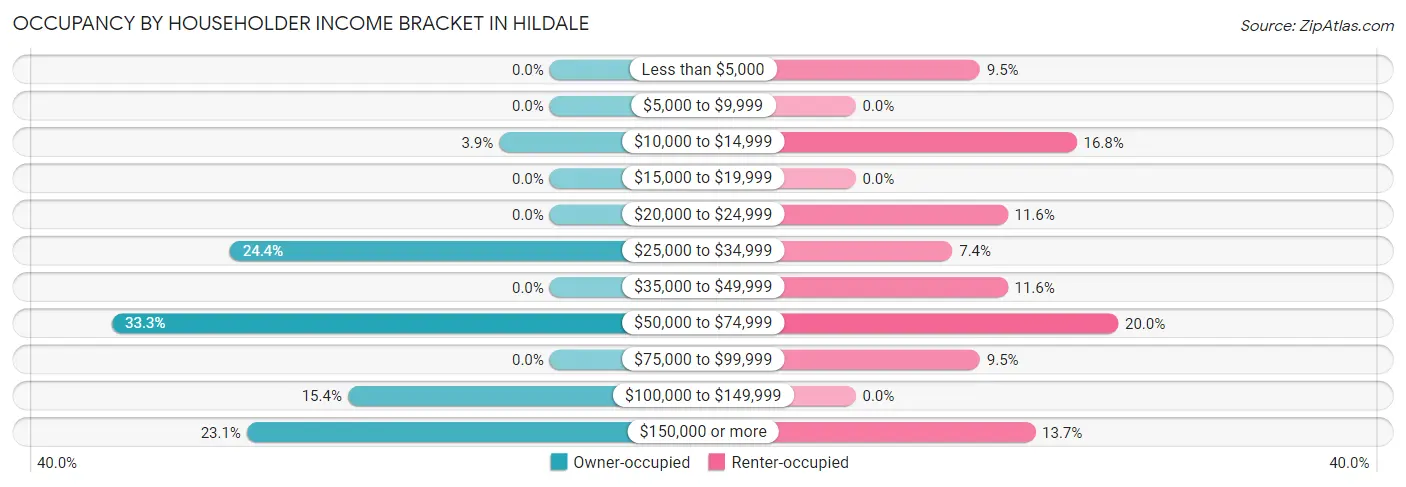
| Income Bracket | Owner-occupied | Renter-occupied |
| Less than $5,000 | 0 (0.0%) | 9 (9.5%) |
| $5,000 to $9,999 | 0 (0.0%) | 0 (0.0%) |
| $10,000 to $14,999 | 3 (3.8%) | 16 (16.8%) |
| $15,000 to $19,999 | 0 (0.0%) | 0 (0.0%) |
| $20,000 to $24,999 | 0 (0.0%) | 11 (11.6%) |
| $25,000 to $34,999 | 19 (24.4%) | 7 (7.4%) |
| $35,000 to $49,999 | 0 (0.0%) | 11 (11.6%) |
| $50,000 to $74,999 | 26 (33.3%) | 19 (20.0%) |
| $75,000 to $99,999 | 0 (0.0%) | 9 (9.5%) |
| $100,000 to $149,999 | 12 (15.4%) | 0 (0.0%) |
| $150,000 or more | 18 (23.1%) | 13 (13.7%) |
| Total | 78 (100.0%) | 95 (100.0%) |
Monthly Housing Cost Tiers in Hildale
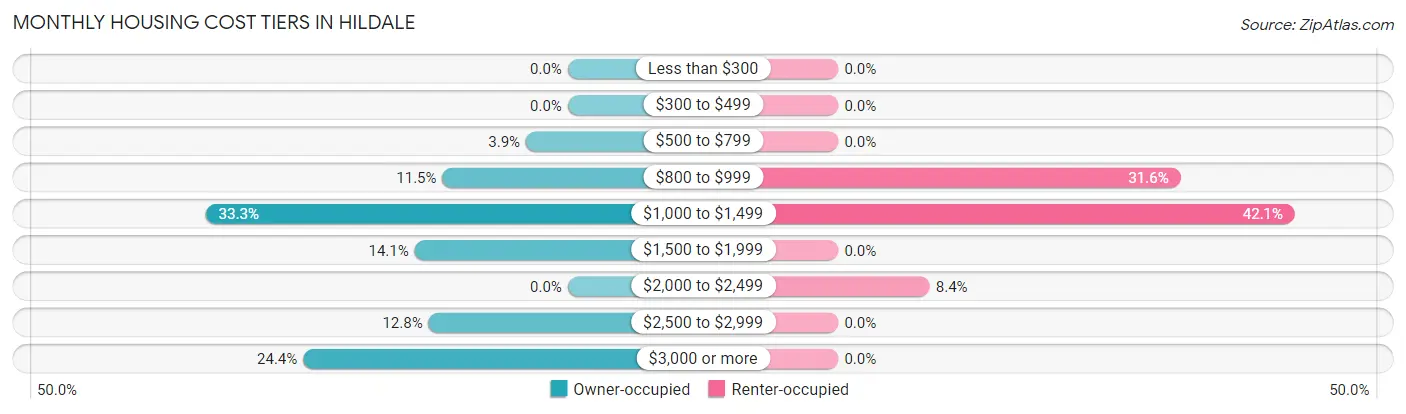
| Monthly Cost | Owner-occupied | Renter-occupied |
| Less than $300 | 0 (0.0%) | 0 (0.0%) |
| $300 to $499 | 0 (0.0%) | 0 (0.0%) |
| $500 to $799 | 3 (3.8%) | 0 (0.0%) |
| $800 to $999 | 9 (11.5%) | 30 (31.6%) |
| $1,000 to $1,499 | 26 (33.3%) | 40 (42.1%) |
| $1,500 to $1,999 | 11 (14.1%) | 0 (0.0%) |
| $2,000 to $2,499 | 0 (0.0%) | 8 (8.4%) |
| $2,500 to $2,999 | 10 (12.8%) | 0 (0.0%) |
| $3,000 or more | 19 (24.4%) | 0 (0.0%) |
| Total | 78 (100.0%) | 95 (100.0%) |
Physical Housing Characteristics in Hildale
Housing Structures in Hildale
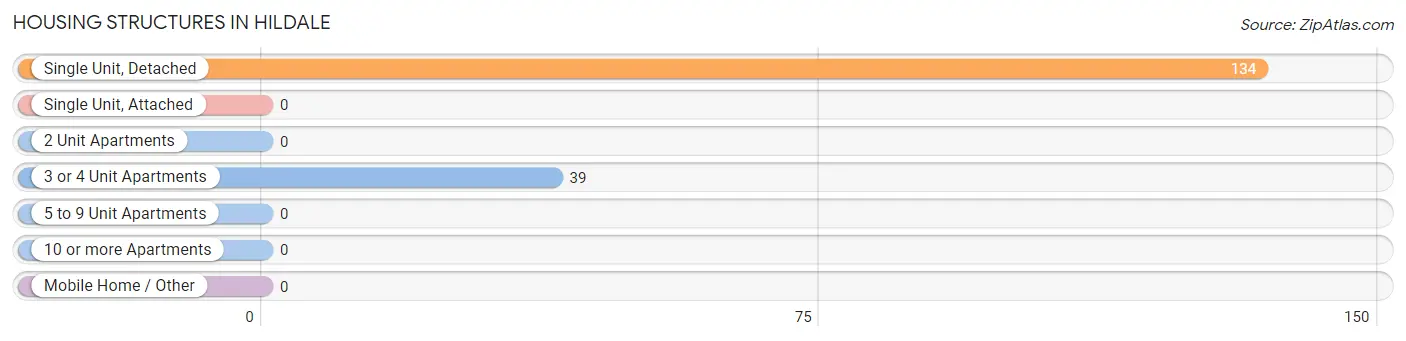
| Structure Type | # Housing Units | % Housing Units |
| Single Unit, Detached | 134 | 77.5% |
| Single Unit, Attached | 0 | 0.0% |
| 2 Unit Apartments | 0 | 0.0% |
| 3 or 4 Unit Apartments | 39 | 22.5% |
| 5 to 9 Unit Apartments | 0 | 0.0% |
| 10 or more Apartments | 0 | 0.0% |
| Mobile Home / Other | 0 | 0.0% |
| Total | 173 | 100.0% |
Housing Structures by Occupancy in Hildale
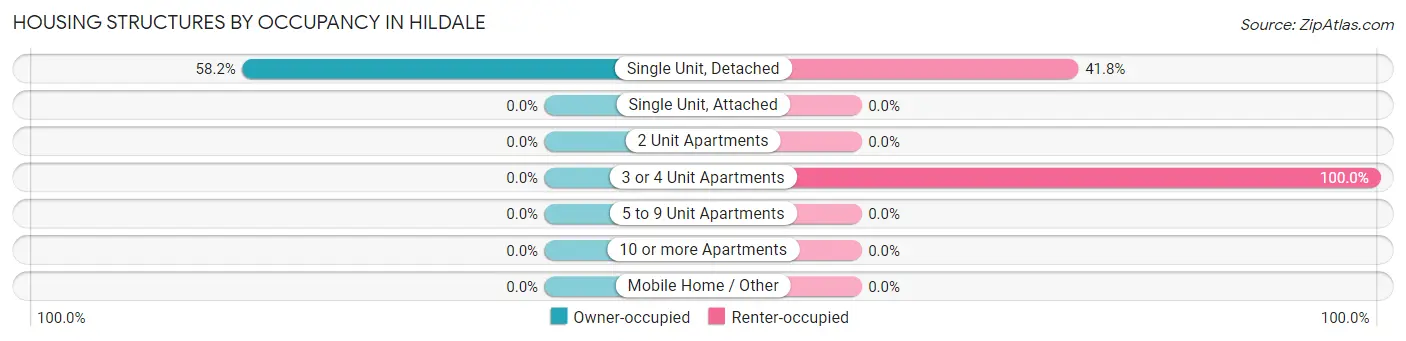
| Structure Type | Owner-occupied | Renter-occupied |
| Single Unit, Detached | 78 (58.2%) | 56 (41.8%) |
| Single Unit, Attached | 0 (0.0%) | 0 (0.0%) |
| 2 Unit Apartments | 0 (0.0%) | 0 (0.0%) |
| 3 or 4 Unit Apartments | 0 (0.0%) | 39 (100.0%) |
| 5 to 9 Unit Apartments | 0 (0.0%) | 0 (0.0%) |
| 10 or more Apartments | 0 (0.0%) | 0 (0.0%) |
| Mobile Home / Other | 0 (0.0%) | 0 (0.0%) |
| Total | 78 (45.1%) | 95 (54.9%) |
Housing Structures by Number of Rooms in Hildale
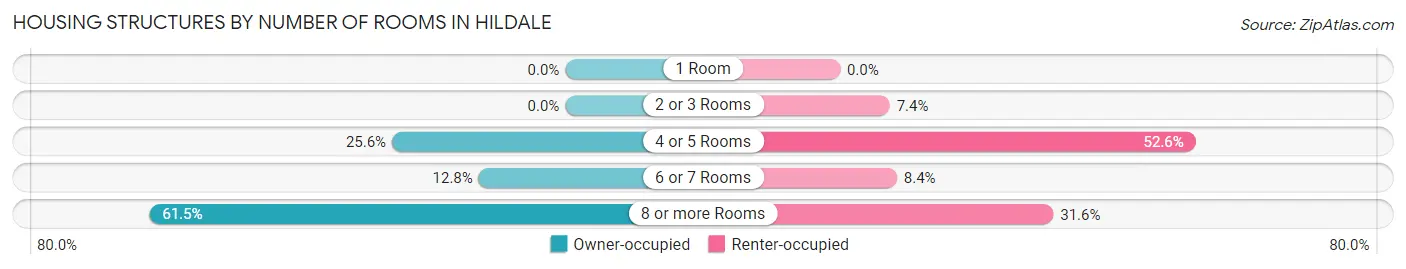
| Number of Rooms | Owner-occupied | Renter-occupied |
| 1 Room | 0 (0.0%) | 0 (0.0%) |
| 2 or 3 Rooms | 0 (0.0%) | 7 (7.4%) |
| 4 or 5 Rooms | 20 (25.6%) | 50 (52.6%) |
| 6 or 7 Rooms | 10 (12.8%) | 8 (8.4%) |
| 8 or more Rooms | 48 (61.5%) | 30 (31.6%) |
| Total | 78 (100.0%) | 95 (100.0%) |
Housing Structure by Heating Type in Hildale
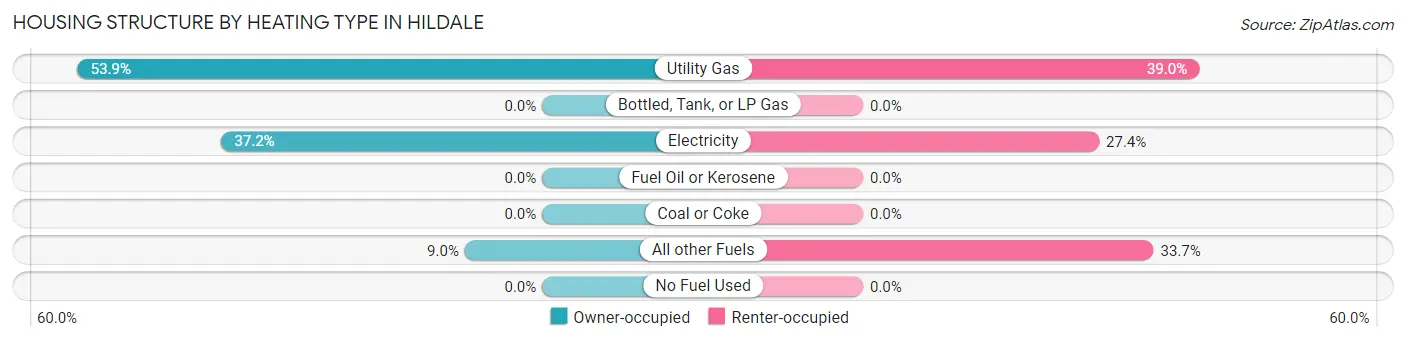
| Heating Type | Owner-occupied | Renter-occupied |
| Utility Gas | 42 (53.8%) | 37 (39.0%) |
| Bottled, Tank, or LP Gas | 0 (0.0%) | 0 (0.0%) |
| Electricity | 29 (37.2%) | 26 (27.4%) |
| Fuel Oil or Kerosene | 0 (0.0%) | 0 (0.0%) |
| Coal or Coke | 0 (0.0%) | 0 (0.0%) |
| All other Fuels | 7 (9.0%) | 32 (33.7%) |
| No Fuel Used | 0 (0.0%) | 0 (0.0%) |
| Total | 78 (100.0%) | 95 (100.0%) |
Household Vehicle Usage in Hildale
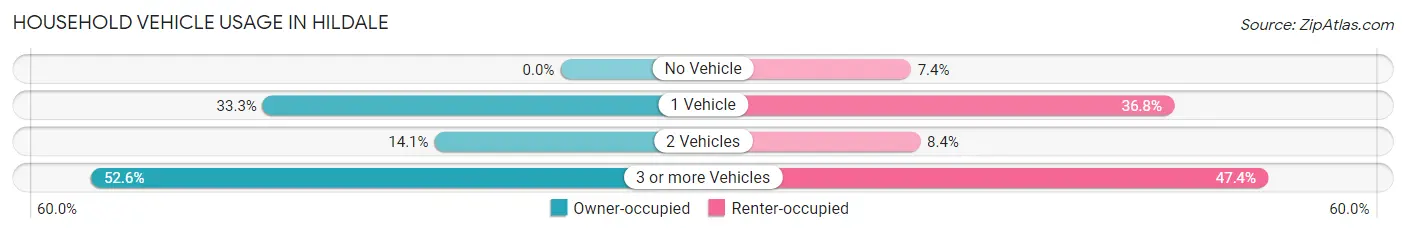
| Vehicles per Household | Owner-occupied | Renter-occupied |
| No Vehicle | 0 (0.0%) | 7 (7.4%) |
| 1 Vehicle | 26 (33.3%) | 35 (36.8%) |
| 2 Vehicles | 11 (14.1%) | 8 (8.4%) |
| 3 or more Vehicles | 41 (52.6%) | 45 (47.4%) |
| Total | 78 (100.0%) | 95 (100.0%) |
Real Estate & Mortgages in Hildale
Real Estate and Mortgage Overview in Hildale
| Characteristic | Without Mortgage | With Mortgage |
| Housing Units | 3 | 75 |
| Median Property Value | - | - |
| Median Household Income | - | - |
| Monthly Housing Costs | - | - |
| Real Estate Taxes | - | - |
Property Value by Mortgage Status in Hildale
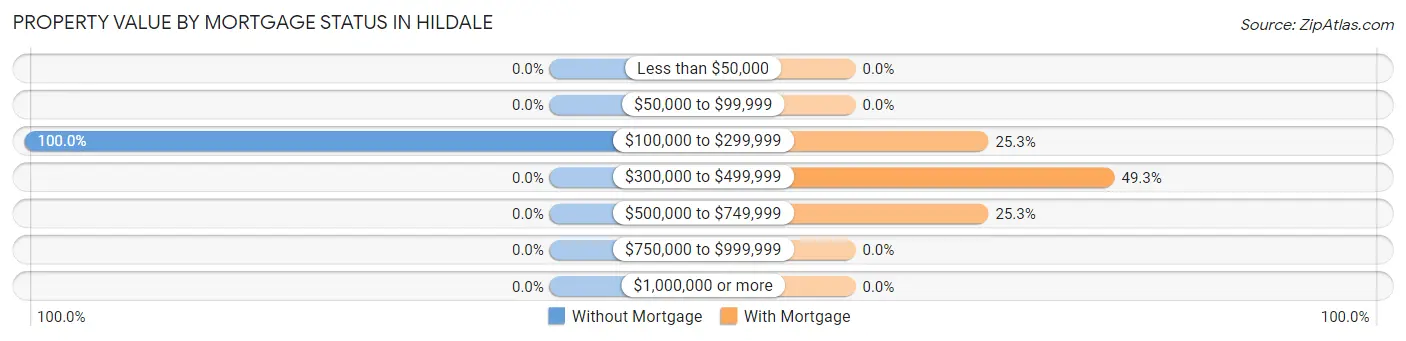
| Property Value | Without Mortgage | With Mortgage |
| Less than $50,000 | 0 (0.0%) | 0 (0.0%) |
| $50,000 to $99,999 | 0 (0.0%) | 0 (0.0%) |
| $100,000 to $299,999 | 3 (100.0%) | 19 (25.3%) |
| $300,000 to $499,999 | 0 (0.0%) | 37 (49.3%) |
| $500,000 to $749,999 | 0 (0.0%) | 19 (25.3%) |
| $750,000 to $999,999 | 0 (0.0%) | 0 (0.0%) |
| $1,000,000 or more | 0 (0.0%) | 0 (0.0%) |
| Total | 3 (100.0%) | 75 (100.0%) |
Household Income by Mortgage Status in Hildale
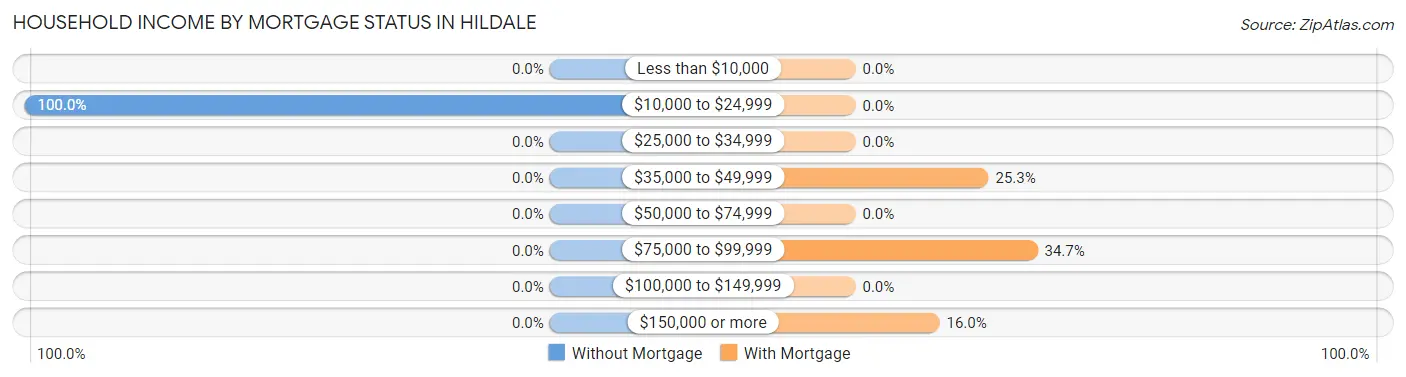
| Household Income | Without Mortgage | With Mortgage |
| Less than $10,000 | 0 (0.0%) | 0 (0.0%) |
| $10,000 to $24,999 | 3 (100.0%) | 0 (0.0%) |
| $25,000 to $34,999 | 0 (0.0%) | 0 (0.0%) |
| $35,000 to $49,999 | 0 (0.0%) | 19 (25.3%) |
| $50,000 to $74,999 | 0 (0.0%) | 0 (0.0%) |
| $75,000 to $99,999 | 0 (0.0%) | 26 (34.7%) |
| $100,000 to $149,999 | 0 (0.0%) | 0 (0.0%) |
| $150,000 or more | 0 (0.0%) | 12 (16.0%) |
| Total | 3 (100.0%) | 75 (100.0%) |
Property Value to Household Income Ratio in Hildale
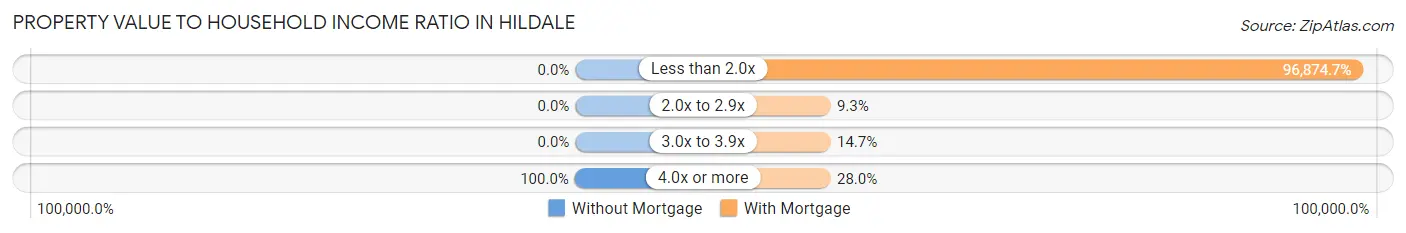
| Value-to-Income Ratio | Without Mortgage | With Mortgage |
| Less than 2.0x | 0 (0.0%) | 72,656 (96,874.7%) |
| 2.0x to 2.9x | 0 (0.0%) | 7 (9.3%) |
| 3.0x to 3.9x | 0 (0.0%) | 11 (14.7%) |
| 4.0x or more | 3 (100.0%) | 21 (28.0%) |
| Total | 3 (100.0%) | 75 (100.0%) |
Real Estate Taxes by Mortgage Status in Hildale
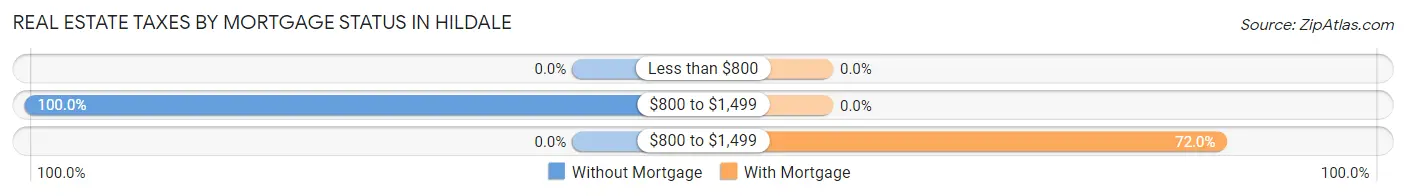
| Property Taxes | Without Mortgage | With Mortgage |
| Less than $800 | 0 (0.0%) | 0 (0.0%) |
| $800 to $1,499 | 3 (100.0%) | 0 (0.0%) |
| $800 to $1,499 | 0 (0.0%) | 54 (72.0%) |
| Total | 3 (100.0%) | 75 (100.0%) |
Health & Disability in Hildale
Health Insurance Coverage by Age in Hildale
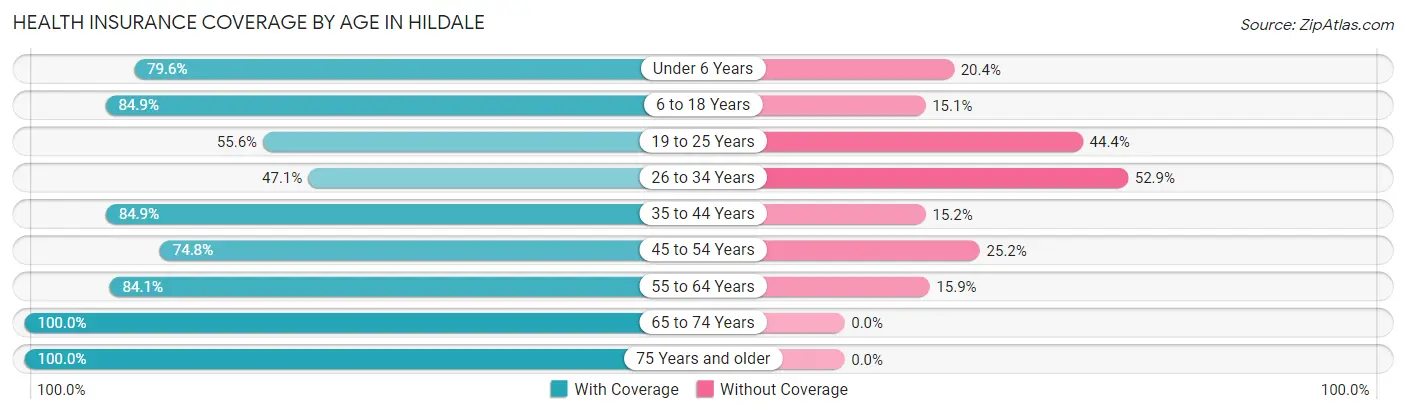
| Age Bracket | With Coverage | Without Coverage |
| Under 6 Years | 78 (79.6%) | 20 (20.4%) |
| 6 to 18 Years | 270 (84.9%) | 48 (15.1%) |
| 19 to 25 Years | 65 (55.6%) | 52 (44.4%) |
| 26 to 34 Years | 82 (47.1%) | 92 (52.9%) |
| 35 to 44 Years | 112 (84.9%) | 20 (15.1%) |
| 45 to 54 Years | 80 (74.8%) | 27 (25.2%) |
| 55 to 64 Years | 53 (84.1%) | 10 (15.9%) |
| 65 to 74 Years | 29 (100.0%) | 0 (0.0%) |
| 75 Years and older | 38 (100.0%) | 0 (0.0%) |
| Total | 807 (75.0%) | 269 (25.0%) |
Health Insurance Coverage by Citizenship Status in Hildale
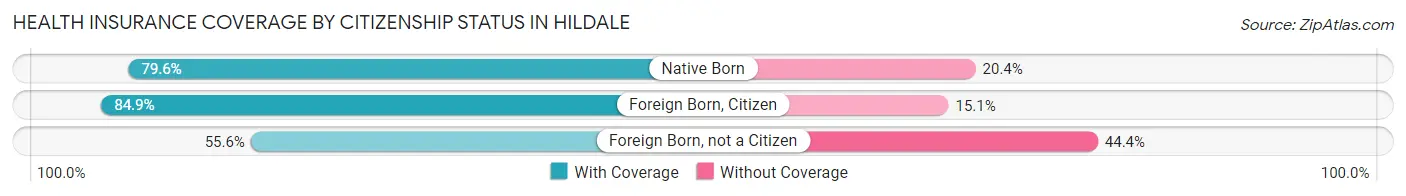
| Citizenship Status | With Coverage | Without Coverage |
| Native Born | 78 (79.6%) | 20 (20.4%) |
| Foreign Born, Citizen | 270 (84.9%) | 48 (15.1%) |
| Foreign Born, not a Citizen | 65 (55.6%) | 52 (44.4%) |
Health Insurance Coverage by Household Income in Hildale
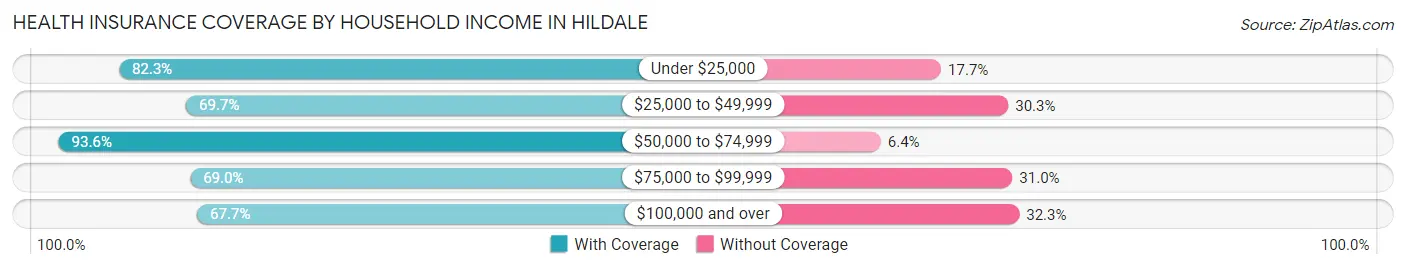
| Household Income | With Coverage | Without Coverage |
| Under $25,000 | 149 (82.3%) | 32 (17.7%) |
| $25,000 to $49,999 | 106 (69.7%) | 46 (30.3%) |
| $50,000 to $74,999 | 176 (93.6%) | 12 (6.4%) |
| $75,000 to $99,999 | 20 (69.0%) | 9 (31.0%) |
| $100,000 and over | 356 (67.7%) | 170 (32.3%) |
Public vs Private Health Insurance Coverage by Age in Hildale
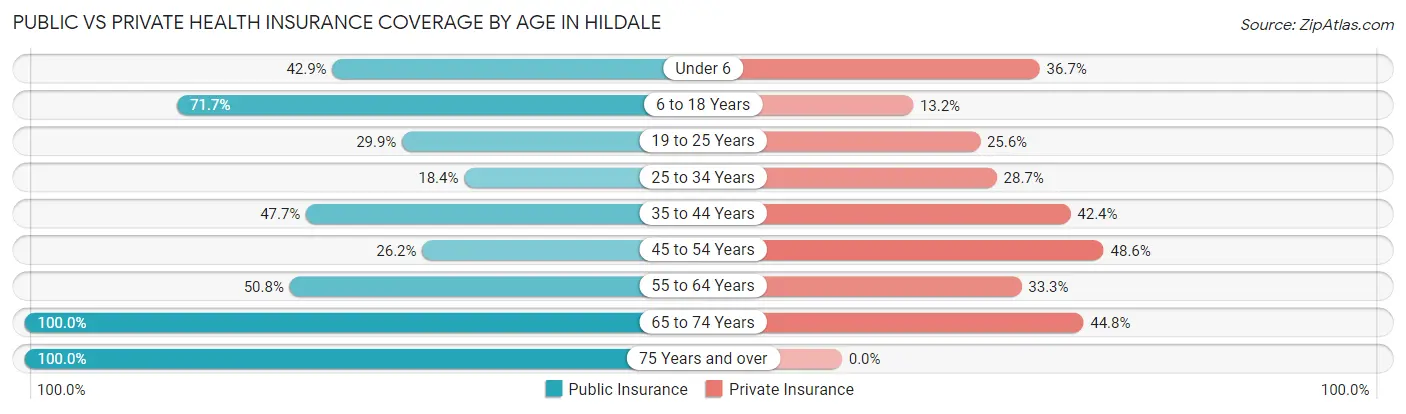
| Age Bracket | Public Insurance | Private Insurance |
| Under 6 | 42 (42.9%) | 36 (36.7%) |
| 6 to 18 Years | 228 (71.7%) | 42 (13.2%) |
| 19 to 25 Years | 35 (29.9%) | 30 (25.6%) |
| 25 to 34 Years | 32 (18.4%) | 50 (28.7%) |
| 35 to 44 Years | 63 (47.7%) | 56 (42.4%) |
| 45 to 54 Years | 28 (26.2%) | 52 (48.6%) |
| 55 to 64 Years | 32 (50.8%) | 21 (33.3%) |
| 65 to 74 Years | 29 (100.0%) | 13 (44.8%) |
| 75 Years and over | 38 (100.0%) | 0 (0.0%) |
| Total | 527 (49.0%) | 300 (27.9%) |
Disability Status by Sex by Age in Hildale
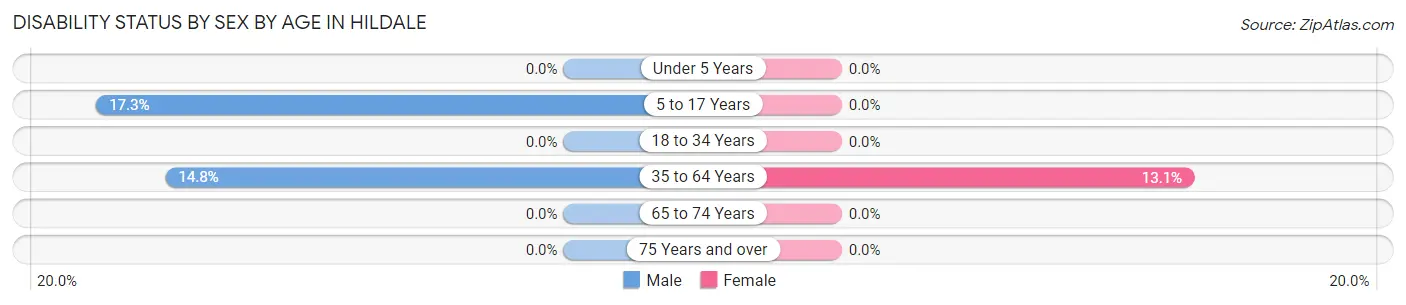
| Age Bracket | Male | Female |
| Under 5 Years | 0 (0.0%) | 0 (0.0%) |
| 5 to 17 Years | 30 (17.3%) | 0 (0.0%) |
| 18 to 34 Years | 0 (0.0%) | 0 (0.0%) |
| 35 to 64 Years | 22 (14.8%) | 20 (13.1%) |
| 65 to 74 Years | 0 (0.0%) | 0 (0.0%) |
| 75 Years and over | 0 (0.0%) | 0 (0.0%) |
Disability Class by Sex by Age in Hildale
Disability Class: Hearing Difficulty
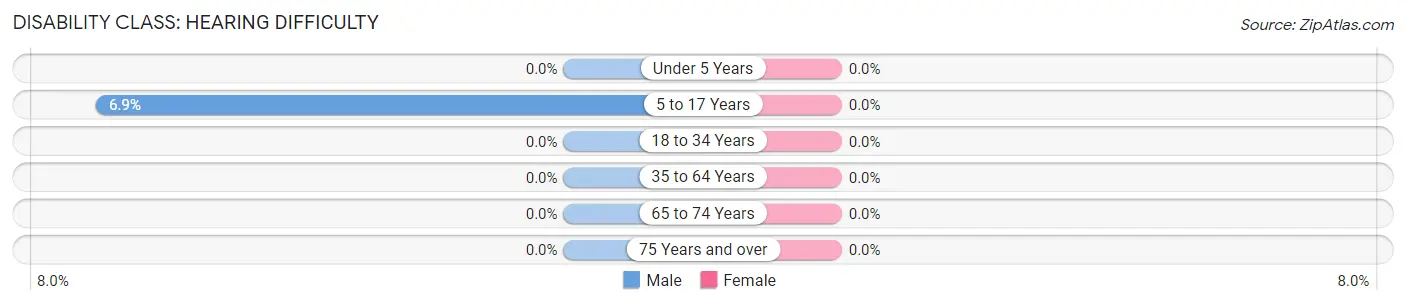
| Age Bracket | Male | Female |
| Under 5 Years | 0 (0.0%) | 0 (0.0%) |
| 5 to 17 Years | 12 (6.9%) | 0 (0.0%) |
| 18 to 34 Years | 0 (0.0%) | 0 (0.0%) |
| 35 to 64 Years | 0 (0.0%) | 0 (0.0%) |
| 65 to 74 Years | 0 (0.0%) | 0 (0.0%) |
| 75 Years and over | 0 (0.0%) | 0 (0.0%) |
Disability Class: Vision Difficulty
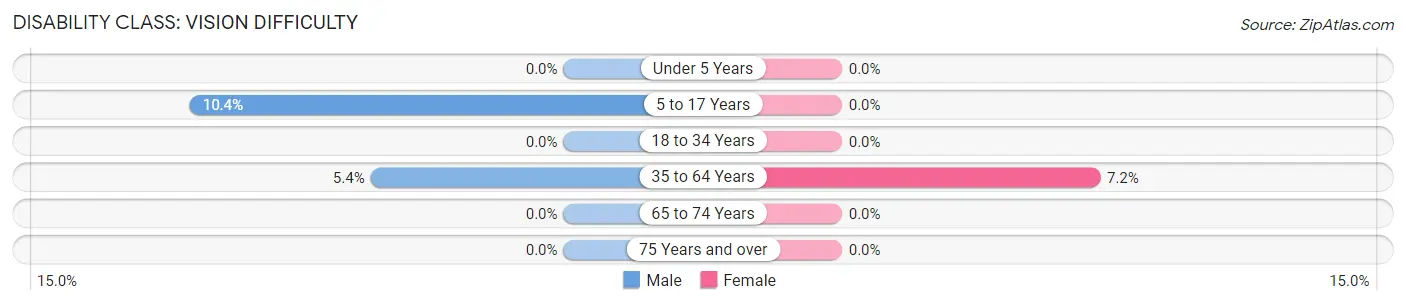
| Age Bracket | Male | Female |
| Under 5 Years | 0 (0.0%) | 0 (0.0%) |
| 5 to 17 Years | 18 (10.4%) | 0 (0.0%) |
| 18 to 34 Years | 0 (0.0%) | 0 (0.0%) |
| 35 to 64 Years | 8 (5.4%) | 11 (7.2%) |
| 65 to 74 Years | 0 (0.0%) | 0 (0.0%) |
| 75 Years and over | 0 (0.0%) | 0 (0.0%) |
Disability Class: Cognitive Difficulty
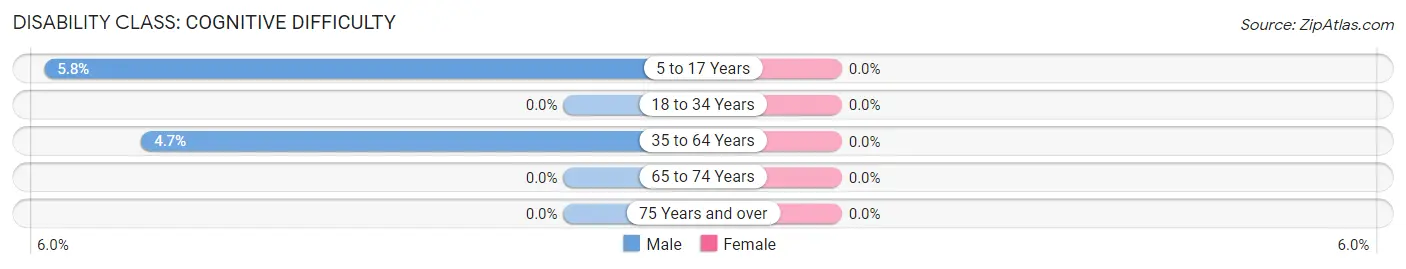
| Age Bracket | Male | Female |
| 5 to 17 Years | 10 (5.8%) | 0 (0.0%) |
| 18 to 34 Years | 0 (0.0%) | 0 (0.0%) |
| 35 to 64 Years | 7 (4.7%) | 0 (0.0%) |
| 65 to 74 Years | 0 (0.0%) | 0 (0.0%) |
| 75 Years and over | 0 (0.0%) | 0 (0.0%) |
Disability Class: Ambulatory Difficulty
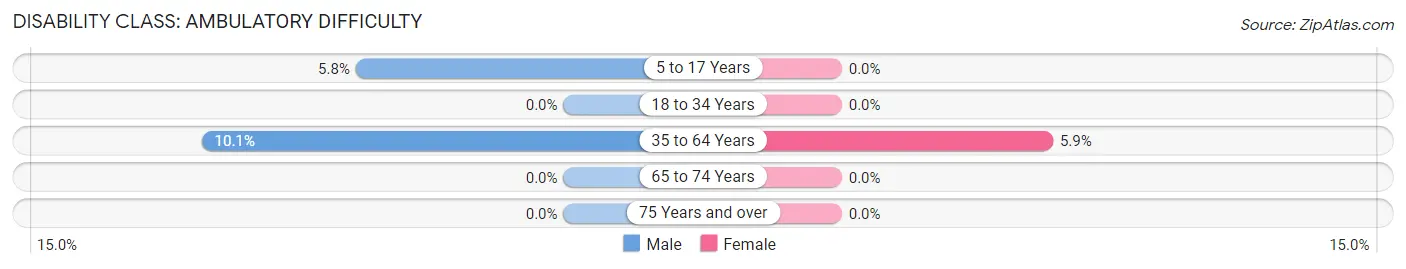
| Age Bracket | Male | Female |
| 5 to 17 Years | 10 (5.8%) | 0 (0.0%) |
| 18 to 34 Years | 0 (0.0%) | 0 (0.0%) |
| 35 to 64 Years | 15 (10.1%) | 9 (5.9%) |
| 65 to 74 Years | 0 (0.0%) | 0 (0.0%) |
| 75 Years and over | 0 (0.0%) | 0 (0.0%) |
Disability Class: Self-Care Difficulty
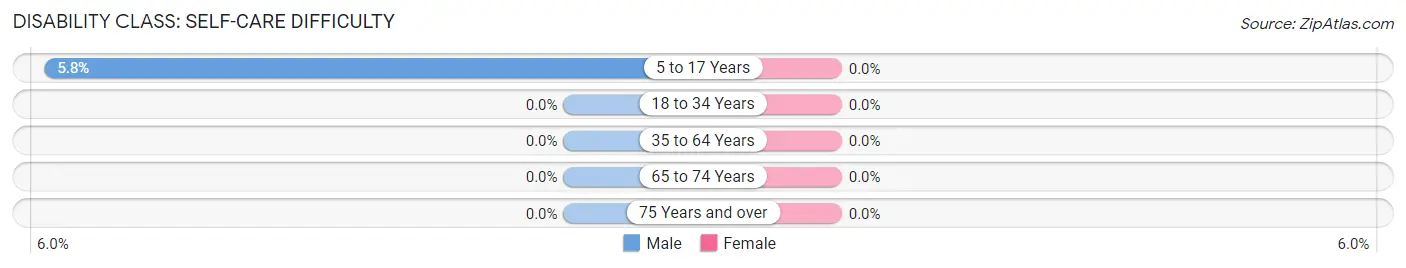
| Age Bracket | Male | Female |
| 5 to 17 Years | 10 (5.8%) | 0 (0.0%) |
| 18 to 34 Years | 0 (0.0%) | 0 (0.0%) |
| 35 to 64 Years | 0 (0.0%) | 0 (0.0%) |
| 65 to 74 Years | 0 (0.0%) | 0 (0.0%) |
| 75 Years and over | 0 (0.0%) | 0 (0.0%) |
Technology Access in Hildale
Computing Device Access in Hildale
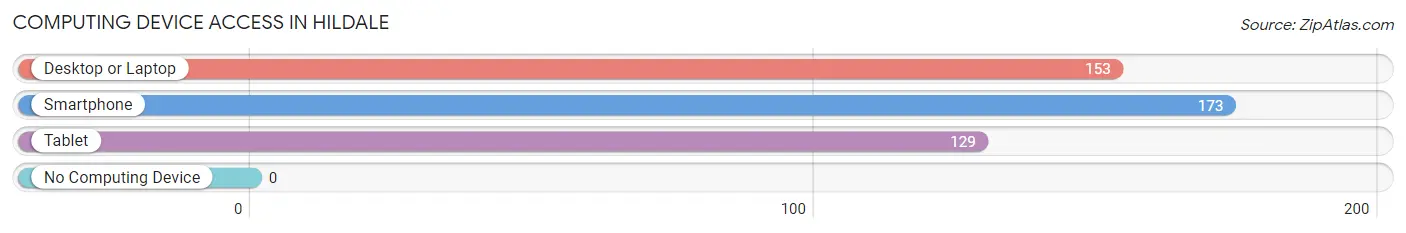
| Device Type | # Households | % Households |
| Desktop or Laptop | 153 | 88.4% |
| Smartphone | 173 | 100.0% |
| Tablet | 129 | 74.6% |
| No Computing Device | 0 | 0.0% |
| Total | 173 | 100.0% |
Internet Access in Hildale
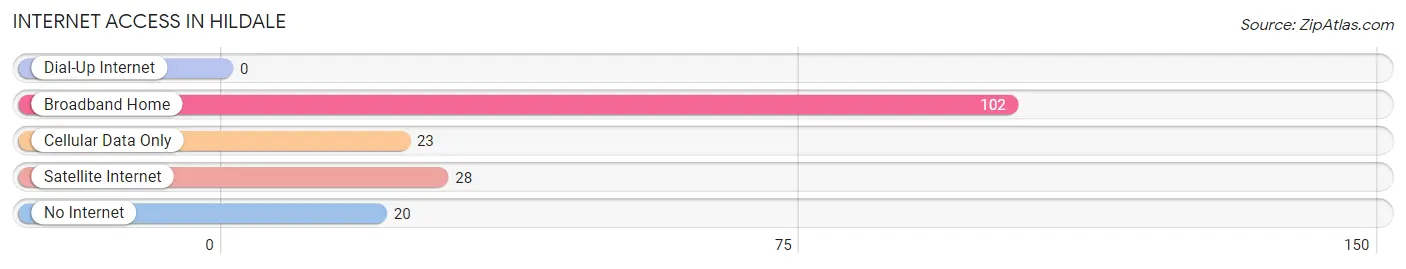
| Internet Type | # Households | % Households |
| Dial-Up Internet | 0 | 0.0% |
| Broadband Home | 102 | 59.0% |
| Cellular Data Only | 23 | 13.3% |
| Satellite Internet | 28 | 16.2% |
| No Internet | 20 | 11.6% |
| Total | 173 | 100.0% |
Hildale Summary
Hildale, Utah is a small city located in the southwestern corner of the state, near the Arizona border. It is part of the larger Washington County, and is situated in a picturesque valley surrounded by red sandstone cliffs. The city is known for its strong sense of community and its unique culture, which is heavily influenced by the Church of Jesus Christ of Latter-day Saints (LDS).
Geography
Hildale is located in the extreme southwestern corner of Utah, near the Arizona border. It is situated in a picturesque valley surrounded by red sandstone cliffs. The city is located at an elevation of 3,890 feet, and is part of the larger Washington County. The city is located in the Colorado Plateau region, and is characterized by its dry climate and desert-like terrain.
The city is located near the Virgin River, which is a major tributary of the Colorado River. The Virgin River is a popular destination for fishing, swimming, and other recreational activities. The city is also located near the Grand Staircase-Escalante National Monument, which is a protected area of land that is home to a variety of wildlife and plant species.
Economy
Hildale’s economy is largely based on agriculture and tourism. The city is home to a number of farms and ranches, which produce a variety of crops and livestock. The city is also home to a number of tourist attractions, including the Grand Staircase-Escalante National Monument, Zion National Park, and the Virgin River.
The city is also home to a number of businesses, including restaurants, retail stores, and other services. The city is home to a number of manufacturing companies, which produce a variety of products, including furniture, clothing, and other items.
Demographics
As of the 2010 census, the population of Hildale was 2,724. The city is predominantly white, with a population that is 97.3% white. The city is also home to a large population of Mormons, with a population that is 94.3% Mormon. The city is also home to a small population of Native Americans, with a population that is 0.7% Native American.
The median household income in Hildale is $37,917, and the median family income is $41,917. The city has a poverty rate of 16.3%, which is higher than the national average.
Conclusion
Hildale, Utah is a small city located in the southwestern corner of the state, near the Arizona border. It is part of the larger Washington County, and is situated in a picturesque valley surrounded by red sandstone cliffs. The city is known for its strong sense of community and its unique culture, which is heavily influenced by the Church of Jesus Christ of Latter-day Saints (LDS). The city’s economy is largely based on agriculture and tourism, and the city is home to a number of businesses, including restaurants, retail stores, and other services. The population of Hildale is predominantly white, with a population that is 97.3% white, and 94.3% Mormon. The median household income in Hildale is $37,917, and the median family income is $41,917. The city has a poverty rate of 16.3%, which is higher than the national average.
Common Questions
What is Per Capita Income in Hildale?
Per Capita income in Hildale is $16,797.
What is the Median Family Income in Hildale?
Median Family Income in Hildale is $61,389.
What is the Median Household income in Hildale?
Median Household Income in Hildale is $65,179.
What is Income or Wage Gap in Hildale?
Income or Wage Gap in Hildale is 47.4%.
Women in Hildale earn 52.6 cents for every dollar earned by a man.
What is Inequality or Gini Index in Hildale?
Inequality or Gini Index in Hildale is 0.50.
What is the Total Population of Hildale?
Total Population of Hildale is 1,076.
What is the Total Male Population of Hildale?
Total Male Population of Hildale is 520.
What is the Total Female Population of Hildale?
Total Female Population of Hildale is 556.
What is the Ratio of Males per 100 Females in Hildale?
There are 93.53 Males per 100 Females in Hildale.
What is the Ratio of Females per 100 Males in Hildale?
There are 106.92 Females per 100 Males in Hildale.
What is the Median Population Age in Hildale?
Median Population Age in Hildale is 26.1 Years.
What is the Average Family Size in Hildale
Average Family Size in Hildale is 5.9 People.
What is the Average Household Size in Hildale
Average Household Size in Hildale is 6.2 People.
How Large is the Labor Force in Hildale?
There are 422 People in the Labor Forcein in Hildale.
What is the Percentage of People in the Labor Force in Hildale?
58.4% of People are in the Labor Force in Hildale.
What is the Unemployment Rate in Hildale?
Unemployment Rate in Hildale is 6.4%.