Zip Codes with the Highest Percentage of Population Employed in Food Preparation & Serving in West Valley City, UT
RELATED REPORTS & OPTIONS
Food Preparation & Serving
West Valley City
Compare Zip Codes
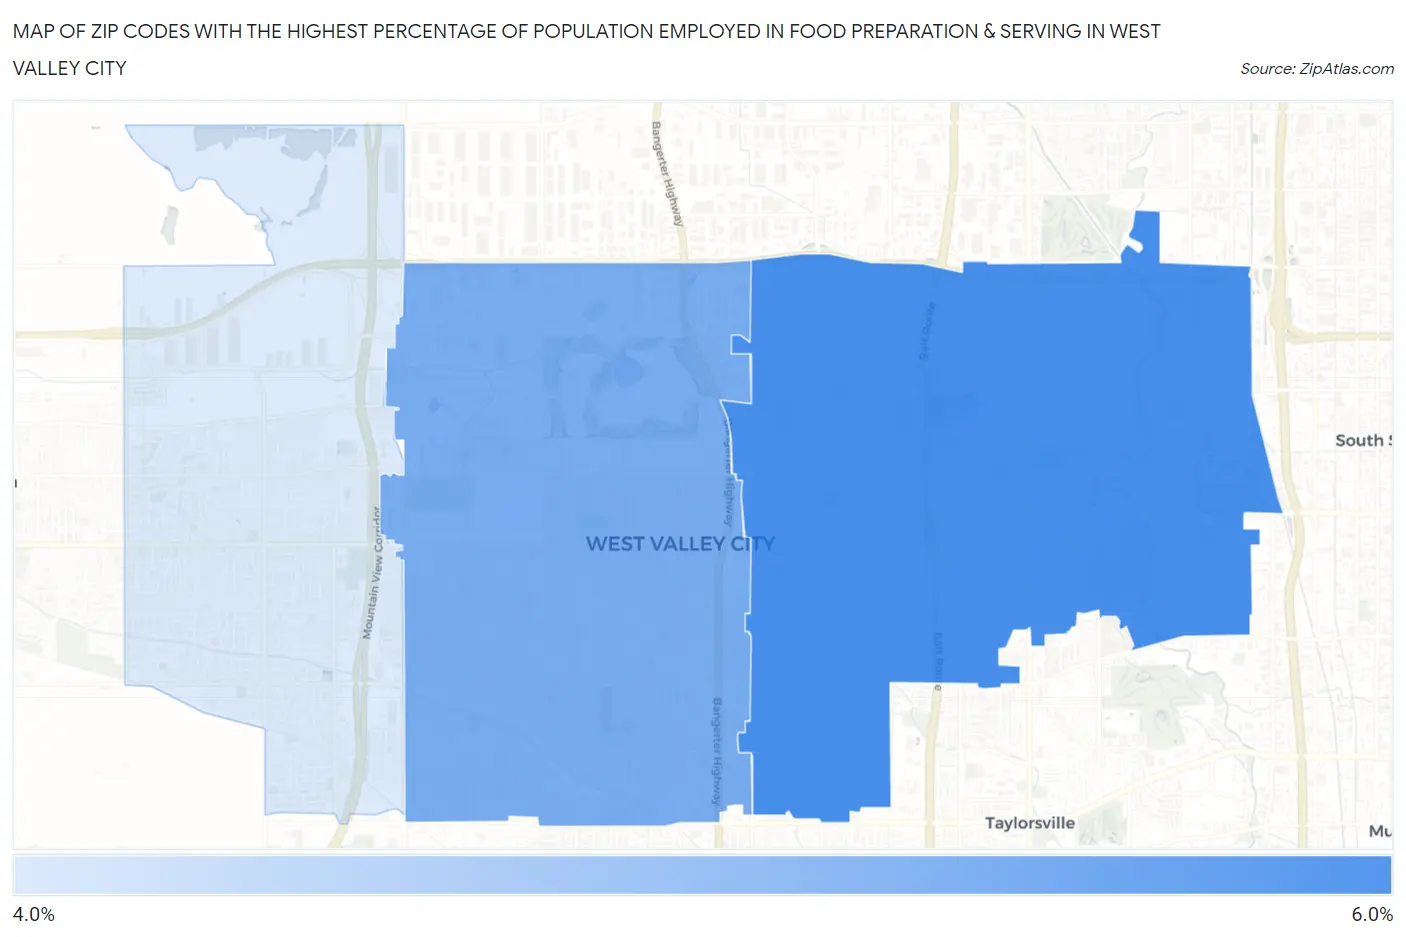
Map of Zip Codes with the Highest Percentage of Population Employed in Food Preparation & Serving in West Valley City
4.6%
5.5%
Zip Codes with the Highest Percentage of Population Employed in Food Preparation & Serving in West Valley City, UT
| Zip Code | % Employed | vs State | vs National | |
| 1. | 84119 | 5.5% | 4.5%(+0.956)#72 | 5.3%(+0.207)#11,087 |
| 2. | 84120 | 5.2% | 4.5%(+0.662)#78 | 5.3%(-0.087)#12,145 |
| 3. | 84128 | 4.6% | 4.5%(+0.063)#102 | 5.3%(-0.686)#14,598 |
1
Common Questions
What are the Top Zip Codes with the Highest Percentage of Population Employed in Food Preparation & Serving in West Valley City, UT?
Top Zip Codes with the Highest Percentage of Population Employed in Food Preparation & Serving in West Valley City, UT are:
What zip code has the Highest Percentage of Population Employed in Food Preparation & Serving in West Valley City, UT?
84119 has the Highest Percentage of Population Employed in Food Preparation & Serving in West Valley City, UT with 5.5%.
What is the Percentage of Population Employed in Food Preparation & Serving in West Valley City, UT?
Percentage of Population Employed in Food Preparation & Serving in West Valley City is 5.3%.
What is the Percentage of Population Employed in Food Preparation & Serving in Utah?
Percentage of Population Employed in Food Preparation & Serving in Utah is 4.5%.
What is the Percentage of Population Employed in Food Preparation & Serving in the United States?
Percentage of Population Employed in Food Preparation & Serving in the United States is 5.3%.