Carbonville, UT Map & Demographics
Carbonville Map
Carbonville Overview
$33,500
PER CAPITA INCOME
$75,682
AVG FAMILY INCOME
$77,386
AVG HOUSEHOLD INCOME
2.4%
WAGE / INCOME GAP [ % ]
97.6¢/ $1
WAGE / INCOME GAP [ $ ]
0.32
INEQUALITY / GINI INDEX
1,366
TOTAL POPULATION
729
MALE POPULATION
637
FEMALE POPULATION
114.44
MALES / 100 FEMALES
87.38
FEMALES / 100 MALES
40.7
MEDIAN AGE
2.9
AVG FAMILY SIZE
2.4
AVG HOUSEHOLD SIZE
625
LABOR FORCE [ PEOPLE ]
59.9%
PERCENT IN LABOR FORCE
Income in Carbonville
Income Overview in Carbonville
Per Capita Income in Carbonville is $33,500, while median incomes of families and households are $75,682 and $77,386 respectively.
| Characteristic | Number | Measure |
| Per Capita Income | 1,366 | $33,500 |
| Median Family Income | 382 | $75,682 |
| Mean Family Income | 382 | $81,068 |
| Median Household Income | 575 | $77,386 |
| Mean Household Income | 575 | $82,948 |
| Income Deficit | 382 | $0 |
| Wage / Income Gap (%) | 1,366 | 2.39% |
| Wage / Income Gap ($) | 1,366 | 97.61¢ per $1 |
| Gini / Inequality Index | 1,366 | 0.32 |
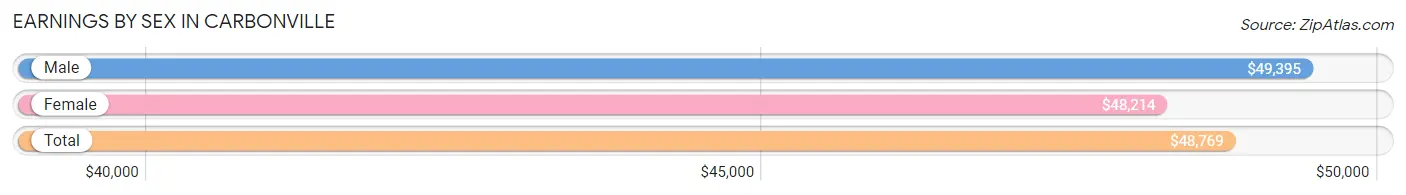
Earnings by Sex in Carbonville
Average Earnings in Carbonville are $48,769, $49,395 for men and $48,214 for women, a difference of 2.4%.
| Sex | Number | Average Earnings |
| Male | 383 (57.9%) | $49,395 |
| Female | 278 (42.1%) | $48,214 |
| Total | 661 (100.0%) | $48,769 |
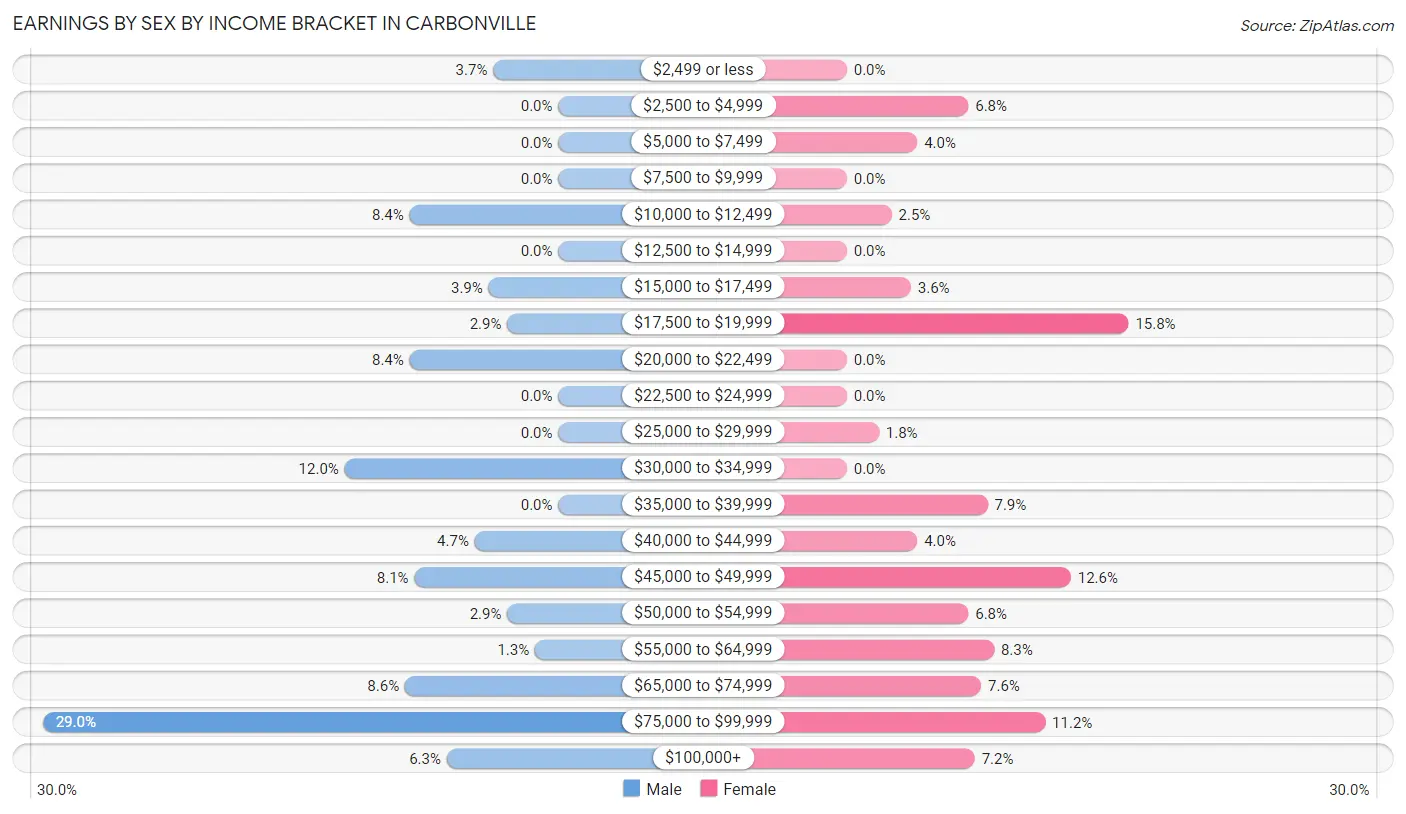
Earnings by Sex by Income Bracket in Carbonville
The most common earnings brackets in Carbonville are $75,000 to $99,999 for men (111 | 29.0%) and $17,500 to $19,999 for women (44 | 15.8%).
| Income | Male | Female |
| $2,499 or less | 14 (3.7%) | 0 (0.0%) |
| $2,500 to $4,999 | 0 (0.0%) | 19 (6.8%) |
| $5,000 to $7,499 | 0 (0.0%) | 11 (4.0%) |
| $7,500 to $9,999 | 0 (0.0%) | 0 (0.0%) |
| $10,000 to $12,499 | 32 (8.4%) | 7 (2.5%) |
| $12,500 to $14,999 | 0 (0.0%) | 0 (0.0%) |
| $15,000 to $17,499 | 15 (3.9%) | 10 (3.6%) |
| $17,500 to $19,999 | 11 (2.9%) | 44 (15.8%) |
| $20,000 to $22,499 | 32 (8.4%) | 0 (0.0%) |
| $22,500 to $24,999 | 0 (0.0%) | 0 (0.0%) |
| $25,000 to $29,999 | 0 (0.0%) | 5 (1.8%) |
| $30,000 to $34,999 | 46 (12.0%) | 0 (0.0%) |
| $35,000 to $39,999 | 0 (0.0%) | 22 (7.9%) |
| $40,000 to $44,999 | 18 (4.7%) | 11 (4.0%) |
| $45,000 to $49,999 | 31 (8.1%) | 35 (12.6%) |
| $50,000 to $54,999 | 11 (2.9%) | 19 (6.8%) |
| $55,000 to $64,999 | 5 (1.3%) | 23 (8.3%) |
| $65,000 to $74,999 | 33 (8.6%) | 21 (7.5%) |
| $75,000 to $99,999 | 111 (29.0%) | 31 (11.2%) |
| $100,000+ | 24 (6.3%) | 20 (7.2%) |
| Total | 383 (100.0%) | 278 (100.0%) |
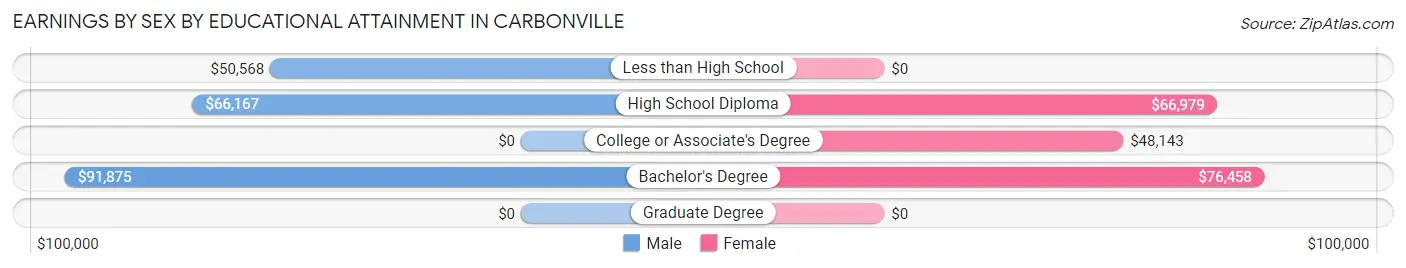
Earnings by Sex by Educational Attainment in Carbonville
Average earnings in Carbonville are $65,917 for men and $50,795 for women, a difference of 22.9%. Men with an educational attainment of bachelor's degree enjoy the highest average annual earnings of $91,875, while those with less than high school education earn the least with $50,568. Women with an educational attainment of bachelor's degree earn the most with the average annual earnings of $76,458, while those with college or associate's degree education have the smallest earnings of $48,143.
| Educational Attainment | Male Income | Female Income |
| Less than High School | $50,568 | $0 |
| High School Diploma | $66,167 | $66,979 |
| College or Associate's Degree | - | - |
| Bachelor's Degree | $91,875 | $76,458 |
| Graduate Degree | - | - |
| Total | $65,917 | $50,795 |
Family Income in Carbonville
Family Income Brackets in Carbonville
According to the Carbonville family income data, there are 113 families falling into the $100,000 to $149,999 income range, which is the most common income bracket and makes up 29.6% of all families.
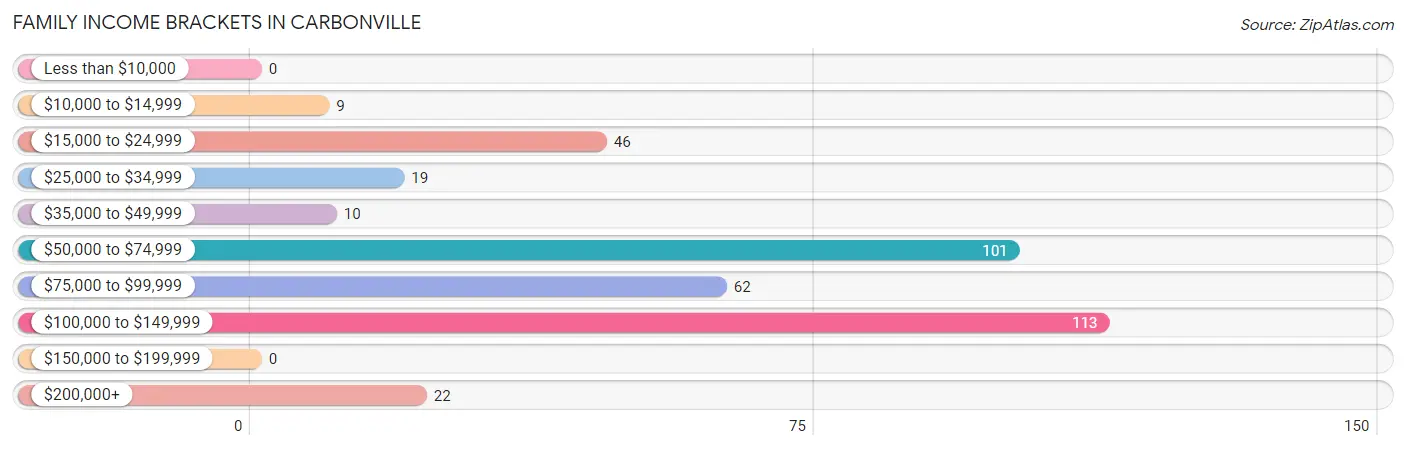
| Income Bracket | # Families | % Families |
| Less than $10,000 | 0 | 0.0% |
| $10,000 to $14,999 | 9 | 2.4% |
| $15,000 to $24,999 | 46 | 12.0% |
| $25,000 to $34,999 | 19 | 5.0% |
| $35,000 to $49,999 | 10 | 2.6% |
| $50,000 to $74,999 | 101 | 26.4% |
| $75,000 to $99,999 | 62 | 16.2% |
| $100,000 to $149,999 | 113 | 29.6% |
| $150,000 to $199,999 | 0 | 0.0% |
| $200,000+ | 22 | 5.8% |
Family Income by Famaliy Size in Carbonville
5-person families (30 | 7.9%) account for the highest median family income in Carbonville with $202,917 per family, while 5-person families (30 | 7.9%) have the highest median income of $40,583 per family member.
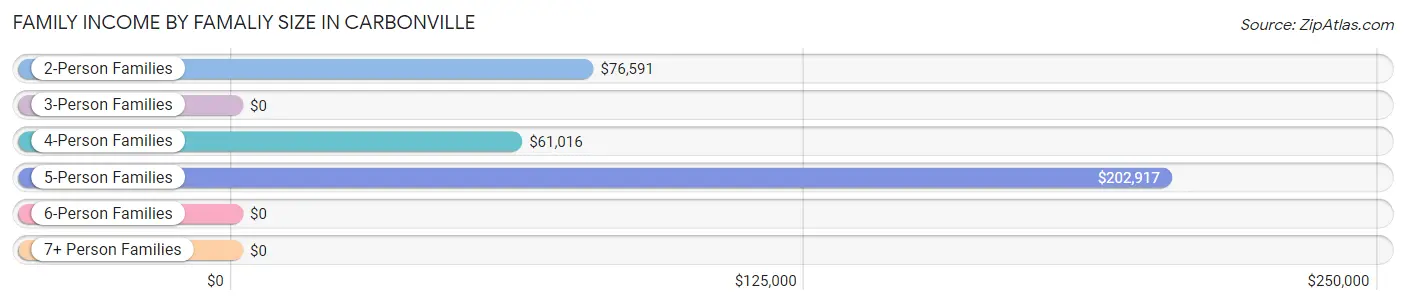
| Income Bracket | # Families | Median Income |
| 2-Person Families | 202 (52.9%) | $76,591 |
| 3-Person Families | 31 (8.1%) | $0 |
| 4-Person Families | 114 (29.8%) | $61,016 |
| 5-Person Families | 30 (7.9%) | $202,917 |
| 6-Person Families | 5 (1.3%) | $0 |
| 7+ Person Families | 0 (0.0%) | $0 |
| Total | 382 (100.0%) | $75,682 |
Family Income by Number of Earners in Carbonville
The median family income in Carbonville is $75,682, with families comprising 3+ earners (22) having the highest median family income of $204,792, while families with no earners (65) have the lowest median family income of $22,176, accounting for 5.8% and 17.0% of families, respectively.
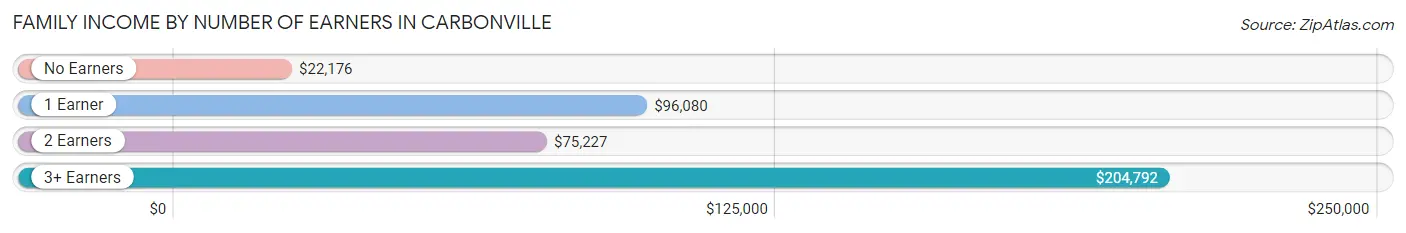
| Number of Earners | # Families | Median Income |
| No Earners | 65 (17.0%) | $22,176 |
| 1 Earner | 139 (36.4%) | $96,080 |
| 2 Earners | 156 (40.8%) | $75,227 |
| 3+ Earners | 22 (5.8%) | $204,792 |
| Total | 382 (100.0%) | $75,682 |
Household Income in Carbonville
Household Income Brackets in Carbonville
With 147 households falling in the category, the $50,000 to $74,999 income range is the most frequent in Carbonville, accounting for 25.6% of all households.
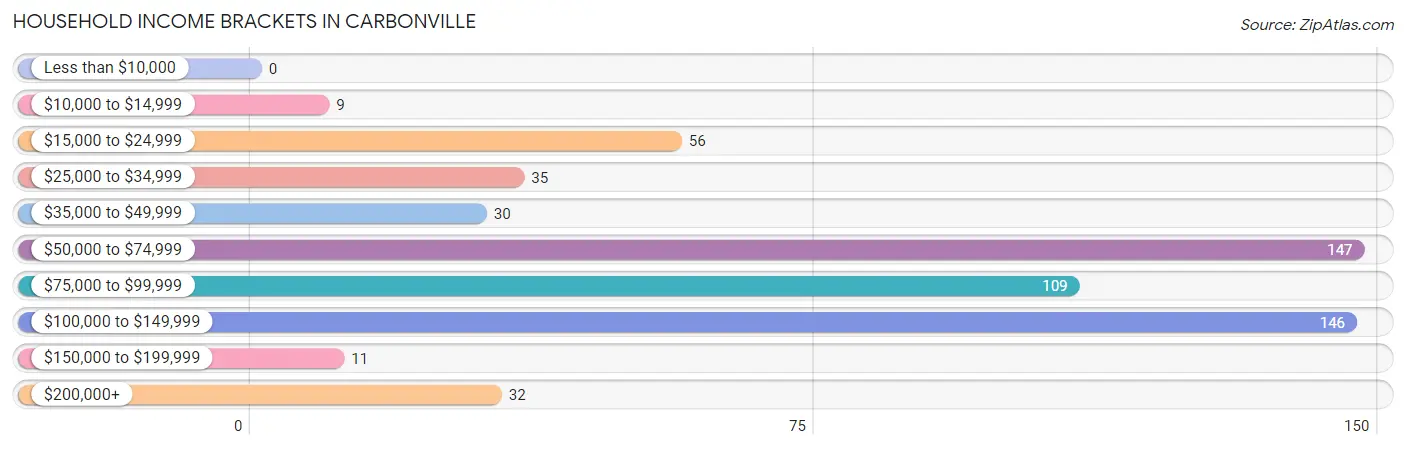
| Income Bracket | # Households | % Households |
| Less than $10,000 | 0 | 0.0% |
| $10,000 to $14,999 | 9 | 1.6% |
| $15,000 to $24,999 | 56 | 9.7% |
| $25,000 to $34,999 | 35 | 6.1% |
| $35,000 to $49,999 | 30 | 5.2% |
| $50,000 to $74,999 | 147 | 25.6% |
| $75,000 to $99,999 | 109 | 19.0% |
| $100,000 to $149,999 | 146 | 25.4% |
| $150,000 to $199,999 | 11 | 1.9% |
| $200,000+ | 32 | 5.6% |
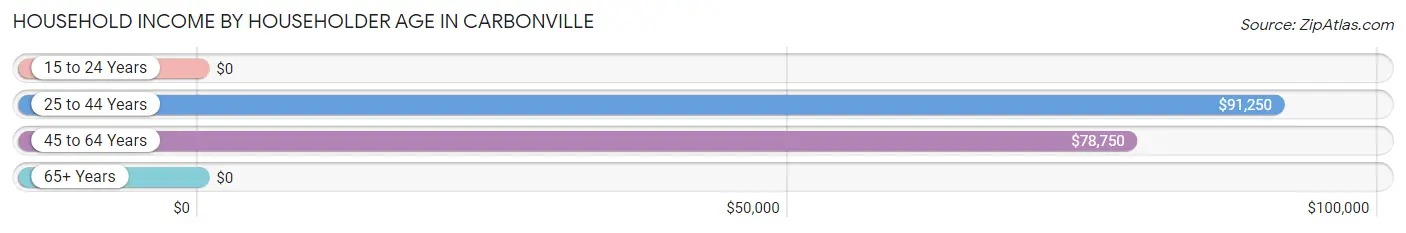
Household Income by Householder Age in Carbonville
The median household income in Carbonville is $77,386, with the highest median household income of $91,250 found in the 25 to 44 years age bracket for the primary householder. A total of 158 households (27.5%) fall into this category. Meanwhile, the 15 to 24 years age bracket for the primary householder has the lowest median household income of $0, with 13 households (2.3%) in this group.
| Income Bracket | # Households | Median Income |
| 15 to 24 Years | 13 (2.3%) | $0 |
| 25 to 44 Years | 158 (27.5%) | $91,250 |
| 45 to 64 Years | 228 (39.7%) | $78,750 |
| 65+ Years | 176 (30.6%) | $0 |
| Total | 575 (100.0%) | $77,386 |
Poverty in Carbonville
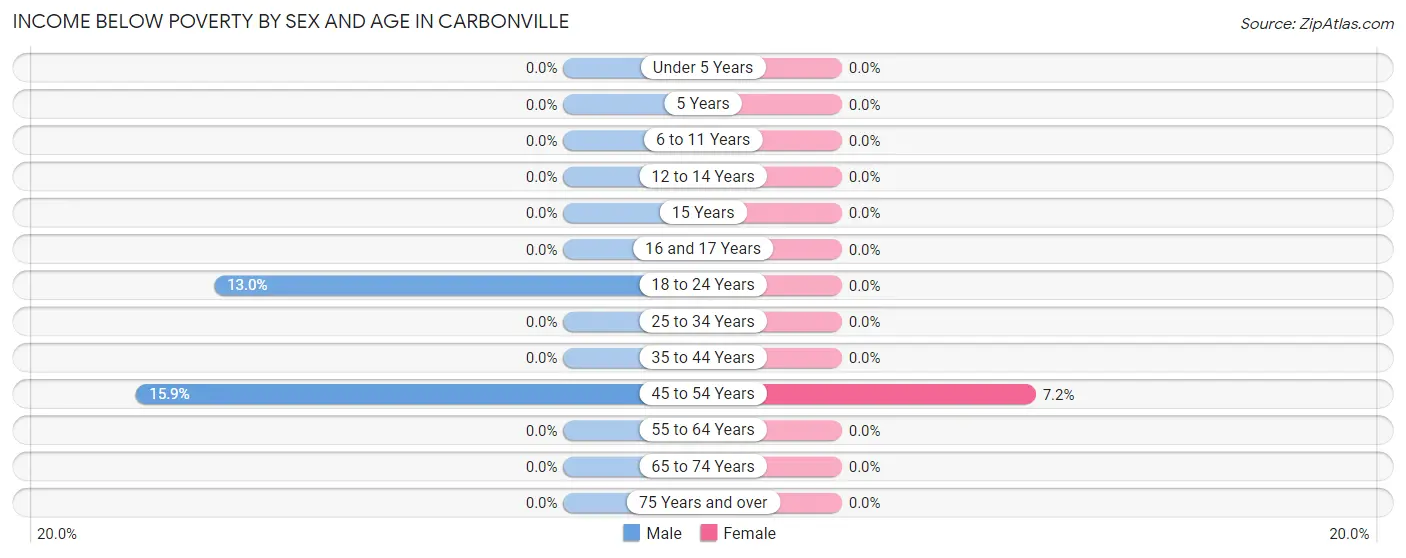
Income Below Poverty by Sex and Age in Carbonville
With 2.7% poverty level for males and 1.4% for females among the residents of Carbonville, 45 to 54 year old males and 45 to 54 year old females are the most vulnerable to poverty, with 13 males (15.9%) and 9 females (7.2%) in their respective age groups living below the poverty level.
| Age Bracket | Male | Female |
| Under 5 Years | 0 (0.0%) | 0 (0.0%) |
| 5 Years | 0 (0.0%) | 0 (0.0%) |
| 6 to 11 Years | 0 (0.0%) | 0 (0.0%) |
| 12 to 14 Years | 0 (0.0%) | 0 (0.0%) |
| 15 Years | 0 (0.0%) | 0 (0.0%) |
| 16 and 17 Years | 0 (0.0%) | 0 (0.0%) |
| 18 to 24 Years | 7 (13.0%) | 0 (0.0%) |
| 25 to 34 Years | 0 (0.0%) | 0 (0.0%) |
| 35 to 44 Years | 0 (0.0%) | 0 (0.0%) |
| 45 to 54 Years | 13 (15.9%) | 9 (7.2%) |
| 55 to 64 Years | 0 (0.0%) | 0 (0.0%) |
| 65 to 74 Years | 0 (0.0%) | 0 (0.0%) |
| 75 Years and over | 0 (0.0%) | 0 (0.0%) |
| Total | 20 (2.7%) | 9 (1.4%) |
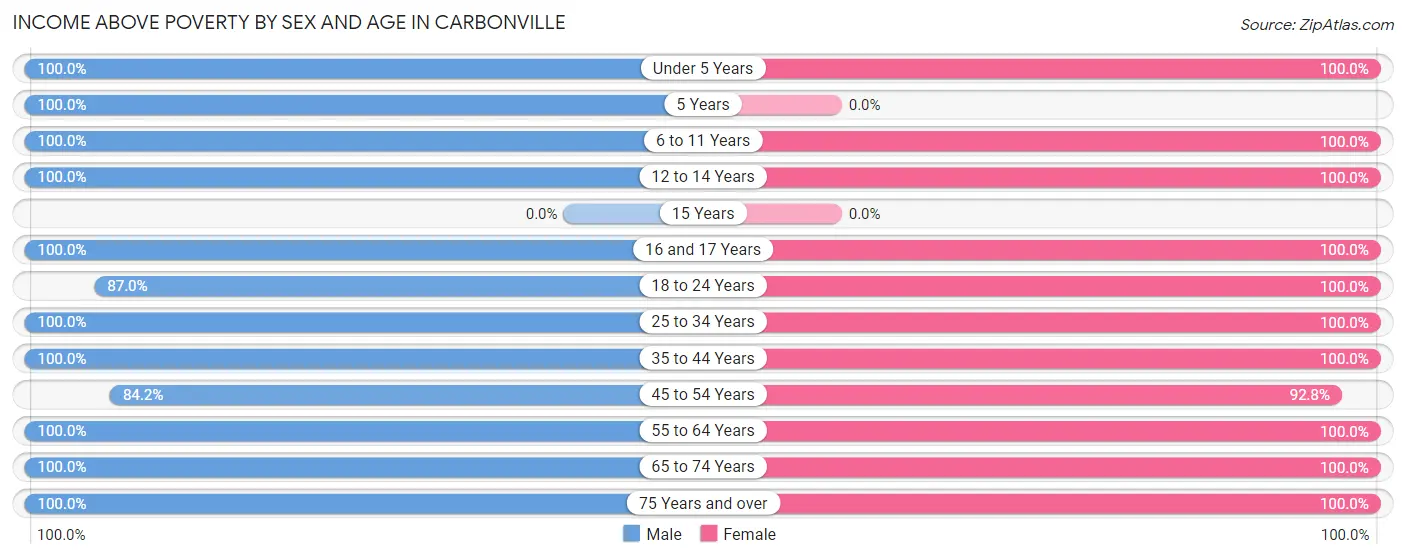
Income Above Poverty by Sex and Age in Carbonville
According to the poverty statistics in Carbonville, males aged under 5 years and females aged under 5 years are the age groups that are most secure financially, with 100.0% of males and 100.0% of females in these age groups living above the poverty line.
| Age Bracket | Male | Female |
| Under 5 Years | 6 (100.0%) | 92 (100.0%) |
| 5 Years | 48 (100.0%) | 0 (0.0%) |
| 6 to 11 Years | 59 (100.0%) | 60 (100.0%) |
| 12 to 14 Years | 51 (100.0%) | 7 (100.0%) |
| 15 Years | 0 (0.0%) | 0 (0.0%) |
| 16 and 17 Years | 22 (100.0%) | 5 (100.0%) |
| 18 to 24 Years | 47 (87.0%) | 57 (100.0%) |
| 25 to 34 Years | 86 (100.0%) | 41 (100.0%) |
| 35 to 44 Years | 58 (100.0%) | 72 (100.0%) |
| 45 to 54 Years | 69 (84.2%) | 116 (92.8%) |
| 55 to 64 Years | 132 (100.0%) | 68 (100.0%) |
| 65 to 74 Years | 78 (100.0%) | 28 (100.0%) |
| 75 Years and over | 53 (100.0%) | 82 (100.0%) |
| Total | 709 (97.3%) | 628 (98.6%) |
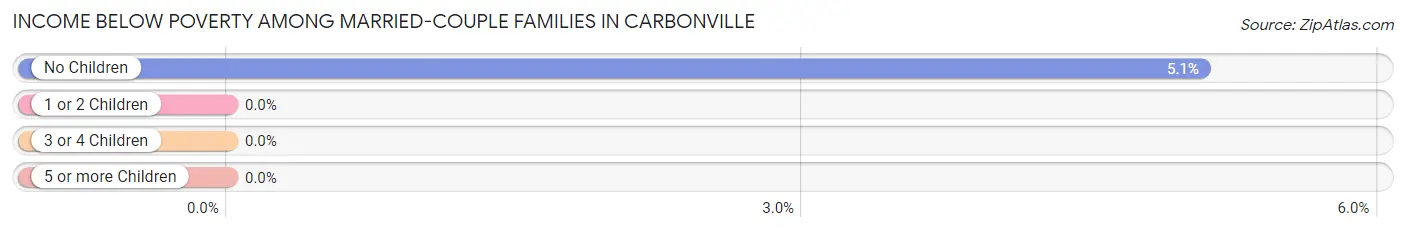
Income Below Poverty Among Married-Couple Families in Carbonville
The poverty statistics for married-couple families in Carbonville show that 2.6% or 9 of the total 342 families live below the poverty line. Families with no children have the highest poverty rate of 5.1%, comprising of 9 families. On the other hand, families with 1 or 2 children have the lowest poverty rate of 0.0%, which includes 0 families.
| Children | Above Poverty | Below Poverty |
| No Children | 168 (94.9%) | 9 (5.1%) |
| 1 or 2 Children | 152 (100.0%) | 0 (0.0%) |
| 3 or 4 Children | 13 (100.0%) | 0 (0.0%) |
| 5 or more Children | 0 (0.0%) | 0 (0.0%) |
| Total | 333 (97.4%) | 9 (2.6%) |
Income Below Poverty Among Single-Parent Households in Carbonville
| Children | Single Father | Single Mother |
| No Children | 0 (0.0%) | 0 (0.0%) |
| 1 or 2 Children | 0 (0.0%) | 0 (0.0%) |
| 3 or 4 Children | 0 (0.0%) | 0 (0.0%) |
| 5 or more Children | 0 (0.0%) | 0 (0.0%) |
| Total | 0 (0.0%) | 0 (0.0%) |
Income Below Poverty Among Married-Couple vs Single-Parent Households in Carbonville
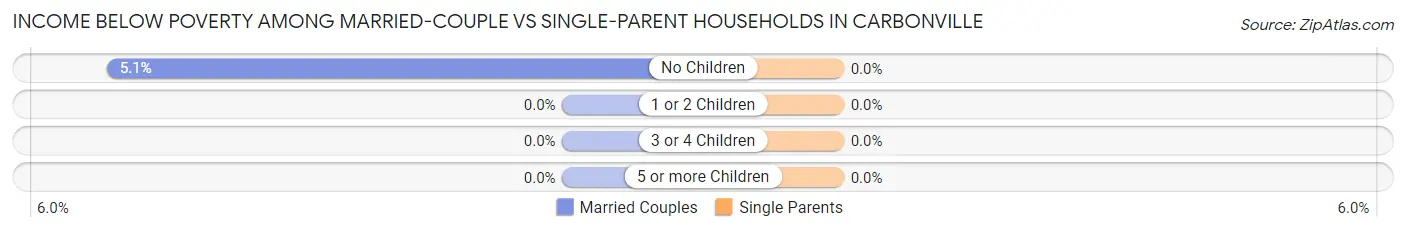
| Children | Married-Couple Families | Single-Parent Households |
| No Children | 9 (5.1%) | 0 (0.0%) |
| 1 or 2 Children | 0 (0.0%) | 0 (0.0%) |
| 3 or 4 Children | 0 (0.0%) | 0 (0.0%) |
| 5 or more Children | 0 (0.0%) | 0 (0.0%) |
| Total | 9 (2.6%) | 0 (0.0%) |
Race in Carbonville
The most populous races in Carbonville are White / Caucasian (1,115 | 81.6%), Two or more Races (191 | 14.0%), and Hispanic or Latino (74 | 5.4%).
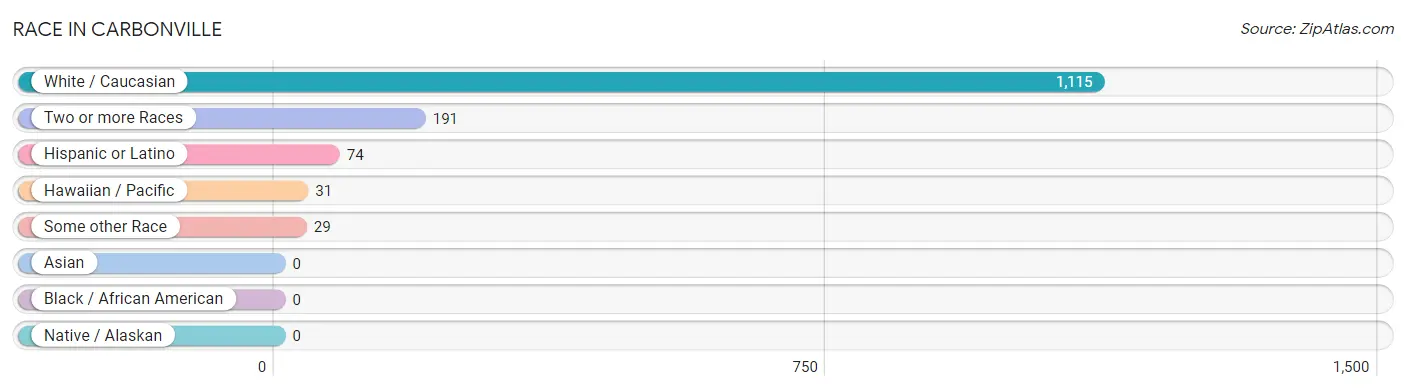
| Race | # Population | % Population |
| Asian | 0 | 0.0% |
| Black / African American | 0 | 0.0% |
| Hawaiian / Pacific | 31 | 2.3% |
| Hispanic or Latino | 74 | 5.4% |
| Native / Alaskan | 0 | 0.0% |
| White / Caucasian | 1,115 | 81.6% |
| Two or more Races | 191 | 14.0% |
| Some other Race | 29 | 2.1% |
| Total | 1,366 | 100.0% |
Ancestry in Carbonville
The most populous ancestries reported in Carbonville are English (318 | 23.3%), Danish (148 | 10.8%), Swedish (83 | 6.1%), Mexican (74 | 5.4%), and German (70 | 5.1%), together accounting for 50.7% of all Carbonville residents.
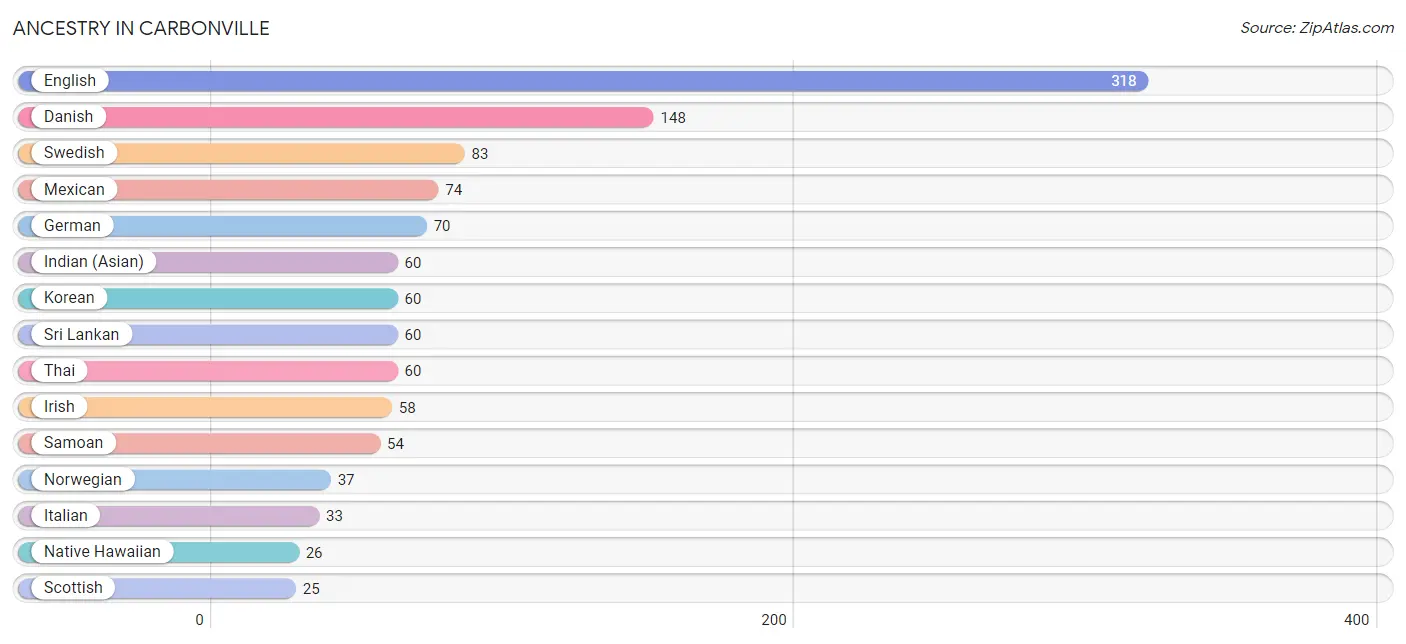
| Ancestry | # Population | % Population |
| American | 14 | 1.0% |
| Austrian | 11 | 0.8% |
| British | 17 | 1.2% |
| Danish | 148 | 10.8% |
| Dutch | 18 | 1.3% |
| English | 318 | 23.3% |
| European | 15 | 1.1% |
| French | 11 | 0.8% |
| German | 70 | 5.1% |
| Greek | 11 | 0.8% |
| Indian (Asian) | 60 | 4.4% |
| Irish | 58 | 4.3% |
| Italian | 33 | 2.4% |
| Korean | 60 | 4.4% |
| Mexican | 74 | 5.4% |
| Native Hawaiian | 26 | 1.9% |
| Norwegian | 37 | 2.7% |
| Samoan | 54 | 4.0% |
| Scandinavian | 5 | 0.4% |
| Scottish | 25 | 1.8% |
| Slovene | 11 | 0.8% |
| Sri Lankan | 60 | 4.4% |
| Swedish | 83 | 6.1% |
| Swiss | 11 | 0.8% |
| Thai | 60 | 4.4% | View All 25 Rows |
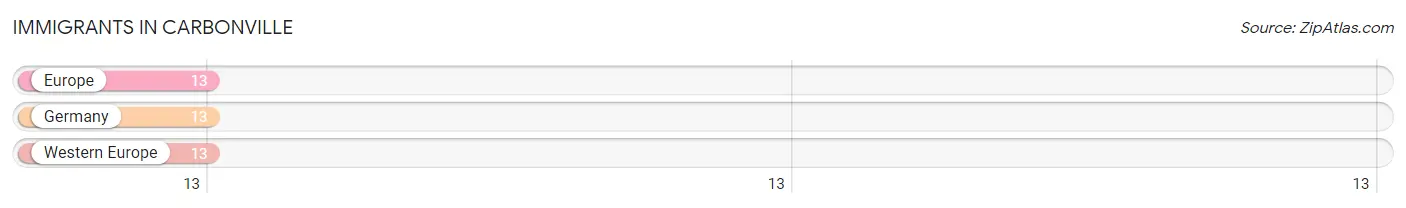
Immigrants in Carbonville
The most numerous immigrant groups reported in Carbonville came from Europe (13 | 0.9%), Germany (13 | 0.9%), and Western Europe (13 | 0.9%), together accounting for 2.8% of all Carbonville residents.
| Immigration Origin | # Population | % Population |
| Europe | 13 | 0.9% |
| Germany | 13 | 0.9% |
| Western Europe | 13 | 0.9% | View All 3 Rows |
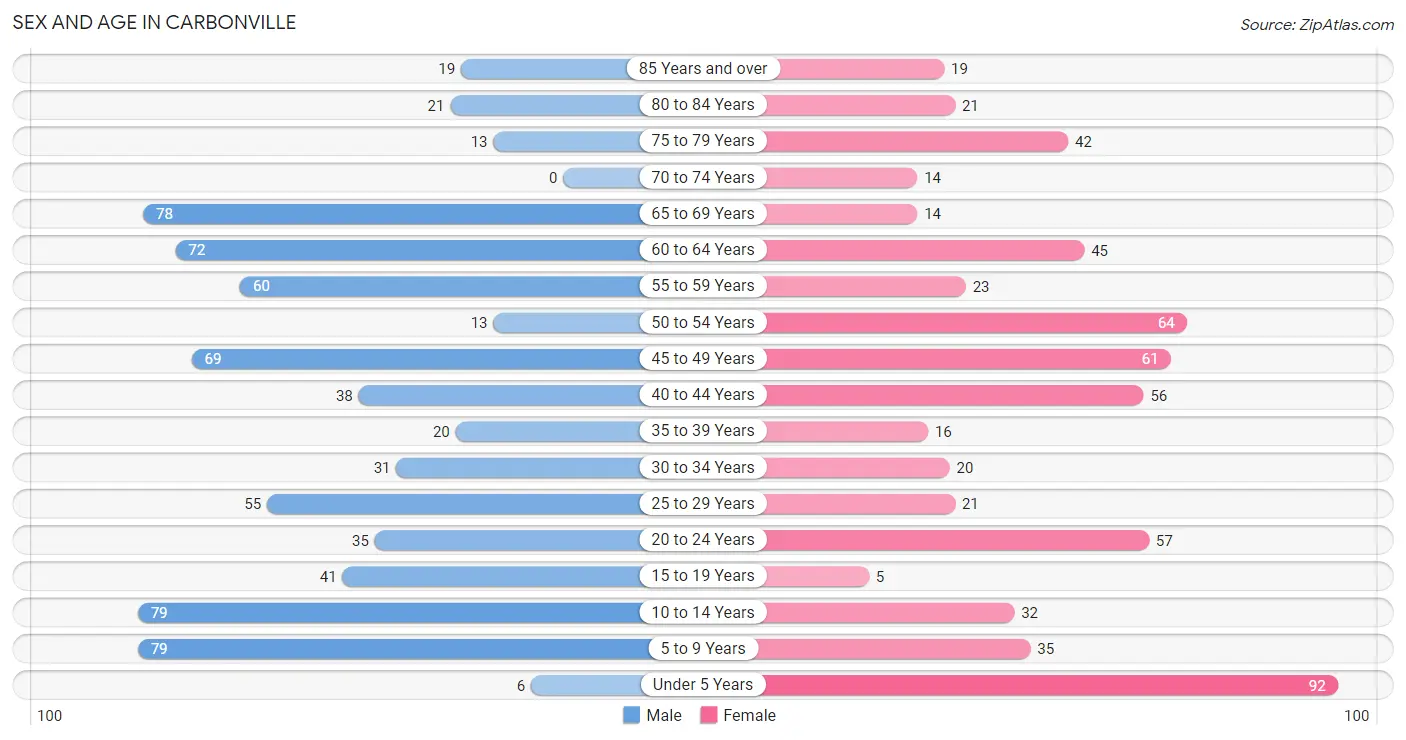
Sex and Age in Carbonville
Sex and Age in Carbonville
The most populous age groups in Carbonville are 5 to 9 Years (79 | 10.8%) for men and Under 5 Years (92 | 14.4%) for women.
| Age Bracket | Male | Female |
| Under 5 Years | 6 (0.8%) | 92 (14.4%) |
| 5 to 9 Years | 79 (10.8%) | 35 (5.5%) |
| 10 to 14 Years | 79 (10.8%) | 32 (5.0%) |
| 15 to 19 Years | 41 (5.6%) | 5 (0.8%) |
| 20 to 24 Years | 35 (4.8%) | 57 (8.9%) |
| 25 to 29 Years | 55 (7.5%) | 21 (3.3%) |
| 30 to 34 Years | 31 (4.3%) | 20 (3.1%) |
| 35 to 39 Years | 20 (2.7%) | 16 (2.5%) |
| 40 to 44 Years | 38 (5.2%) | 56 (8.8%) |
| 45 to 49 Years | 69 (9.5%) | 61 (9.6%) |
| 50 to 54 Years | 13 (1.8%) | 64 (10.1%) |
| 55 to 59 Years | 60 (8.2%) | 23 (3.6%) |
| 60 to 64 Years | 72 (9.9%) | 45 (7.1%) |
| 65 to 69 Years | 78 (10.7%) | 14 (2.2%) |
| 70 to 74 Years | 0 (0.0%) | 14 (2.2%) |
| 75 to 79 Years | 13 (1.8%) | 42 (6.6%) |
| 80 to 84 Years | 21 (2.9%) | 21 (3.3%) |
| 85 Years and over | 19 (2.6%) | 19 (3.0%) |
| Total | 729 (100.0%) | 637 (100.0%) |
Families and Households in Carbonville
Median Family Size in Carbonville
The median family size in Carbonville is 2.89 persons per family, with married-couple families (342 | 89.5%) accounting for the largest median family size of 2.94 persons per family. On the other hand, single female/mother families (16 | 4.2%) represent the smallest median family size with 2.19 persons per family.
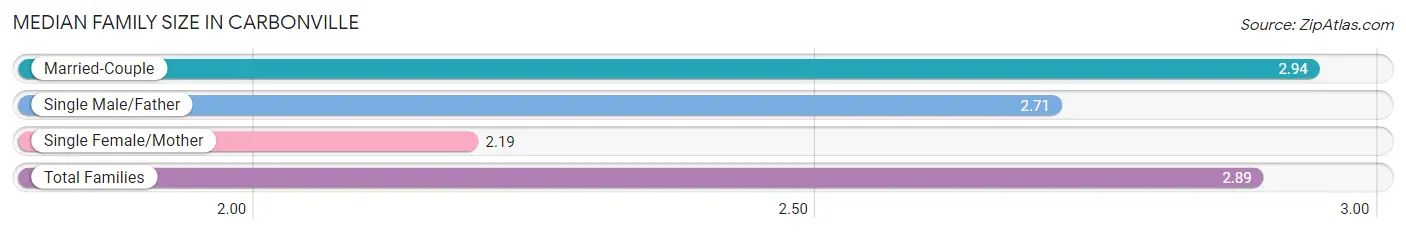
| Family Type | # Families | Family Size |
| Married-Couple | 342 (89.5%) | 2.94 |
| Single Male/Father | 24 (6.3%) | 2.71 |
| Single Female/Mother | 16 (4.2%) | 2.19 |
| Total Families | 382 (100.0%) | 2.89 |
Median Household Size in Carbonville
The median household size in Carbonville is 2.38 persons per household, with single male/father households (24 | 4.2%) accounting for the largest median household size of 3.08 persons per household. non-family households (193 | 33.6%) represent the smallest median household size with 1.12 persons per household.
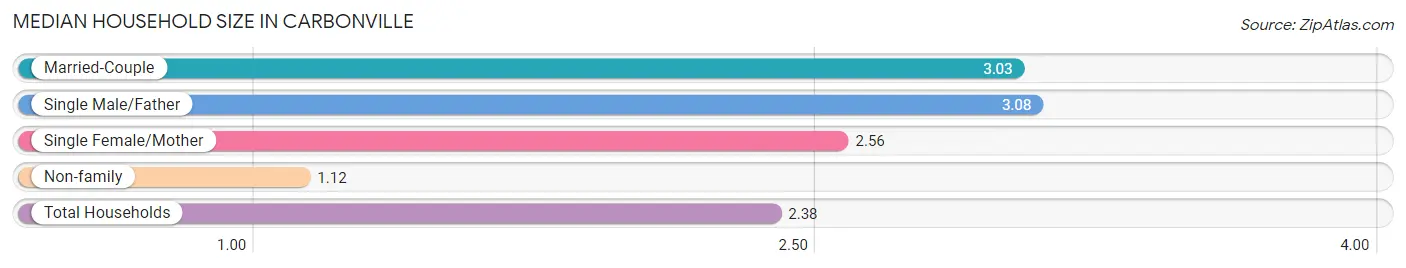
| Household Type | # Households | Household Size |
| Married-Couple | 342 (59.5%) | 3.03 |
| Single Male/Father | 24 (4.2%) | 3.08 |
| Single Female/Mother | 16 (2.8%) | 2.56 |
| Non-family | 193 (33.6%) | 1.12 |
| Total Households | 575 (100.0%) | 2.38 |
Household Size by Marriage Status in Carbonville
Out of a total of 575 households in Carbonville, 382 (66.4%) are family households, while 193 (33.6%) are nonfamily households. The most numerous type of family households are 2-person households, comprising 183, and the most common type of nonfamily households are 1-person households, comprising 169.
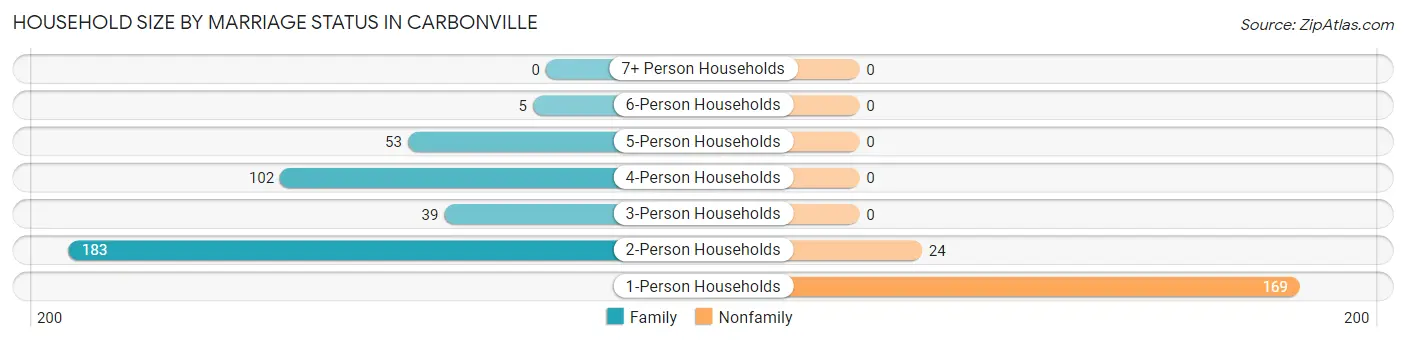
| Household Size | Family Households | Nonfamily Households |
| 1-Person Households | - | 169 (29.4%) |
| 2-Person Households | 183 (31.8%) | 24 (4.2%) |
| 3-Person Households | 39 (6.8%) | 0 (0.0%) |
| 4-Person Households | 102 (17.7%) | 0 (0.0%) |
| 5-Person Households | 53 (9.2%) | 0 (0.0%) |
| 6-Person Households | 5 (0.9%) | 0 (0.0%) |
| 7+ Person Households | 0 (0.0%) | 0 (0.0%) |
| Total | 382 (66.4%) | 193 (33.6%) |
Female Fertility in Carbonville
Fertility by Age in Carbonville
Average fertility rate in Carbonville is 20.0 births per 1,000 women. Women in the age bracket of 35 to 50 years have the highest fertility rate with 33.0 births per 1,000 women. Women in the age bracket of 35 to 50 years acount for 100.0% of all women with births.
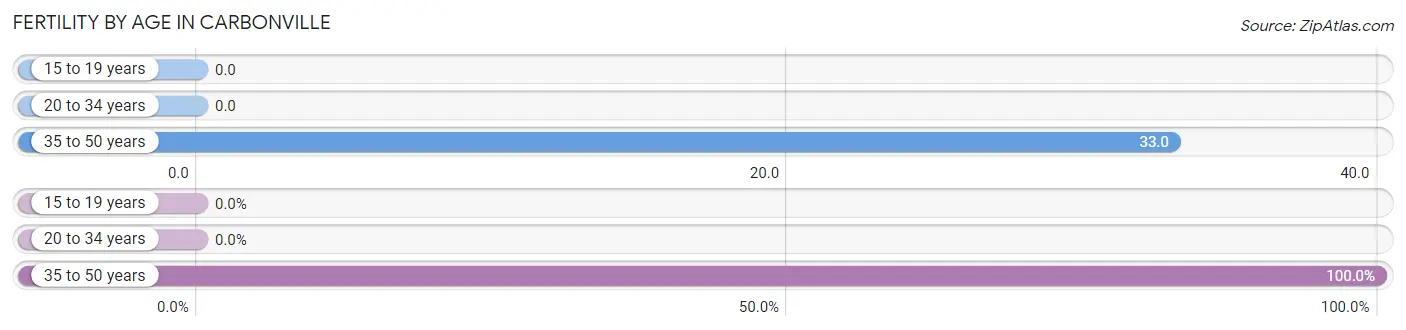
| Age Bracket | Women with Births | Births / 1,000 Women |
| 15 to 19 years | 0 (0.0%) | 0.0 |
| 20 to 34 years | 0 (0.0%) | 0.0 |
| 35 to 50 years | 5 (100.0%) | 33.0 |
| Total | 5 (100.0%) | 20.0 |
Fertility by Age by Marriage Status in Carbonville
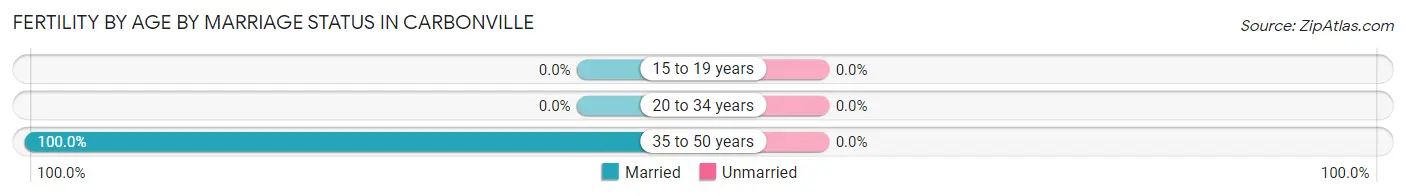
| Age Bracket | Married | Unmarried |
| 15 to 19 years | 0 (0.0%) | 0 (0.0%) |
| 20 to 34 years | 0 (0.0%) | 0 (0.0%) |
| 35 to 50 years | 5 (100.0%) | 0 (0.0%) |
| Total | 5 (100.0%) | 0 (0.0%) |
Fertility by Education in Carbonville
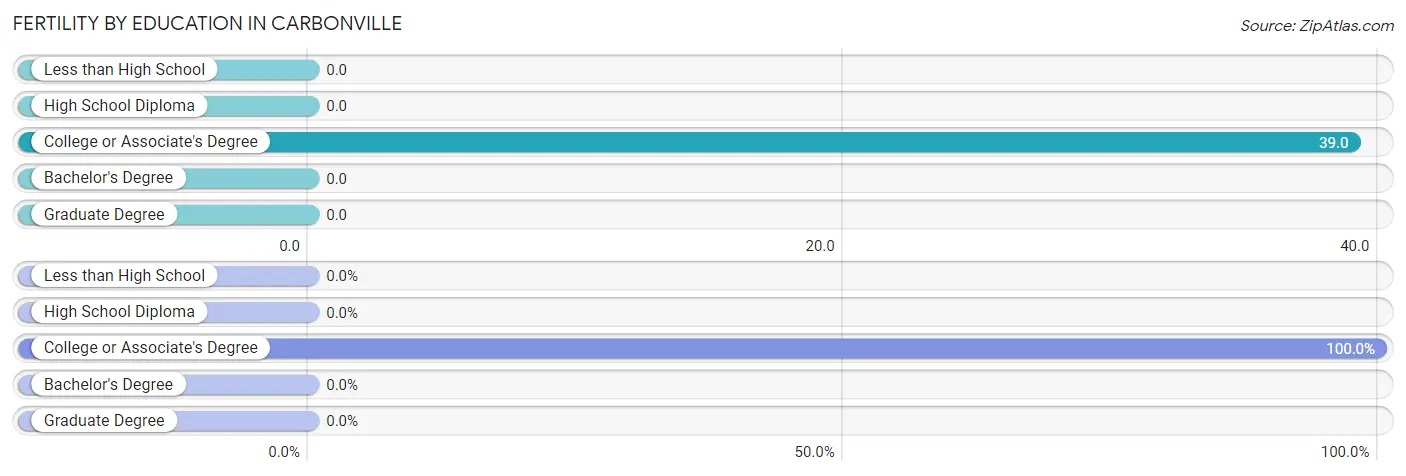
| Educational Attainment | Women with Births | Births / 1,000 Women |
| Less than High School | 0 (0.0%) | 0.0 |
| High School Diploma | 0 (0.0%) | 0.0 |
| College or Associate's Degree | 5 (100.0%) | 39.0 |
| Bachelor's Degree | 0 (0.0%) | 0.0 |
| Graduate Degree | 0 (0.0%) | 0.0 |
| Total | 5 (100.0%) | 20.0 |
Fertility by Education by Marriage Status in Carbonville
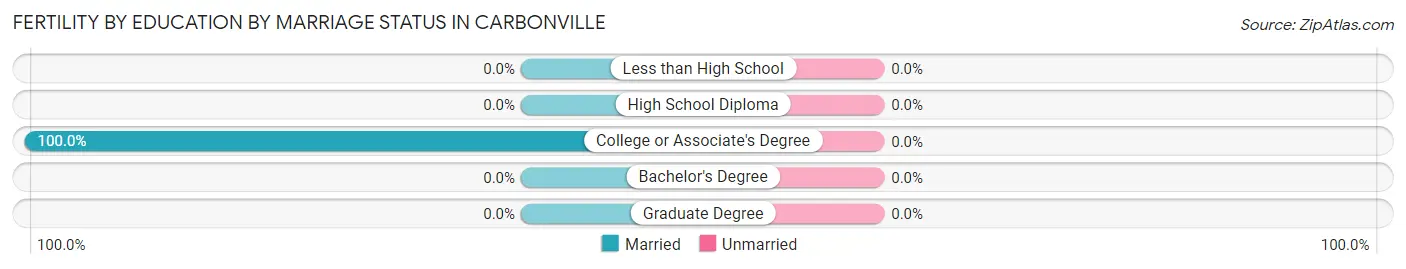
| Educational Attainment | Married | Unmarried |
| Less than High School | 0 (0.0%) | 0 (0.0%) |
| High School Diploma | 0 (0.0%) | 0 (0.0%) |
| College or Associate's Degree | 5 (100.0%) | 0 (0.0%) |
| Bachelor's Degree | 0 (0.0%) | 0 (0.0%) |
| Graduate Degree | 0 (0.0%) | 0 (0.0%) |
| Total | 5 (100.0%) | 0 (0.0%) |
Employment Characteristics in Carbonville
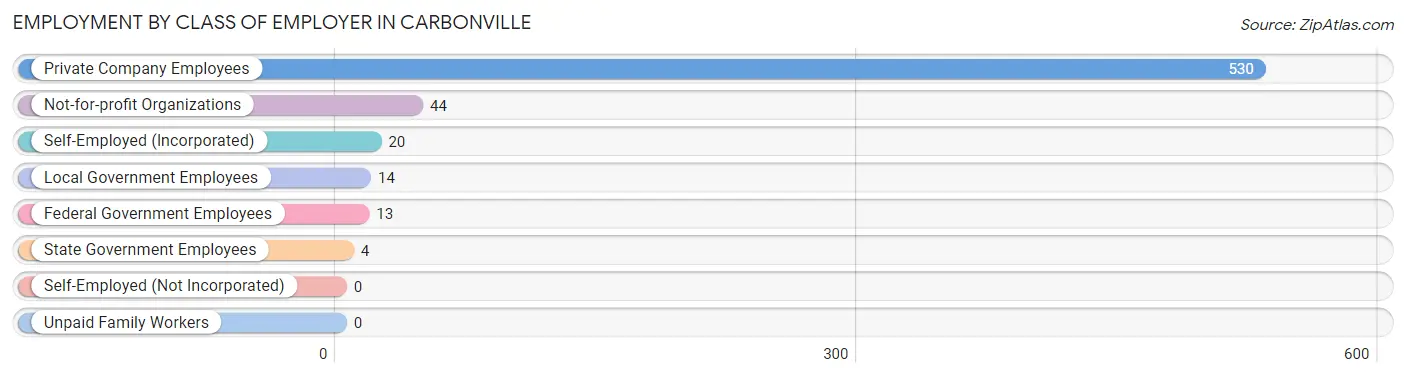
Employment by Class of Employer in Carbonville
Among the 625 employed individuals in Carbonville, private company employees (530 | 84.8%), not-for-profit organizations (44 | 7.0%), and self-employed (incorporated) (20 | 3.2%) make up the most common classes of employment.
| Employer Class | # Employees | % Employees |
| Private Company Employees | 530 | 84.8% |
| Self-Employed (Incorporated) | 20 | 3.2% |
| Self-Employed (Not Incorporated) | 0 | 0.0% |
| Not-for-profit Organizations | 44 | 7.0% |
| Local Government Employees | 14 | 2.2% |
| State Government Employees | 4 | 0.6% |
| Federal Government Employees | 13 | 2.1% |
| Unpaid Family Workers | 0 | 0.0% |
| Total | 625 | 100.0% |
Employment Status by Age in Carbonville
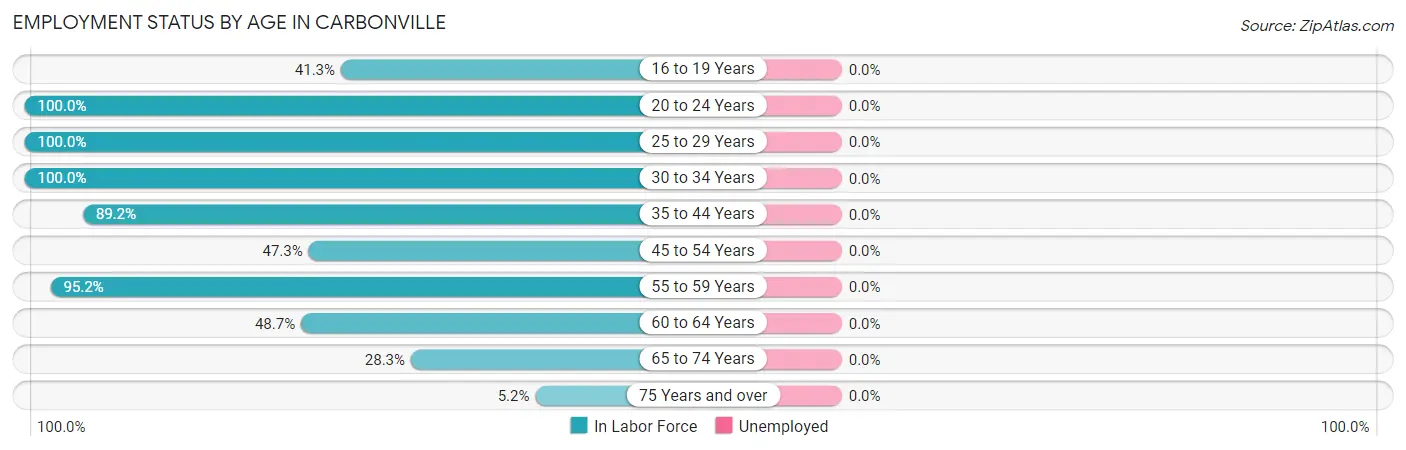
| Age Bracket | In Labor Force | Unemployed |
| 16 to 19 Years | 19 (41.3%) | 0 (0.0%) |
| 20 to 24 Years | 92 (100.0%) | 0 (0.0%) |
| 25 to 29 Years | 76 (100.0%) | 0 (0.0%) |
| 30 to 34 Years | 51 (100.0%) | 0 (0.0%) |
| 35 to 44 Years | 116 (89.2%) | 0 (0.0%) |
| 45 to 54 Years | 98 (47.3%) | 0 (0.0%) |
| 55 to 59 Years | 79 (95.2%) | 0 (0.0%) |
| 60 to 64 Years | 57 (48.7%) | 0 (0.0%) |
| 65 to 74 Years | 30 (28.3%) | 0 (0.0%) |
| 75 Years and over | 7 (5.2%) | 0 (0.0%) |
| Total | 625 (59.9%) | 0 (0.0%) |
Employment Status by Educational Attainment in Carbonville
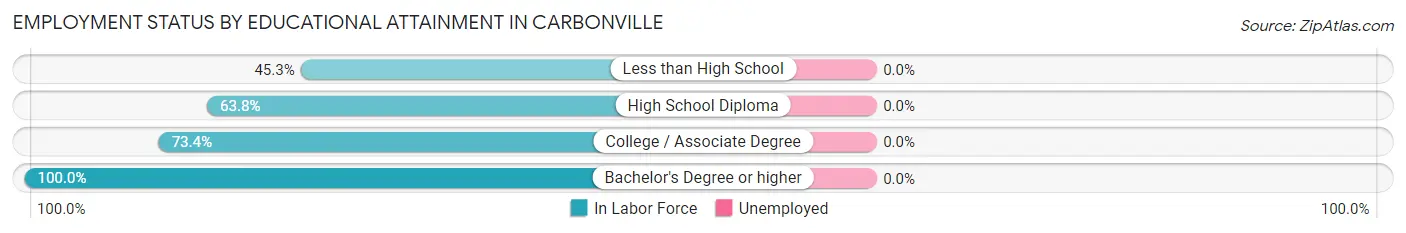
| Educational Attainment | In Labor Force | Unemployed |
| Less than High School | 29 (45.3%) | 0 (0.0%) |
| High School Diploma | 102 (63.8%) | 0 (0.0%) |
| College / Associate Degree | 260 (73.4%) | 0 (0.0%) |
| Bachelor's Degree or higher | 86 (100.0%) | 0 (0.0%) |
| Total | 477 (71.8%) | 0 (0.0%) |
Employment Occupations by Sex in Carbonville
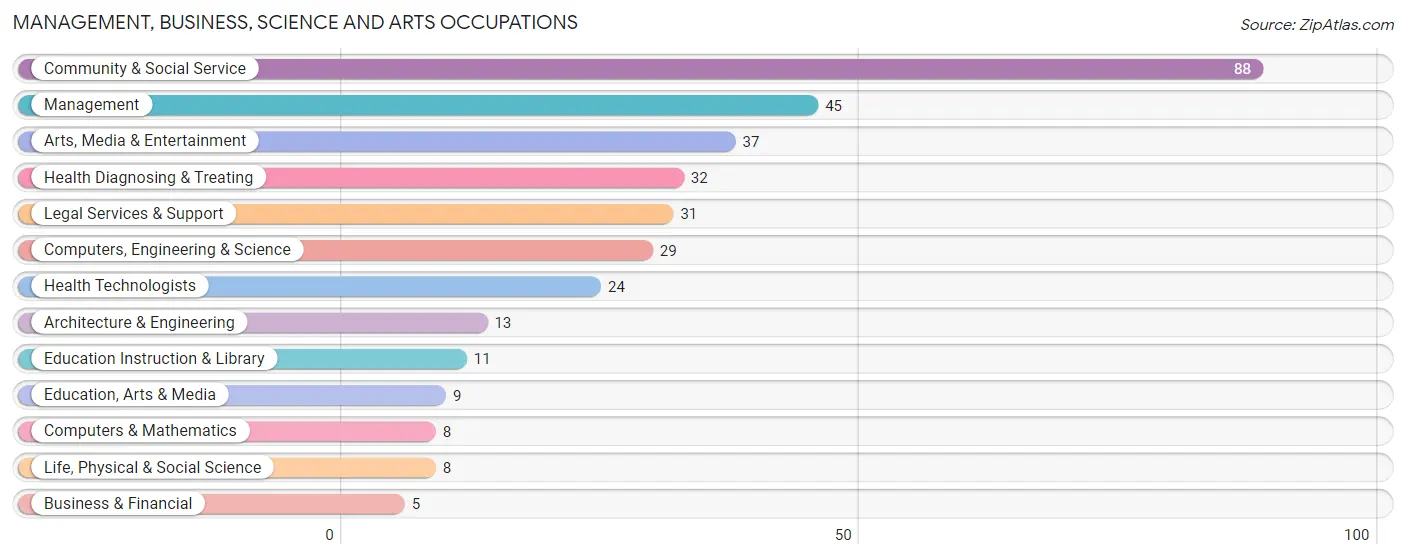
Management, Business, Science and Arts Occupations
The most common Management, Business, Science and Arts occupations in Carbonville are Community & Social Service (88 | 14.1%), Management (45 | 7.2%), Arts, Media & Entertainment (37 | 5.9%), Health Diagnosing & Treating (32 | 5.1%), and Legal Services & Support (31 | 5.0%).
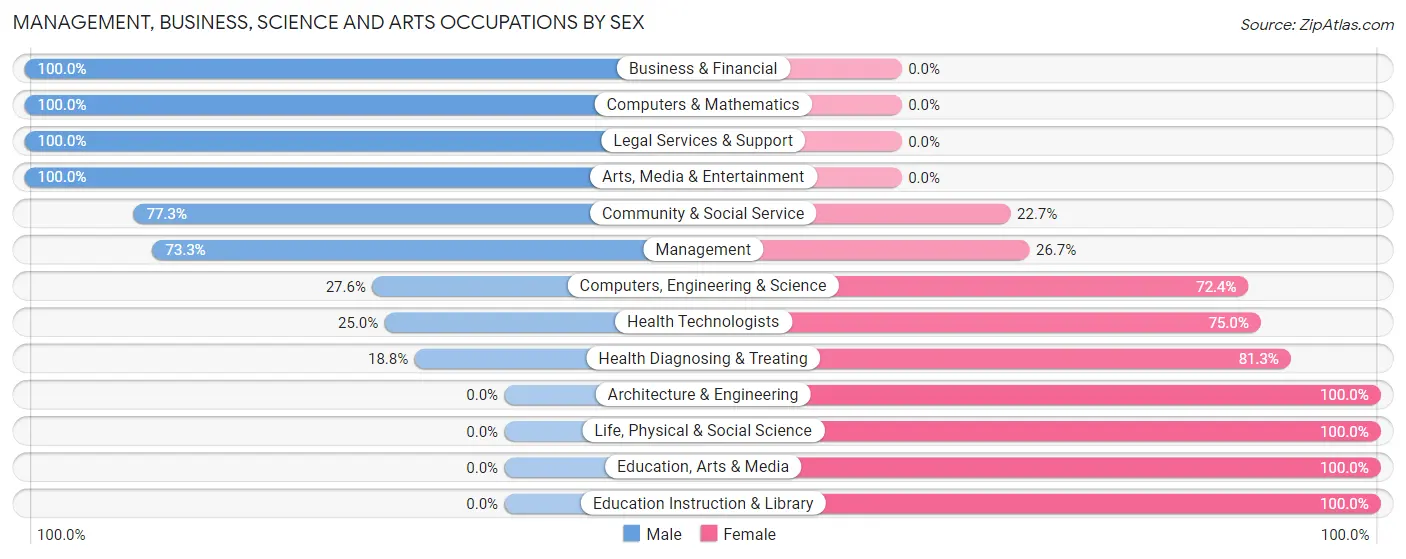
Management, Business, Science and Arts Occupations by Sex
Within the Management, Business, Science and Arts occupations in Carbonville, the most male-oriented occupations are Business & Financial (100.0%), Computers & Mathematics (100.0%), and Legal Services & Support (100.0%), while the most female-oriented occupations are Architecture & Engineering (100.0%), Life, Physical & Social Science (100.0%), and Education, Arts & Media (100.0%).
| Occupation | Male | Female |
| Management | 33 (73.3%) | 12 (26.7%) |
| Business & Financial | 5 (100.0%) | 0 (0.0%) |
| Computers, Engineering & Science | 8 (27.6%) | 21 (72.4%) |
| Computers & Mathematics | 8 (100.0%) | 0 (0.0%) |
| Architecture & Engineering | 0 (0.0%) | 13 (100.0%) |
| Life, Physical & Social Science | 0 (0.0%) | 8 (100.0%) |
| Community & Social Service | 68 (77.3%) | 20 (22.7%) |
| Education, Arts & Media | 0 (0.0%) | 9 (100.0%) |
| Legal Services & Support | 31 (100.0%) | 0 (0.0%) |
| Education Instruction & Library | 0 (0.0%) | 11 (100.0%) |
| Arts, Media & Entertainment | 37 (100.0%) | 0 (0.0%) |
| Health Diagnosing & Treating | 6 (18.8%) | 26 (81.2%) |
| Health Technologists | 6 (25.0%) | 18 (75.0%) |
| Total (Category) | 120 (60.3%) | 79 (39.7%) |
| Total (Overall) | 356 (57.0%) | 269 (43.0%) |
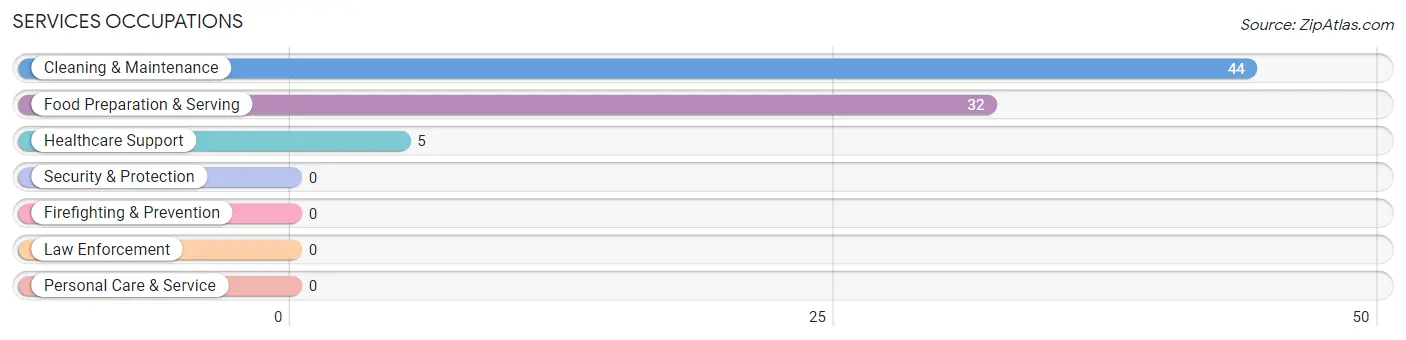
Services Occupations
The most common Services occupations in Carbonville are Cleaning & Maintenance (44 | 7.0%), Food Preparation & Serving (32 | 5.1%), and Healthcare Support (5 | 0.8%).
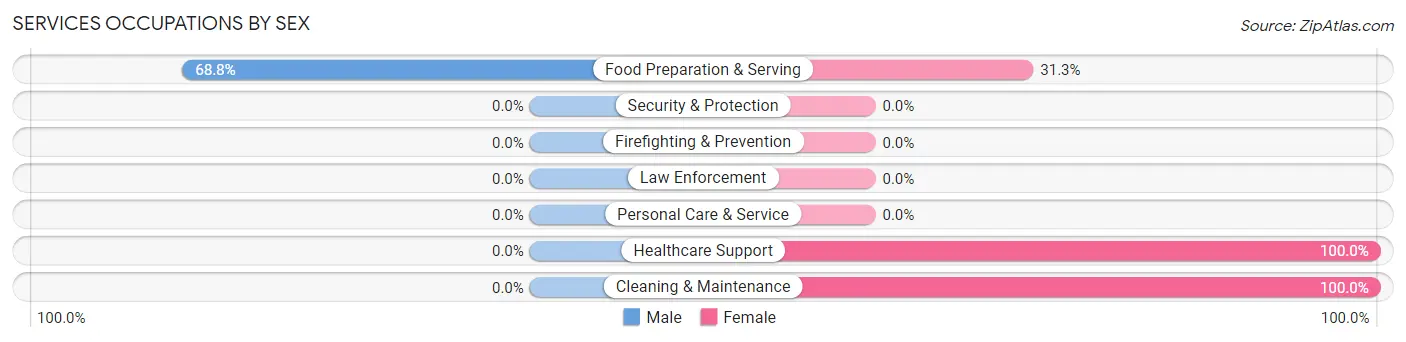
Services Occupations by Sex
| Occupation | Male | Female |
| Healthcare Support | 0 (0.0%) | 5 (100.0%) |
| Security & Protection | 0 (0.0%) | 0 (0.0%) |
| Firefighting & Prevention | 0 (0.0%) | 0 (0.0%) |
| Law Enforcement | 0 (0.0%) | 0 (0.0%) |
| Food Preparation & Serving | 22 (68.8%) | 10 (31.2%) |
| Cleaning & Maintenance | 0 (0.0%) | 44 (100.0%) |
| Personal Care & Service | 0 (0.0%) | 0 (0.0%) |
| Total (Category) | 22 (27.2%) | 59 (72.8%) |
| Total (Overall) | 356 (57.0%) | 269 (43.0%) |
Sales and Office Occupations
The most common Sales and Office occupations in Carbonville are Sales & Related (73 | 11.7%), and Office & Administration (56 | 9.0%).
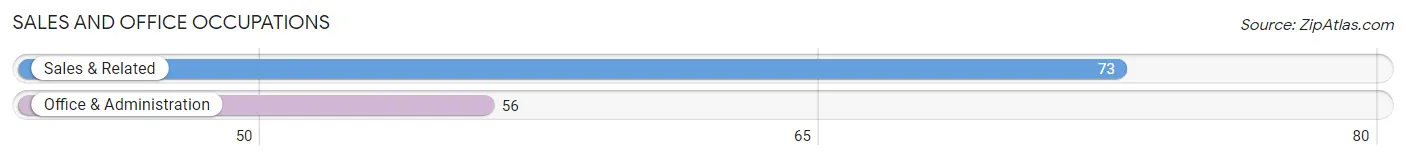
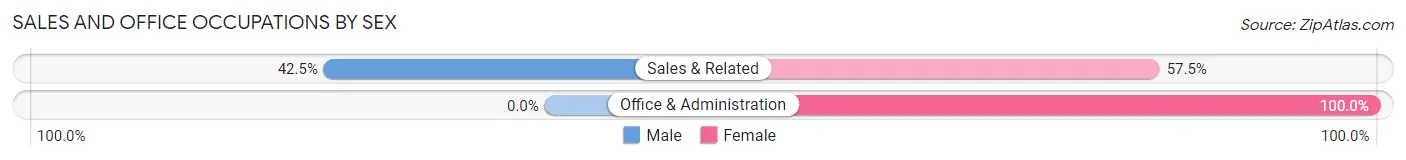
Sales and Office Occupations by Sex
| Occupation | Male | Female |
| Sales & Related | 31 (42.5%) | 42 (57.5%) |
| Office & Administration | 0 (0.0%) | 56 (100.0%) |
| Total (Category) | 31 (24.0%) | 98 (76.0%) |
| Total (Overall) | 356 (57.0%) | 269 (43.0%) |
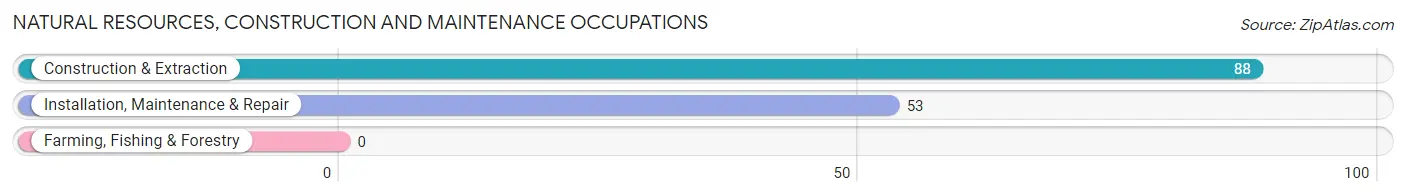
Natural Resources, Construction and Maintenance Occupations
The most common Natural Resources, Construction and Maintenance occupations in Carbonville are Construction & Extraction (88 | 14.1%), and Installation, Maintenance & Repair (53 | 8.5%).
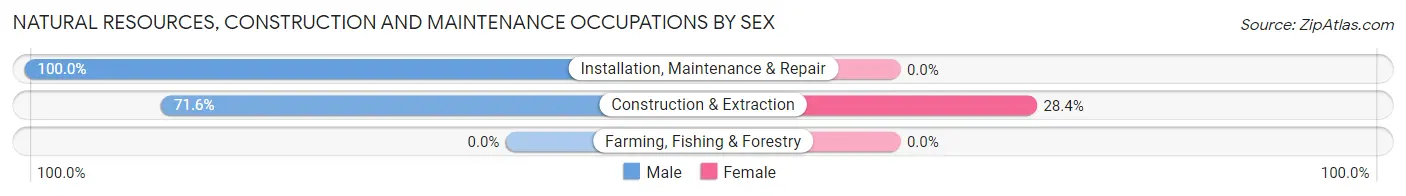
Natural Resources, Construction and Maintenance Occupations by Sex
| Occupation | Male | Female |
| Farming, Fishing & Forestry | 0 (0.0%) | 0 (0.0%) |
| Construction & Extraction | 63 (71.6%) | 25 (28.4%) |
| Installation, Maintenance & Repair | 53 (100.0%) | 0 (0.0%) |
| Total (Category) | 116 (82.3%) | 25 (17.7%) |
| Total (Overall) | 356 (57.0%) | 269 (43.0%) |
Production, Transportation and Moving Occupations
The most common Production, Transportation and Moving occupations in Carbonville are Transportation (61 | 9.8%), and Material Moving (14 | 2.2%).
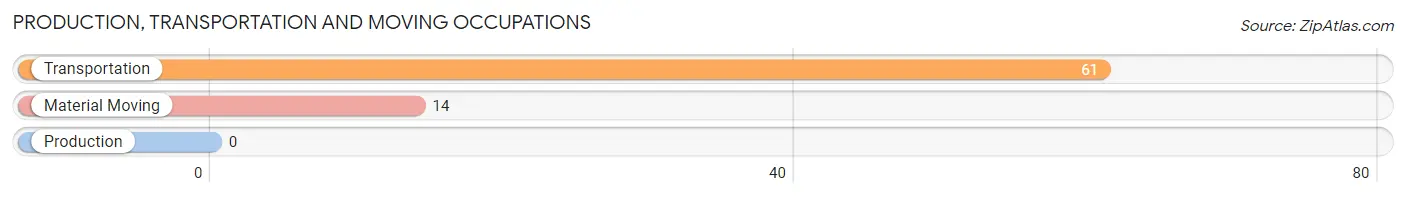
Production, Transportation and Moving Occupations by Sex
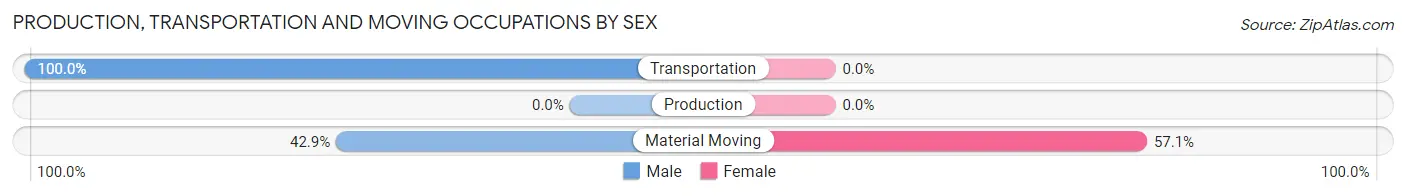
| Occupation | Male | Female |
| Production | 0 (0.0%) | 0 (0.0%) |
| Transportation | 61 (100.0%) | 0 (0.0%) |
| Material Moving | 6 (42.9%) | 8 (57.1%) |
| Total (Category) | 67 (89.3%) | 8 (10.7%) |
| Total (Overall) | 356 (57.0%) | 269 (43.0%) |
Employment Industries by Sex in Carbonville
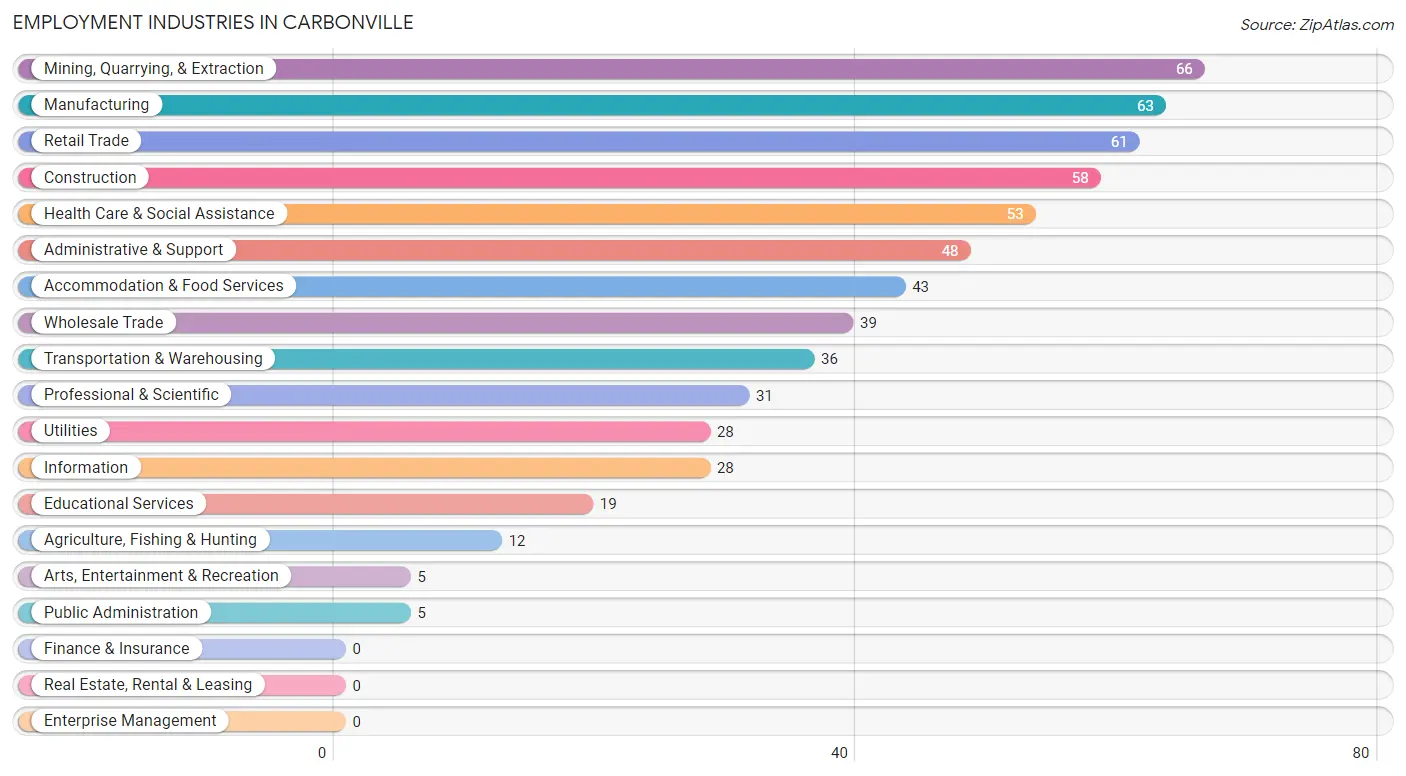
Employment Industries in Carbonville
The major employment industries in Carbonville include Mining, Quarrying, & Extraction (66 | 10.6%), Manufacturing (63 | 10.1%), Retail Trade (61 | 9.8%), Construction (58 | 9.3%), and Health Care & Social Assistance (53 | 8.5%).
Employment Industries by Sex in Carbonville
The Carbonville industries that see more men than women are Agriculture, Fishing & Hunting (100.0%), Information (100.0%), and Professional & Scientific (100.0%), whereas the industries that tend to have a higher number of women are Administrative & Support (100.0%), Health Care & Social Assistance (88.7%), and Educational Services (84.2%).
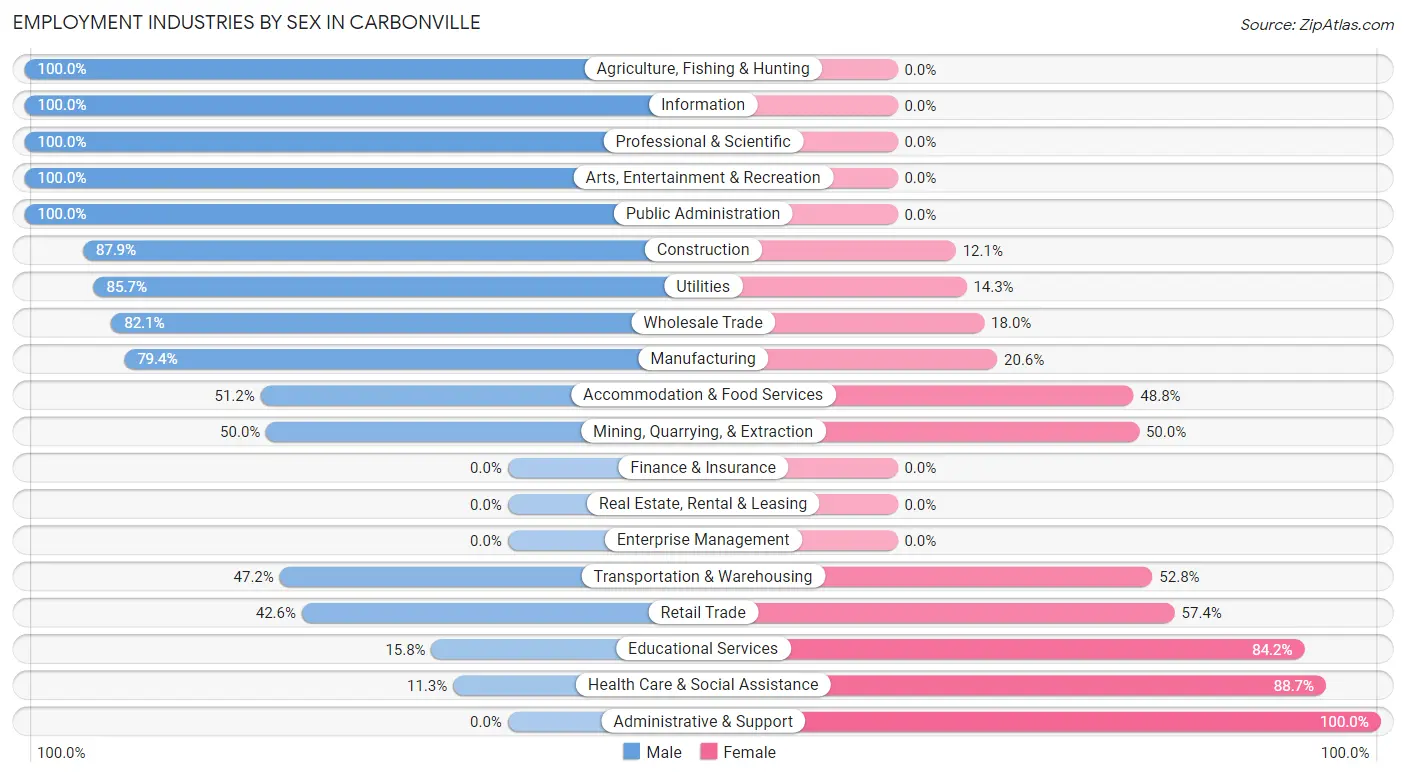
| Industry | Male | Female |
| Agriculture, Fishing & Hunting | 12 (100.0%) | 0 (0.0%) |
| Mining, Quarrying, & Extraction | 33 (50.0%) | 33 (50.0%) |
| Construction | 51 (87.9%) | 7 (12.1%) |
| Manufacturing | 50 (79.4%) | 13 (20.6%) |
| Wholesale Trade | 32 (82.1%) | 7 (17.9%) |
| Retail Trade | 26 (42.6%) | 35 (57.4%) |
| Transportation & Warehousing | 17 (47.2%) | 19 (52.8%) |
| Utilities | 24 (85.7%) | 4 (14.3%) |
| Information | 28 (100.0%) | 0 (0.0%) |
| Finance & Insurance | 0 (0.0%) | 0 (0.0%) |
| Real Estate, Rental & Leasing | 0 (0.0%) | 0 (0.0%) |
| Professional & Scientific | 31 (100.0%) | 0 (0.0%) |
| Enterprise Management | 0 (0.0%) | 0 (0.0%) |
| Administrative & Support | 0 (0.0%) | 48 (100.0%) |
| Educational Services | 3 (15.8%) | 16 (84.2%) |
| Health Care & Social Assistance | 6 (11.3%) | 47 (88.7%) |
| Arts, Entertainment & Recreation | 5 (100.0%) | 0 (0.0%) |
| Accommodation & Food Services | 22 (51.2%) | 21 (48.8%) |
| Public Administration | 5 (100.0%) | 0 (0.0%) |
| Total | 356 (57.0%) | 269 (43.0%) |
Education in Carbonville
School Enrollment in Carbonville
The most common levels of schooling among the 242 students in Carbonville are middle school (93 | 38.4%), elementary school (71 | 29.3%), and high school (31 | 12.8%).
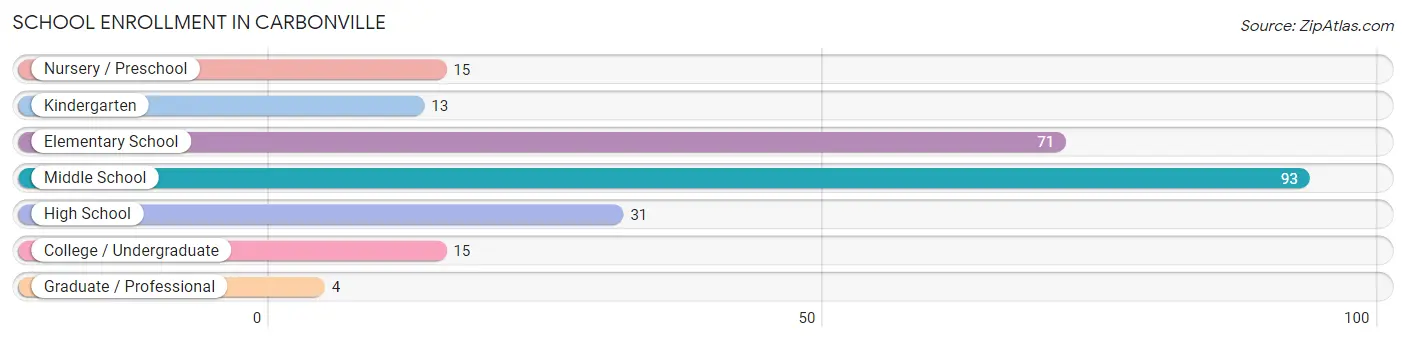
| School Level | # Students | % Students |
| Nursery / Preschool | 15 | 6.2% |
| Kindergarten | 13 | 5.4% |
| Elementary School | 71 | 29.3% |
| Middle School | 93 | 38.4% |
| High School | 31 | 12.8% |
| College / Undergraduate | 15 | 6.2% |
| Graduate / Professional | 4 | 1.7% |
| Total | 242 | 100.0% |
School Enrollment by Age by Funding Source in Carbonville
Out of a total of 242 students who are enrolled in schools in Carbonville, 19 (7.9%) attend a private institution, while the remaining 223 (92.1%) are enrolled in public schools. The age group of 35 years and over has the highest likelihood of being enrolled in private schools, with 6 (31.6% in the age bracket) enrolled. Conversely, the age group of 3 to 4 year olds has the lowest likelihood of being enrolled in a private school, with 15 (100.0% in the age bracket) attending a public institution.
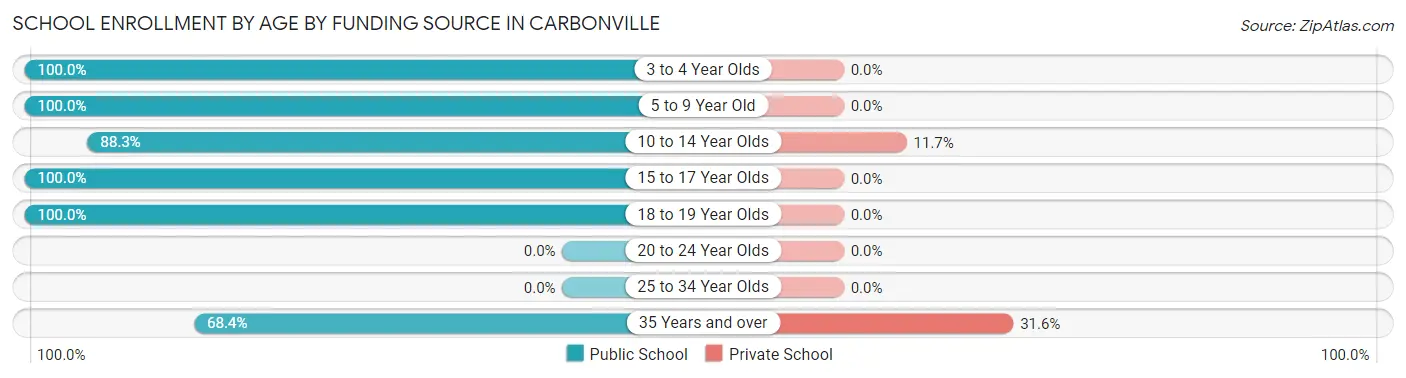
| Age Bracket | Public School | Private School |
| 3 to 4 Year Olds | 15 (100.0%) | 0 (0.0%) |
| 5 to 9 Year Old | 66 (100.0%) | 0 (0.0%) |
| 10 to 14 Year Olds | 98 (88.3%) | 13 (11.7%) |
| 15 to 17 Year Olds | 27 (100.0%) | 0 (0.0%) |
| 18 to 19 Year Olds | 4 (100.0%) | 0 (0.0%) |
| 20 to 24 Year Olds | 0 (0.0%) | 0 (0.0%) |
| 25 to 34 Year Olds | 0 (0.0%) | 0 (0.0%) |
| 35 Years and over | 13 (68.4%) | 6 (31.6%) |
| Total | 223 (92.1%) | 19 (7.9%) |
Educational Attainment by Field of Study in Carbonville
Literature & languages (31 | 27.9%), physical & health sciences (25 | 22.5%), science & technology (18 | 16.2%), arts & humanities (15 | 13.5%), and education (11 | 9.9%) are the most common fields of study among 111 individuals in Carbonville who have obtained a bachelor's degree or higher.
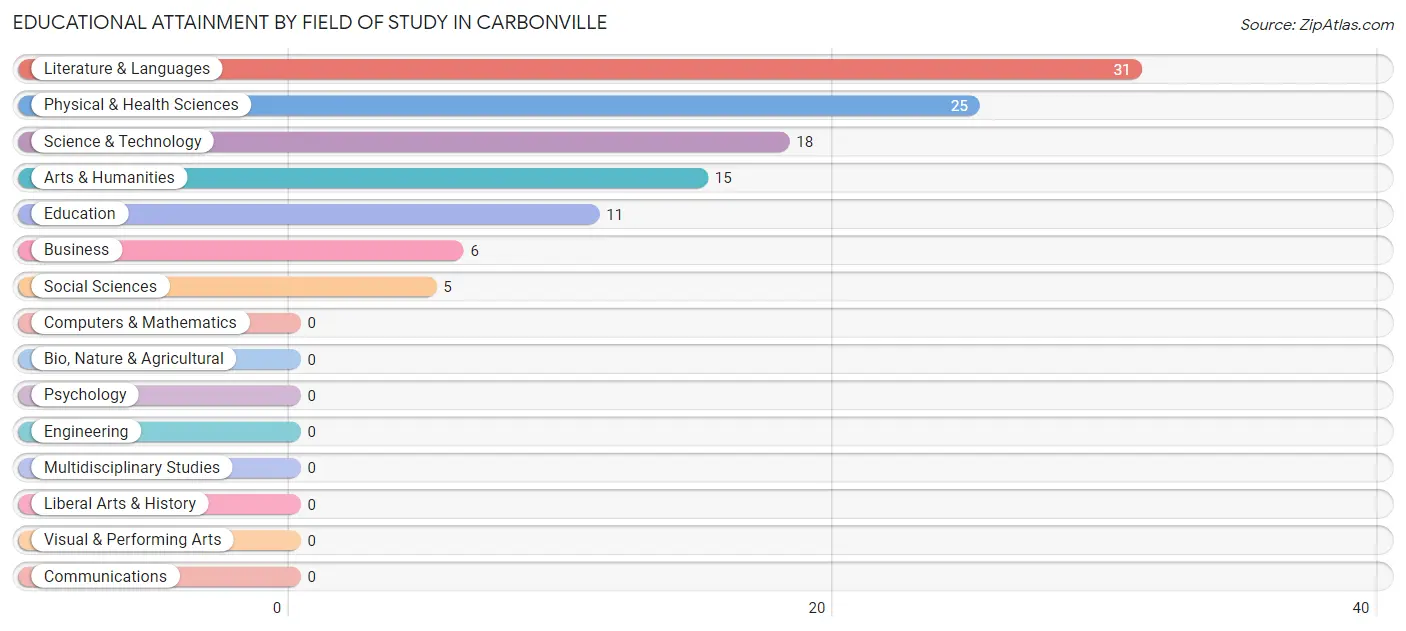
| Field of Study | # Graduates | % Graduates |
| Computers & Mathematics | 0 | 0.0% |
| Bio, Nature & Agricultural | 0 | 0.0% |
| Physical & Health Sciences | 25 | 22.5% |
| Psychology | 0 | 0.0% |
| Social Sciences | 5 | 4.5% |
| Engineering | 0 | 0.0% |
| Multidisciplinary Studies | 0 | 0.0% |
| Science & Technology | 18 | 16.2% |
| Business | 6 | 5.4% |
| Education | 11 | 9.9% |
| Literature & Languages | 31 | 27.9% |
| Liberal Arts & History | 0 | 0.0% |
| Visual & Performing Arts | 0 | 0.0% |
| Communications | 0 | 0.0% |
| Arts & Humanities | 15 | 13.5% |
| Total | 111 | 100.0% |
Transportation & Commute in Carbonville
Vehicle Availability by Sex in Carbonville
The most prevalent vehicle ownership categories in Carbonville are males with 2 vehicles (120, accounting for 33.7%) and females with 2 vehicles (85, making up 44.6%).
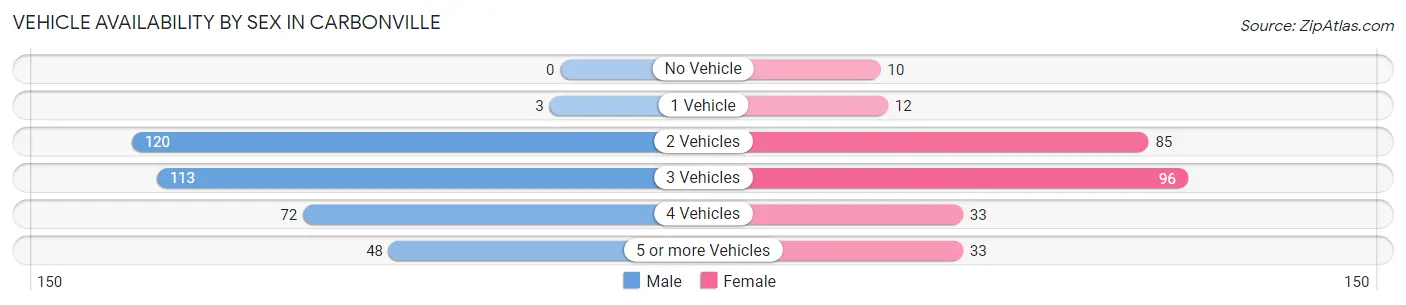
| Vehicles Available | Male | Female |
| No Vehicle | 0 (0.0%) | 10 (3.7%) |
| 1 Vehicle | 3 (0.8%) | 12 (4.5%) |
| 2 Vehicles | 120 (33.7%) | 85 (31.6%) |
| 3 Vehicles | 113 (31.7%) | 96 (35.7%) |
| 4 Vehicles | 72 (20.2%) | 33 (12.3%) |
| 5 or more Vehicles | 48 (13.5%) | 33 (12.3%) |
| Total | 356 (100.0%) | 269 (100.0%) |
Commute Time in Carbonville
The most frequently occuring commute durations in Carbonville are 5 to 9 minutes (192 commuters, 31.0%), 10 to 14 minutes (188 commuters, 30.4%), and 15 to 19 minutes (90 commuters, 14.5%).
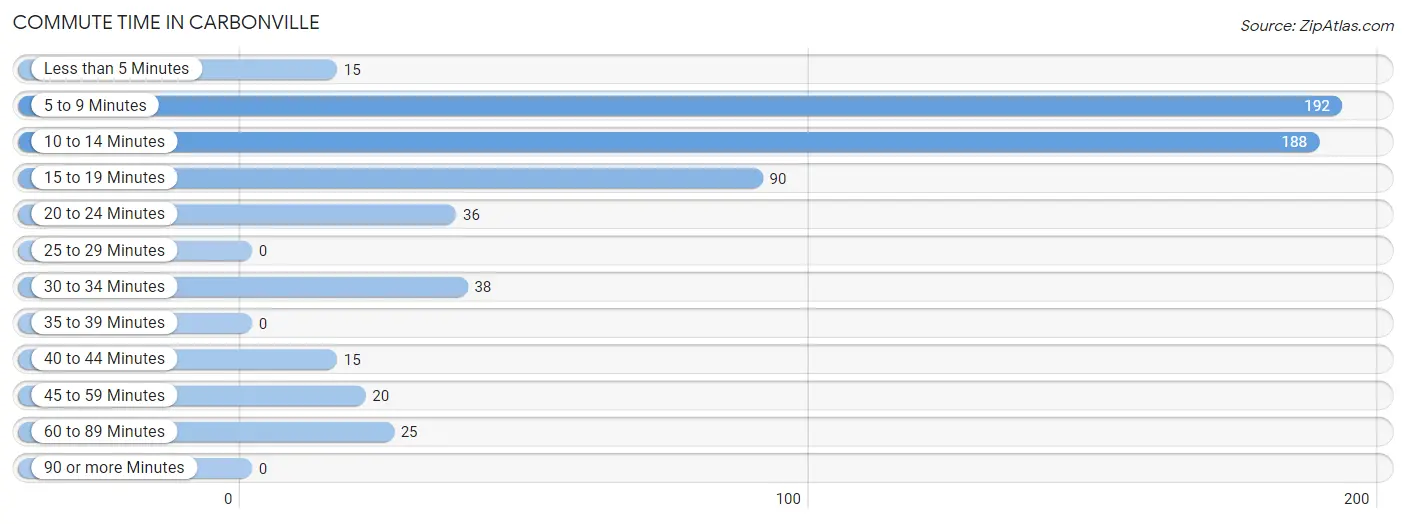
| Commute Time | # Commuters | % Commuters |
| Less than 5 Minutes | 15 | 2.4% |
| 5 to 9 Minutes | 192 | 31.0% |
| 10 to 14 Minutes | 188 | 30.4% |
| 15 to 19 Minutes | 90 | 14.5% |
| 20 to 24 Minutes | 36 | 5.8% |
| 25 to 29 Minutes | 0 | 0.0% |
| 30 to 34 Minutes | 38 | 6.1% |
| 35 to 39 Minutes | 0 | 0.0% |
| 40 to 44 Minutes | 15 | 2.4% |
| 45 to 59 Minutes | 20 | 3.2% |
| 60 to 89 Minutes | 25 | 4.0% |
| 90 or more Minutes | 0 | 0.0% |
Commute Time by Sex in Carbonville
The most common commute times in Carbonville are 5 to 9 minutes (125 commuters, 35.7%) for males and 10 to 14 minutes (97 commuters, 36.1%) for females.
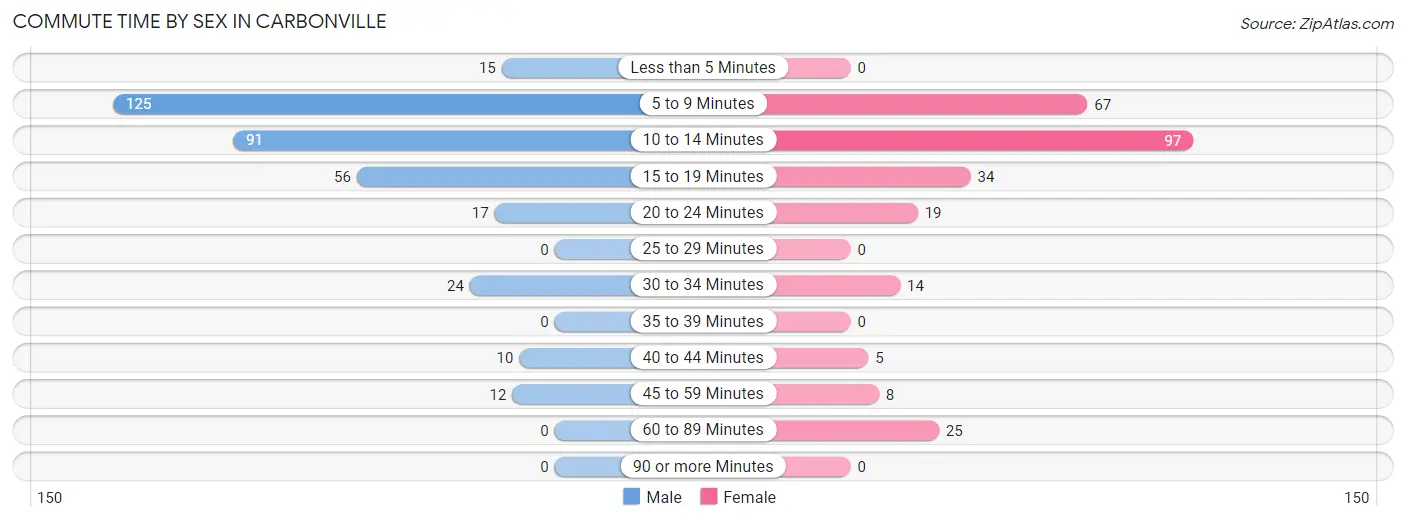
| Commute Time | Male | Female |
| Less than 5 Minutes | 15 (4.3%) | 0 (0.0%) |
| 5 to 9 Minutes | 125 (35.7%) | 67 (24.9%) |
| 10 to 14 Minutes | 91 (26.0%) | 97 (36.1%) |
| 15 to 19 Minutes | 56 (16.0%) | 34 (12.6%) |
| 20 to 24 Minutes | 17 (4.9%) | 19 (7.1%) |
| 25 to 29 Minutes | 0 (0.0%) | 0 (0.0%) |
| 30 to 34 Minutes | 24 (6.9%) | 14 (5.2%) |
| 35 to 39 Minutes | 0 (0.0%) | 0 (0.0%) |
| 40 to 44 Minutes | 10 (2.9%) | 5 (1.9%) |
| 45 to 59 Minutes | 12 (3.4%) | 8 (3.0%) |
| 60 to 89 Minutes | 0 (0.0%) | 25 (9.3%) |
| 90 or more Minutes | 0 (0.0%) | 0 (0.0%) |
Time of Departure to Work by Sex in Carbonville
The most frequent times of departure to work in Carbonville are 8:00 AM to 8:29 AM (116, 33.1%) for males and 4:00 PM to 11:59 PM (87, 32.3%) for females.
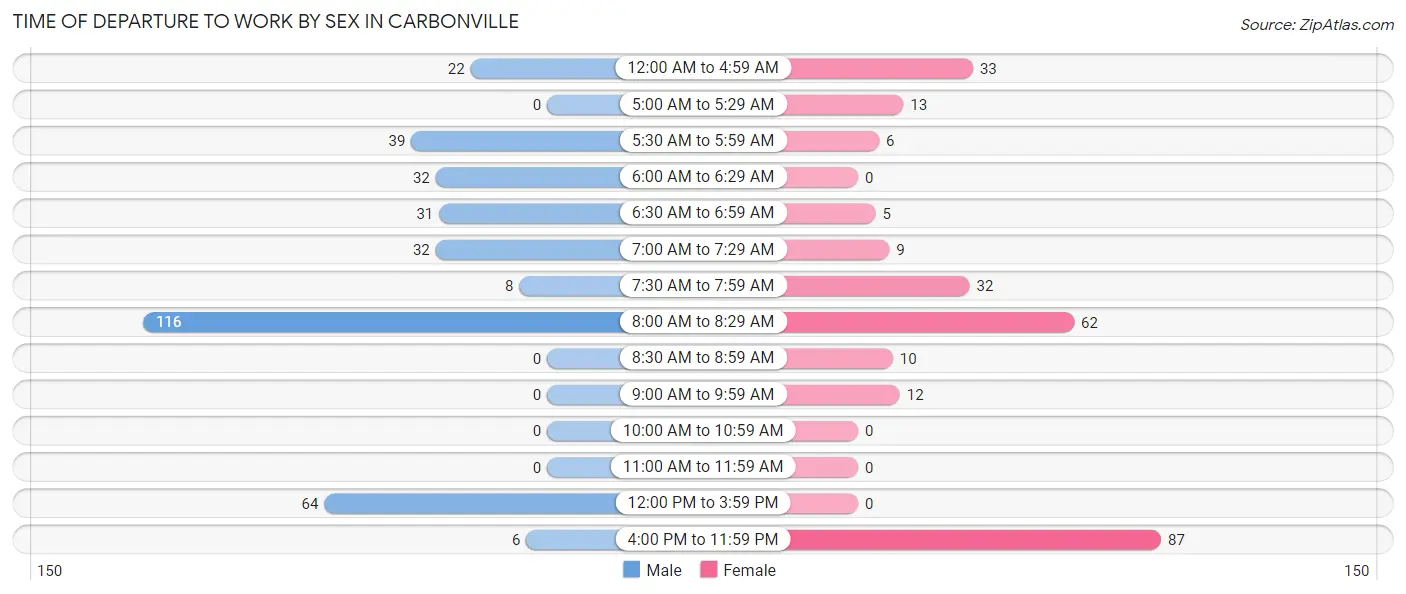
| Time of Departure | Male | Female |
| 12:00 AM to 4:59 AM | 22 (6.3%) | 33 (12.3%) |
| 5:00 AM to 5:29 AM | 0 (0.0%) | 13 (4.8%) |
| 5:30 AM to 5:59 AM | 39 (11.1%) | 6 (2.2%) |
| 6:00 AM to 6:29 AM | 32 (9.1%) | 0 (0.0%) |
| 6:30 AM to 6:59 AM | 31 (8.9%) | 5 (1.9%) |
| 7:00 AM to 7:29 AM | 32 (9.1%) | 9 (3.4%) |
| 7:30 AM to 7:59 AM | 8 (2.3%) | 32 (11.9%) |
| 8:00 AM to 8:29 AM | 116 (33.1%) | 62 (23.1%) |
| 8:30 AM to 8:59 AM | 0 (0.0%) | 10 (3.7%) |
| 9:00 AM to 9:59 AM | 0 (0.0%) | 12 (4.5%) |
| 10:00 AM to 10:59 AM | 0 (0.0%) | 0 (0.0%) |
| 11:00 AM to 11:59 AM | 0 (0.0%) | 0 (0.0%) |
| 12:00 PM to 3:59 PM | 64 (18.3%) | 0 (0.0%) |
| 4:00 PM to 11:59 PM | 6 (1.7%) | 87 (32.3%) |
| Total | 350 (100.0%) | 269 (100.0%) |
Housing Occupancy in Carbonville
Occupancy by Ownership in Carbonville
Of the total 575 dwellings in Carbonville, owner-occupied units account for 364 (63.3%), while renter-occupied units make up 211 (36.7%).
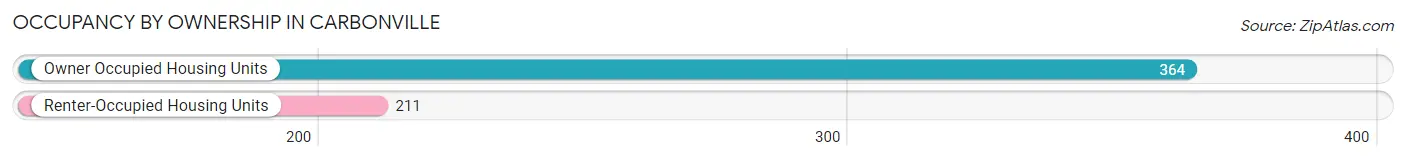
| Occupancy | # Housing Units | % Housing Units |
| Owner Occupied Housing Units | 364 | 63.3% |
| Renter-Occupied Housing Units | 211 | 36.7% |
| Total Occupied Housing Units | 575 | 100.0% |
Occupancy by Household Size in Carbonville
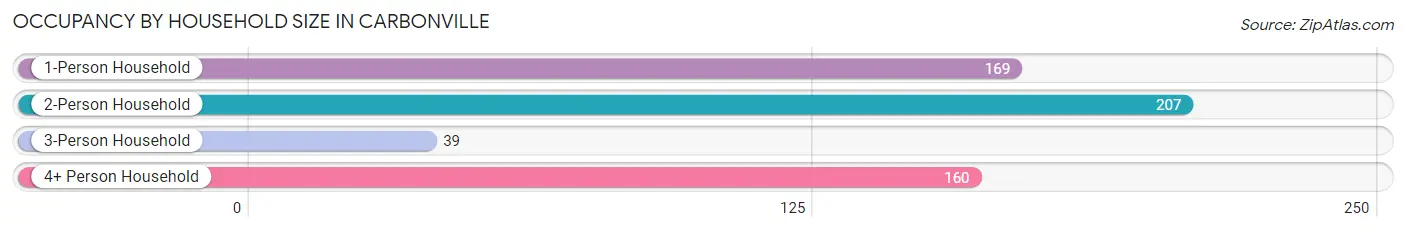
| Household Size | # Housing Units | % Housing Units |
| 1-Person Household | 169 | 29.4% |
| 2-Person Household | 207 | 36.0% |
| 3-Person Household | 39 | 6.8% |
| 4+ Person Household | 160 | 27.8% |
| Total Housing Units | 575 | 100.0% |
Occupancy by Ownership by Household Size in Carbonville
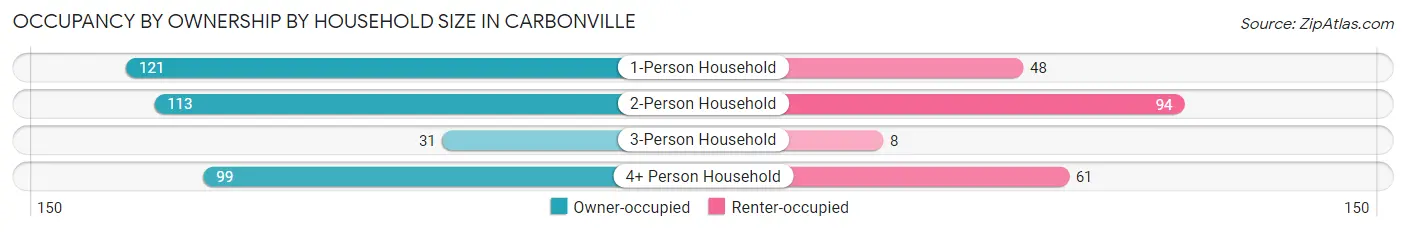
| Household Size | Owner-occupied | Renter-occupied |
| 1-Person Household | 121 (71.6%) | 48 (28.4%) |
| 2-Person Household | 113 (54.6%) | 94 (45.4%) |
| 3-Person Household | 31 (79.5%) | 8 (20.5%) |
| 4+ Person Household | 99 (61.9%) | 61 (38.1%) |
| Total Housing Units | 364 (63.3%) | 211 (36.7%) |
Occupancy by Educational Attainment in Carbonville
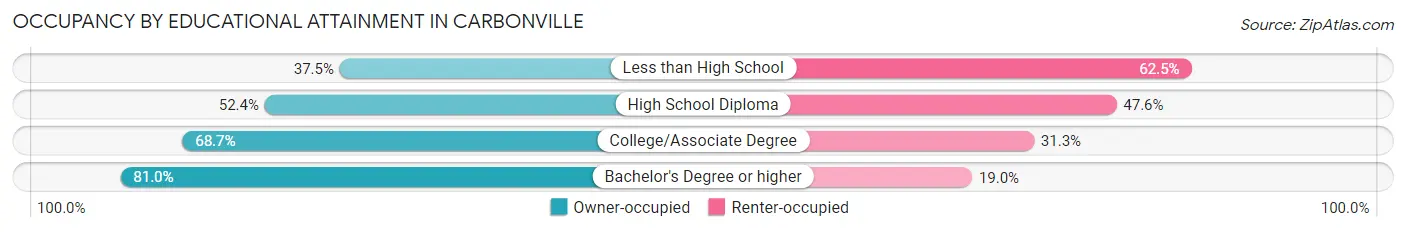
| Household Size | Owner-occupied | Renter-occupied |
| Less than High School | 12 (37.5%) | 20 (62.5%) |
| High School Diploma | 99 (52.4%) | 90 (47.6%) |
| College/Associate Degree | 189 (68.7%) | 86 (31.3%) |
| Bachelor's Degree or higher | 64 (81.0%) | 15 (19.0%) |
Occupancy by Age of Householder in Carbonville
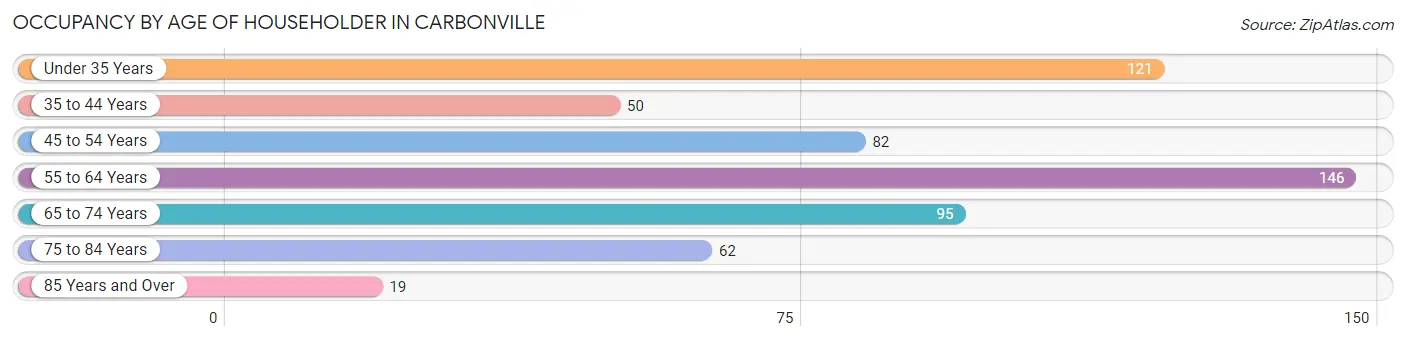
| Age Bracket | # Households | % Households |
| Under 35 Years | 121 | 21.0% |
| 35 to 44 Years | 50 | 8.7% |
| 45 to 54 Years | 82 | 14.3% |
| 55 to 64 Years | 146 | 25.4% |
| 65 to 74 Years | 95 | 16.5% |
| 75 to 84 Years | 62 | 10.8% |
| 85 Years and Over | 19 | 3.3% |
| Total | 575 | 100.0% |
Housing Finances in Carbonville
Median Income by Occupancy in Carbonville
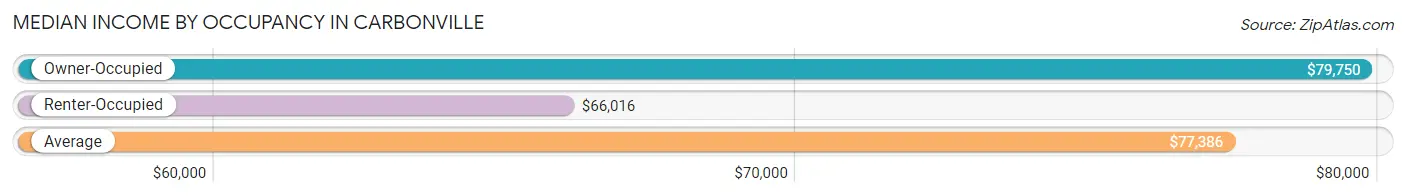
| Occupancy Type | # Households | Median Income |
| Owner-Occupied | 364 (63.3%) | $79,750 |
| Renter-Occupied | 211 (36.7%) | $66,016 |
| Average | 575 (100.0%) | $77,386 |
Occupancy by Householder Income Bracket in Carbonville
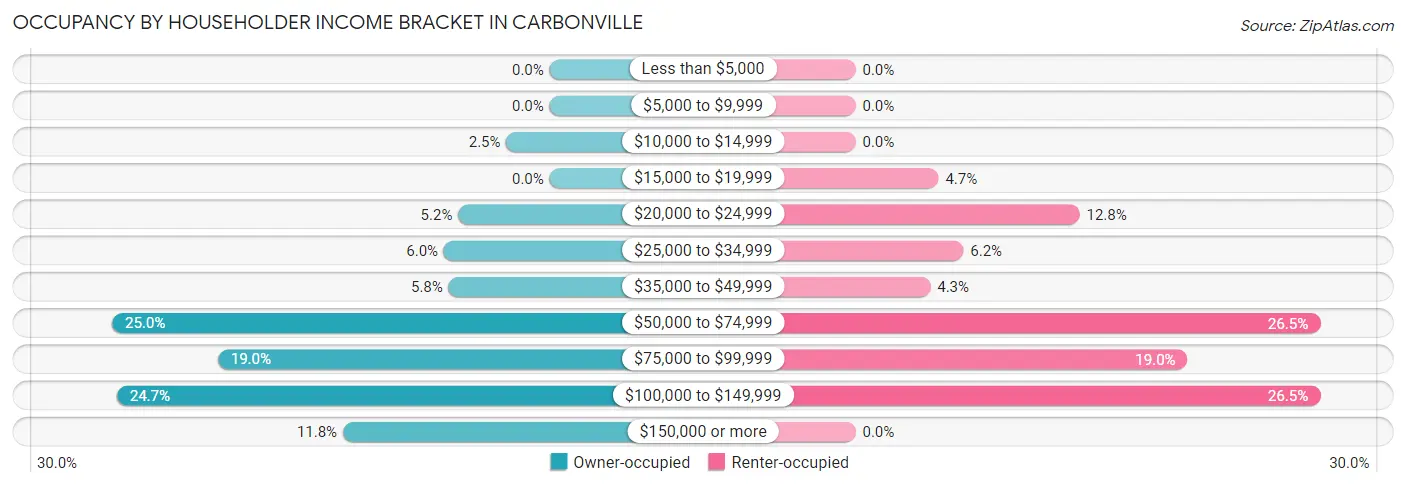
| Income Bracket | Owner-occupied | Renter-occupied |
| Less than $5,000 | 0 (0.0%) | 0 (0.0%) |
| $5,000 to $9,999 | 0 (0.0%) | 0 (0.0%) |
| $10,000 to $14,999 | 9 (2.5%) | 0 (0.0%) |
| $15,000 to $19,999 | 0 (0.0%) | 10 (4.7%) |
| $20,000 to $24,999 | 19 (5.2%) | 27 (12.8%) |
| $25,000 to $34,999 | 22 (6.0%) | 13 (6.2%) |
| $35,000 to $49,999 | 21 (5.8%) | 9 (4.3%) |
| $50,000 to $74,999 | 91 (25.0%) | 56 (26.5%) |
| $75,000 to $99,999 | 69 (19.0%) | 40 (19.0%) |
| $100,000 to $149,999 | 90 (24.7%) | 56 (26.5%) |
| $150,000 or more | 43 (11.8%) | 0 (0.0%) |
| Total | 364 (100.0%) | 211 (100.0%) |
Monthly Housing Cost Tiers in Carbonville
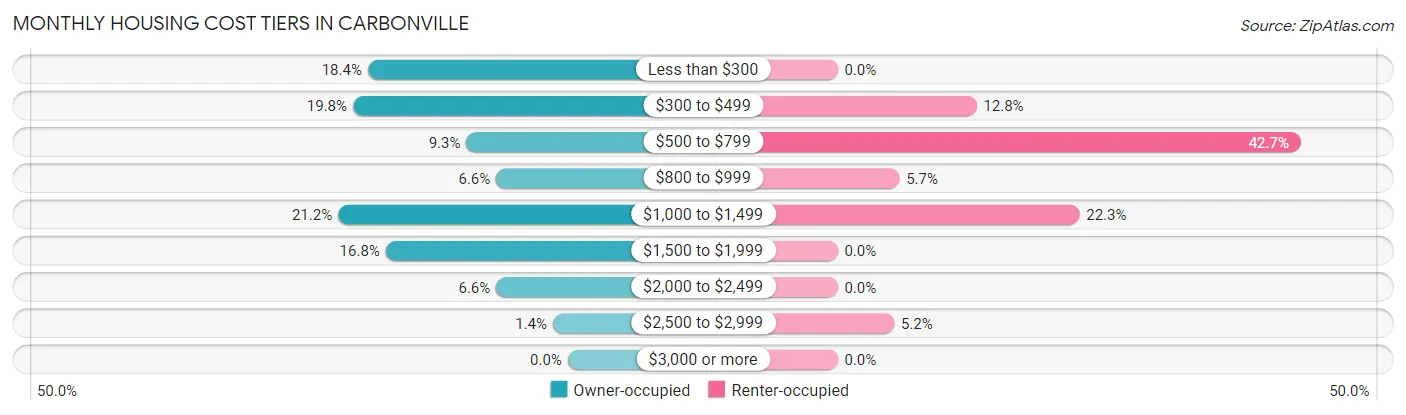
| Monthly Cost | Owner-occupied | Renter-occupied |
| Less than $300 | 67 (18.4%) | 0 (0.0%) |
| $300 to $499 | 72 (19.8%) | 27 (12.8%) |
| $500 to $799 | 34 (9.3%) | 90 (42.6%) |
| $800 to $999 | 24 (6.6%) | 12 (5.7%) |
| $1,000 to $1,499 | 77 (21.1%) | 47 (22.3%) |
| $1,500 to $1,999 | 61 (16.8%) | 0 (0.0%) |
| $2,000 to $2,499 | 24 (6.6%) | 0 (0.0%) |
| $2,500 to $2,999 | 5 (1.4%) | 11 (5.2%) |
| $3,000 or more | 0 (0.0%) | 0 (0.0%) |
| Total | 364 (100.0%) | 211 (100.0%) |
Physical Housing Characteristics in Carbonville
Housing Structures in Carbonville
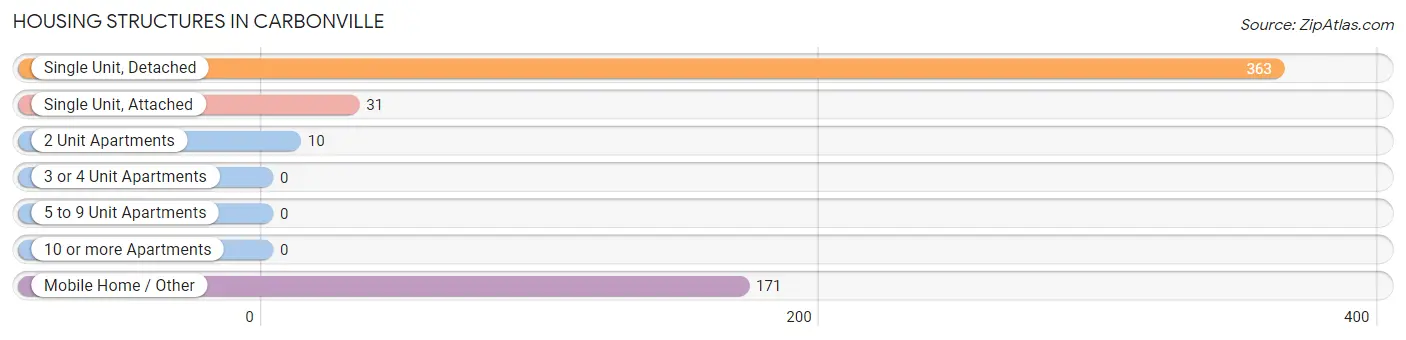
| Structure Type | # Housing Units | % Housing Units |
| Single Unit, Detached | 363 | 63.1% |
| Single Unit, Attached | 31 | 5.4% |
| 2 Unit Apartments | 10 | 1.7% |
| 3 or 4 Unit Apartments | 0 | 0.0% |
| 5 to 9 Unit Apartments | 0 | 0.0% |
| 10 or more Apartments | 0 | 0.0% |
| Mobile Home / Other | 171 | 29.7% |
| Total | 575 | 100.0% |
Housing Structures by Occupancy in Carbonville
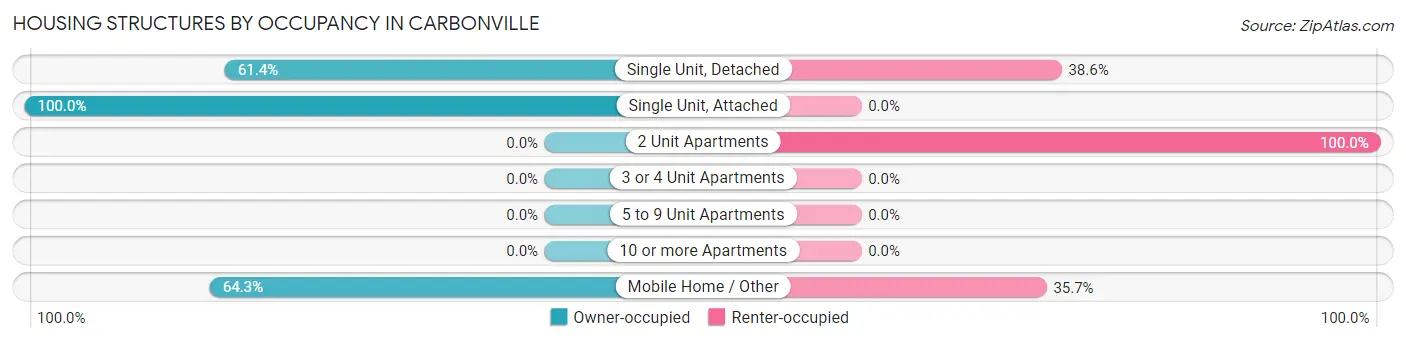
| Structure Type | Owner-occupied | Renter-occupied |
| Single Unit, Detached | 223 (61.4%) | 140 (38.6%) |
| Single Unit, Attached | 31 (100.0%) | 0 (0.0%) |
| 2 Unit Apartments | 0 (0.0%) | 10 (100.0%) |
| 3 or 4 Unit Apartments | 0 (0.0%) | 0 (0.0%) |
| 5 to 9 Unit Apartments | 0 (0.0%) | 0 (0.0%) |
| 10 or more Apartments | 0 (0.0%) | 0 (0.0%) |
| Mobile Home / Other | 110 (64.3%) | 61 (35.7%) |
| Total | 364 (63.3%) | 211 (36.7%) |
Housing Structures by Number of Rooms in Carbonville
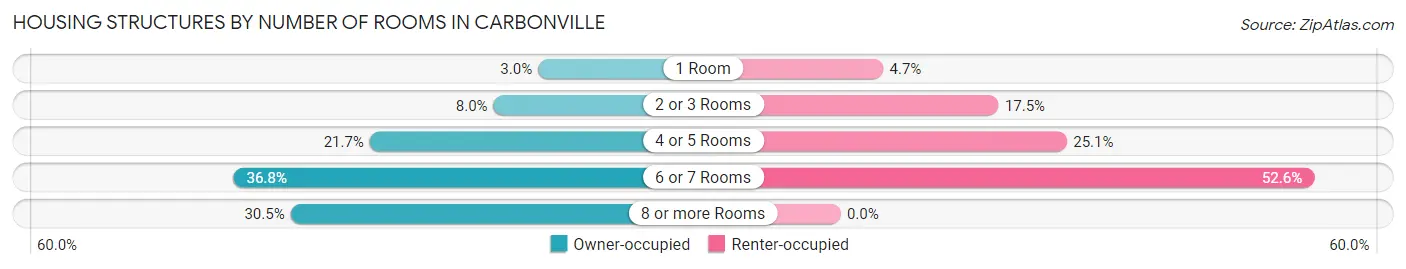
| Number of Rooms | Owner-occupied | Renter-occupied |
| 1 Room | 11 (3.0%) | 10 (4.7%) |
| 2 or 3 Rooms | 29 (8.0%) | 37 (17.5%) |
| 4 or 5 Rooms | 79 (21.7%) | 53 (25.1%) |
| 6 or 7 Rooms | 134 (36.8%) | 111 (52.6%) |
| 8 or more Rooms | 111 (30.5%) | 0 (0.0%) |
| Total | 364 (100.0%) | 211 (100.0%) |
Housing Structure by Heating Type in Carbonville
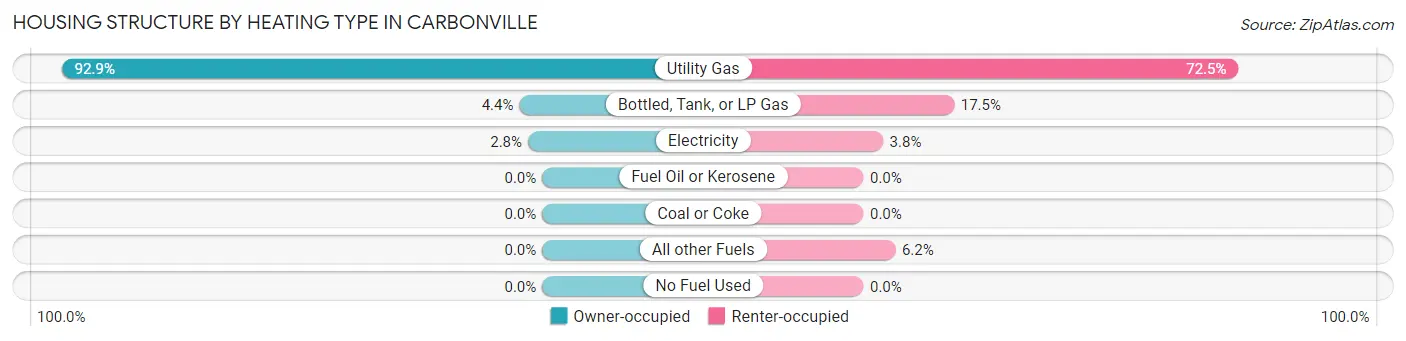
| Heating Type | Owner-occupied | Renter-occupied |
| Utility Gas | 338 (92.9%) | 153 (72.5%) |
| Bottled, Tank, or LP Gas | 16 (4.4%) | 37 (17.5%) |
| Electricity | 10 (2.8%) | 8 (3.8%) |
| Fuel Oil or Kerosene | 0 (0.0%) | 0 (0.0%) |
| Coal or Coke | 0 (0.0%) | 0 (0.0%) |
| All other Fuels | 0 (0.0%) | 13 (6.2%) |
| No Fuel Used | 0 (0.0%) | 0 (0.0%) |
| Total | 364 (100.0%) | 211 (100.0%) |
Household Vehicle Usage in Carbonville
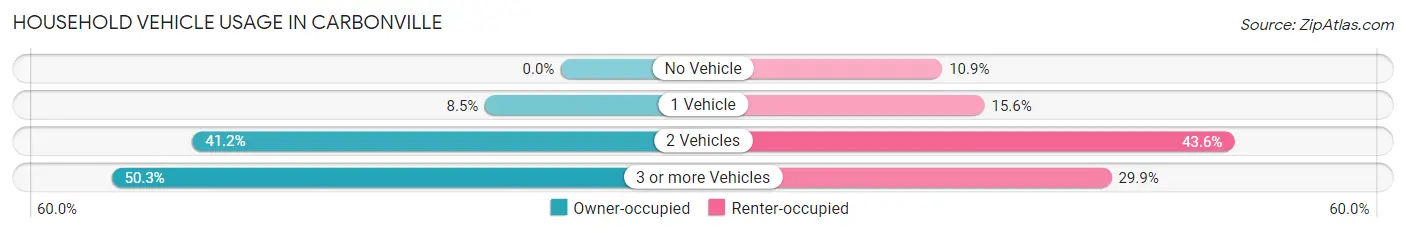
| Vehicles per Household | Owner-occupied | Renter-occupied |
| No Vehicle | 0 (0.0%) | 23 (10.9%) |
| 1 Vehicle | 31 (8.5%) | 33 (15.6%) |
| 2 Vehicles | 150 (41.2%) | 92 (43.6%) |
| 3 or more Vehicles | 183 (50.3%) | 63 (29.9%) |
| Total | 364 (100.0%) | 211 (100.0%) |
Real Estate & Mortgages in Carbonville
Real Estate and Mortgage Overview in Carbonville
| Characteristic | Without Mortgage | With Mortgage |
| Housing Units | 174 | 190 |
| Median Property Value | $180,600 | $202,300 |
| Median Household Income | $53,750 | $22 |
| Monthly Housing Costs | $375 | $0 |
| Real Estate Taxes | $1,091 | $0 |
Property Value by Mortgage Status in Carbonville
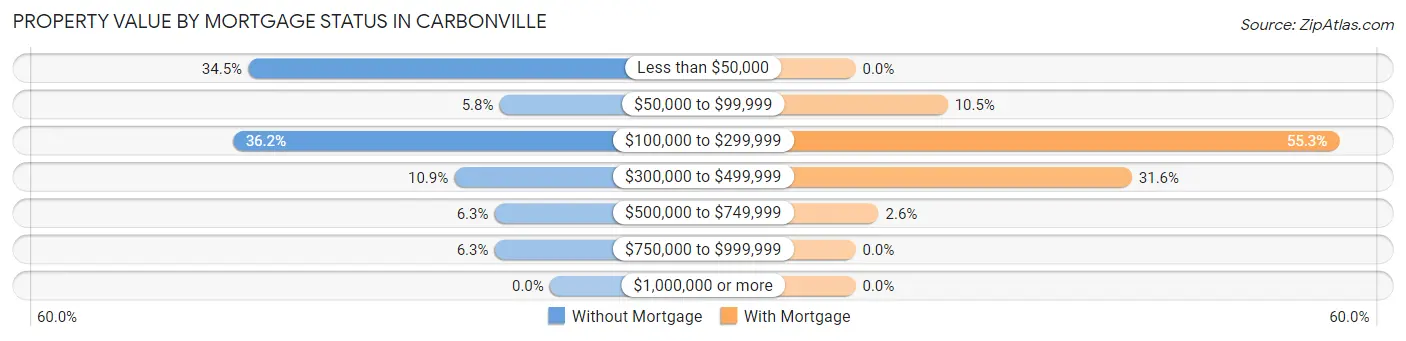
| Property Value | Without Mortgage | With Mortgage |
| Less than $50,000 | 60 (34.5%) | 0 (0.0%) |
| $50,000 to $99,999 | 10 (5.8%) | 20 (10.5%) |
| $100,000 to $299,999 | 63 (36.2%) | 105 (55.3%) |
| $300,000 to $499,999 | 19 (10.9%) | 60 (31.6%) |
| $500,000 to $749,999 | 11 (6.3%) | 5 (2.6%) |
| $750,000 to $999,999 | 11 (6.3%) | 0 (0.0%) |
| $1,000,000 or more | 0 (0.0%) | 0 (0.0%) |
| Total | 174 (100.0%) | 190 (100.0%) |
Household Income by Mortgage Status in Carbonville
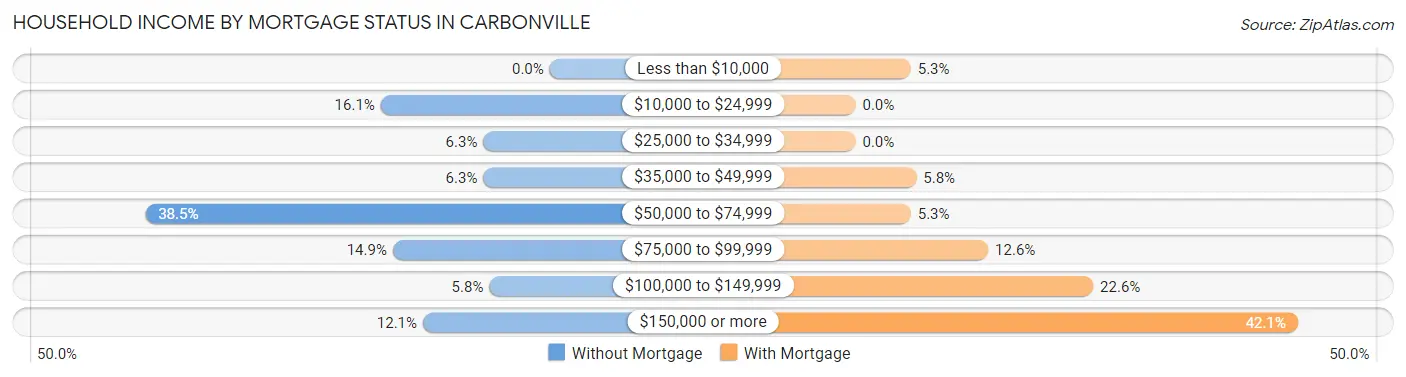
| Household Income | Without Mortgage | With Mortgage |
| Less than $10,000 | 0 (0.0%) | 10 (5.3%) |
| $10,000 to $24,999 | 28 (16.1%) | 0 (0.0%) |
| $25,000 to $34,999 | 11 (6.3%) | 0 (0.0%) |
| $35,000 to $49,999 | 11 (6.3%) | 11 (5.8%) |
| $50,000 to $74,999 | 67 (38.5%) | 10 (5.3%) |
| $75,000 to $99,999 | 26 (14.9%) | 24 (12.6%) |
| $100,000 to $149,999 | 10 (5.8%) | 43 (22.6%) |
| $150,000 or more | 21 (12.1%) | 80 (42.1%) |
| Total | 174 (100.0%) | 190 (100.0%) |
Property Value to Household Income Ratio in Carbonville
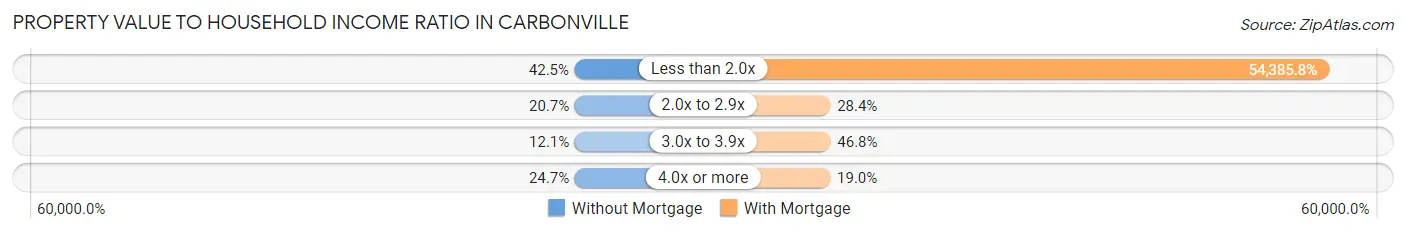
| Value-to-Income Ratio | Without Mortgage | With Mortgage |
| Less than 2.0x | 74 (42.5%) | 103,333 (54,385.8%) |
| 2.0x to 2.9x | 36 (20.7%) | 54 (28.4%) |
| 3.0x to 3.9x | 21 (12.1%) | 89 (46.8%) |
| 4.0x or more | 43 (24.7%) | 36 (19.0%) |
| Total | 174 (100.0%) | 190 (100.0%) |
Real Estate Taxes by Mortgage Status in Carbonville
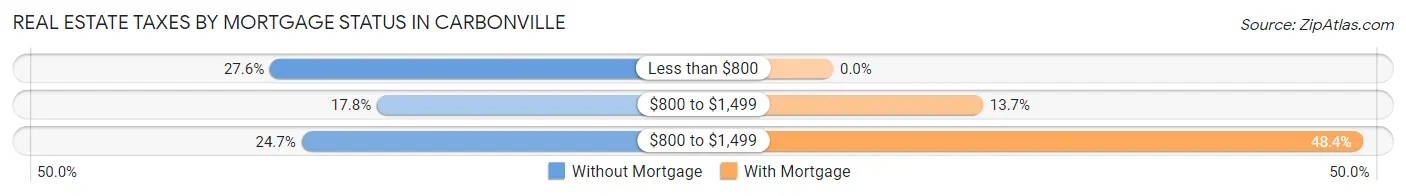
| Property Taxes | Without Mortgage | With Mortgage |
| Less than $800 | 48 (27.6%) | 0 (0.0%) |
| $800 to $1,499 | 31 (17.8%) | 26 (13.7%) |
| $800 to $1,499 | 43 (24.7%) | 92 (48.4%) |
| Total | 174 (100.0%) | 190 (100.0%) |
Health & Disability in Carbonville
Health Insurance Coverage by Age in Carbonville
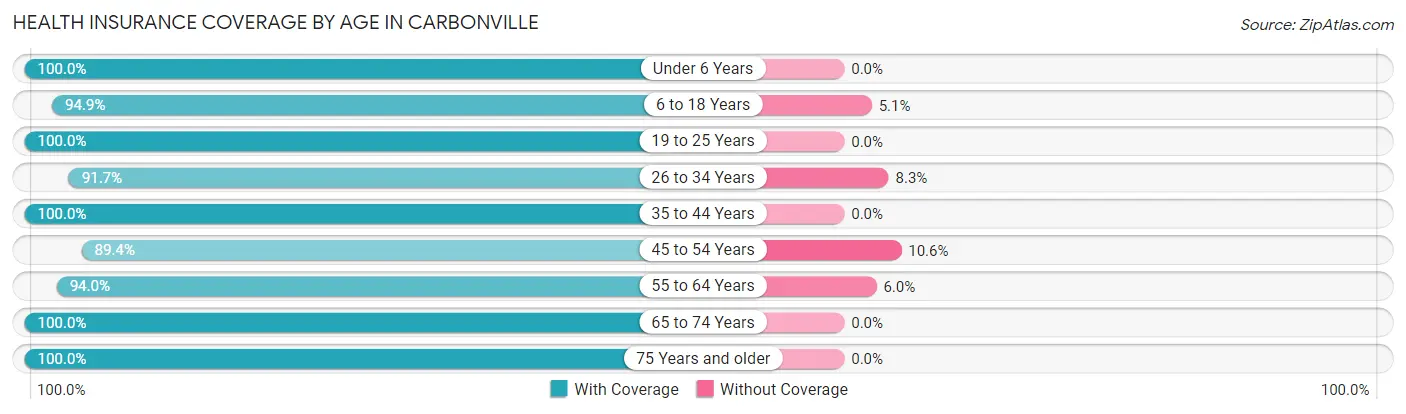
| Age Bracket | With Coverage | Without Coverage |
| Under 6 Years | 146 (100.0%) | 0 (0.0%) |
| 6 to 18 Years | 204 (94.9%) | 11 (5.1%) |
| 19 to 25 Years | 106 (100.0%) | 0 (0.0%) |
| 26 to 34 Years | 111 (91.7%) | 10 (8.3%) |
| 35 to 44 Years | 130 (100.0%) | 0 (0.0%) |
| 45 to 54 Years | 185 (89.4%) | 22 (10.6%) |
| 55 to 64 Years | 188 (94.0%) | 12 (6.0%) |
| 65 to 74 Years | 106 (100.0%) | 0 (0.0%) |
| 75 Years and older | 135 (100.0%) | 0 (0.0%) |
| Total | 1,311 (96.0%) | 55 (4.0%) |
Health Insurance Coverage by Citizenship Status in Carbonville
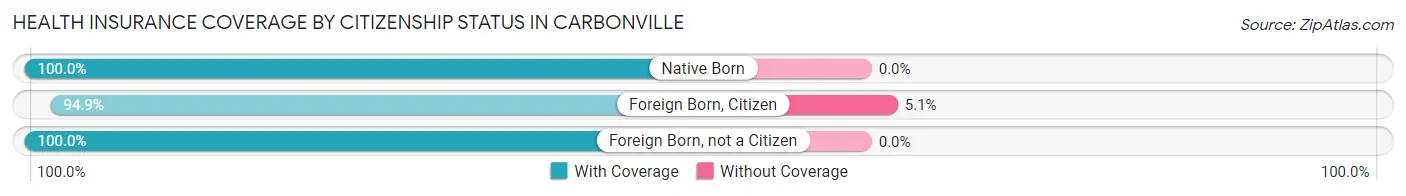
| Citizenship Status | With Coverage | Without Coverage |
| Native Born | 146 (100.0%) | 0 (0.0%) |
| Foreign Born, Citizen | 204 (94.9%) | 11 (5.1%) |
| Foreign Born, not a Citizen | 106 (100.0%) | 0 (0.0%) |
Health Insurance Coverage by Household Income in Carbonville
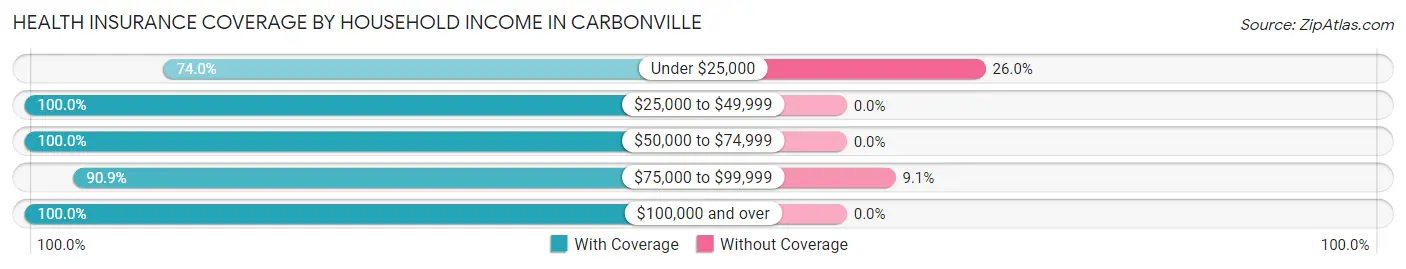
| Household Income | With Coverage | Without Coverage |
| Under $25,000 | 91 (74.0%) | 32 (26.0%) |
| $25,000 to $49,999 | 104 (100.0%) | 0 (0.0%) |
| $50,000 to $74,999 | 433 (100.0%) | 0 (0.0%) |
| $75,000 to $99,999 | 229 (90.9%) | 23 (9.1%) |
| $100,000 and over | 454 (100.0%) | 0 (0.0%) |
Public vs Private Health Insurance Coverage by Age in Carbonville
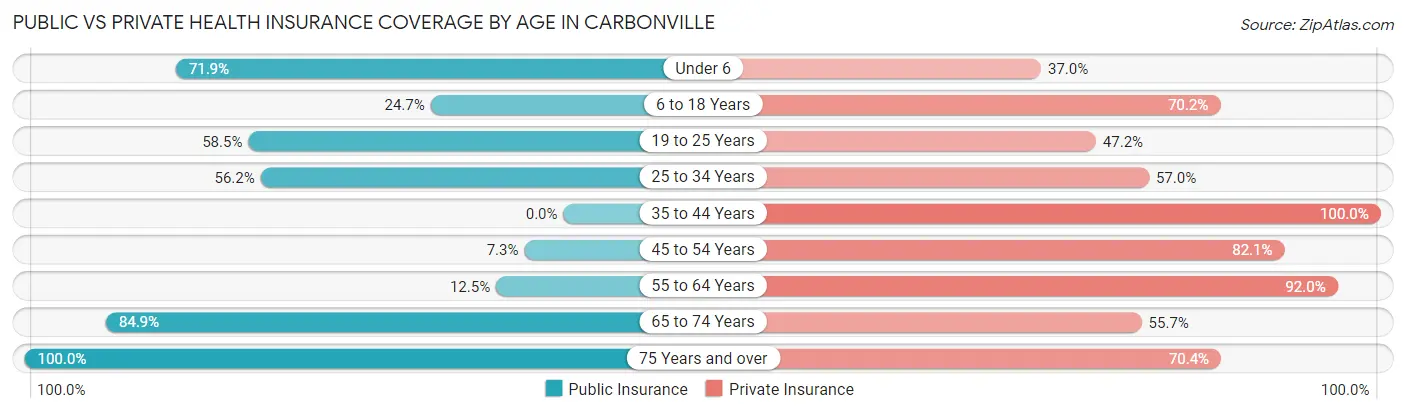
| Age Bracket | Public Insurance | Private Insurance |
| Under 6 | 105 (71.9%) | 54 (37.0%) |
| 6 to 18 Years | 53 (24.6%) | 151 (70.2%) |
| 19 to 25 Years | 62 (58.5%) | 50 (47.2%) |
| 25 to 34 Years | 68 (56.2%) | 69 (57.0%) |
| 35 to 44 Years | 0 (0.0%) | 130 (100.0%) |
| 45 to 54 Years | 15 (7.2%) | 170 (82.1%) |
| 55 to 64 Years | 25 (12.5%) | 184 (92.0%) |
| 65 to 74 Years | 90 (84.9%) | 59 (55.7%) |
| 75 Years and over | 135 (100.0%) | 95 (70.4%) |
| Total | 553 (40.5%) | 962 (70.4%) |
Disability Status by Sex by Age in Carbonville
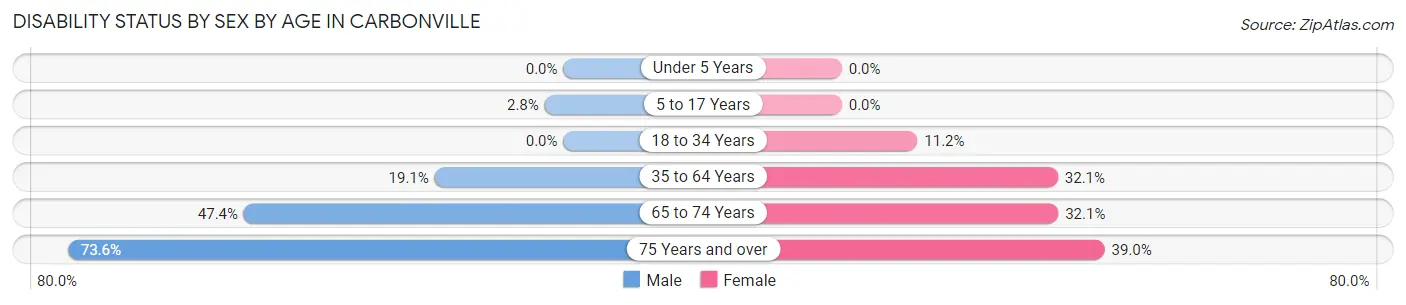
| Age Bracket | Male | Female |
| Under 5 Years | 0 (0.0%) | 0 (0.0%) |
| 5 to 17 Years | 5 (2.8%) | 0 (0.0%) |
| 18 to 34 Years | 0 (0.0%) | 11 (11.2%) |
| 35 to 64 Years | 52 (19.1%) | 85 (32.1%) |
| 65 to 74 Years | 37 (47.4%) | 9 (32.1%) |
| 75 Years and over | 39 (73.6%) | 32 (39.0%) |
Disability Class by Sex by Age in Carbonville
Disability Class: Hearing Difficulty
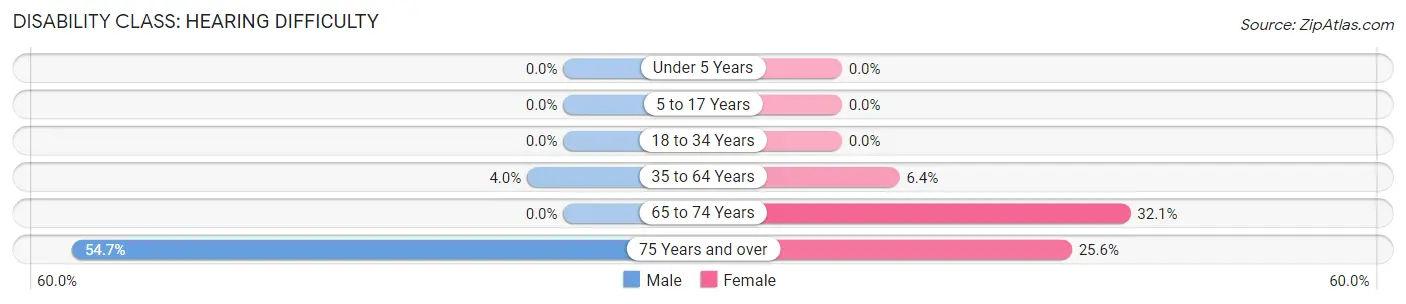
| Age Bracket | Male | Female |
| Under 5 Years | 0 (0.0%) | 0 (0.0%) |
| 5 to 17 Years | 0 (0.0%) | 0 (0.0%) |
| 18 to 34 Years | 0 (0.0%) | 0 (0.0%) |
| 35 to 64 Years | 11 (4.0%) | 17 (6.4%) |
| 65 to 74 Years | 0 (0.0%) | 9 (32.1%) |
| 75 Years and over | 29 (54.7%) | 21 (25.6%) |
Disability Class: Vision Difficulty
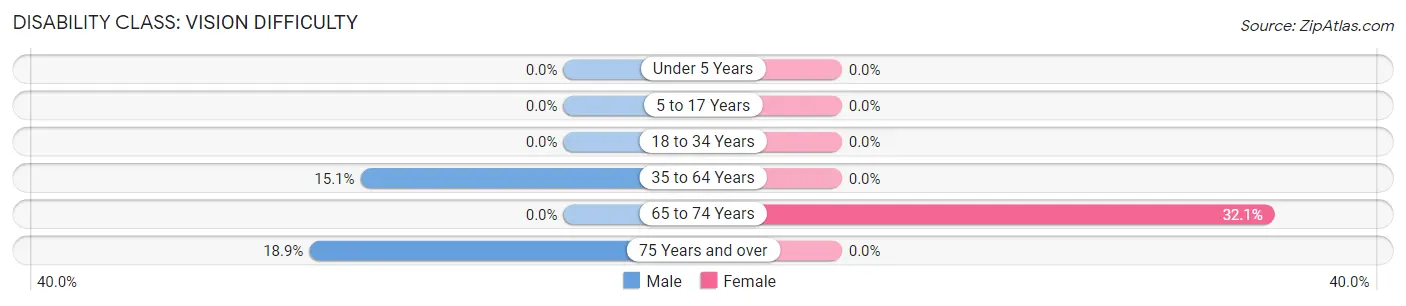
| Age Bracket | Male | Female |
| Under 5 Years | 0 (0.0%) | 0 (0.0%) |
| 5 to 17 Years | 0 (0.0%) | 0 (0.0%) |
| 18 to 34 Years | 0 (0.0%) | 0 (0.0%) |
| 35 to 64 Years | 41 (15.1%) | 0 (0.0%) |
| 65 to 74 Years | 0 (0.0%) | 9 (32.1%) |
| 75 Years and over | 10 (18.9%) | 0 (0.0%) |
Disability Class: Cognitive Difficulty
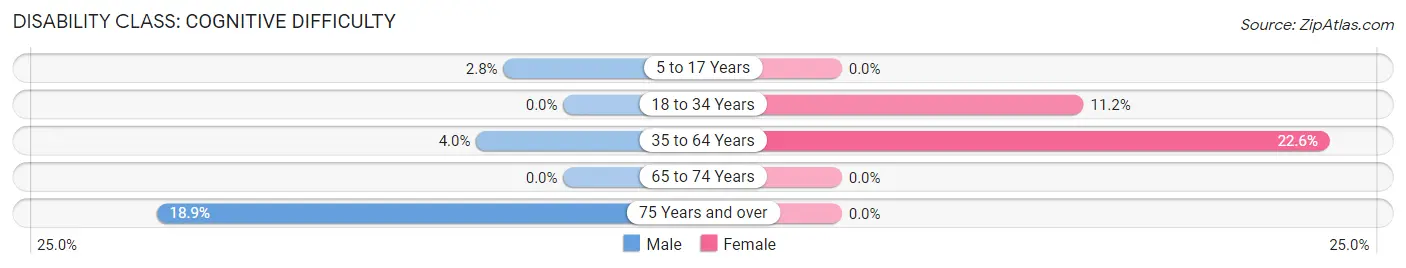
| Age Bracket | Male | Female |
| 5 to 17 Years | 5 (2.8%) | 0 (0.0%) |
| 18 to 34 Years | 0 (0.0%) | 11 (11.2%) |
| 35 to 64 Years | 11 (4.0%) | 60 (22.6%) |
| 65 to 74 Years | 0 (0.0%) | 0 (0.0%) |
| 75 Years and over | 10 (18.9%) | 0 (0.0%) |
Disability Class: Ambulatory Difficulty
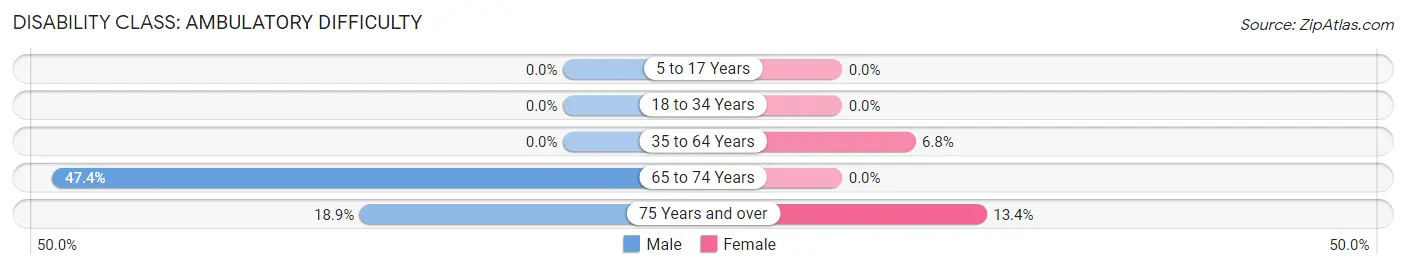
| Age Bracket | Male | Female |
| 5 to 17 Years | 0 (0.0%) | 0 (0.0%) |
| 18 to 34 Years | 0 (0.0%) | 0 (0.0%) |
| 35 to 64 Years | 0 (0.0%) | 18 (6.8%) |
| 65 to 74 Years | 37 (47.4%) | 0 (0.0%) |
| 75 Years and over | 10 (18.9%) | 11 (13.4%) |
Disability Class: Self-Care Difficulty
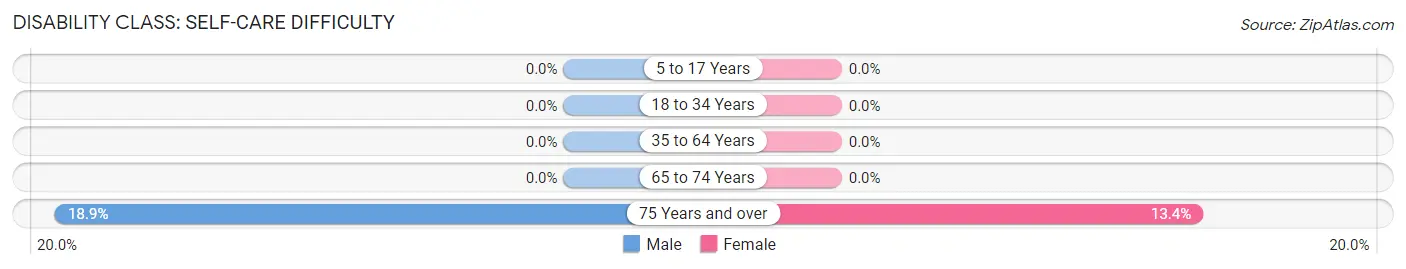
| Age Bracket | Male | Female |
| 5 to 17 Years | 0 (0.0%) | 0 (0.0%) |
| 18 to 34 Years | 0 (0.0%) | 0 (0.0%) |
| 35 to 64 Years | 0 (0.0%) | 0 (0.0%) |
| 65 to 74 Years | 0 (0.0%) | 0 (0.0%) |
| 75 Years and over | 10 (18.9%) | 11 (13.4%) |
Technology Access in Carbonville
Computing Device Access in Carbonville
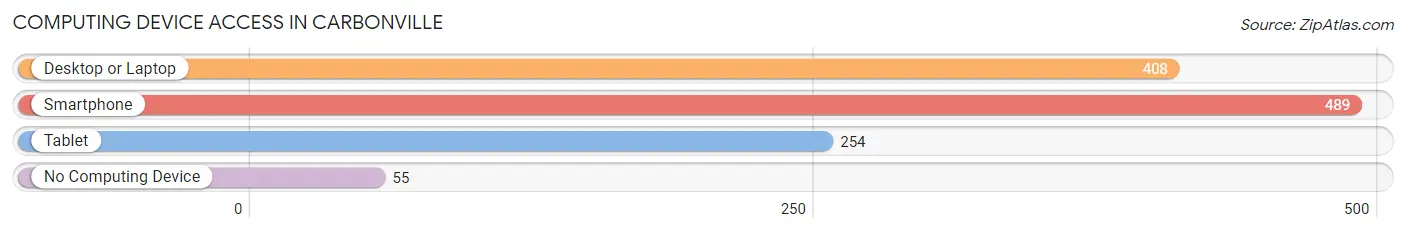
| Device Type | # Households | % Households |
| Desktop or Laptop | 408 | 71.0% |
| Smartphone | 489 | 85.0% |
| Tablet | 254 | 44.2% |
| No Computing Device | 55 | 9.6% |
| Total | 575 | 100.0% |
Internet Access in Carbonville
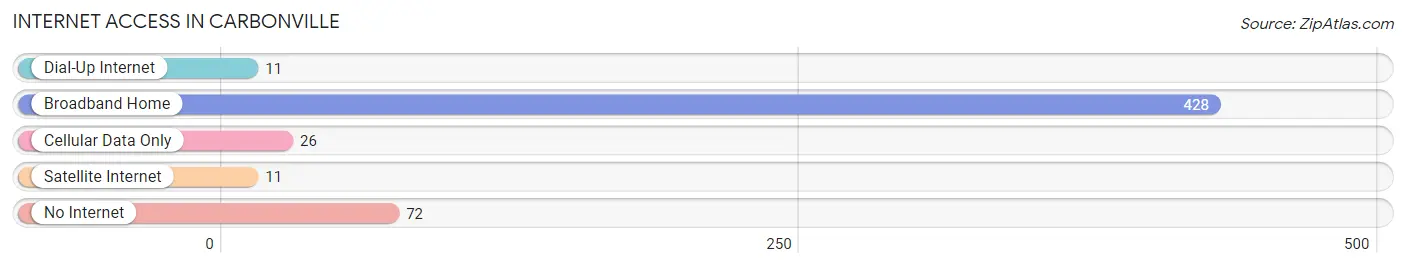
| Internet Type | # Households | % Households |
| Dial-Up Internet | 11 | 1.9% |
| Broadband Home | 428 | 74.4% |
| Cellular Data Only | 26 | 4.5% |
| Satellite Internet | 11 | 1.9% |
| No Internet | 72 | 12.5% |
| Total | 575 | 100.0% |
Carbonville Summary
Carbonville, Utah is a small town located in the western part of the state, in the county of Carbon. It is situated in the foothills of the Wasatch Mountains, and is surrounded by the towns of Price, Helper, and Wellington. The town has a population of approximately 1,500 people, and is the county seat of Carbon County.
History
Carbonville was first settled in 1883 by a group of miners who were looking for coal. The town was originally called Carbon, but was later changed to Carbonville to avoid confusion with the nearby town of Carbon. The town was incorporated in 1891, and the first mayor was elected in 1892.
The town grew rapidly in the early 1900s, and by 1910, it had a population of over 1,000 people. The town was home to several coal mines, and the coal industry was the main source of employment for the town's residents. The town also had a number of businesses, including a hotel, a bank, a post office, and a newspaper.
In the 1920s, the coal industry began to decline, and the town's population began to decline as well. The Great Depression further exacerbated the town's economic woes, and by 1940, the population had dropped to just over 500 people.
The town's fortunes began to improve in the 1950s, when the coal industry began to rebound. The town's population began to grow again, and by 1960, it had reached 1,000 people. The town continued to grow throughout the 1960s and 1970s, and by 1980, the population had reached 1,500 people.
Geography
Carbonville is located in the western part of Carbon County, in the foothills of the Wasatch Mountains. The town is situated at an elevation of 5,400 feet, and is surrounded by the towns of Price, Helper, and Wellington. The town is located approximately 30 miles east of the city of Price, and is approximately 90 miles south of Salt Lake City.
The town is located in a semi-arid climate, with hot summers and cold winters. The average annual temperature is approximately 50 degrees Fahrenheit, and the average annual precipitation is approximately 12 inches.
Economy
The economy of Carbonville is largely based on the coal industry. The town is home to several coal mines, and the coal industry is the main source of employment for the town's residents. The town also has a number of businesses, including a hotel, a bank, a post office, and a newspaper.
The town is also home to a number of tourist attractions, including the Carbon County Museum, the Carbon County Historical Society, and the Carbon County Fairgrounds. The town is also home to a number of outdoor recreation areas, including the Carbon County Recreation Area, the Carbon County State Park, and the Carbon County Wildlife Management Area.
Demographics
As of the 2010 census, the population of Carbonville was 1,500 people. The racial makeup of the town was 95.3% White, 0.7% African American, 0.7% Native American, 0.3% Asian, 0.3% Pacific Islander, and 2.0% from other races. The median household income was $35,000, and the median family income was $41,000. The per capita income was $17,000. Approximately 10.7% of the population was below the poverty line.
Common Questions
What is Per Capita Income in Carbonville?
Per Capita income in Carbonville is $33,500.
What is the Median Family Income in Carbonville?
Median Family Income in Carbonville is $75,682.
What is the Median Household income in Carbonville?
Median Household Income in Carbonville is $77,386.
What is Income or Wage Gap in Carbonville?
Income or Wage Gap in Carbonville is 2.4%.
Women in Carbonville earn 97.6 cents for every dollar earned by a man.
What is Inequality or Gini Index in Carbonville?
Inequality or Gini Index in Carbonville is 0.32.
What is the Total Population of Carbonville?
Total Population of Carbonville is 1,366.
What is the Total Male Population of Carbonville?
Total Male Population of Carbonville is 729.
What is the Total Female Population of Carbonville?
Total Female Population of Carbonville is 637.
What is the Ratio of Males per 100 Females in Carbonville?
There are 114.44 Males per 100 Females in Carbonville.
What is the Ratio of Females per 100 Males in Carbonville?
There are 87.38 Females per 100 Males in Carbonville.
What is the Median Population Age in Carbonville?
Median Population Age in Carbonville is 40.7 Years.
What is the Average Family Size in Carbonville
Average Family Size in Carbonville is 2.9 People.
What is the Average Household Size in Carbonville
Average Household Size in Carbonville is 2.4 People.
How Large is the Labor Force in Carbonville?
There are 625 People in the Labor Forcein in Carbonville.
What is the Percentage of People in the Labor Force in Carbonville?
59.9% of People are in the Labor Force in Carbonville.