Park City, UT Map & Demographics
Park City Map
Park City Overview
$87,440
PER CAPITA INCOME
$170,250
AVG FAMILY INCOME
$132,315
AVG HOUSEHOLD INCOME
8.9%
WAGE / INCOME GAP [ % ]
91.1¢/ $1
WAGE / INCOME GAP [ $ ]
0.58
INEQUALITY / GINI INDEX
8,379
TOTAL POPULATION
4,307
MALE POPULATION
4,072
FEMALE POPULATION
105.77
MALES / 100 FEMALES
94.54
FEMALES / 100 MALES
41.6
MEDIAN AGE
3.2
AVG FAMILY SIZE
2.9
AVG HOUSEHOLD SIZE
5,105
LABOR FORCE [ PEOPLE ]
71.6%
PERCENT IN LABOR FORCE
1.2%
UNEMPLOYMENT RATE
Income in Park City
Income Overview in Park City
Per Capita Income in Park City is $87,440, while median incomes of families and households are $170,250 and $132,315 respectively.
| Characteristic | Number | Measure |
| Per Capita Income | 8,379 | $87,440 |
| Median Family Income | 1,984 | $170,250 |
| Mean Family Income | 1,984 | $300,923 |
| Median Household Income | 2,876 | $132,315 |
| Mean Household Income | 2,876 | $238,648 |
| Income Deficit | 1,984 | $0 |
| Wage / Income Gap (%) | 8,379 | 8.88% |
| Wage / Income Gap ($) | 8,379 | 91.12¢ per $1 |
| Gini / Inequality Index | 8,379 | 0.58 |
Earnings by Sex in Park City
Average Earnings in Park City are $45,929, $47,293 for men and $43,092 for women, a difference of 8.9%.
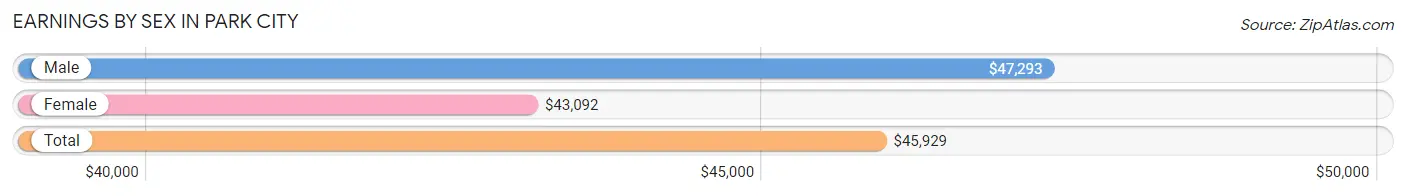
| Sex | Number | Average Earnings |
| Male | 2,849 (53.6%) | $47,293 |
| Female | 2,462 (46.4%) | $43,092 |
| Total | 5,311 (100.0%) | $45,929 |
Earnings by Sex by Income Bracket in Park City
The most common earnings brackets in Park City are $100,000+ for men (883 | 31.0%) and $100,000+ for women (406 | 16.5%).
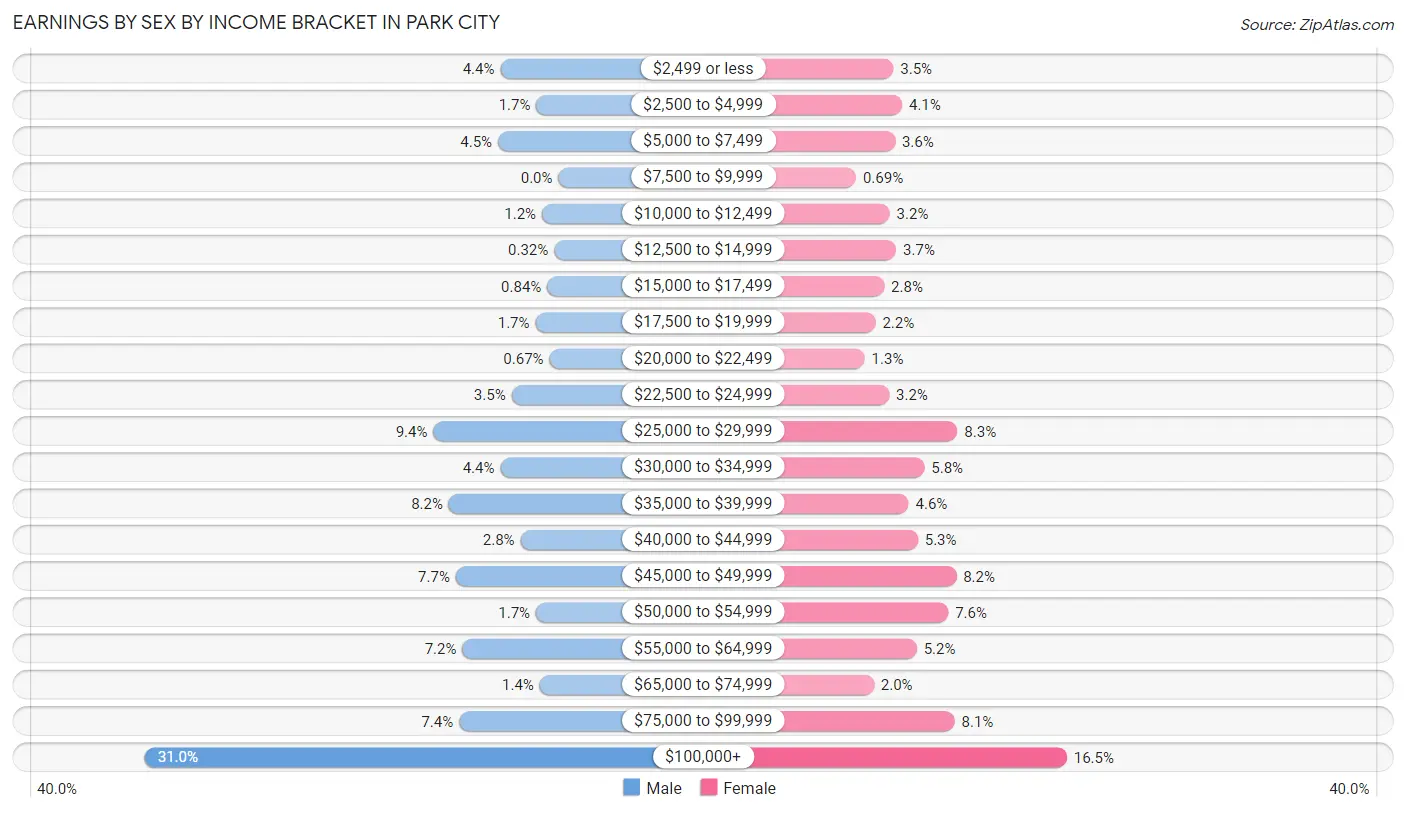
| Income | Male | Female |
| $2,499 or less | 124 (4.3%) | 86 (3.5%) |
| $2,500 to $4,999 | 47 (1.7%) | 102 (4.1%) |
| $5,000 to $7,499 | 129 (4.5%) | 89 (3.6%) |
| $7,500 to $9,999 | 0 (0.0%) | 17 (0.7%) |
| $10,000 to $12,499 | 35 (1.2%) | 79 (3.2%) |
| $12,500 to $14,999 | 9 (0.3%) | 91 (3.7%) |
| $15,000 to $17,499 | 24 (0.8%) | 69 (2.8%) |
| $17,500 to $19,999 | 49 (1.7%) | 53 (2.1%) |
| $20,000 to $22,499 | 19 (0.7%) | 33 (1.3%) |
| $22,500 to $24,999 | 100 (3.5%) | 78 (3.2%) |
| $25,000 to $29,999 | 267 (9.4%) | 204 (8.3%) |
| $30,000 to $34,999 | 124 (4.3%) | 143 (5.8%) |
| $35,000 to $39,999 | 234 (8.2%) | 114 (4.6%) |
| $40,000 to $44,999 | 81 (2.8%) | 131 (5.3%) |
| $45,000 to $49,999 | 219 (7.7%) | 202 (8.2%) |
| $50,000 to $54,999 | 48 (1.7%) | 187 (7.6%) |
| $55,000 to $64,999 | 205 (7.2%) | 129 (5.2%) |
| $65,000 to $74,999 | 40 (1.4%) | 50 (2.0%) |
| $75,000 to $99,999 | 212 (7.4%) | 199 (8.1%) |
| $100,000+ | 883 (31.0%) | 406 (16.5%) |
| Total | 2,849 (100.0%) | 2,462 (100.0%) |
Earnings by Sex by Educational Attainment in Park City
Average earnings in Park City are $57,197 for men and $46,774 for women, a difference of 18.2%. Men with an educational attainment of graduate degree enjoy the highest average annual earnings of $130,071, while those with high school diploma education earn the least with $37,282. Women with an educational attainment of graduate degree earn the most with the average annual earnings of $57,763, while those with college or associate's degree education have the smallest earnings of $32,969.
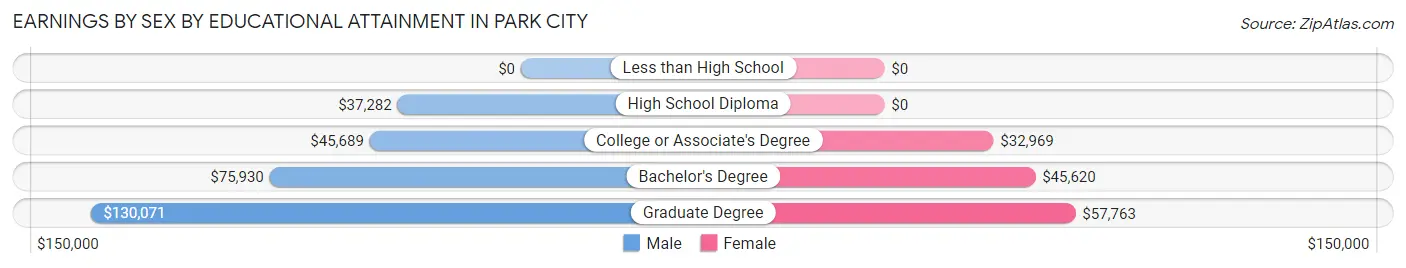
| Educational Attainment | Male Income | Female Income |
| Less than High School | - | - |
| High School Diploma | $37,282 | $0 |
| College or Associate's Degree | $45,689 | $32,969 |
| Bachelor's Degree | $75,930 | $45,620 |
| Graduate Degree | $130,071 | $57,763 |
| Total | $57,197 | $46,774 |
Family Income in Park City
Family Income Brackets in Park City
According to the Park City family income data, there are 813 families falling into the $200,000+ income range, which is the most common income bracket and makes up 41.0% of all families. Conversely, the $15,000 to $24,999 income bracket is the least frequent group with only 6 families (0.3%) belonging to this category.
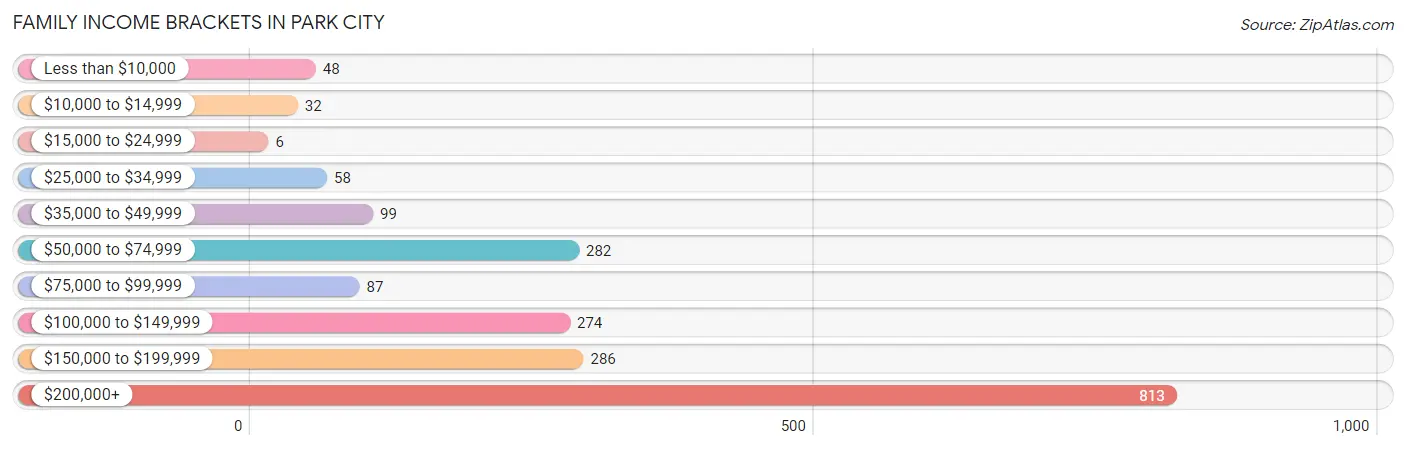
| Income Bracket | # Families | % Families |
| Less than $10,000 | 48 | 2.4% |
| $10,000 to $14,999 | 32 | 1.6% |
| $15,000 to $24,999 | 6 | 0.3% |
| $25,000 to $34,999 | 58 | 2.9% |
| $35,000 to $49,999 | 99 | 5.0% |
| $50,000 to $74,999 | 282 | 14.2% |
| $75,000 to $99,999 | 87 | 4.4% |
| $100,000 to $149,999 | 274 | 13.8% |
| $150,000 to $199,999 | 286 | 14.4% |
| $200,000+ | 813 | 41.0% |
Family Income by Famaliy Size in Park City
2-person families (1,067 | 53.8%) account for the highest median family income in Park City with $179,792 per family, while 2-person families (1,067 | 53.8%) have the highest median income of $89,896 per family member.
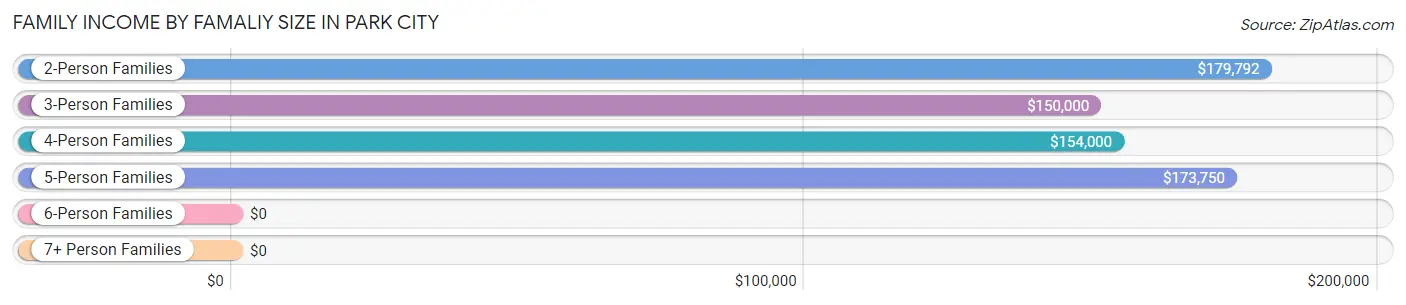
| Income Bracket | # Families | Median Income |
| 2-Person Families | 1,067 (53.8%) | $179,792 |
| 3-Person Families | 574 (28.9%) | $150,000 |
| 4-Person Families | 160 (8.1%) | $154,000 |
| 5-Person Families | 150 (7.6%) | $173,750 |
| 6-Person Families | 33 (1.7%) | $0 |
| 7+ Person Families | 0 (0.0%) | $0 |
| Total | 1,984 (100.0%) | $170,250 |
Family Income by Number of Earners in Park City
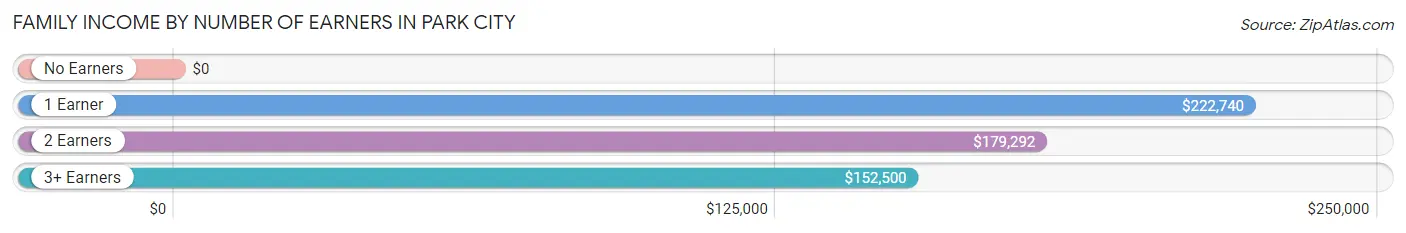
| Number of Earners | # Families | Median Income |
| No Earners | 280 (14.1%) | $0 |
| 1 Earner | 595 (30.0%) | $222,740 |
| 2 Earners | 889 (44.8%) | $179,292 |
| 3+ Earners | 220 (11.1%) | $152,500 |
| Total | 1,984 (100.0%) | $170,250 |
Household Income in Park City
Household Income Brackets in Park City
With 940 households falling in the category, the $200,000+ income range is the most frequent in Park City, accounting for 32.7% of all households. In contrast, only 37 households (1.3%) fall into the $15,000 to $24,999 income bracket, making it the least populous group.
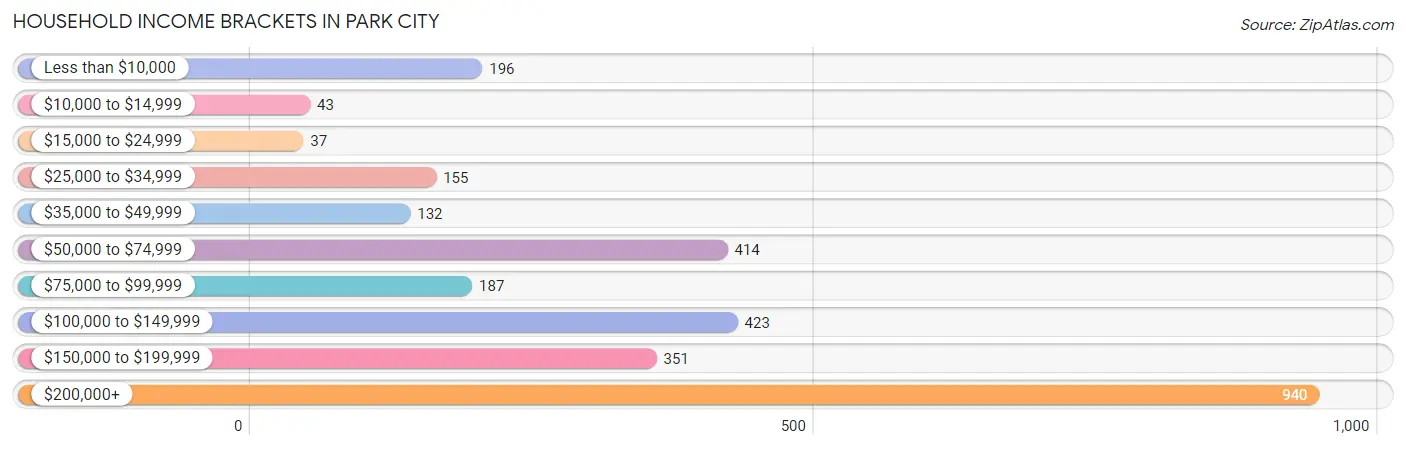
| Income Bracket | # Households | % Households |
| Less than $10,000 | 196 | 6.8% |
| $10,000 to $14,999 | 43 | 1.5% |
| $15,000 to $24,999 | 37 | 1.3% |
| $25,000 to $34,999 | 155 | 5.4% |
| $35,000 to $49,999 | 132 | 4.6% |
| $50,000 to $74,999 | 414 | 14.4% |
| $75,000 to $99,999 | 187 | 6.5% |
| $100,000 to $149,999 | 423 | 14.7% |
| $150,000 to $199,999 | 351 | 12.2% |
| $200,000+ | 940 | 32.7% |
Household Income by Householder Age in Park City
The median household income in Park City is $132,315, with the highest median household income of $172,375 found in the 45 to 64 years age bracket for the primary householder. A total of 1,183 households (41.1%) fall into this category. Meanwhile, the 15 to 24 years age bracket for the primary householder has the lowest median household income of $0, with 49 households (1.7%) in this group.
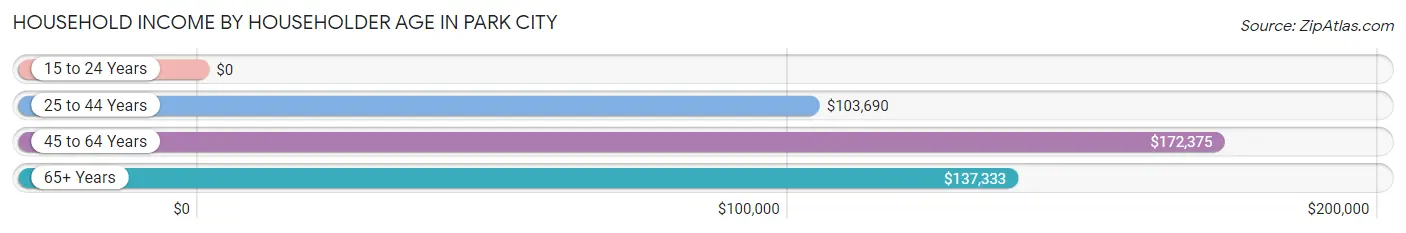
| Income Bracket | # Households | Median Income |
| 15 to 24 Years | 49 (1.7%) | $0 |
| 25 to 44 Years | 718 (25.0%) | $103,690 |
| 45 to 64 Years | 1,183 (41.1%) | $172,375 |
| 65+ Years | 926 (32.2%) | $137,333 |
| Total | 2,876 (100.0%) | $132,315 |
Poverty in Park City
Income Below Poverty by Sex and Age in Park City
With 8.7% poverty level for males and 6.1% for females among the residents of Park City, 18 to 24 year old males and 45 to 54 year old females are the most vulnerable to poverty, with 178 males (32.5%) and 54 females (14.9%) in their respective age groups living below the poverty level.
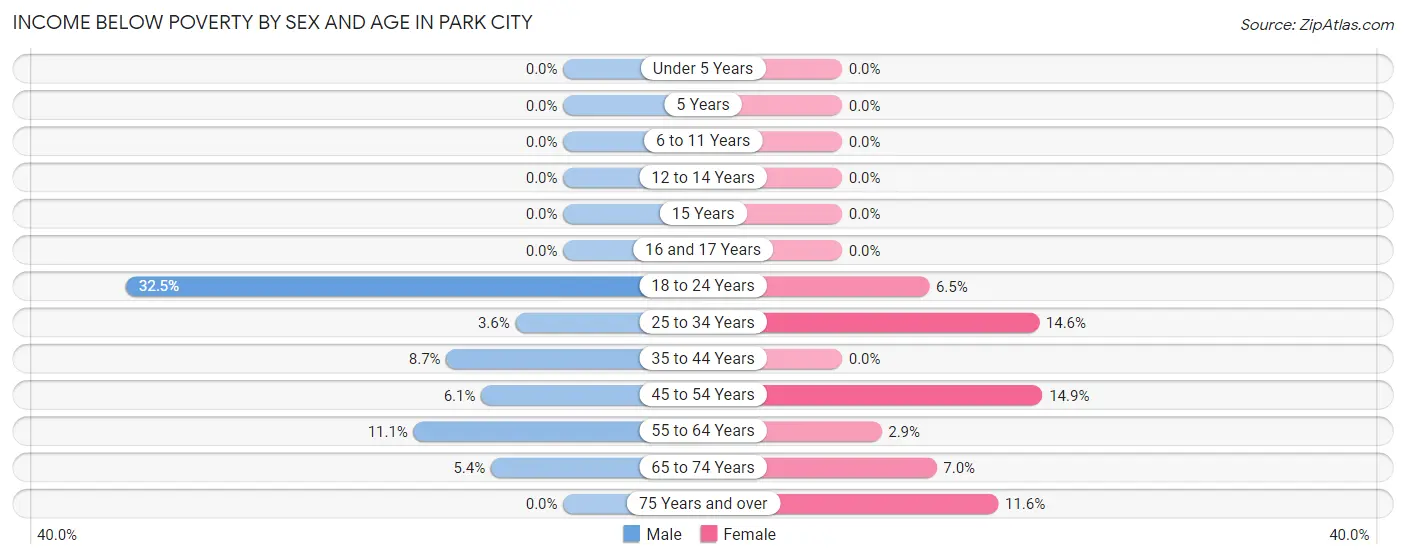
| Age Bracket | Male | Female |
| Under 5 Years | 0 (0.0%) | 0 (0.0%) |
| 5 Years | 0 (0.0%) | 0 (0.0%) |
| 6 to 11 Years | 0 (0.0%) | 0 (0.0%) |
| 12 to 14 Years | 0 (0.0%) | 0 (0.0%) |
| 15 Years | 0 (0.0%) | 0 (0.0%) |
| 16 and 17 Years | 0 (0.0%) | 0 (0.0%) |
| 18 to 24 Years | 178 (32.5%) | 24 (6.5%) |
| 25 to 34 Years | 16 (3.5%) | 85 (14.6%) |
| 35 to 44 Years | 48 (8.7%) | 0 (0.0%) |
| 45 to 54 Years | 35 (6.1%) | 54 (14.9%) |
| 55 to 64 Years | 68 (11.1%) | 21 (2.9%) |
| 65 to 74 Years | 28 (5.4%) | 36 (7.0%) |
| 75 Years and over | 0 (0.0%) | 29 (11.6%) |
| Total | 373 (8.7%) | 249 (6.1%) |
Income Above Poverty by Sex and Age in Park City
According to the poverty statistics in Park City, males aged under 5 years and females aged under 5 years are the age groups that are most secure financially, with 100.0% of males and 100.0% of females in these age groups living above the poverty line.
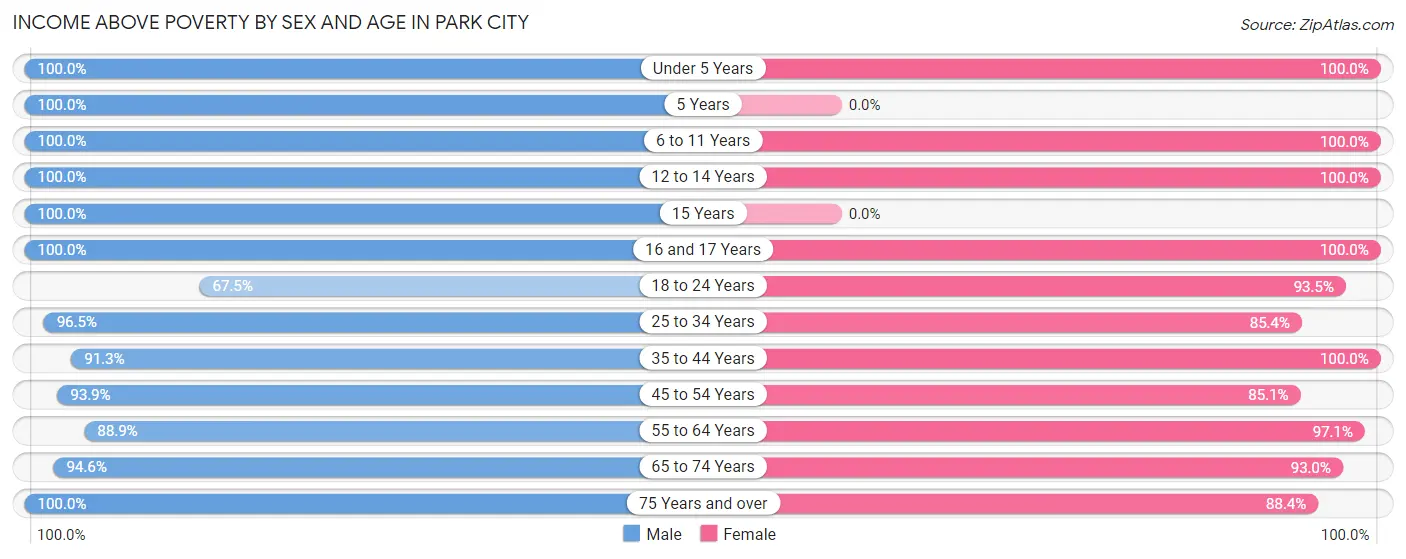
| Age Bracket | Male | Female |
| Under 5 Years | 136 (100.0%) | 125 (100.0%) |
| 5 Years | 8 (100.0%) | 0 (0.0%) |
| 6 to 11 Years | 340 (100.0%) | 283 (100.0%) |
| 12 to 14 Years | 173 (100.0%) | 129 (100.0%) |
| 15 Years | 39 (100.0%) | 0 (0.0%) |
| 16 and 17 Years | 103 (100.0%) | 82 (100.0%) |
| 18 to 24 Years | 370 (67.5%) | 347 (93.5%) |
| 25 to 34 Years | 435 (96.5%) | 496 (85.4%) |
| 35 to 44 Years | 505 (91.3%) | 642 (100.0%) |
| 45 to 54 Years | 540 (93.9%) | 309 (85.1%) |
| 55 to 64 Years | 544 (88.9%) | 696 (97.1%) |
| 65 to 74 Years | 493 (94.6%) | 477 (93.0%) |
| 75 Years and over | 247 (100.0%) | 221 (88.4%) |
| Total | 3,933 (91.3%) | 3,807 (93.9%) |
Income Below Poverty Among Married-Couple Families in Park City
The poverty statistics for married-couple families in Park City show that 4.6% or 76 of the total 1,659 families live below the poverty line. Families with no children have the highest poverty rate of 6.7%, comprising of 76 families. On the other hand, families with 1 or 2 children have the lowest poverty rate of 0.0%, which includes 0 families.
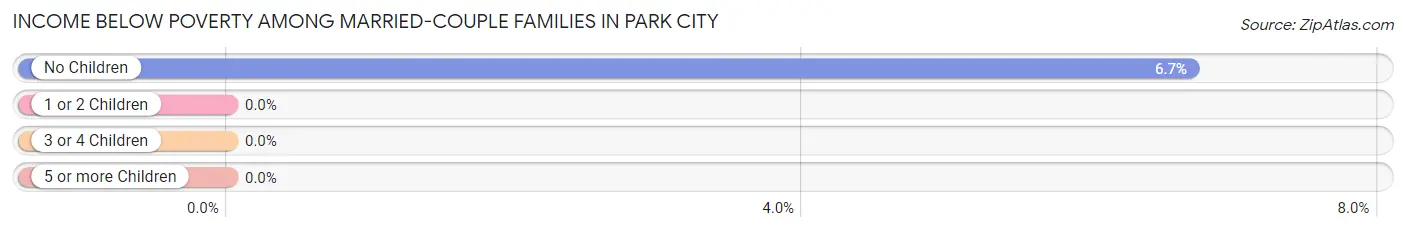
| Children | Above Poverty | Below Poverty |
| No Children | 1,060 (93.3%) | 76 (6.7%) |
| 1 or 2 Children | 465 (100.0%) | 0 (0.0%) |
| 3 or 4 Children | 58 (100.0%) | 0 (0.0%) |
| 5 or more Children | 0 (0.0%) | 0 (0.0%) |
| Total | 1,583 (95.4%) | 76 (4.6%) |
Income Below Poverty Among Single-Parent Households in Park City
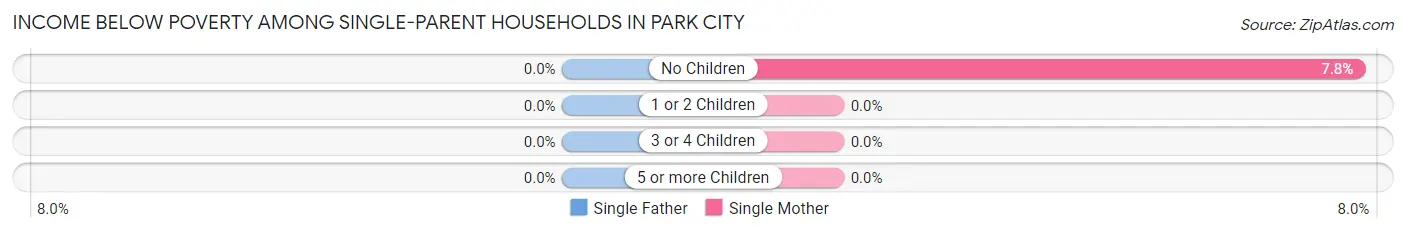
| Children | Single Father | Single Mother |
| No Children | 0 (0.0%) | 8 (7.8%) |
| 1 or 2 Children | 0 (0.0%) | 0 (0.0%) |
| 3 or 4 Children | 0 (0.0%) | 0 (0.0%) |
| 5 or more Children | 0 (0.0%) | 0 (0.0%) |
| Total | 0 (0.0%) | 8 (2.9%) |
Income Below Poverty Among Married-Couple vs Single-Parent Households in Park City
The poverty data for Park City shows that 76 of the married-couple family households (4.6%) and 8 of the single-parent households (2.5%) are living below the poverty level. Within the married-couple family households, those with no children have the highest poverty rate, with 76 households (6.7%) falling below the poverty line. Among the single-parent households, those with no children have the highest poverty rate, with 8 household (6.6%) living below poverty.
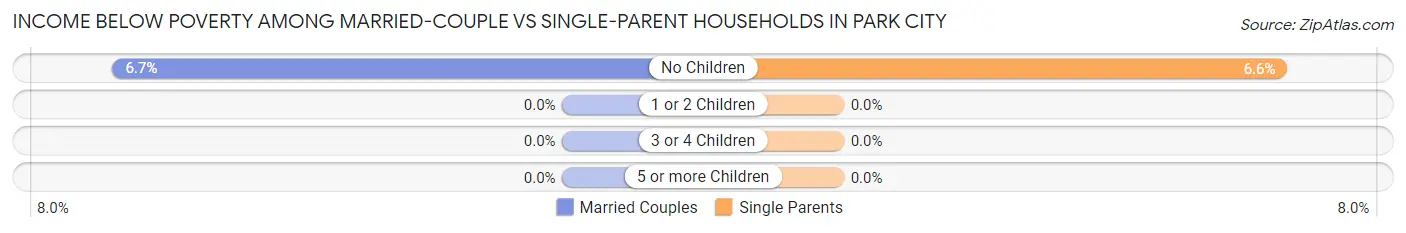
| Children | Married-Couple Families | Single-Parent Households |
| No Children | 76 (6.7%) | 8 (6.6%) |
| 1 or 2 Children | 0 (0.0%) | 0 (0.0%) |
| 3 or 4 Children | 0 (0.0%) | 0 (0.0%) |
| 5 or more Children | 0 (0.0%) | 0 (0.0%) |
| Total | 76 (4.6%) | 8 (2.5%) |
Race in Park City
The most populous races in Park City are White / Caucasian (7,018 | 83.8%), Hispanic or Latino (1,281 | 15.3%), and Two or more Races (681 | 8.1%).
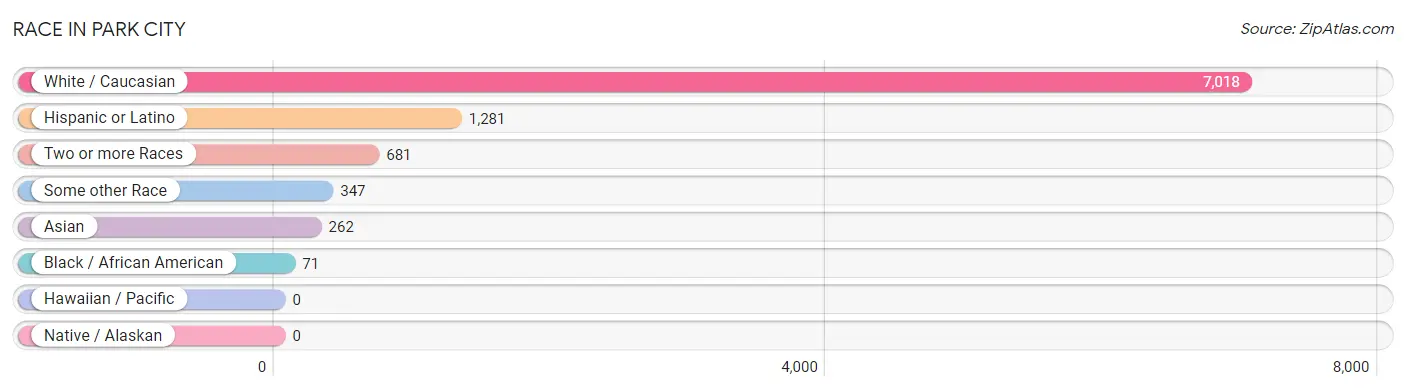
| Race | # Population | % Population |
| Asian | 262 | 3.1% |
| Black / African American | 71 | 0.9% |
| Hawaiian / Pacific | 0 | 0.0% |
| Hispanic or Latino | 1,281 | 15.3% |
| Native / Alaskan | 0 | 0.0% |
| White / Caucasian | 7,018 | 83.8% |
| Two or more Races | 681 | 8.1% |
| Some other Race | 347 | 4.1% |
| Total | 8,379 | 100.0% |
Ancestry in Park City
The most populous ancestries reported in Park City are English (1,713 | 20.4%), German (1,187 | 14.2%), Mexican (1,112 | 13.3%), Irish (854 | 10.2%), and Italian (581 | 6.9%), together accounting for 65.0% of all Park City residents.
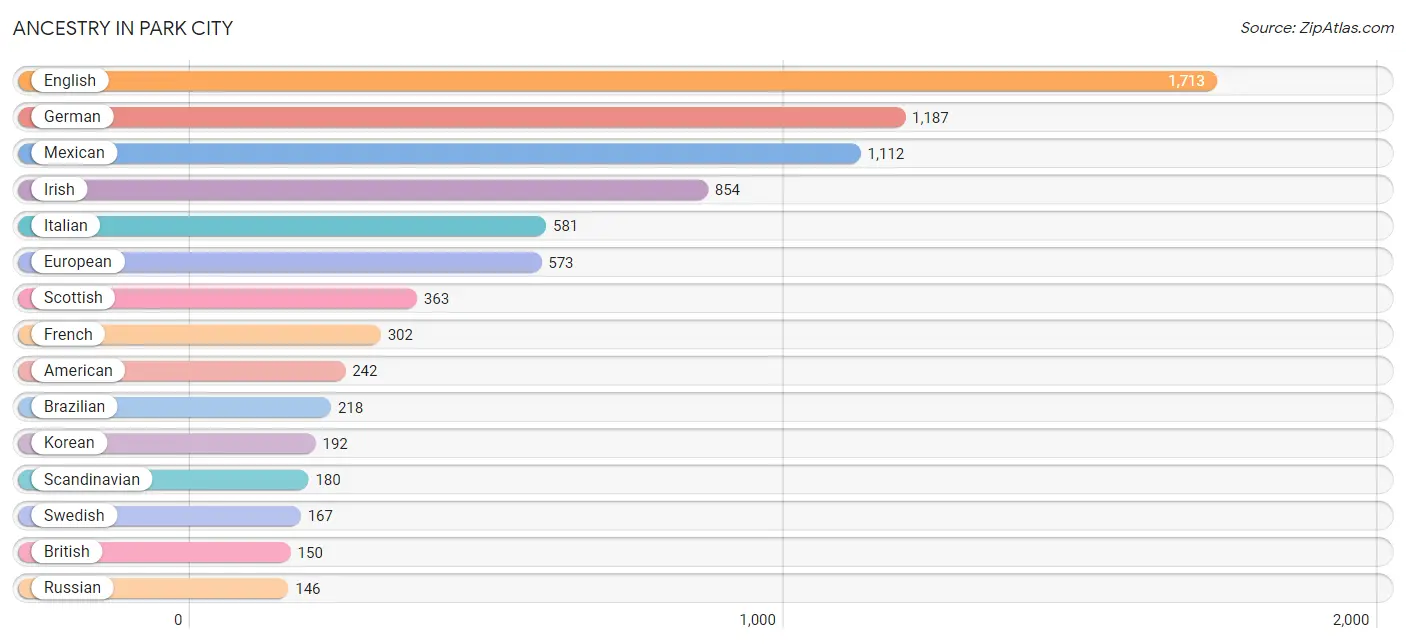
| Ancestry | # Population | % Population |
| American | 242 | 2.9% |
| Argentinean | 22 | 0.3% |
| Armenian | 28 | 0.3% |
| Austrian | 47 | 0.6% |
| Basque | 8 | 0.1% |
| Bhutanese | 41 | 0.5% |
| Brazilian | 218 | 2.6% |
| British | 150 | 1.8% |
| Cambodian | 8 | 0.1% |
| Canadian | 5 | 0.1% |
| Central American | 10 | 0.1% |
| Cherokee | 8 | 0.1% |
| Chilean | 75 | 0.9% |
| Cuban | 19 | 0.2% |
| Czech | 5 | 0.1% |
| Danish | 130 | 1.5% |
| Dutch | 119 | 1.4% |
| Eastern European | 52 | 0.6% |
| English | 1,713 | 20.4% |
| European | 573 | 6.8% |
| Finnish | 27 | 0.3% |
| French | 302 | 3.6% |
| French Canadian | 21 | 0.3% |
| German | 1,187 | 14.2% |
| Hungarian | 10 | 0.1% |
| Indian (Asian) | 52 | 0.6% |
| Irish | 854 | 10.2% |
| Italian | 581 | 6.9% |
| Jamaican | 16 | 0.2% |
| Korean | 192 | 2.3% |
| Lithuanian | 10 | 0.1% |
| Mexican | 1,112 | 13.3% |
| New Zealander | 10 | 0.1% |
| Northern European | 58 | 0.7% |
| Norwegian | 95 | 1.1% |
| Polish | 139 | 1.7% |
| Puerto Rican | 24 | 0.3% |
| Russian | 146 | 1.7% |
| Salvadoran | 10 | 0.1% |
| Scandinavian | 180 | 2.1% |
| Scotch-Irish | 108 | 1.3% |
| Scottish | 363 | 4.3% |
| South American | 97 | 1.2% |
| Spaniard | 19 | 0.2% |
| Sri Lankan | 25 | 0.3% |
| Swedish | 167 | 2.0% |
| Swiss | 14 | 0.2% |
| Ukrainian | 9 | 0.1% |
| Welsh | 23 | 0.3% |
| Yugoslavian | 25 | 0.3% | View All 50 Rows |
Immigrants in Park City
The most numerous immigrant groups reported in Park City came from Latin America (590 | 7.0%), Central America (447 | 5.3%), Mexico (437 | 5.2%), Asia (246 | 2.9%), and South Eastern Asia (190 | 2.3%), together accounting for 22.8% of all Park City residents.
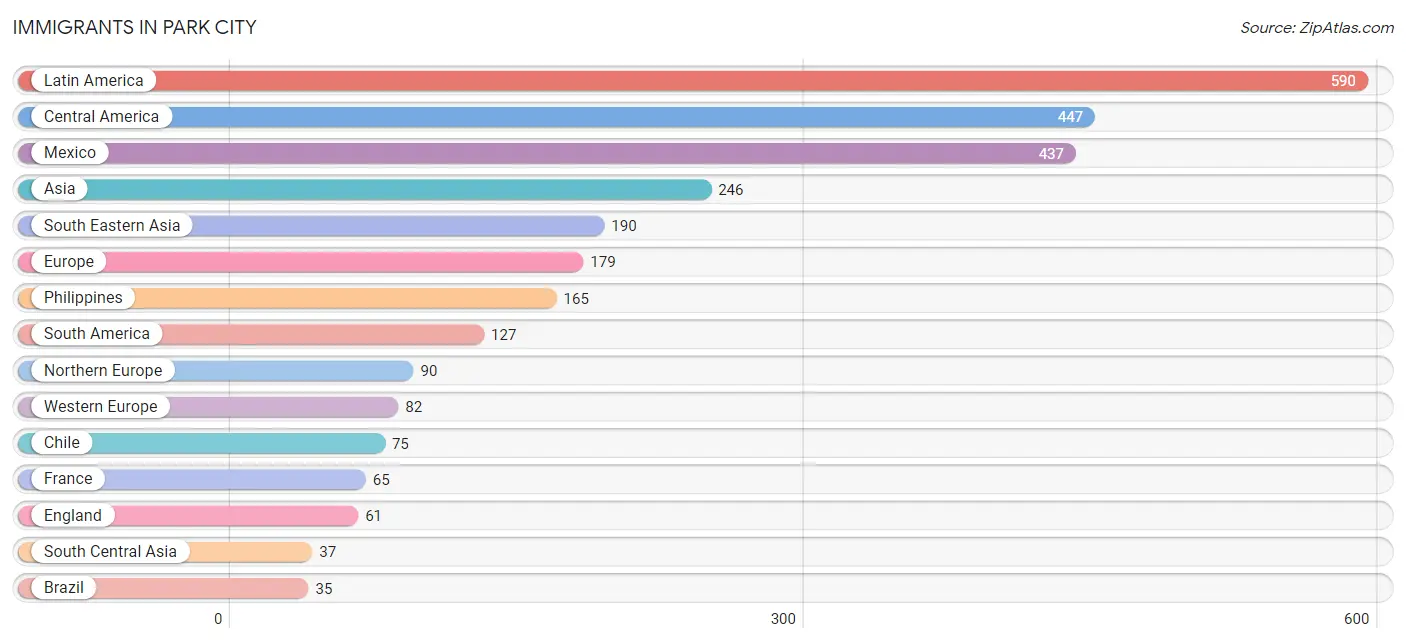
| Immigration Origin | # Population | % Population |
| Africa | 4 | 0.1% |
| Asia | 246 | 2.9% |
| Brazil | 35 | 0.4% |
| Canada | 15 | 0.2% |
| Caribbean | 16 | 0.2% |
| Central America | 447 | 5.3% |
| Chile | 75 | 0.9% |
| China | 11 | 0.1% |
| Colombia | 17 | 0.2% |
| Eastern Africa | 4 | 0.1% |
| Eastern Asia | 19 | 0.2% |
| Eastern Europe | 7 | 0.1% |
| El Salvador | 10 | 0.1% |
| England | 61 | 0.7% |
| Europe | 179 | 2.1% |
| France | 65 | 0.8% |
| Iran | 28 | 0.3% |
| Ireland | 10 | 0.1% |
| Jamaica | 16 | 0.2% |
| Kenya | 4 | 0.1% |
| Latin America | 590 | 7.0% |
| Mexico | 437 | 5.2% |
| Northern Europe | 90 | 1.1% |
| Oceania | 10 | 0.1% |
| Philippines | 165 | 2.0% |
| Russia | 7 | 0.1% |
| South America | 127 | 1.5% |
| South Central Asia | 37 | 0.4% |
| South Eastern Asia | 190 | 2.3% |
| Switzerland | 17 | 0.2% |
| Vietnam | 25 | 0.3% |
| Western Europe | 82 | 1.0% | View All 32 Rows |
Sex and Age in Park City
Sex and Age in Park City
The most populous age groups in Park City are 20 to 24 Years (422 | 9.8%) for men and 55 to 59 Years (474 | 11.6%) for women.
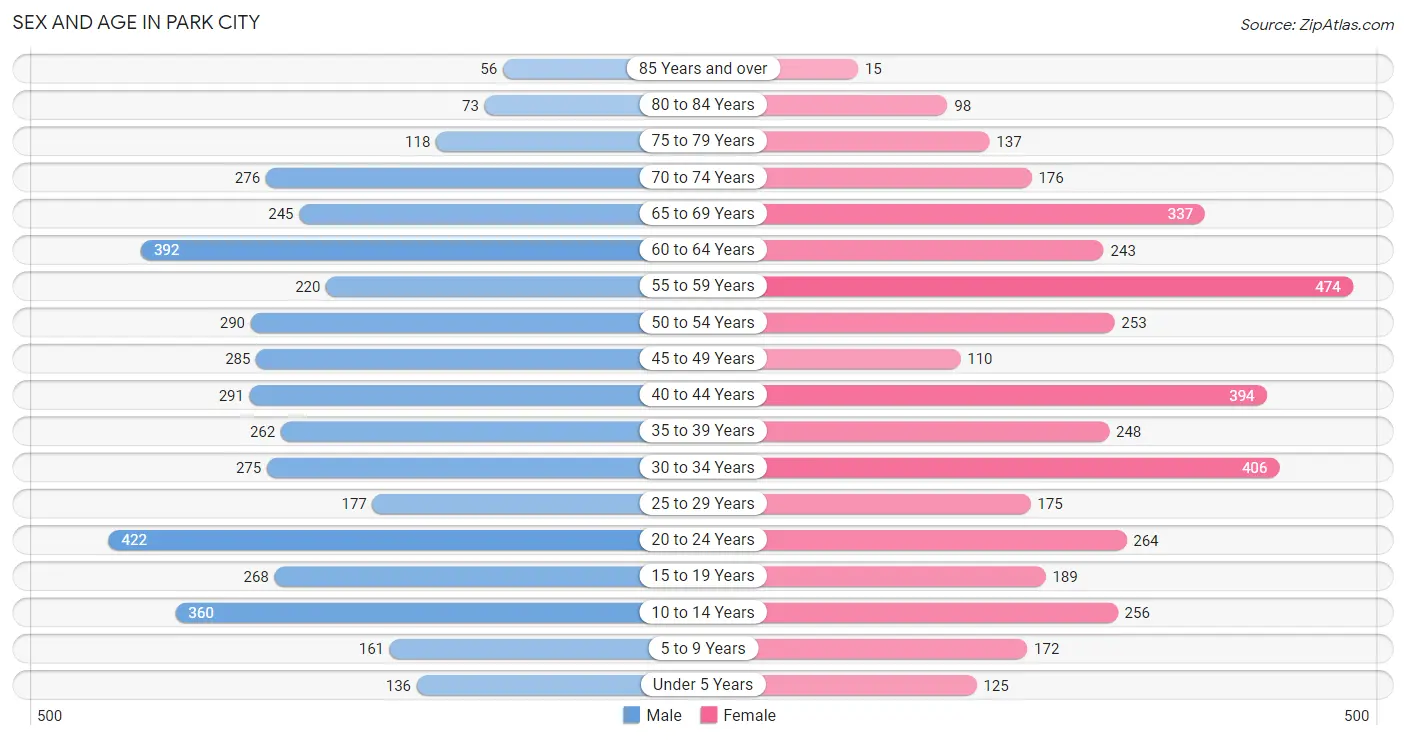
| Age Bracket | Male | Female |
| Under 5 Years | 136 (3.2%) | 125 (3.1%) |
| 5 to 9 Years | 161 (3.7%) | 172 (4.2%) |
| 10 to 14 Years | 360 (8.4%) | 256 (6.3%) |
| 15 to 19 Years | 268 (6.2%) | 189 (4.6%) |
| 20 to 24 Years | 422 (9.8%) | 264 (6.5%) |
| 25 to 29 Years | 177 (4.1%) | 175 (4.3%) |
| 30 to 34 Years | 275 (6.4%) | 406 (10.0%) |
| 35 to 39 Years | 262 (6.1%) | 248 (6.1%) |
| 40 to 44 Years | 291 (6.8%) | 394 (9.7%) |
| 45 to 49 Years | 285 (6.6%) | 110 (2.7%) |
| 50 to 54 Years | 290 (6.7%) | 253 (6.2%) |
| 55 to 59 Years | 220 (5.1%) | 474 (11.6%) |
| 60 to 64 Years | 392 (9.1%) | 243 (6.0%) |
| 65 to 69 Years | 245 (5.7%) | 337 (8.3%) |
| 70 to 74 Years | 276 (6.4%) | 176 (4.3%) |
| 75 to 79 Years | 118 (2.7%) | 137 (3.4%) |
| 80 to 84 Years | 73 (1.7%) | 98 (2.4%) |
| 85 Years and over | 56 (1.3%) | 15 (0.4%) |
| Total | 4,307 (100.0%) | 4,072 (100.0%) |
Families and Households in Park City
Median Family Size in Park City
The median family size in Park City is 3.21 persons per family, with single female/mother families (273 | 13.8%) accounting for the largest median family size of 4.88 persons per family. On the other hand, married-couple families (1,659 | 83.6%) represent the smallest median family size with 2.94 persons per family.
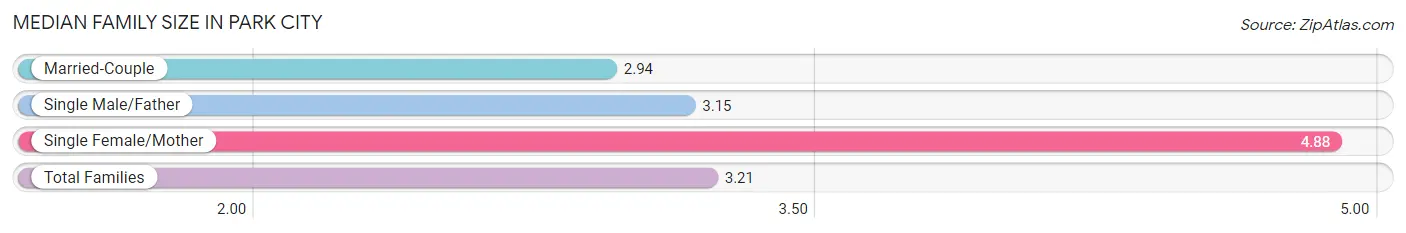
| Family Type | # Families | Family Size |
| Married-Couple | 1,659 (83.6%) | 2.94 |
| Single Male/Father | 52 (2.6%) | 3.15 |
| Single Female/Mother | 273 (13.8%) | 4.88 |
| Total Families | 1,984 (100.0%) | 3.21 |
Median Household Size in Park City
The median household size in Park City is 2.88 persons per household, with single female/mother households (273 | 9.5%) accounting for the largest median household size of 5.16 persons per household. non-family households (892 | 31.0%) represent the smallest median household size with 1.82 persons per household.
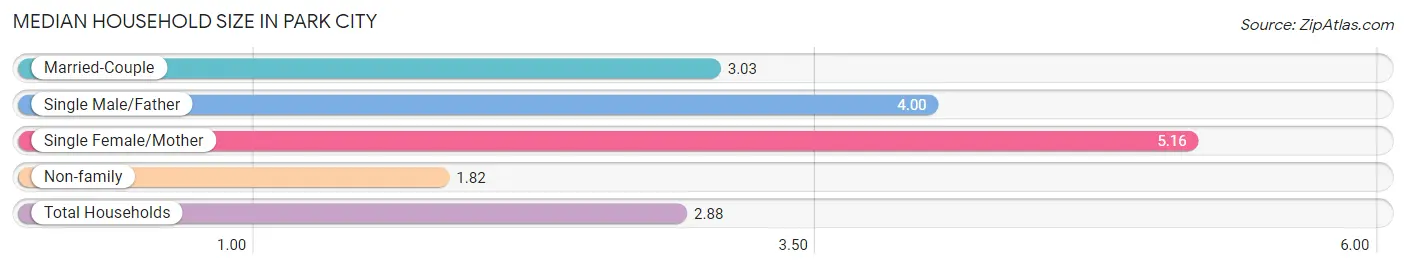
| Household Type | # Households | Household Size |
| Married-Couple | 1,659 (57.7%) | 3.03 |
| Single Male/Father | 52 (1.8%) | 4.00 |
| Single Female/Mother | 273 (9.5%) | 5.16 |
| Non-family | 892 (31.0%) | 1.82 |
| Total Households | 2,876 (100.0%) | 2.88 |
Household Size by Marriage Status in Park City
Out of a total of 2,876 households in Park City, 1,984 (69.0%) are family households, while 892 (31.0%) are nonfamily households. The most numerous type of family households are 2-person households, comprising 1,043, and the most common type of nonfamily households are 1-person households, comprising 706.
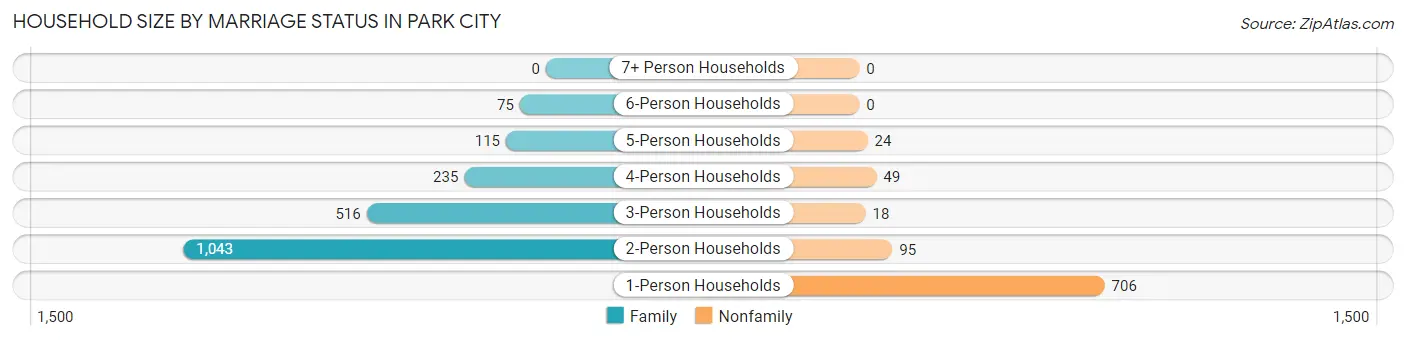
| Household Size | Family Households | Nonfamily Households |
| 1-Person Households | - | 706 (24.5%) |
| 2-Person Households | 1,043 (36.3%) | 95 (3.3%) |
| 3-Person Households | 516 (17.9%) | 18 (0.6%) |
| 4-Person Households | 235 (8.2%) | 49 (1.7%) |
| 5-Person Households | 115 (4.0%) | 24 (0.8%) |
| 6-Person Households | 75 (2.6%) | 0 (0.0%) |
| 7+ Person Households | 0 (0.0%) | 0 (0.0%) |
| Total | 1,984 (69.0%) | 892 (31.0%) |
Female Fertility in Park City
Fertility by Age in Park City
Average fertility rate in Park City is 5.0 births per 1,000 women. Women in the age bracket of 35 to 50 years have the highest fertility rate with 11.0 births per 1,000 women. Women in the age bracket of 35 to 50 years acount for 100.0% of all women with births.
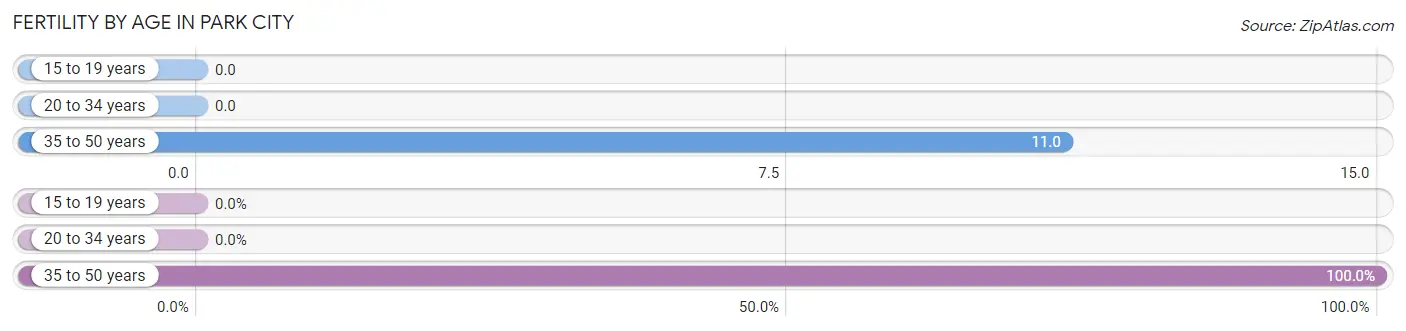
| Age Bracket | Women with Births | Births / 1,000 Women |
| 15 to 19 years | 0 (0.0%) | 0.0 |
| 20 to 34 years | 0 (0.0%) | 0.0 |
| 35 to 50 years | 10 (100.0%) | 11.0 |
| Total | 10 (100.0%) | 5.0 |
Fertility by Age by Marriage Status in Park City
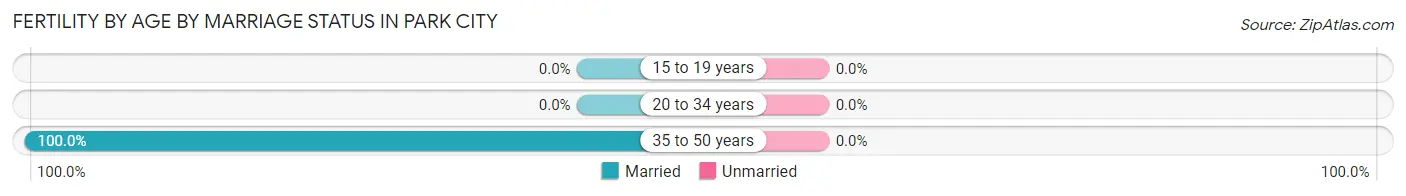
| Age Bracket | Married | Unmarried |
| 15 to 19 years | 0 (0.0%) | 0 (0.0%) |
| 20 to 34 years | 0 (0.0%) | 0 (0.0%) |
| 35 to 50 years | 10 (100.0%) | 0 (0.0%) |
| Total | 10 (100.0%) | 0 (0.0%) |
Fertility by Education in Park City
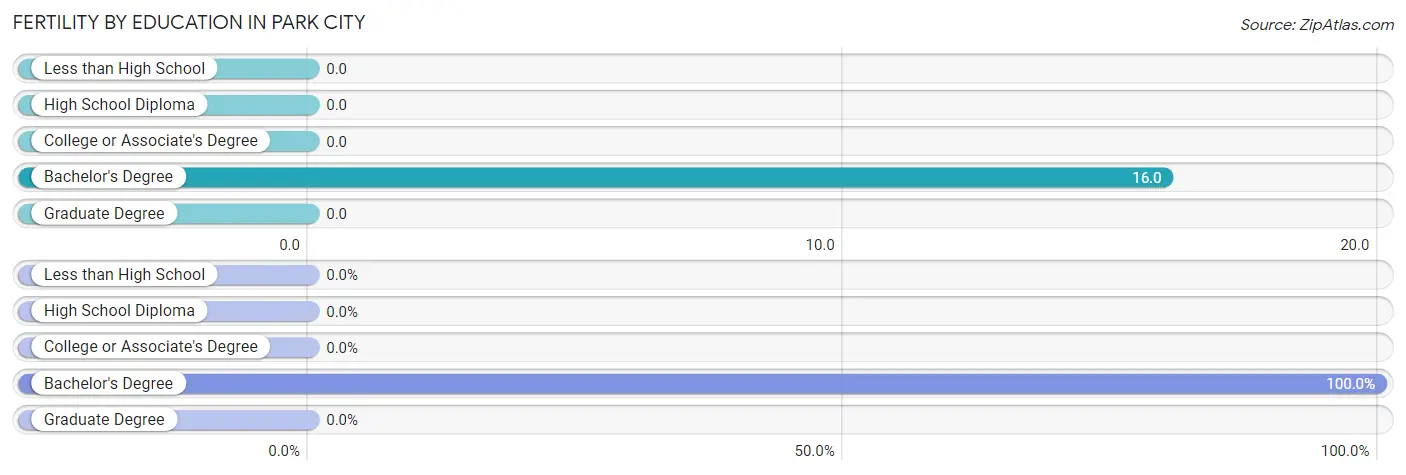
| Educational Attainment | Women with Births | Births / 1,000 Women |
| Less than High School | 0 (0.0%) | 0.0 |
| High School Diploma | 0 (0.0%) | 0.0 |
| College or Associate's Degree | 0 (0.0%) | 0.0 |
| Bachelor's Degree | 10 (100.0%) | 16.0 |
| Graduate Degree | 0 (0.0%) | 0.0 |
| Total | 10 (100.0%) | 5.0 |
Fertility by Education by Marriage Status in Park City
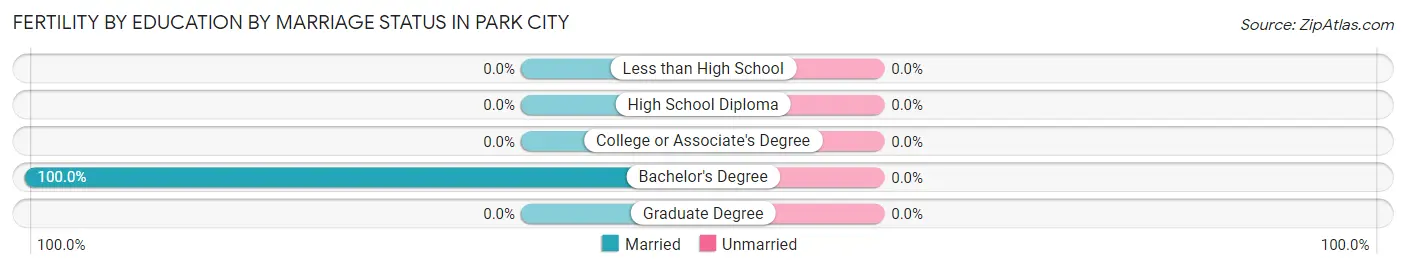
| Educational Attainment | Married | Unmarried |
| Less than High School | 0 (0.0%) | 0 (0.0%) |
| High School Diploma | 0 (0.0%) | 0 (0.0%) |
| College or Associate's Degree | 0 (0.0%) | 0 (0.0%) |
| Bachelor's Degree | 10 (100.0%) | 0 (0.0%) |
| Graduate Degree | 0 (0.0%) | 0 (0.0%) |
| Total | 10 (100.0%) | 0 (0.0%) |
Employment Characteristics in Park City
Employment by Class of Employer in Park City
Among the 4,917 employed individuals in Park City, private company employees (2,944 | 59.9%), self-employed (not incorporated) (560 | 11.4%), and not-for-profit organizations (435 | 8.8%) make up the most common classes of employment.
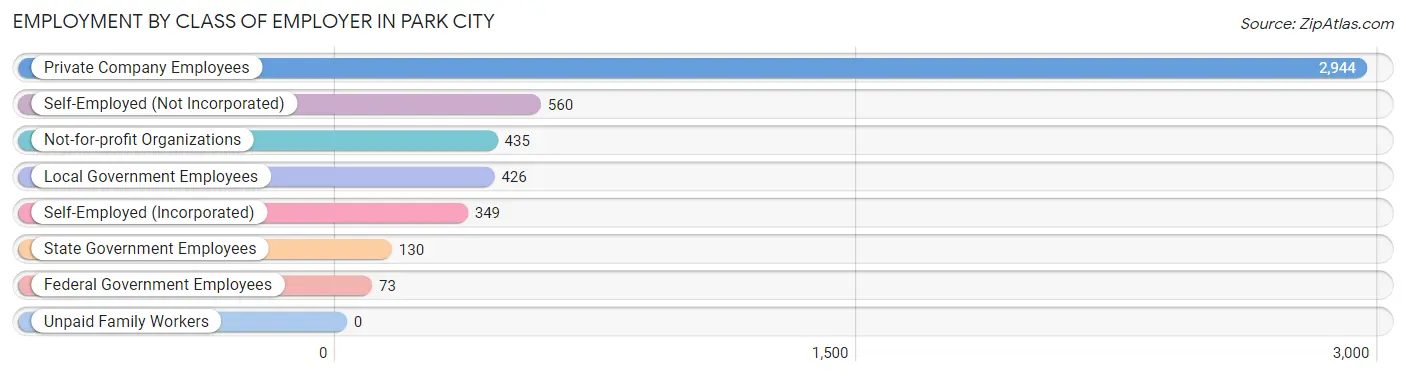
| Employer Class | # Employees | % Employees |
| Private Company Employees | 2,944 | 59.9% |
| Self-Employed (Incorporated) | 349 | 7.1% |
| Self-Employed (Not Incorporated) | 560 | 11.4% |
| Not-for-profit Organizations | 435 | 8.8% |
| Local Government Employees | 426 | 8.7% |
| State Government Employees | 130 | 2.6% |
| Federal Government Employees | 73 | 1.5% |
| Unpaid Family Workers | 0 | 0.0% |
| Total | 4,917 | 100.0% |
Employment Status by Age in Park City
According to the labor force statistics for Park City, out of the total population over 16 years of age (7,130), 71.6% or 5,105 individuals are in the labor force, with 1.2% or 61 of them unemployed. The age group with the highest labor force participation rate is 30 to 34 years, with 97.5% or 664 individuals in the labor force. Within the labor force, the 45 to 54 years age range has the highest percentage of unemployed individuals, with 5.0% or 38 of them being unemployed.
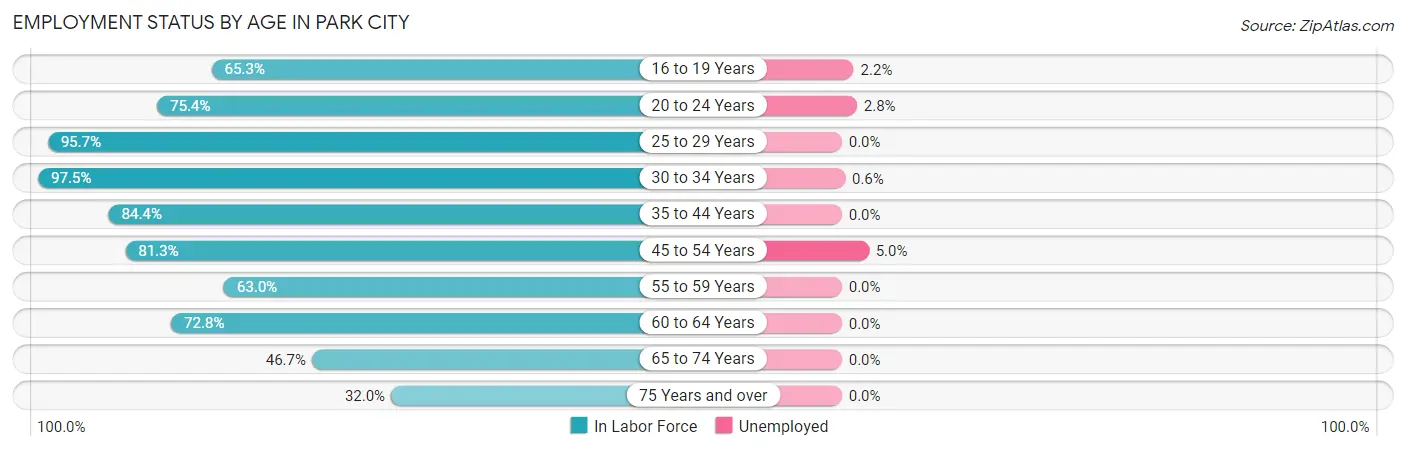
| Age Bracket | In Labor Force | Unemployed |
| 16 to 19 Years | 273 (65.3%) | 6 (2.2%) |
| 20 to 24 Years | 517 (75.4%) | 14 (2.8%) |
| 25 to 29 Years | 337 (95.7%) | 0 (0.0%) |
| 30 to 34 Years | 664 (97.5%) | 4 (0.6%) |
| 35 to 44 Years | 1,009 (84.4%) | 0 (0.0%) |
| 45 to 54 Years | 763 (81.3%) | 38 (5.0%) |
| 55 to 59 Years | 437 (63.0%) | 0 (0.0%) |
| 60 to 64 Years | 462 (72.8%) | 0 (0.0%) |
| 65 to 74 Years | 483 (46.7%) | 0 (0.0%) |
| 75 Years and over | 159 (32.0%) | 0 (0.0%) |
| Total | 5,105 (71.6%) | 61 (1.2%) |
Employment Status by Educational Attainment in Park City
According to labor force statistics for Park City, 81.7% of individuals (3,672) out of the total population between 25 and 64 years of age (4,495) are in the labor force, with 1.1% or 40 of them being unemployed. The group with the highest labor force participation rate are those with the educational attainment of less than high school, with 100.0% or 77 individuals in the labor force. Within the labor force, individuals with bachelor's degree or higher education have the highest percentage of unemployment, with 1.8% or 41 of them being unemployed.
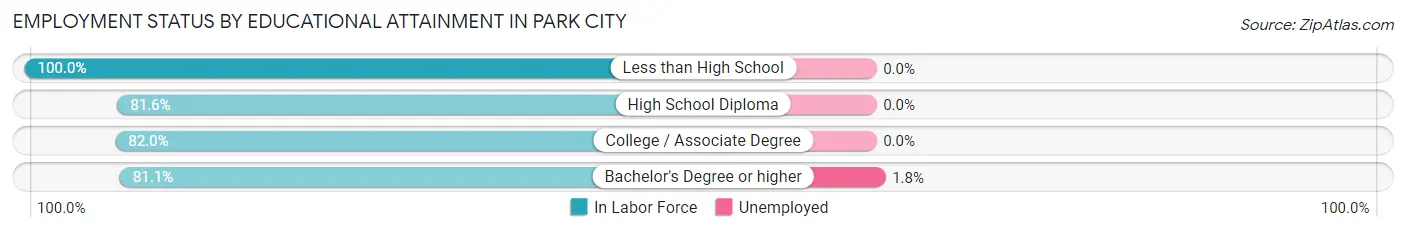
| Educational Attainment | In Labor Force | Unemployed |
| Less than High School | 77 (100.0%) | 0 (0.0%) |
| High School Diploma | 642 (81.6%) | 0 (0.0%) |
| College / Associate Degree | 657 (82.0%) | 0 (0.0%) |
| Bachelor's Degree or higher | 2,295 (81.1%) | 51 (1.8%) |
| Total | 3,672 (81.7%) | 49 (1.1%) |
Employment Occupations by Sex in Park City
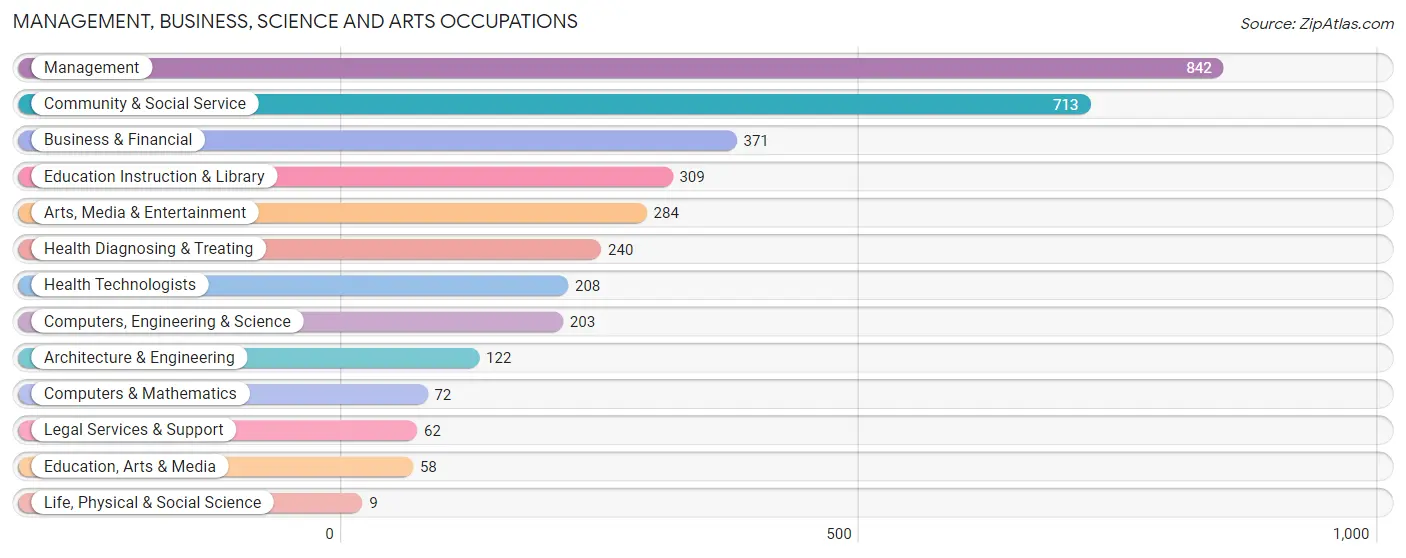
Management, Business, Science and Arts Occupations
The most common Management, Business, Science and Arts occupations in Park City are Management (842 | 16.8%), Community & Social Service (713 | 14.2%), Business & Financial (371 | 7.4%), Education Instruction & Library (309 | 6.1%), and Arts, Media & Entertainment (284 | 5.7%).
Management, Business, Science and Arts Occupations by Sex
Within the Management, Business, Science and Arts occupations in Park City, the most male-oriented occupations are Architecture & Engineering (100.0%), Life, Physical & Social Science (100.0%), and Computers, Engineering & Science (85.2%), while the most female-oriented occupations are Health Diagnosing & Treating (81.2%), Education Instruction & Library (80.3%), and Health Technologists (78.4%).
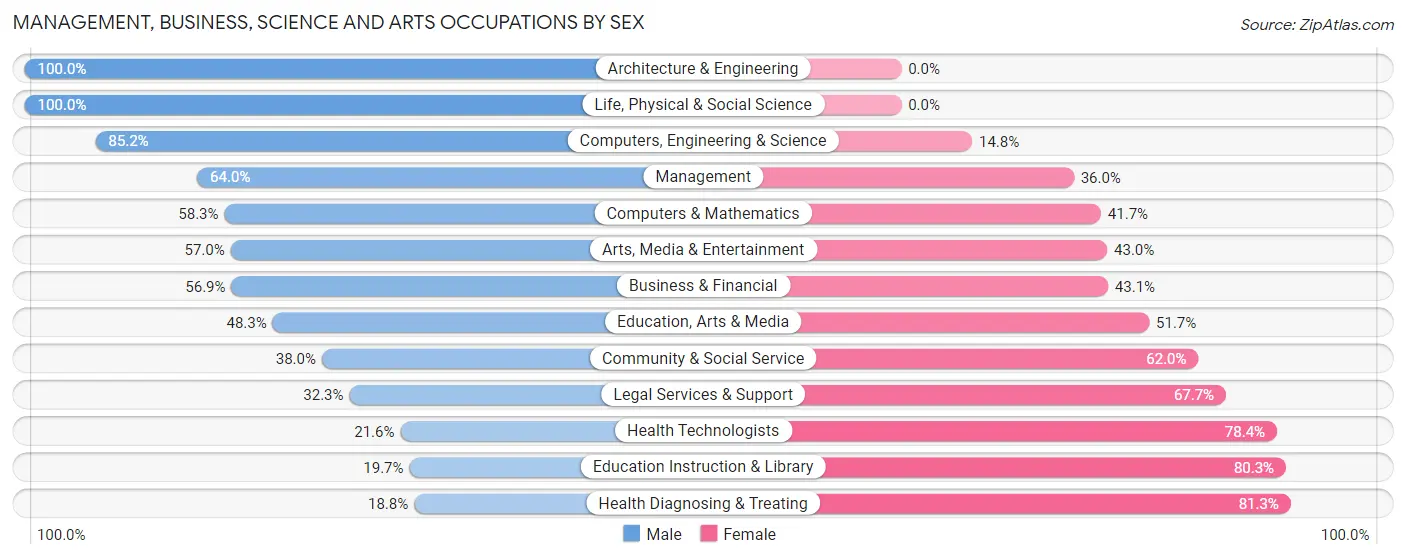
| Occupation | Male | Female |
| Management | 539 (64.0%) | 303 (36.0%) |
| Business & Financial | 211 (56.9%) | 160 (43.1%) |
| Computers, Engineering & Science | 173 (85.2%) | 30 (14.8%) |
| Computers & Mathematics | 42 (58.3%) | 30 (41.7%) |
| Architecture & Engineering | 122 (100.0%) | 0 (0.0%) |
| Life, Physical & Social Science | 9 (100.0%) | 0 (0.0%) |
| Community & Social Service | 271 (38.0%) | 442 (62.0%) |
| Education, Arts & Media | 28 (48.3%) | 30 (51.7%) |
| Legal Services & Support | 20 (32.3%) | 42 (67.7%) |
| Education Instruction & Library | 61 (19.7%) | 248 (80.3%) |
| Arts, Media & Entertainment | 162 (57.0%) | 122 (43.0%) |
| Health Diagnosing & Treating | 45 (18.8%) | 195 (81.2%) |
| Health Technologists | 45 (21.6%) | 163 (78.4%) |
| Total (Category) | 1,239 (52.3%) | 1,130 (47.7%) |
| Total (Overall) | 2,635 (52.5%) | 2,388 (47.5%) |
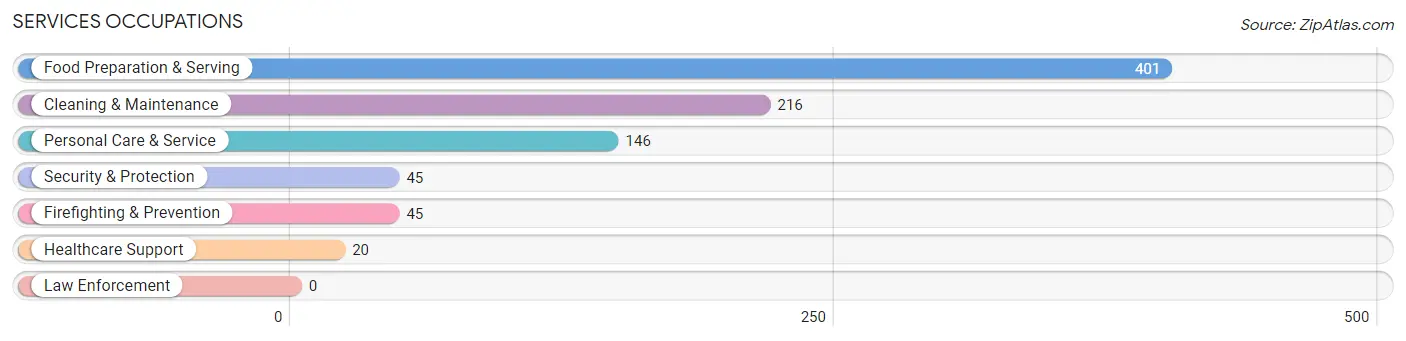
Services Occupations
The most common Services occupations in Park City are Food Preparation & Serving (401 | 8.0%), Cleaning & Maintenance (216 | 4.3%), Personal Care & Service (146 | 2.9%), Security & Protection (45 | 0.9%), and Firefighting & Prevention (45 | 0.9%).
Services Occupations by Sex
Within the Services occupations in Park City, the most male-oriented occupations are Security & Protection (100.0%), Firefighting & Prevention (100.0%), and Cleaning & Maintenance (37.0%), while the most female-oriented occupations are Healthcare Support (100.0%), Personal Care & Service (65.1%), and Food Preparation & Serving (63.1%).
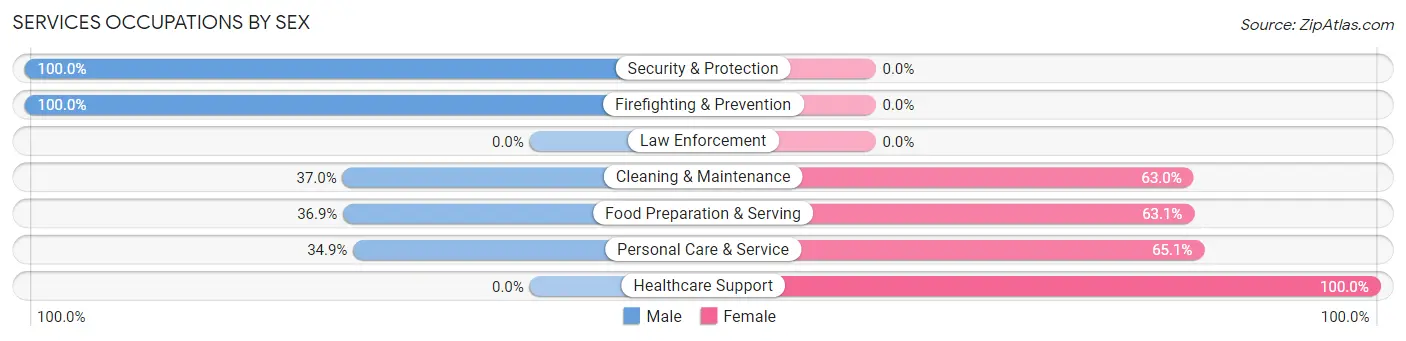
| Occupation | Male | Female |
| Healthcare Support | 0 (0.0%) | 20 (100.0%) |
| Security & Protection | 45 (100.0%) | 0 (0.0%) |
| Firefighting & Prevention | 45 (100.0%) | 0 (0.0%) |
| Law Enforcement | 0 (0.0%) | 0 (0.0%) |
| Food Preparation & Serving | 148 (36.9%) | 253 (63.1%) |
| Cleaning & Maintenance | 80 (37.0%) | 136 (63.0%) |
| Personal Care & Service | 51 (34.9%) | 95 (65.1%) |
| Total (Category) | 324 (39.1%) | 504 (60.9%) |
| Total (Overall) | 2,635 (52.5%) | 2,388 (47.5%) |
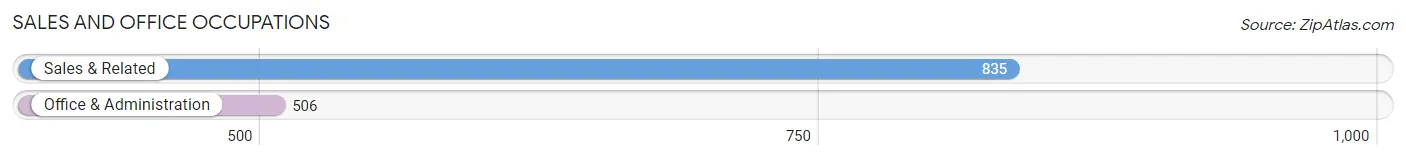
Sales and Office Occupations
The most common Sales and Office occupations in Park City are Sales & Related (835 | 16.6%), and Office & Administration (506 | 10.1%).
Sales and Office Occupations by Sex
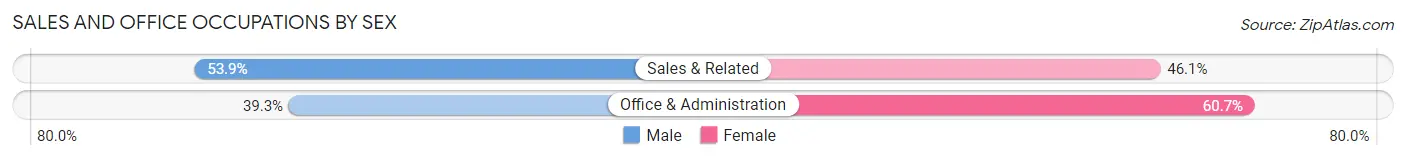
| Occupation | Male | Female |
| Sales & Related | 450 (53.9%) | 385 (46.1%) |
| Office & Administration | 199 (39.3%) | 307 (60.7%) |
| Total (Category) | 649 (48.4%) | 692 (51.6%) |
| Total (Overall) | 2,635 (52.5%) | 2,388 (47.5%) |
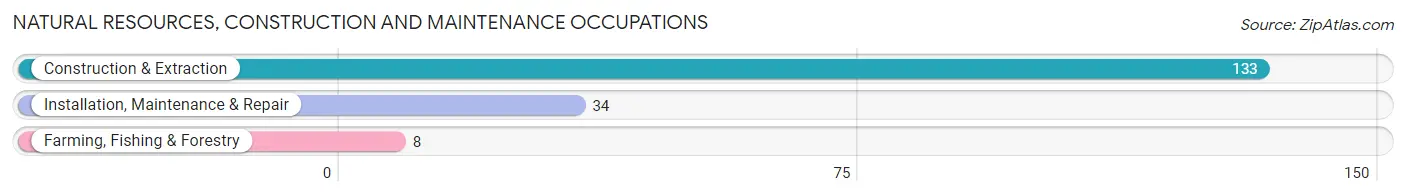
Natural Resources, Construction and Maintenance Occupations
The most common Natural Resources, Construction and Maintenance occupations in Park City are Construction & Extraction (133 | 2.6%), Installation, Maintenance & Repair (34 | 0.7%), and Farming, Fishing & Forestry (8 | 0.2%).
Natural Resources, Construction and Maintenance Occupations by Sex
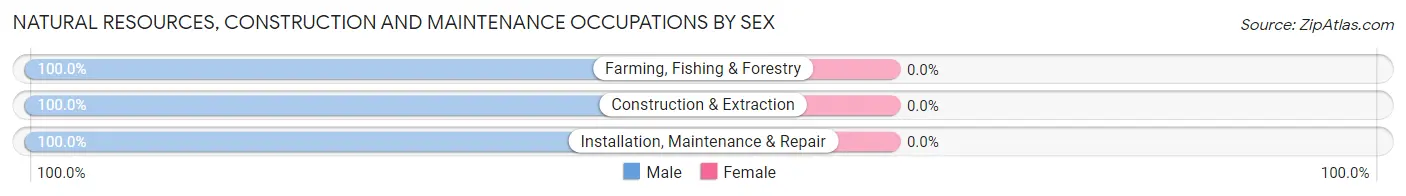
| Occupation | Male | Female |
| Farming, Fishing & Forestry | 8 (100.0%) | 0 (0.0%) |
| Construction & Extraction | 133 (100.0%) | 0 (0.0%) |
| Installation, Maintenance & Repair | 34 (100.0%) | 0 (0.0%) |
| Total (Category) | 175 (100.0%) | 0 (0.0%) |
| Total (Overall) | 2,635 (52.5%) | 2,388 (47.5%) |
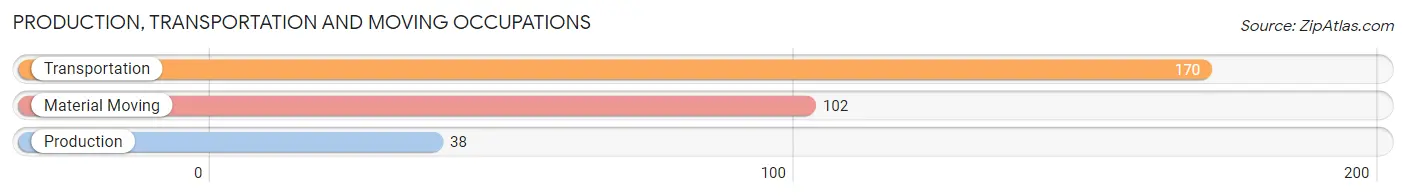
Production, Transportation and Moving Occupations
The most common Production, Transportation and Moving occupations in Park City are Transportation (170 | 3.4%), Material Moving (102 | 2.0%), and Production (38 | 0.8%).
Production, Transportation and Moving Occupations by Sex
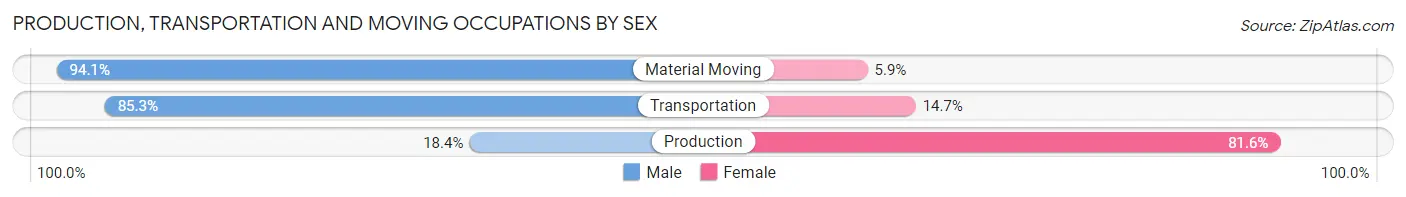
| Occupation | Male | Female |
| Production | 7 (18.4%) | 31 (81.6%) |
| Transportation | 145 (85.3%) | 25 (14.7%) |
| Material Moving | 96 (94.1%) | 6 (5.9%) |
| Total (Category) | 248 (80.0%) | 62 (20.0%) |
| Total (Overall) | 2,635 (52.5%) | 2,388 (47.5%) |
Employment Industries by Sex in Park City
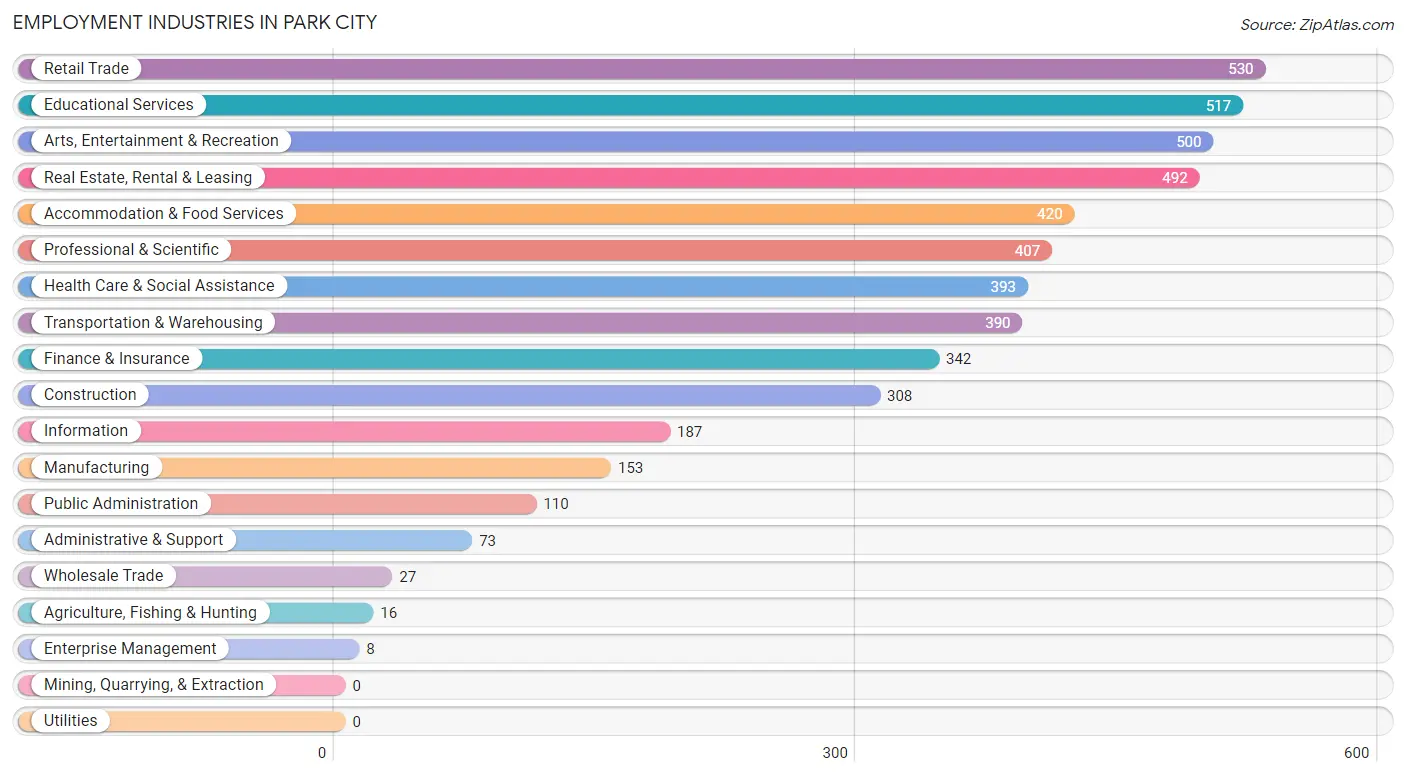
Employment Industries in Park City
The major employment industries in Park City include Retail Trade (530 | 10.5%), Educational Services (517 | 10.3%), Arts, Entertainment & Recreation (500 | 10.0%), Real Estate, Rental & Leasing (492 | 9.8%), and Accommodation & Food Services (420 | 8.4%).
Employment Industries by Sex in Park City
The Park City industries that see more men than women are Agriculture, Fishing & Hunting (100.0%), Wholesale Trade (100.0%), and Construction (97.1%), whereas the industries that tend to have a higher number of women are Enterprise Management (100.0%), Administrative & Support (94.5%), and Health Care & Social Assistance (87.5%).
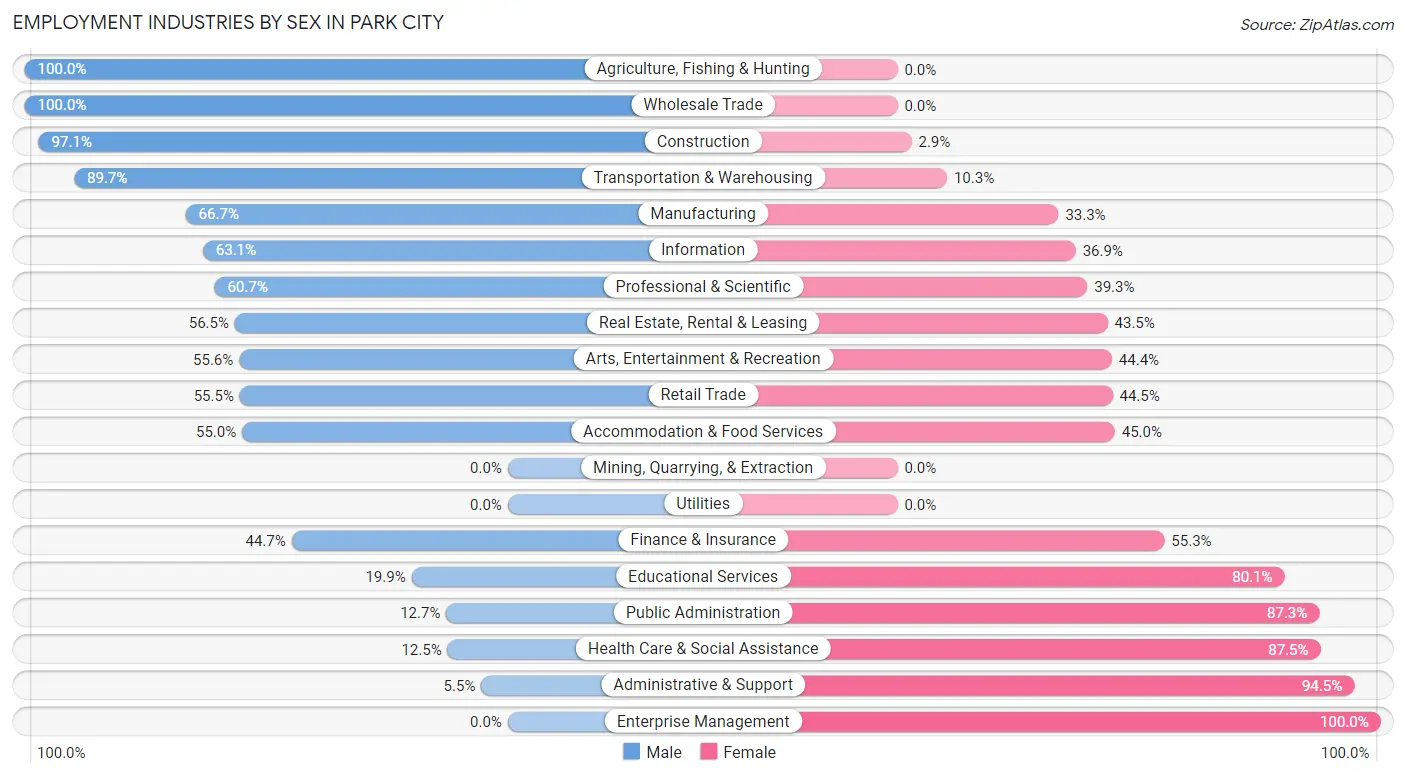
| Industry | Male | Female |
| Agriculture, Fishing & Hunting | 16 (100.0%) | 0 (0.0%) |
| Mining, Quarrying, & Extraction | 0 (0.0%) | 0 (0.0%) |
| Construction | 299 (97.1%) | 9 (2.9%) |
| Manufacturing | 102 (66.7%) | 51 (33.3%) |
| Wholesale Trade | 27 (100.0%) | 0 (0.0%) |
| Retail Trade | 294 (55.5%) | 236 (44.5%) |
| Transportation & Warehousing | 350 (89.7%) | 40 (10.3%) |
| Utilities | 0 (0.0%) | 0 (0.0%) |
| Information | 118 (63.1%) | 69 (36.9%) |
| Finance & Insurance | 153 (44.7%) | 189 (55.3%) |
| Real Estate, Rental & Leasing | 278 (56.5%) | 214 (43.5%) |
| Professional & Scientific | 247 (60.7%) | 160 (39.3%) |
| Enterprise Management | 0 (0.0%) | 8 (100.0%) |
| Administrative & Support | 4 (5.5%) | 69 (94.5%) |
| Educational Services | 103 (19.9%) | 414 (80.1%) |
| Health Care & Social Assistance | 49 (12.5%) | 344 (87.5%) |
| Arts, Entertainment & Recreation | 278 (55.6%) | 222 (44.4%) |
| Accommodation & Food Services | 231 (55.0%) | 189 (45.0%) |
| Public Administration | 14 (12.7%) | 96 (87.3%) |
| Total | 2,635 (52.5%) | 2,388 (47.5%) |
Education in Park City
School Enrollment in Park City
The most common levels of schooling among the 1,802 students in Park City are college / undergraduate (583 | 32.4%), middle school (485 | 26.9%), and high school (363 | 20.1%).
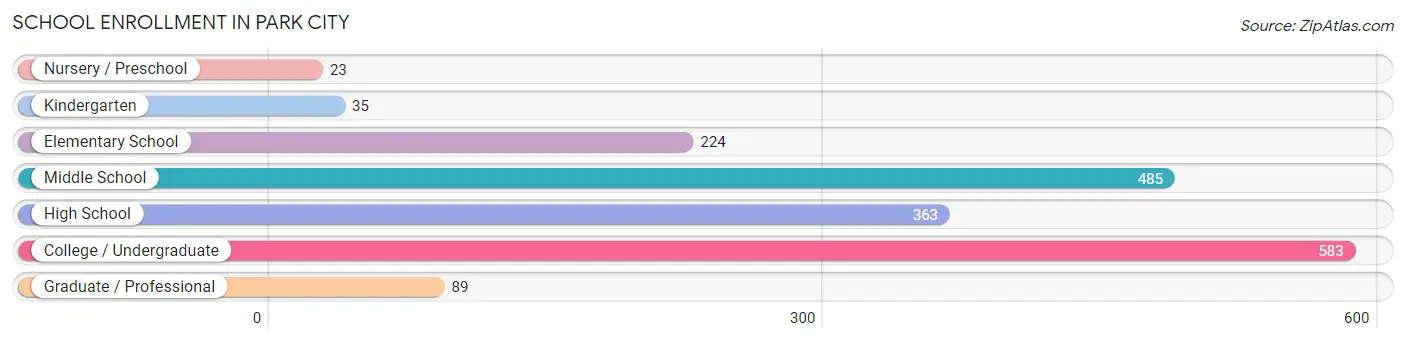
| School Level | # Students | % Students |
| Nursery / Preschool | 23 | 1.3% |
| Kindergarten | 35 | 1.9% |
| Elementary School | 224 | 12.4% |
| Middle School | 485 | 26.9% |
| High School | 363 | 20.1% |
| College / Undergraduate | 583 | 32.4% |
| Graduate / Professional | 89 | 4.9% |
| Total | 1,802 | 100.0% |
School Enrollment by Age by Funding Source in Park City
Out of a total of 1,802 students who are enrolled in schools in Park City, 299 (16.6%) attend a private institution, while the remaining 1,503 (83.4%) are enrolled in public schools. The age group of 3 to 4 year olds has the highest likelihood of being enrolled in private schools, with 15 (100.0% in the age bracket) enrolled. Conversely, the age group of 5 to 9 year old has the lowest likelihood of being enrolled in a private school, with 247 (100.0% in the age bracket) attending a public institution.
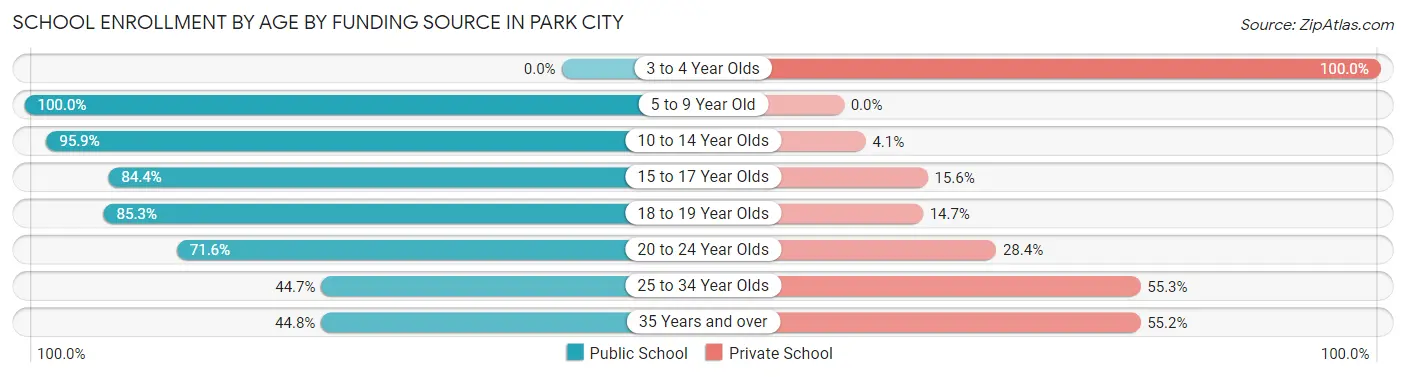
| Age Bracket | Public School | Private School |
| 3 to 4 Year Olds | 0 (0.0%) | 15 (100.0%) |
| 5 to 9 Year Old | 247 (100.0%) | 0 (0.0%) |
| 10 to 14 Year Olds | 591 (95.9%) | 25 (4.1%) |
| 15 to 17 Year Olds | 189 (84.4%) | 35 (15.6%) |
| 18 to 19 Year Olds | 139 (85.3%) | 24 (14.7%) |
| 20 to 24 Year Olds | 255 (71.6%) | 101 (28.4%) |
| 25 to 34 Year Olds | 17 (44.7%) | 21 (55.3%) |
| 35 Years and over | 64 (44.8%) | 79 (55.2%) |
| Total | 1,503 (83.4%) | 299 (16.6%) |
Educational Attainment by Field of Study in Park City
Business (1,104 | 26.0%), social sciences (483 | 11.4%), science & technology (447 | 10.5%), education (410 | 9.7%), and bio, nature & agricultural (266 | 6.3%) are the most common fields of study among 4,241 individuals in Park City who have obtained a bachelor's degree or higher.
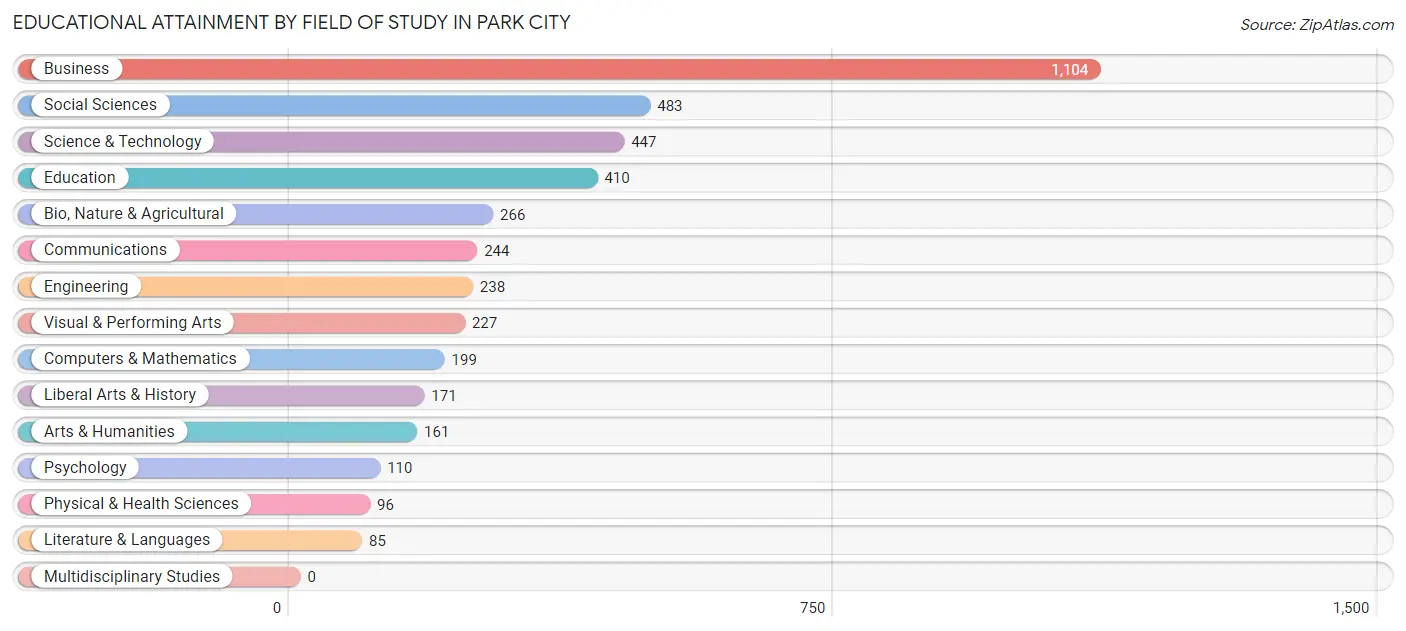
| Field of Study | # Graduates | % Graduates |
| Computers & Mathematics | 199 | 4.7% |
| Bio, Nature & Agricultural | 266 | 6.3% |
| Physical & Health Sciences | 96 | 2.3% |
| Psychology | 110 | 2.6% |
| Social Sciences | 483 | 11.4% |
| Engineering | 238 | 5.6% |
| Multidisciplinary Studies | 0 | 0.0% |
| Science & Technology | 447 | 10.5% |
| Business | 1,104 | 26.0% |
| Education | 410 | 9.7% |
| Literature & Languages | 85 | 2.0% |
| Liberal Arts & History | 171 | 4.0% |
| Visual & Performing Arts | 227 | 5.3% |
| Communications | 244 | 5.8% |
| Arts & Humanities | 161 | 3.8% |
| Total | 4,241 | 100.0% |
Transportation & Commute in Park City
Vehicle Availability by Sex in Park City
The most prevalent vehicle ownership categories in Park City are males with 2 vehicles (994, accounting for 38.6%) and females with 2 vehicles (779, making up 44.4%).
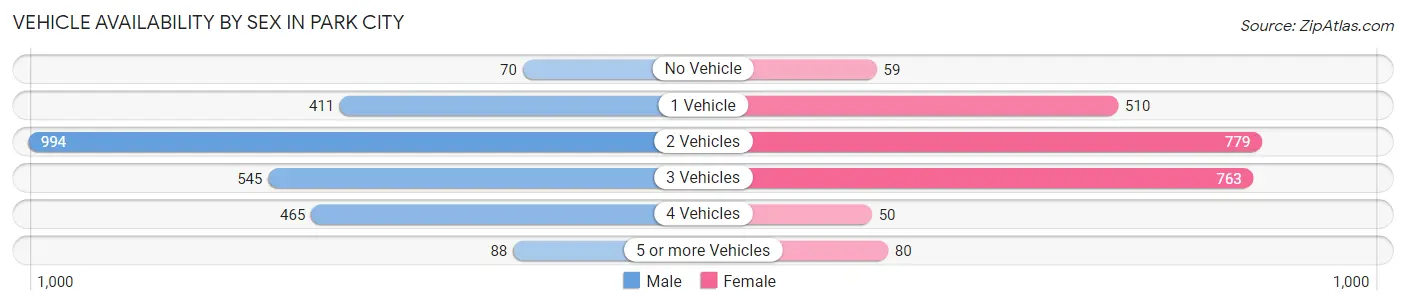
| Vehicles Available | Male | Female |
| No Vehicle | 70 (2.7%) | 59 (2.6%) |
| 1 Vehicle | 411 (16.0%) | 510 (22.8%) |
| 2 Vehicles | 994 (38.6%) | 779 (34.8%) |
| 3 Vehicles | 545 (21.2%) | 763 (34.1%) |
| 4 Vehicles | 465 (18.1%) | 50 (2.2%) |
| 5 or more Vehicles | 88 (3.4%) | 80 (3.6%) |
| Total | 2,573 (100.0%) | 2,241 (100.0%) |
Commute Time in Park City
The most frequently occuring commute durations in Park City are 5 to 9 minutes (1,235 commuters, 30.7%), 10 to 14 minutes (860 commuters, 21.3%), and 15 to 19 minutes (665 commuters, 16.5%).
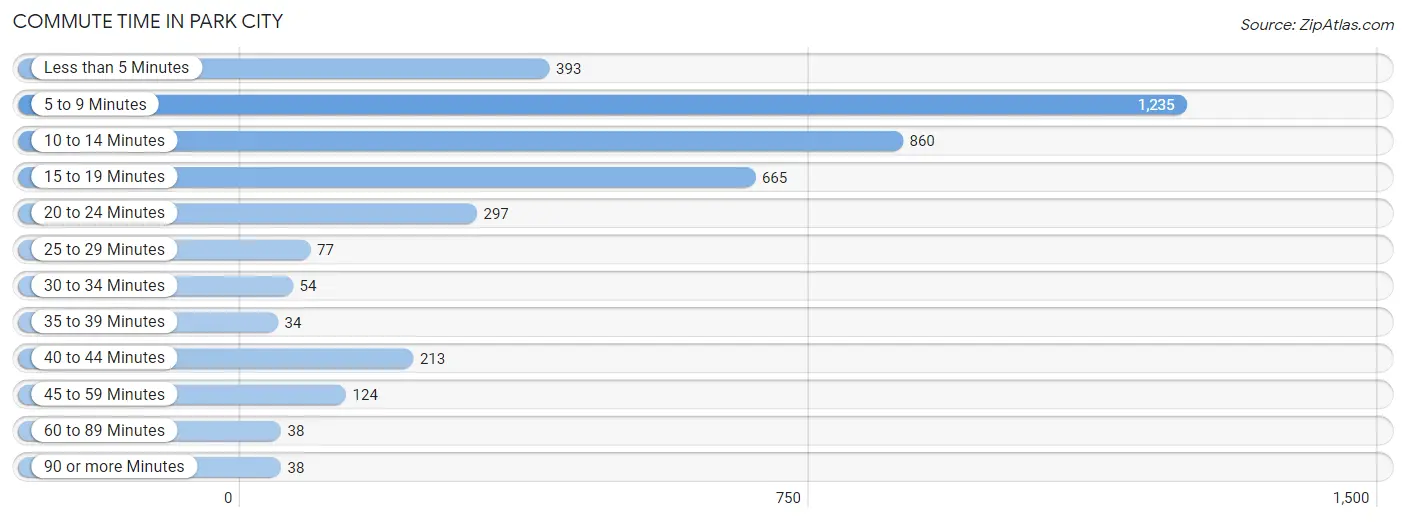
| Commute Time | # Commuters | % Commuters |
| Less than 5 Minutes | 393 | 9.8% |
| 5 to 9 Minutes | 1,235 | 30.7% |
| 10 to 14 Minutes | 860 | 21.3% |
| 15 to 19 Minutes | 665 | 16.5% |
| 20 to 24 Minutes | 297 | 7.4% |
| 25 to 29 Minutes | 77 | 1.9% |
| 30 to 34 Minutes | 54 | 1.3% |
| 35 to 39 Minutes | 34 | 0.8% |
| 40 to 44 Minutes | 213 | 5.3% |
| 45 to 59 Minutes | 124 | 3.1% |
| 60 to 89 Minutes | 38 | 0.9% |
| 90 or more Minutes | 38 | 0.9% |
Commute Time by Sex in Park City
The most common commute times in Park City are 5 to 9 minutes (529 commuters, 25.6%) for males and 5 to 9 minutes (706 commuters, 36.0%) for females.
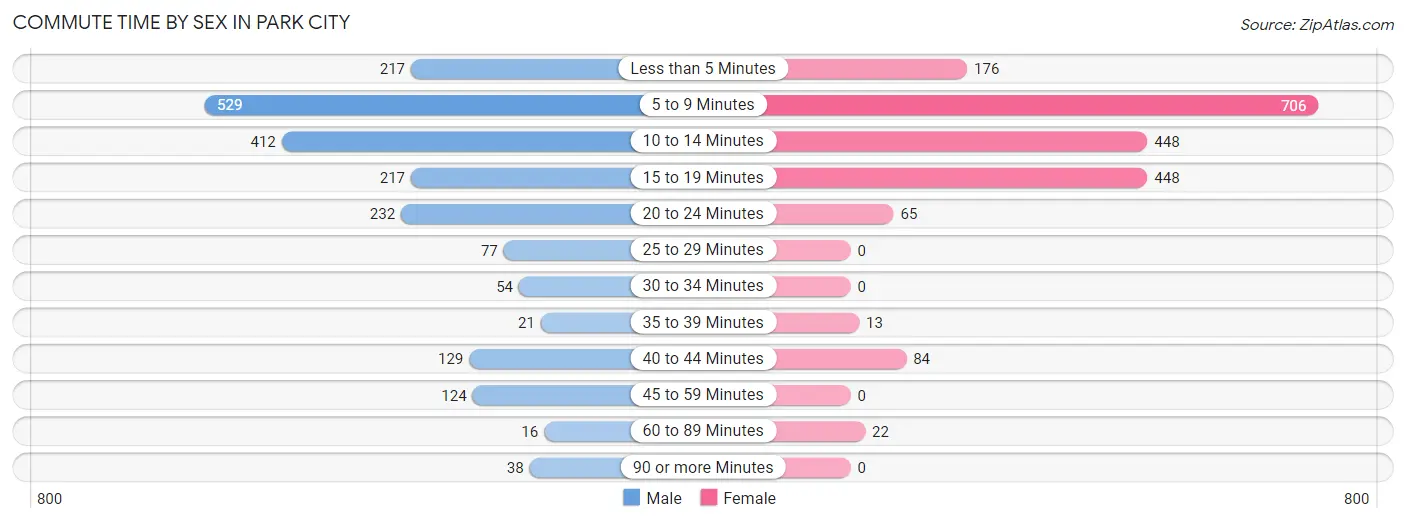
| Commute Time | Male | Female |
| Less than 5 Minutes | 217 (10.5%) | 176 (9.0%) |
| 5 to 9 Minutes | 529 (25.6%) | 706 (36.0%) |
| 10 to 14 Minutes | 412 (19.9%) | 448 (22.8%) |
| 15 to 19 Minutes | 217 (10.5%) | 448 (22.8%) |
| 20 to 24 Minutes | 232 (11.2%) | 65 (3.3%) |
| 25 to 29 Minutes | 77 (3.7%) | 0 (0.0%) |
| 30 to 34 Minutes | 54 (2.6%) | 0 (0.0%) |
| 35 to 39 Minutes | 21 (1.0%) | 13 (0.7%) |
| 40 to 44 Minutes | 129 (6.2%) | 84 (4.3%) |
| 45 to 59 Minutes | 124 (6.0%) | 0 (0.0%) |
| 60 to 89 Minutes | 16 (0.8%) | 22 (1.1%) |
| 90 or more Minutes | 38 (1.8%) | 0 (0.0%) |
Time of Departure to Work by Sex in Park City
The most frequent times of departure to work in Park City are 7:30 AM to 7:59 AM (373, 18.0%) for males and 8:30 AM to 8:59 AM (288, 14.7%) for females.
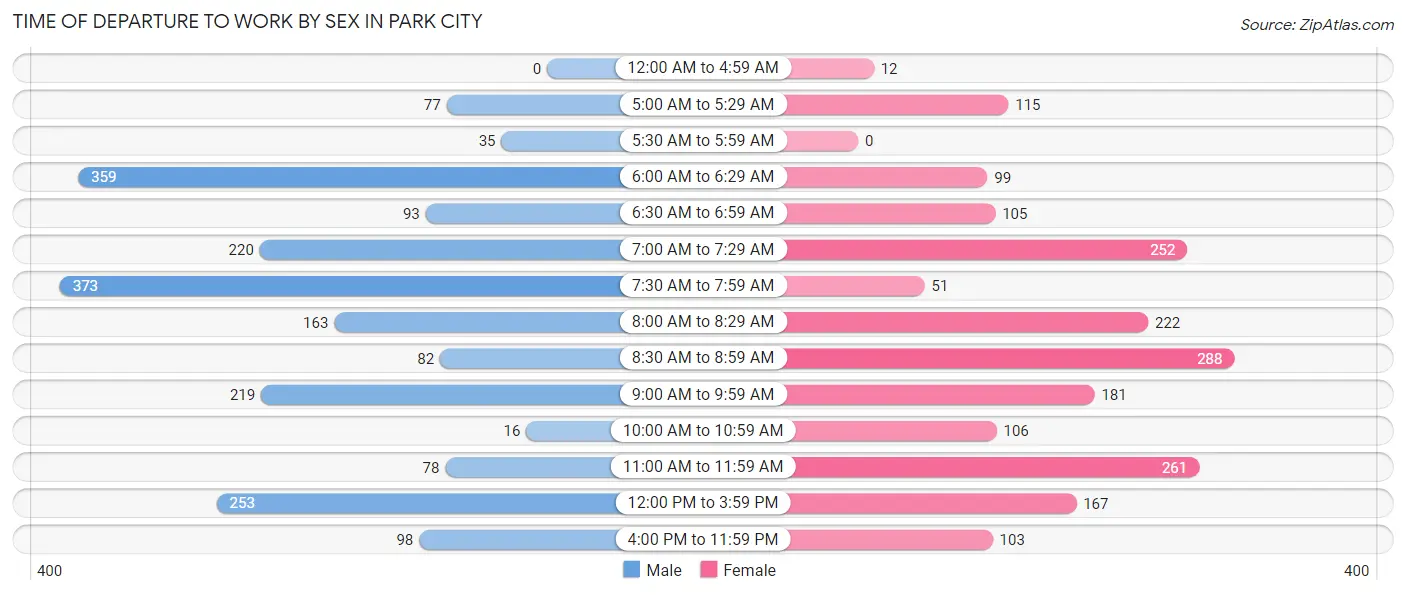
| Time of Departure | Male | Female |
| 12:00 AM to 4:59 AM | 0 (0.0%) | 12 (0.6%) |
| 5:00 AM to 5:29 AM | 77 (3.7%) | 115 (5.9%) |
| 5:30 AM to 5:59 AM | 35 (1.7%) | 0 (0.0%) |
| 6:00 AM to 6:29 AM | 359 (17.4%) | 99 (5.1%) |
| 6:30 AM to 6:59 AM | 93 (4.5%) | 105 (5.3%) |
| 7:00 AM to 7:29 AM | 220 (10.6%) | 252 (12.8%) |
| 7:30 AM to 7:59 AM | 373 (18.0%) | 51 (2.6%) |
| 8:00 AM to 8:29 AM | 163 (7.9%) | 222 (11.3%) |
| 8:30 AM to 8:59 AM | 82 (4.0%) | 288 (14.7%) |
| 9:00 AM to 9:59 AM | 219 (10.6%) | 181 (9.2%) |
| 10:00 AM to 10:59 AM | 16 (0.8%) | 106 (5.4%) |
| 11:00 AM to 11:59 AM | 78 (3.8%) | 261 (13.3%) |
| 12:00 PM to 3:59 PM | 253 (12.2%) | 167 (8.5%) |
| 4:00 PM to 11:59 PM | 98 (4.7%) | 103 (5.2%) |
| Total | 2,066 (100.0%) | 1,962 (100.0%) |
Housing Occupancy in Park City
Occupancy by Ownership in Park City
Of the total 2,876 dwellings in Park City, owner-occupied units account for 2,163 (75.2%), while renter-occupied units make up 713 (24.8%).
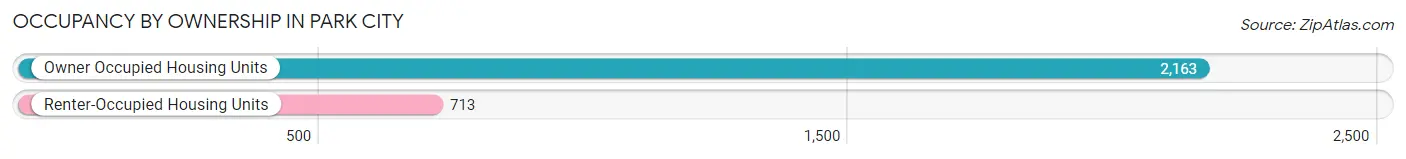
| Occupancy | # Housing Units | % Housing Units |
| Owner Occupied Housing Units | 2,163 | 75.2% |
| Renter-Occupied Housing Units | 713 | 24.8% |
| Total Occupied Housing Units | 2,876 | 100.0% |
Occupancy by Household Size in Park City
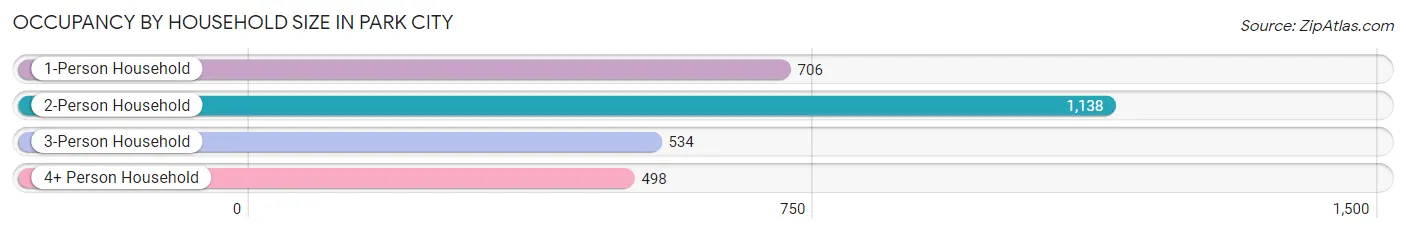
| Household Size | # Housing Units | % Housing Units |
| 1-Person Household | 706 | 24.5% |
| 2-Person Household | 1,138 | 39.6% |
| 3-Person Household | 534 | 18.6% |
| 4+ Person Household | 498 | 17.3% |
| Total Housing Units | 2,876 | 100.0% |
Occupancy by Ownership by Household Size in Park City
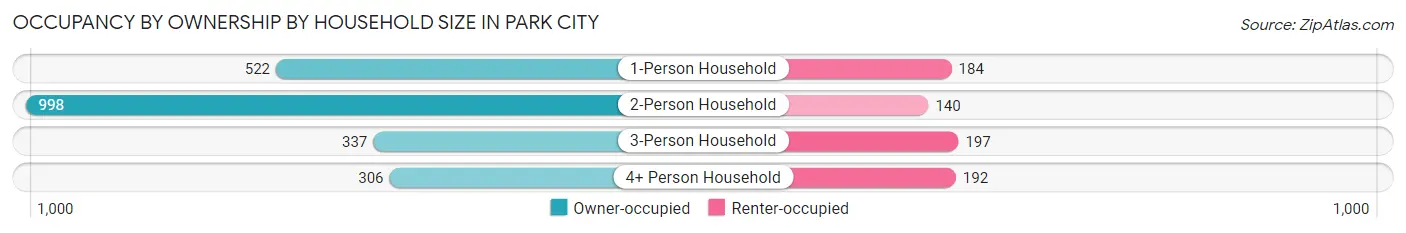
| Household Size | Owner-occupied | Renter-occupied |
| 1-Person Household | 522 (73.9%) | 184 (26.1%) |
| 2-Person Household | 998 (87.7%) | 140 (12.3%) |
| 3-Person Household | 337 (63.1%) | 197 (36.9%) |
| 4+ Person Household | 306 (61.5%) | 192 (38.6%) |
| Total Housing Units | 2,163 (75.2%) | 713 (24.8%) |
Occupancy by Educational Attainment in Park City
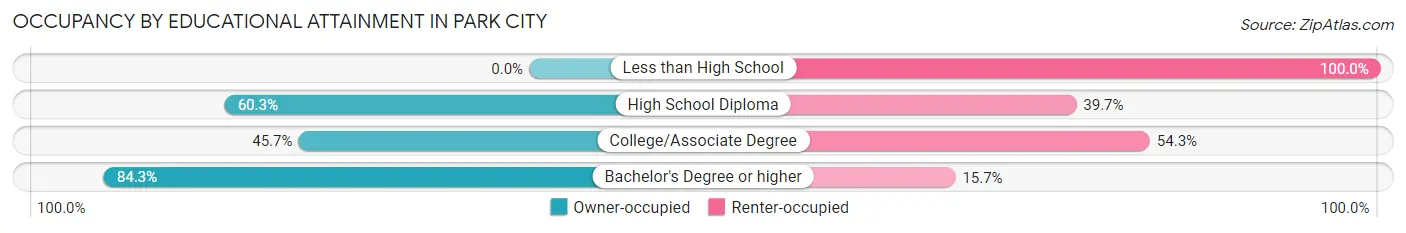
| Household Size | Owner-occupied | Renter-occupied |
| Less than High School | 0 (0.0%) | 10 (100.0%) |
| High School Diploma | 158 (60.3%) | 104 (39.7%) |
| College/Associate Degree | 225 (45.7%) | 267 (54.3%) |
| Bachelor's Degree or higher | 1,780 (84.3%) | 332 (15.7%) |
Occupancy by Age of Householder in Park City
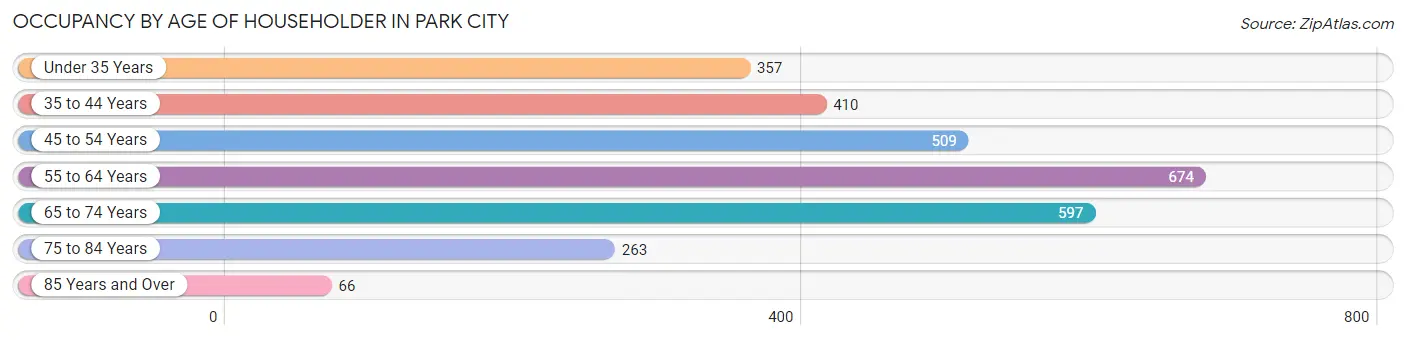
| Age Bracket | # Households | % Households |
| Under 35 Years | 357 | 12.4% |
| 35 to 44 Years | 410 | 14.3% |
| 45 to 54 Years | 509 | 17.7% |
| 55 to 64 Years | 674 | 23.4% |
| 65 to 74 Years | 597 | 20.8% |
| 75 to 84 Years | 263 | 9.1% |
| 85 Years and Over | 66 | 2.3% |
| Total | 2,876 | 100.0% |
Housing Finances in Park City
Median Income by Occupancy in Park City
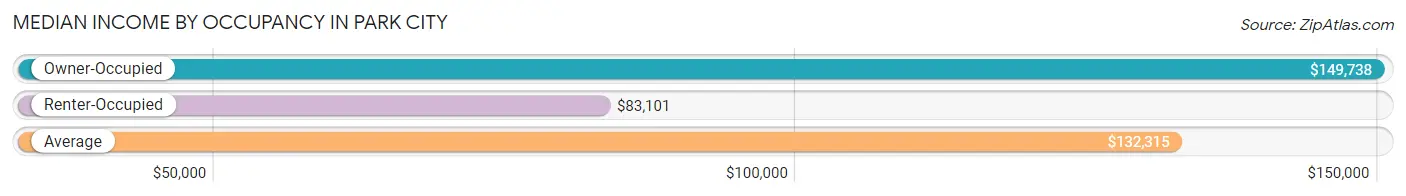
| Occupancy Type | # Households | Median Income |
| Owner-Occupied | 2,163 (75.2%) | $149,738 |
| Renter-Occupied | 713 (24.8%) | $83,101 |
| Average | 2,876 (100.0%) | $132,315 |
Occupancy by Householder Income Bracket in Park City
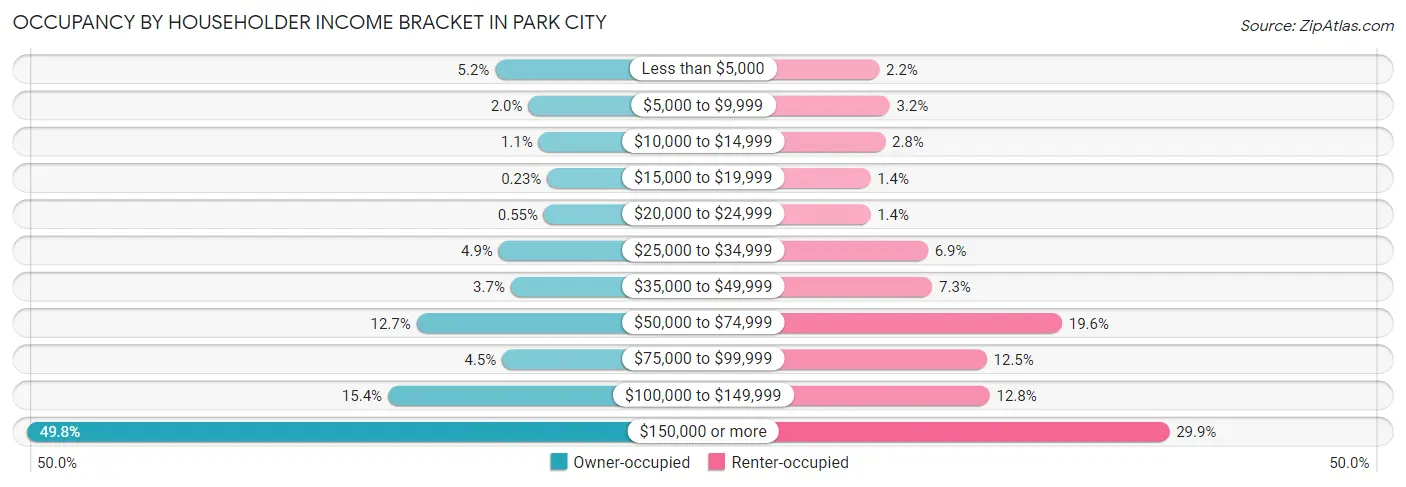
| Income Bracket | Owner-occupied | Renter-occupied |
| Less than $5,000 | 112 (5.2%) | 16 (2.2%) |
| $5,000 to $9,999 | 44 (2.0%) | 23 (3.2%) |
| $10,000 to $14,999 | 23 (1.1%) | 20 (2.8%) |
| $15,000 to $19,999 | 5 (0.2%) | 10 (1.4%) |
| $20,000 to $24,999 | 12 (0.5%) | 10 (1.4%) |
| $25,000 to $34,999 | 105 (4.9%) | 49 (6.9%) |
| $35,000 to $49,999 | 80 (3.7%) | 52 (7.3%) |
| $50,000 to $74,999 | 274 (12.7%) | 140 (19.6%) |
| $75,000 to $99,999 | 98 (4.5%) | 89 (12.5%) |
| $100,000 to $149,999 | 333 (15.4%) | 91 (12.8%) |
| $150,000 or more | 1,077 (49.8%) | 213 (29.9%) |
| Total | 2,163 (100.0%) | 713 (100.0%) |
Monthly Housing Cost Tiers in Park City
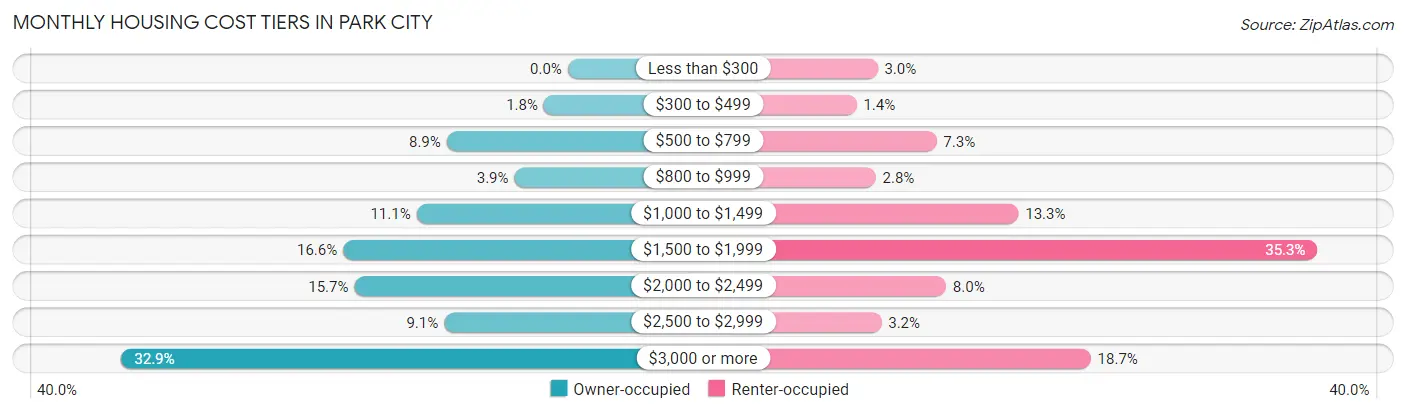
| Monthly Cost | Owner-occupied | Renter-occupied |
| Less than $300 | 0 (0.0%) | 21 (2.9%) |
| $300 to $499 | 38 (1.8%) | 10 (1.4%) |
| $500 to $799 | 193 (8.9%) | 52 (7.3%) |
| $800 to $999 | 85 (3.9%) | 20 (2.8%) |
| $1,000 to $1,499 | 241 (11.1%) | 95 (13.3%) |
| $1,500 to $1,999 | 358 (16.6%) | 252 (35.3%) |
| $2,000 to $2,499 | 340 (15.7%) | 57 (8.0%) |
| $2,500 to $2,999 | 197 (9.1%) | 23 (3.2%) |
| $3,000 or more | 711 (32.9%) | 133 (18.6%) |
| Total | 2,163 (100.0%) | 713 (100.0%) |
Physical Housing Characteristics in Park City
Housing Structures in Park City
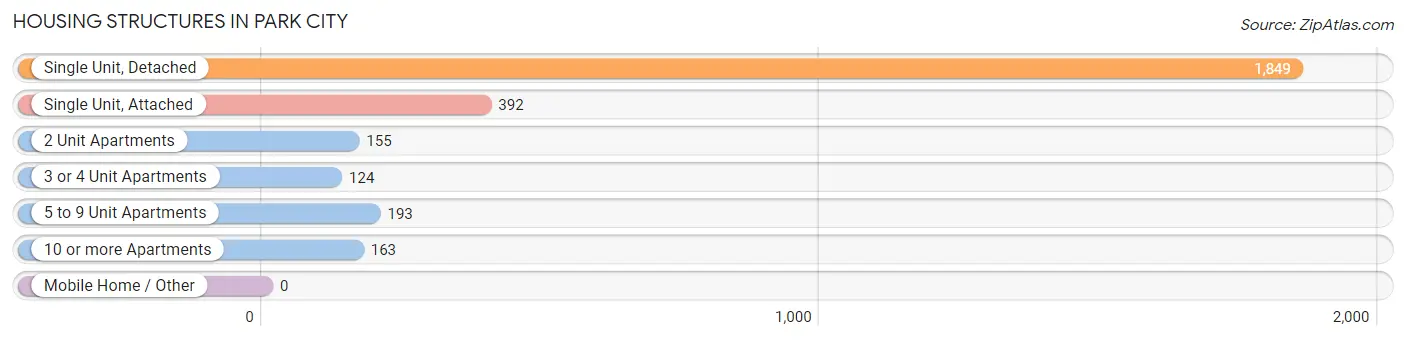
| Structure Type | # Housing Units | % Housing Units |
| Single Unit, Detached | 1,849 | 64.3% |
| Single Unit, Attached | 392 | 13.6% |
| 2 Unit Apartments | 155 | 5.4% |
| 3 or 4 Unit Apartments | 124 | 4.3% |
| 5 to 9 Unit Apartments | 193 | 6.7% |
| 10 or more Apartments | 163 | 5.7% |
| Mobile Home / Other | 0 | 0.0% |
| Total | 2,876 | 100.0% |
Housing Structures by Occupancy in Park City
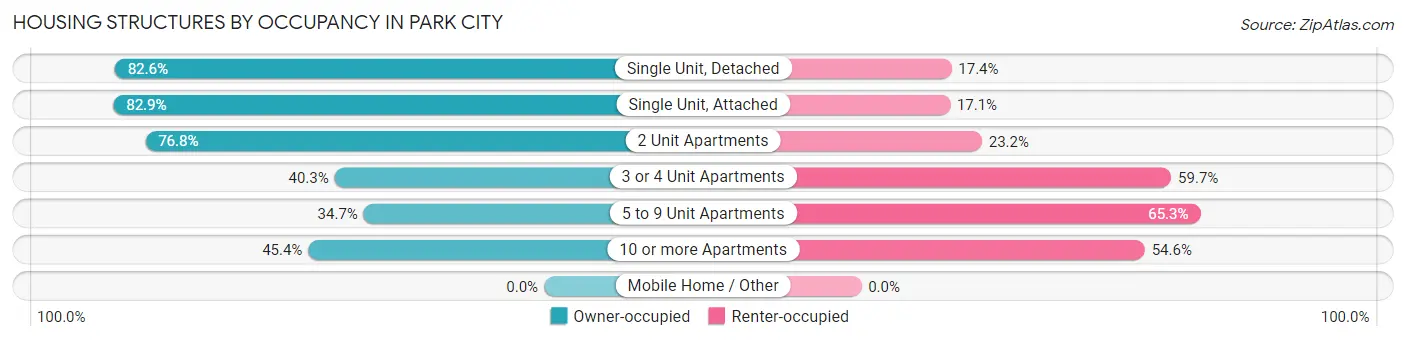
| Structure Type | Owner-occupied | Renter-occupied |
| Single Unit, Detached | 1,528 (82.6%) | 321 (17.4%) |
| Single Unit, Attached | 325 (82.9%) | 67 (17.1%) |
| 2 Unit Apartments | 119 (76.8%) | 36 (23.2%) |
| 3 or 4 Unit Apartments | 50 (40.3%) | 74 (59.7%) |
| 5 to 9 Unit Apartments | 67 (34.7%) | 126 (65.3%) |
| 10 or more Apartments | 74 (45.4%) | 89 (54.6%) |
| Mobile Home / Other | 0 (0.0%) | 0 (0.0%) |
| Total | 2,163 (75.2%) | 713 (24.8%) |
Housing Structures by Number of Rooms in Park City
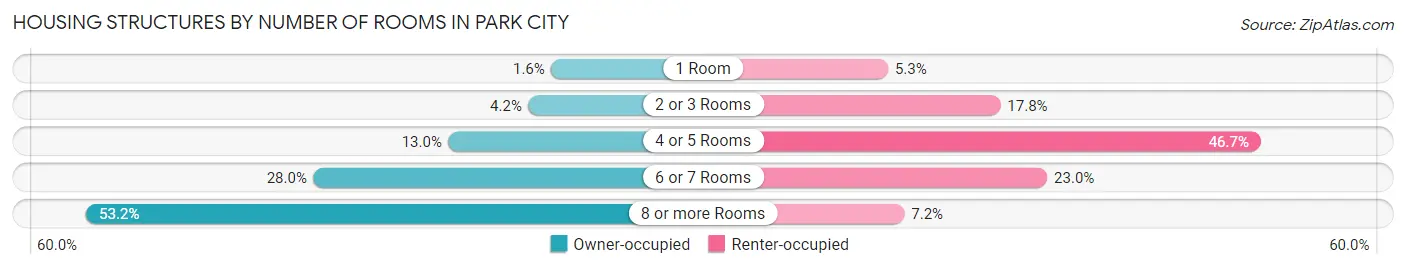
| Number of Rooms | Owner-occupied | Renter-occupied |
| 1 Room | 35 (1.6%) | 38 (5.3%) |
| 2 or 3 Rooms | 90 (4.2%) | 127 (17.8%) |
| 4 or 5 Rooms | 282 (13.0%) | 333 (46.7%) |
| 6 or 7 Rooms | 606 (28.0%) | 164 (23.0%) |
| 8 or more Rooms | 1,150 (53.2%) | 51 (7.1%) |
| Total | 2,163 (100.0%) | 713 (100.0%) |
Housing Structure by Heating Type in Park City
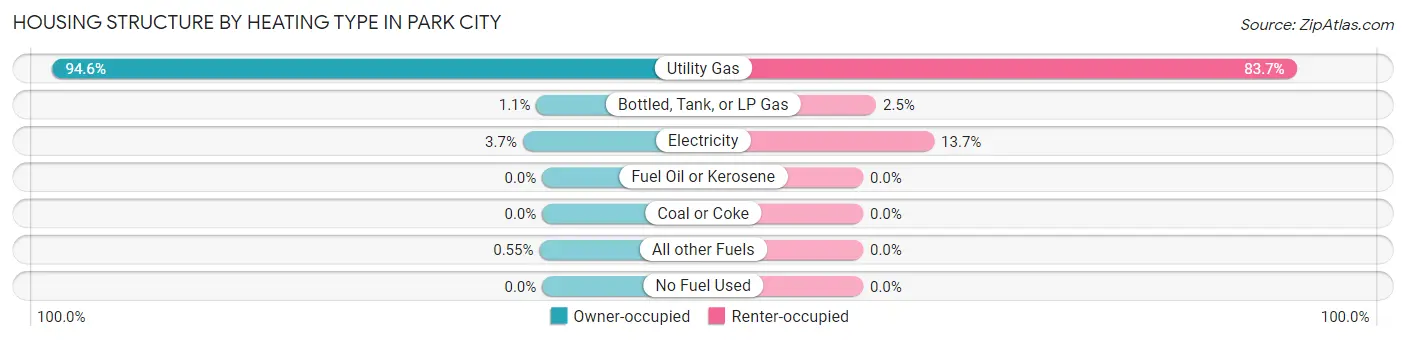
| Heating Type | Owner-occupied | Renter-occupied |
| Utility Gas | 2,046 (94.6%) | 597 (83.7%) |
| Bottled, Tank, or LP Gas | 24 (1.1%) | 18 (2.5%) |
| Electricity | 81 (3.7%) | 98 (13.7%) |
| Fuel Oil or Kerosene | 0 (0.0%) | 0 (0.0%) |
| Coal or Coke | 0 (0.0%) | 0 (0.0%) |
| All other Fuels | 12 (0.5%) | 0 (0.0%) |
| No Fuel Used | 0 (0.0%) | 0 (0.0%) |
| Total | 2,163 (100.0%) | 713 (100.0%) |
Household Vehicle Usage in Park City
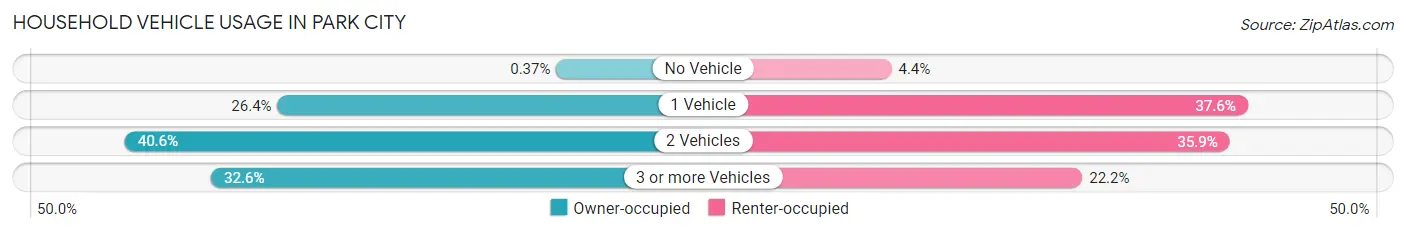
| Vehicles per Household | Owner-occupied | Renter-occupied |
| No Vehicle | 8 (0.4%) | 31 (4.3%) |
| 1 Vehicle | 571 (26.4%) | 268 (37.6%) |
| 2 Vehicles | 879 (40.6%) | 256 (35.9%) |
| 3 or more Vehicles | 705 (32.6%) | 158 (22.2%) |
| Total | 2,163 (100.0%) | 713 (100.0%) |
Real Estate & Mortgages in Park City
Real Estate and Mortgage Overview in Park City
| Characteristic | Without Mortgage | With Mortgage |
| Housing Units | 827 | 1,336 |
| Median Property Value | $1,717,900 | $1,238,000 |
| Median Household Income | $141,205 | $698 |
| Monthly Housing Costs | $1,145 | $697 |
| Real Estate Taxes | $5,616 | $0 |
Property Value by Mortgage Status in Park City
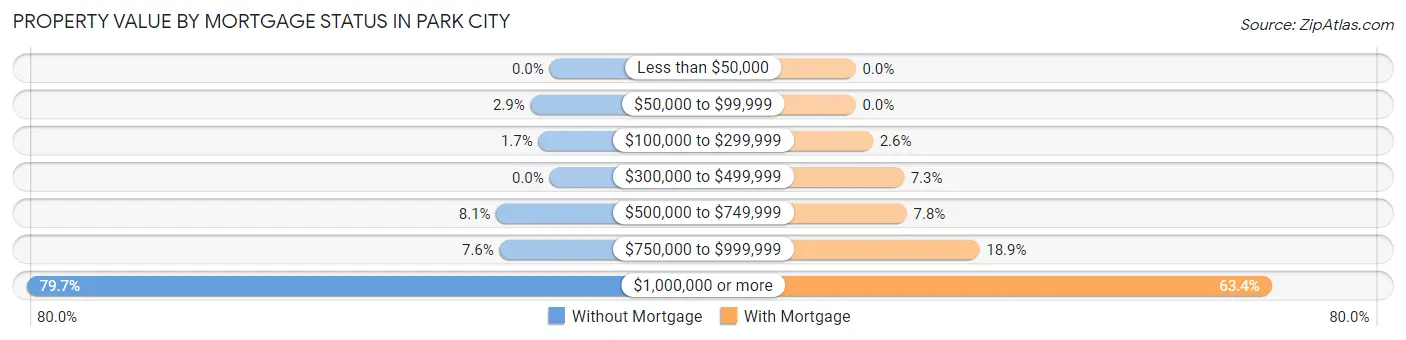
| Property Value | Without Mortgage | With Mortgage |
| Less than $50,000 | 0 (0.0%) | 0 (0.0%) |
| $50,000 to $99,999 | 24 (2.9%) | 0 (0.0%) |
| $100,000 to $299,999 | 14 (1.7%) | 35 (2.6%) |
| $300,000 to $499,999 | 0 (0.0%) | 98 (7.3%) |
| $500,000 to $749,999 | 67 (8.1%) | 104 (7.8%) |
| $750,000 to $999,999 | 63 (7.6%) | 252 (18.9%) |
| $1,000,000 or more | 659 (79.7%) | 847 (63.4%) |
| Total | 827 (100.0%) | 1,336 (100.0%) |
Household Income by Mortgage Status in Park City
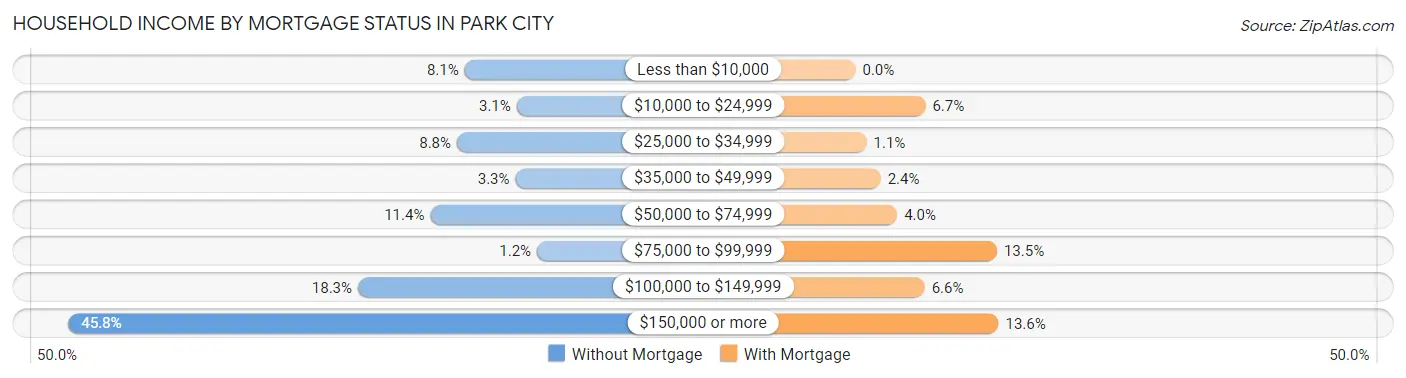
| Household Income | Without Mortgage | With Mortgage |
| Less than $10,000 | 67 (8.1%) | 0 (0.0%) |
| $10,000 to $24,999 | 26 (3.1%) | 89 (6.7%) |
| $25,000 to $34,999 | 73 (8.8%) | 14 (1.1%) |
| $35,000 to $49,999 | 27 (3.3%) | 32 (2.4%) |
| $50,000 to $74,999 | 94 (11.4%) | 53 (4.0%) |
| $75,000 to $99,999 | 10 (1.2%) | 180 (13.5%) |
| $100,000 to $149,999 | 151 (18.3%) | 88 (6.6%) |
| $150,000 or more | 379 (45.8%) | 182 (13.6%) |
| Total | 827 (100.0%) | 1,336 (100.0%) |
Property Value to Household Income Ratio in Park City
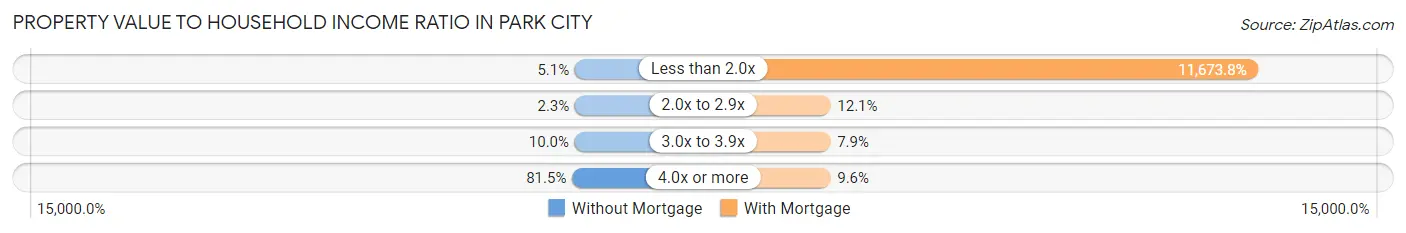
| Value-to-Income Ratio | Without Mortgage | With Mortgage |
| Less than 2.0x | 42 (5.1%) | 155,962 (11,673.8%) |
| 2.0x to 2.9x | 19 (2.3%) | 162 (12.1%) |
| 3.0x to 3.9x | 83 (10.0%) | 106 (7.9%) |
| 4.0x or more | 674 (81.5%) | 128 (9.6%) |
| Total | 827 (100.0%) | 1,336 (100.0%) |
Real Estate Taxes by Mortgage Status in Park City
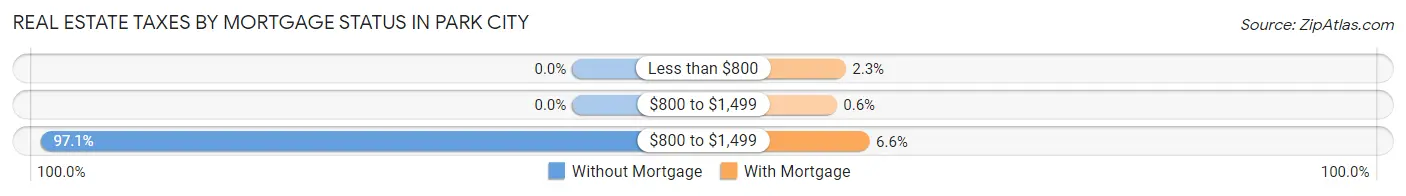
| Property Taxes | Without Mortgage | With Mortgage |
| Less than $800 | 0 (0.0%) | 30 (2.2%) |
| $800 to $1,499 | 0 (0.0%) | 8 (0.6%) |
| $800 to $1,499 | 803 (97.1%) | 88 (6.6%) |
| Total | 827 (100.0%) | 1,336 (100.0%) |
Health & Disability in Park City
Health Insurance Coverage by Age in Park City
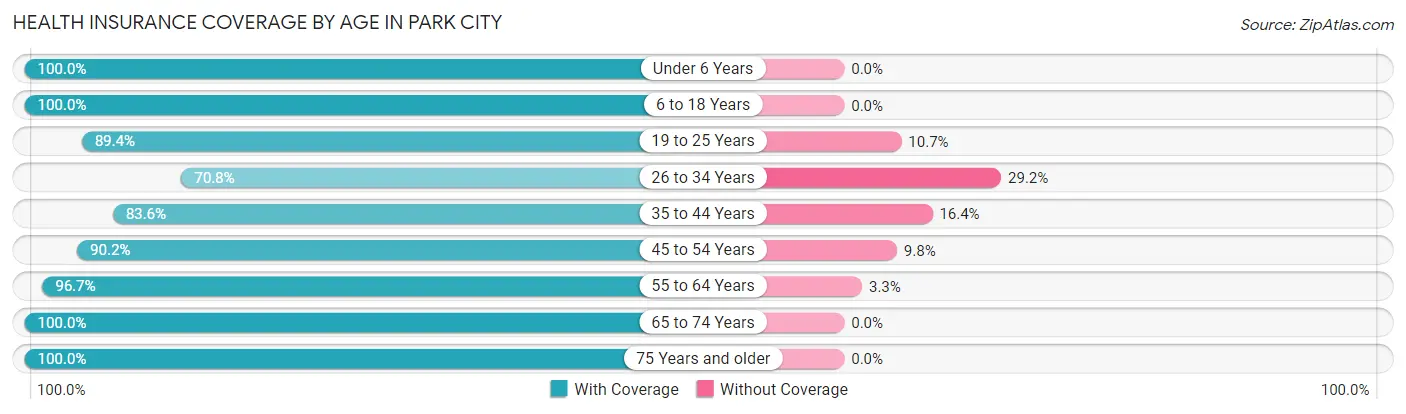
| Age Bracket | With Coverage | Without Coverage |
| Under 6 Years | 269 (100.0%) | 0 (0.0%) |
| 6 to 18 Years | 1,286 (100.0%) | 0 (0.0%) |
| 19 to 25 Years | 847 (89.3%) | 101 (10.6%) |
| 26 to 34 Years | 617 (70.8%) | 255 (29.2%) |
| 35 to 44 Years | 991 (83.6%) | 195 (16.4%) |
| 45 to 54 Years | 846 (90.2%) | 92 (9.8%) |
| 55 to 64 Years | 1,285 (96.7%) | 44 (3.3%) |
| 65 to 74 Years | 1,034 (100.0%) | 0 (0.0%) |
| 75 Years and older | 497 (100.0%) | 0 (0.0%) |
| Total | 7,672 (91.8%) | 687 (8.2%) |
Health Insurance Coverage by Citizenship Status in Park City
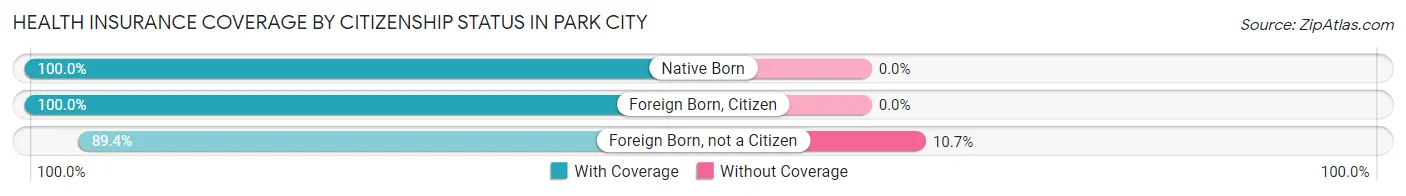
| Citizenship Status | With Coverage | Without Coverage |
| Native Born | 269 (100.0%) | 0 (0.0%) |
| Foreign Born, Citizen | 1,286 (100.0%) | 0 (0.0%) |
| Foreign Born, not a Citizen | 847 (89.3%) | 101 (10.6%) |
Health Insurance Coverage by Household Income in Park City
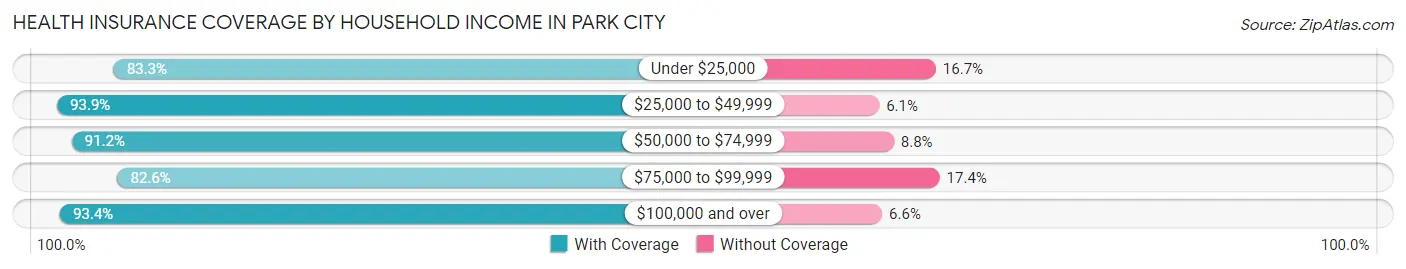
| Household Income | With Coverage | Without Coverage |
| Under $25,000 | 419 (83.3%) | 84 (16.7%) |
| $25,000 to $49,999 | 588 (93.9%) | 38 (6.1%) |
| $50,000 to $74,999 | 972 (91.2%) | 94 (8.8%) |
| $75,000 to $99,999 | 470 (82.6%) | 99 (17.4%) |
| $100,000 and over | 5,126 (93.4%) | 364 (6.6%) |
Public vs Private Health Insurance Coverage by Age in Park City
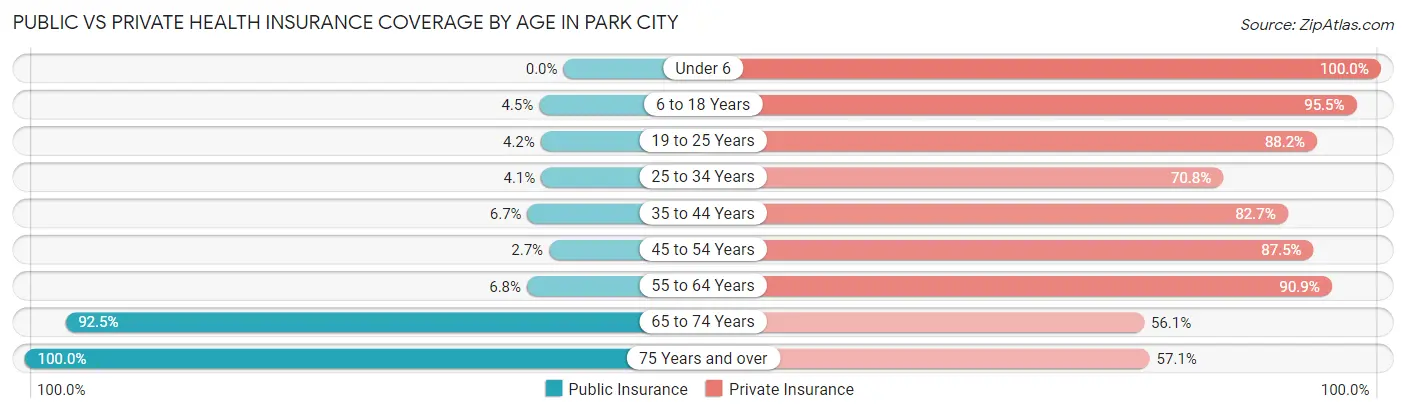
| Age Bracket | Public Insurance | Private Insurance |
| Under 6 | 0 (0.0%) | 269 (100.0%) |
| 6 to 18 Years | 58 (4.5%) | 1,228 (95.5%) |
| 19 to 25 Years | 40 (4.2%) | 836 (88.2%) |
| 25 to 34 Years | 36 (4.1%) | 617 (70.8%) |
| 35 to 44 Years | 79 (6.7%) | 981 (82.7%) |
| 45 to 54 Years | 25 (2.7%) | 821 (87.5%) |
| 55 to 64 Years | 90 (6.8%) | 1,208 (90.9%) |
| 65 to 74 Years | 956 (92.5%) | 580 (56.1%) |
| 75 Years and over | 497 (100.0%) | 284 (57.1%) |
| Total | 1,781 (21.3%) | 6,824 (81.6%) |
Disability Status by Sex by Age in Park City
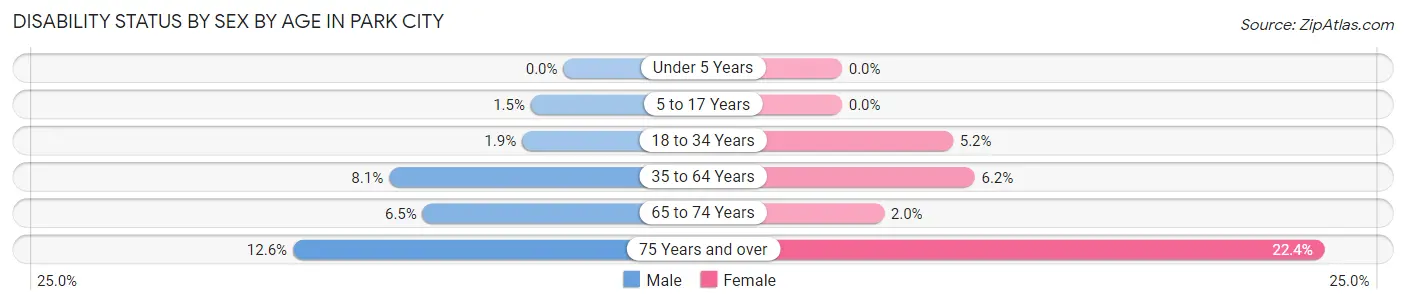
| Age Bracket | Male | Female |
| Under 5 Years | 0 (0.0%) | 0 (0.0%) |
| 5 to 17 Years | 10 (1.5%) | 0 (0.0%) |
| 18 to 34 Years | 19 (1.9%) | 49 (5.1%) |
| 35 to 64 Years | 140 (8.1%) | 106 (6.2%) |
| 65 to 74 Years | 34 (6.5%) | 10 (1.9%) |
| 75 Years and over | 31 (12.6%) | 56 (22.4%) |
Disability Class by Sex by Age in Park City
Disability Class: Hearing Difficulty
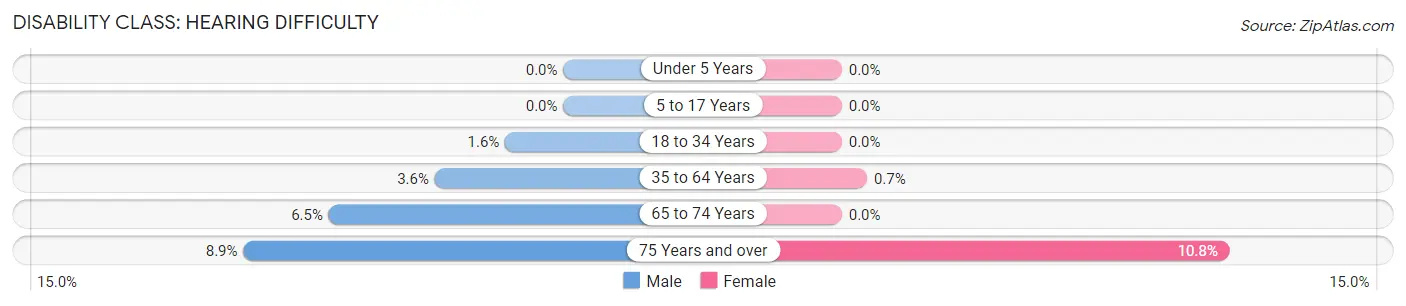
| Age Bracket | Male | Female |
| Under 5 Years | 0 (0.0%) | 0 (0.0%) |
| 5 to 17 Years | 0 (0.0%) | 0 (0.0%) |
| 18 to 34 Years | 16 (1.6%) | 0 (0.0%) |
| 35 to 64 Years | 62 (3.6%) | 12 (0.7%) |
| 65 to 74 Years | 34 (6.5%) | 0 (0.0%) |
| 75 Years and over | 22 (8.9%) | 27 (10.8%) |
Disability Class: Vision Difficulty
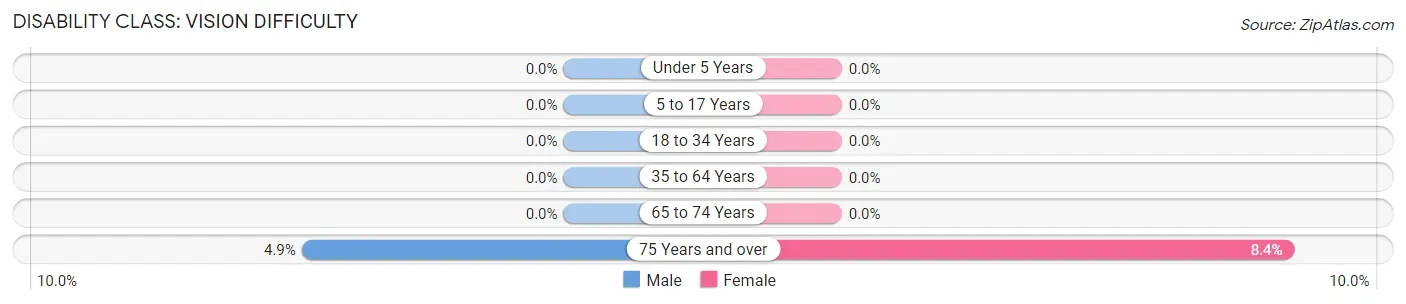
| Age Bracket | Male | Female |
| Under 5 Years | 0 (0.0%) | 0 (0.0%) |
| 5 to 17 Years | 0 (0.0%) | 0 (0.0%) |
| 18 to 34 Years | 0 (0.0%) | 0 (0.0%) |
| 35 to 64 Years | 0 (0.0%) | 0 (0.0%) |
| 65 to 74 Years | 0 (0.0%) | 0 (0.0%) |
| 75 Years and over | 12 (4.9%) | 21 (8.4%) |
Disability Class: Cognitive Difficulty
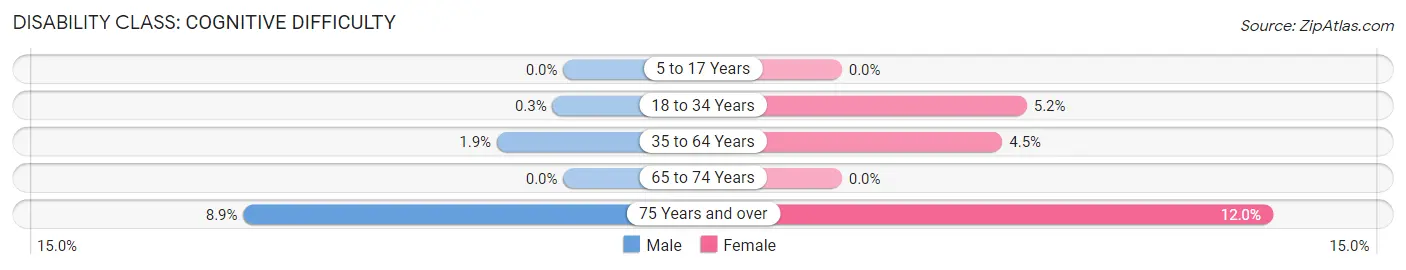
| Age Bracket | Male | Female |
| 5 to 17 Years | 0 (0.0%) | 0 (0.0%) |
| 18 to 34 Years | 3 (0.3%) | 49 (5.1%) |
| 35 to 64 Years | 32 (1.8%) | 77 (4.5%) |
| 65 to 74 Years | 0 (0.0%) | 0 (0.0%) |
| 75 Years and over | 22 (8.9%) | 30 (12.0%) |
Disability Class: Ambulatory Difficulty
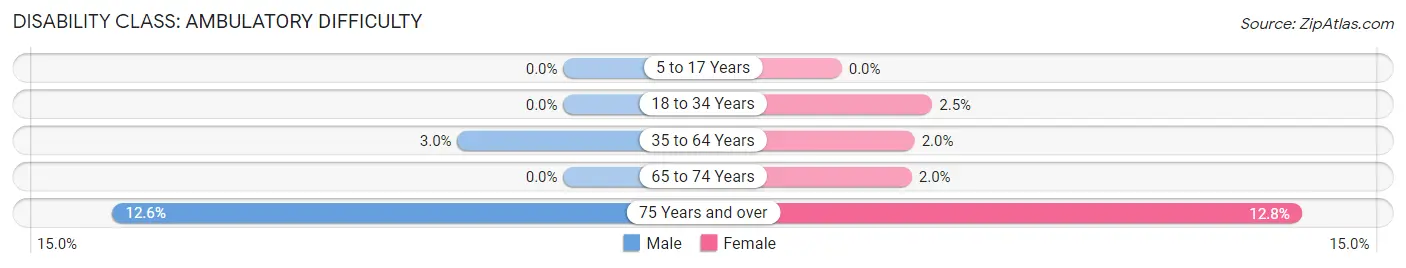
| Age Bracket | Male | Female |
| 5 to 17 Years | 0 (0.0%) | 0 (0.0%) |
| 18 to 34 Years | 0 (0.0%) | 24 (2.5%) |
| 35 to 64 Years | 51 (2.9%) | 35 (2.0%) |
| 65 to 74 Years | 0 (0.0%) | 10 (1.9%) |
| 75 Years and over | 31 (12.6%) | 32 (12.8%) |
Disability Class: Self-Care Difficulty
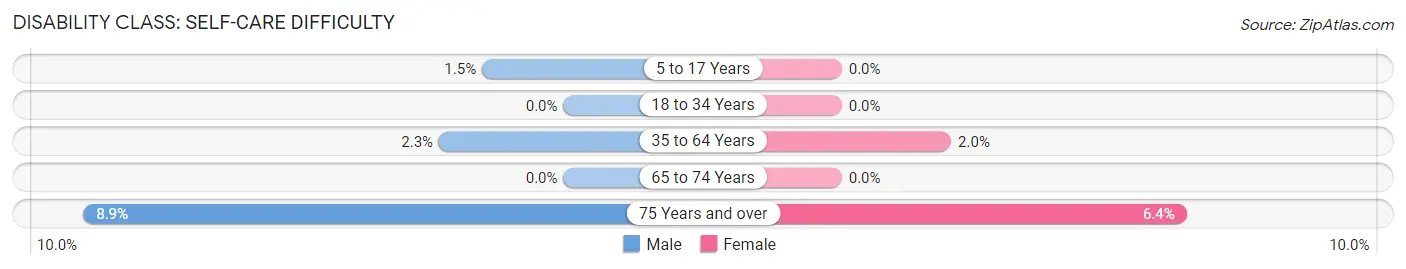
| Age Bracket | Male | Female |
| 5 to 17 Years | 10 (1.5%) | 0 (0.0%) |
| 18 to 34 Years | 0 (0.0%) | 0 (0.0%) |
| 35 to 64 Years | 40 (2.3%) | 35 (2.0%) |
| 65 to 74 Years | 0 (0.0%) | 0 (0.0%) |
| 75 Years and over | 22 (8.9%) | 16 (6.4%) |
Technology Access in Park City
Computing Device Access in Park City
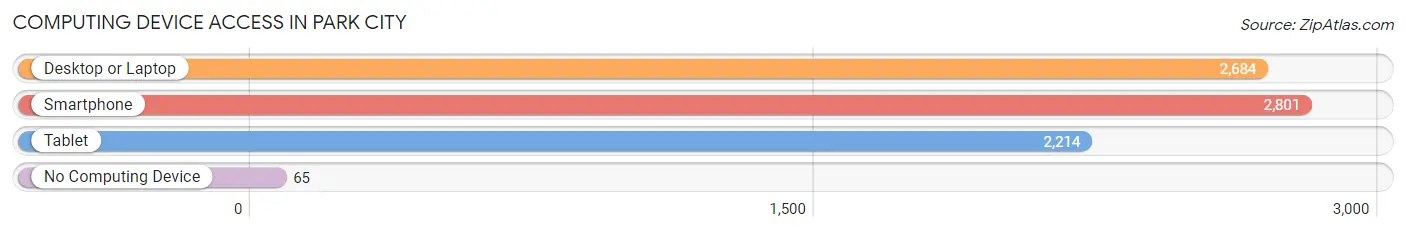
| Device Type | # Households | % Households |
| Desktop or Laptop | 2,684 | 93.3% |
| Smartphone | 2,801 | 97.4% |
| Tablet | 2,214 | 77.0% |
| No Computing Device | 65 | 2.3% |
| Total | 2,876 | 100.0% |
Internet Access in Park City
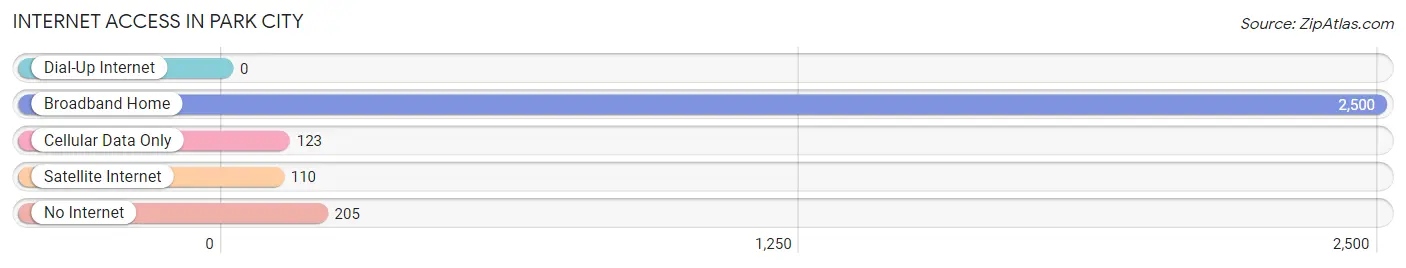
| Internet Type | # Households | % Households |
| Dial-Up Internet | 0 | 0.0% |
| Broadband Home | 2,500 | 86.9% |
| Cellular Data Only | 123 | 4.3% |
| Satellite Internet | 110 | 3.8% |
| No Internet | 205 | 7.1% |
| Total | 2,876 | 100.0% |
Park City Summary
Park City, Utah is a small mountain town located in the Wasatch Mountains of northern Utah. It is situated in Summit County, approximately 32 miles east of Salt Lake City. Park City is known for its world-class skiing, snowboarding, and outdoor recreation, and is home to the annual Sundance Film Festival.
History
Park City was first settled in 1868 by a group of miners who were drawn to the area by the discovery of silver ore. The town was originally named Parley’s Park City, after Parley P. Pratt, an early Mormon leader. The town quickly grew and by 1872, it was the largest city in Utah. The silver boom lasted until the early 1900s, when the price of silver dropped and the mines began to close.
In the 1930s, the town was revitalized by the development of the ski industry. The first ski resort, Treasure Mountain, was opened in 1936. The resort was later renamed Park City Mountain Resort and is now one of the largest ski resorts in the United States.
Geography
Park City is located in the Wasatch Mountains of northern Utah. It is situated in Summit County, approximately 32 miles east of Salt Lake City. The town is surrounded by mountains, including the Wasatch Range to the east and the Uinta Mountains to the west. The town is located at an elevation of 7,000 feet, making it one of the highest cities in the United States.
The climate in Park City is generally mild, with cold winters and warm summers. The average annual temperature is 41°F, with an average high of 57°F in the summer and an average low of 25°F in the winter. The town receives an average of 200 inches of snow each year.
Economy
Park City’s economy is largely driven by tourism and recreation. The town is home to two major ski resorts, Park City Mountain Resort and Deer Valley Resort, which attract visitors from around the world. The town is also home to the annual Sundance Film Festival, which brings in millions of dollars in revenue each year.
In addition to tourism, Park City is home to a number of businesses, including restaurants, retail stores, and art galleries. The town is also home to several technology companies, including Ancestry.com and Skullcandy.
Demographics
As of the 2010 census, the population of Park City was 7,558. The racial makeup of the town was 91.3% White, 0.7% African American, 0.3% Native American, 2.2% Asian, 0.1% Pacific Islander, 3.2% from other races, and 2.4% from two or more races. The median household income was $77,837, and the median family income was $90,837.
Park City is a popular destination for retirees, with nearly 20% of the population over the age of 65. The town is also home to a large number of young professionals, with nearly 40% of the population between the ages of 25 and 44.
Park City is a vibrant mountain town with a rich history, stunning geography, and a diverse economy. The town is home to world-class skiing, snowboarding, and outdoor recreation, as well as a thriving business community. Park City is a great place to live, work, and play.
Common Questions
What is Per Capita Income in Park City?
Per Capita income in Park City is $87,440.
What is the Median Family Income in Park City?
Median Family Income in Park City is $170,250.
What is the Median Household income in Park City?
Median Household Income in Park City is $132,315.
What is Income or Wage Gap in Park City?
Income or Wage Gap in Park City is 8.9%.
Women in Park City earn 91.1 cents for every dollar earned by a man.
What is Inequality or Gini Index in Park City?
Inequality or Gini Index in Park City is 0.58.
What is the Total Population of Park City?
Total Population of Park City is 8,379.
What is the Total Male Population of Park City?
Total Male Population of Park City is 4,307.
What is the Total Female Population of Park City?
Total Female Population of Park City is 4,072.
What is the Ratio of Males per 100 Females in Park City?
There are 105.77 Males per 100 Females in Park City.
What is the Ratio of Females per 100 Males in Park City?
There are 94.54 Females per 100 Males in Park City.
What is the Median Population Age in Park City?
Median Population Age in Park City is 41.6 Years.
What is the Average Family Size in Park City
Average Family Size in Park City is 3.2 People.
What is the Average Household Size in Park City
Average Household Size in Park City is 2.9 People.
How Large is the Labor Force in Park City?
There are 5,105 People in the Labor Forcein in Park City.
What is the Percentage of People in the Labor Force in Park City?
71.6% of People are in the Labor Force in Park City.
What is the Unemployment Rate in Park City?
Unemployment Rate in Park City is 1.2%.