Leeds, UT Map & Demographics
Leeds Map
Leeds Overview
$38,439
PER CAPITA INCOME
$108,750
AVG FAMILY INCOME
$82,188
AVG HOUSEHOLD INCOME
14.1%
WAGE / INCOME GAP [ % ]
85.9¢/ $1
WAGE / INCOME GAP [ $ ]
0.33
INEQUALITY / GINI INDEX
798
TOTAL POPULATION
406
MALE POPULATION
392
FEMALE POPULATION
103.57
MALES / 100 FEMALES
96.55
FEMALES / 100 MALES
58.4
MEDIAN AGE
2.7
AVG FAMILY SIZE
2.6
AVG HOUSEHOLD SIZE
315
LABOR FORCE [ PEOPLE ]
43.0%
PERCENT IN LABOR FORCE
Leeds Zip Codes
Leeds Area Codes
Income in Leeds
Income Overview in Leeds
Per Capita Income in Leeds is $38,439, while median incomes of families and households are $108,750 and $82,188 respectively.
| Characteristic | Number | Measure |
| Per Capita Income | 798 | $38,439 |
| Median Family Income | 240 | $108,750 |
| Mean Family Income | 240 | $104,805 |
| Median Household Income | 310 | $82,188 |
| Mean Household Income | 310 | $95,362 |
| Income Deficit | 240 | $0 |
| Wage / Income Gap (%) | 798 | 14.09% |
| Wage / Income Gap ($) | 798 | 85.91¢ per $1 |
| Gini / Inequality Index | 798 | 0.33 |
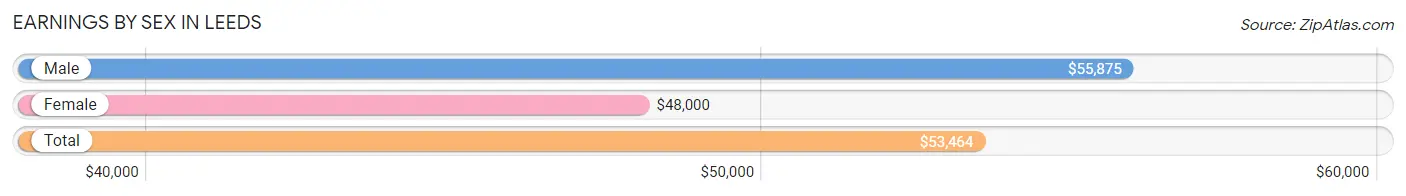
Earnings by Sex in Leeds
Average Earnings in Leeds are $53,464, $55,875 for men and $48,000 for women, a difference of 14.1%.
| Sex | Number | Average Earnings |
| Male | 225 (69.7%) | $55,875 |
| Female | 98 (30.3%) | $48,000 |
| Total | 323 (100.0%) | $53,464 |
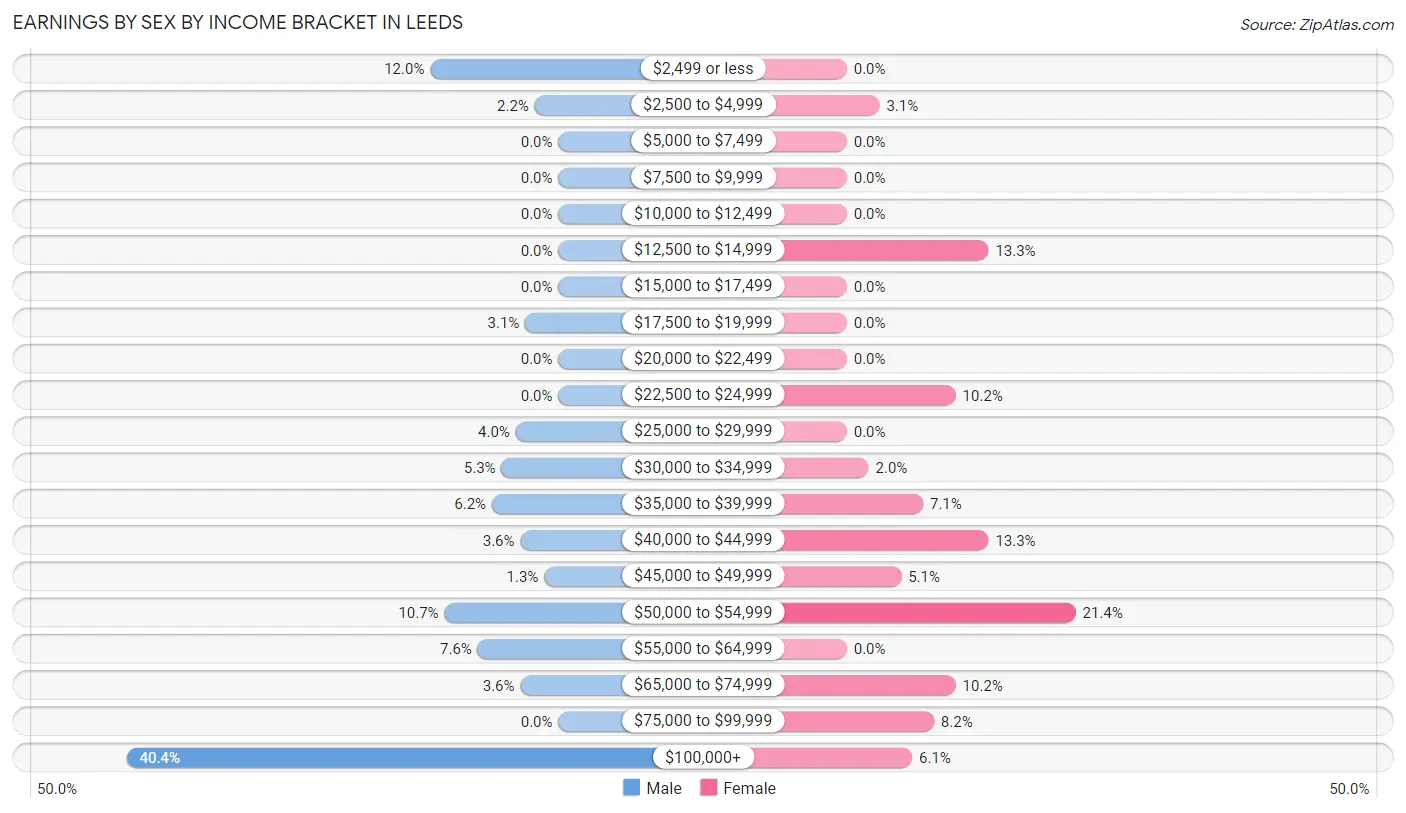
Earnings by Sex by Income Bracket in Leeds
The most common earnings brackets in Leeds are $100,000+ for men (91 | 40.4%) and $50,000 to $54,999 for women (21 | 21.4%).
| Income | Male | Female |
| $2,499 or less | 27 (12.0%) | 0 (0.0%) |
| $2,500 to $4,999 | 5 (2.2%) | 3 (3.1%) |
| $5,000 to $7,499 | 0 (0.0%) | 0 (0.0%) |
| $7,500 to $9,999 | 0 (0.0%) | 0 (0.0%) |
| $10,000 to $12,499 | 0 (0.0%) | 0 (0.0%) |
| $12,500 to $14,999 | 0 (0.0%) | 13 (13.3%) |
| $15,000 to $17,499 | 0 (0.0%) | 0 (0.0%) |
| $17,500 to $19,999 | 7 (3.1%) | 0 (0.0%) |
| $20,000 to $22,499 | 0 (0.0%) | 0 (0.0%) |
| $22,500 to $24,999 | 0 (0.0%) | 10 (10.2%) |
| $25,000 to $29,999 | 9 (4.0%) | 0 (0.0%) |
| $30,000 to $34,999 | 12 (5.3%) | 2 (2.0%) |
| $35,000 to $39,999 | 14 (6.2%) | 7 (7.1%) |
| $40,000 to $44,999 | 8 (3.6%) | 13 (13.3%) |
| $45,000 to $49,999 | 3 (1.3%) | 5 (5.1%) |
| $50,000 to $54,999 | 24 (10.7%) | 21 (21.4%) |
| $55,000 to $64,999 | 17 (7.6%) | 0 (0.0%) |
| $65,000 to $74,999 | 8 (3.6%) | 10 (10.2%) |
| $75,000 to $99,999 | 0 (0.0%) | 8 (8.2%) |
| $100,000+ | 91 (40.4%) | 6 (6.1%) |
| Total | 225 (100.0%) | 98 (100.0%) |
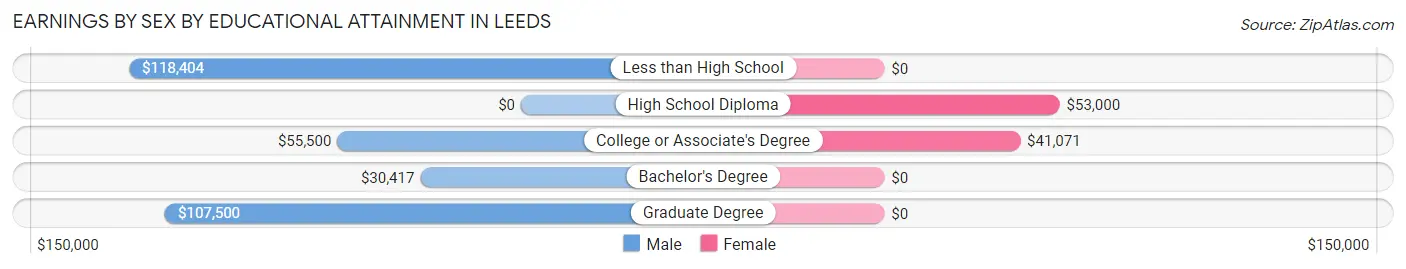
Earnings by Sex by Educational Attainment in Leeds
Average earnings in Leeds are $56,875 for men and $48,750 for women, a difference of 14.3%. Men with an educational attainment of less than high school enjoy the highest average annual earnings of $118,404, while those with bachelor's degree education earn the least with $30,417. Women with an educational attainment of high school diploma earn the most with the average annual earnings of $53,000, while those with college or associate's degree education have the smallest earnings of $41,071.
| Educational Attainment | Male Income | Female Income |
| Less than High School | $118,404 | $0 |
| High School Diploma | - | - |
| College or Associate's Degree | $55,500 | $41,071 |
| Bachelor's Degree | $30,417 | $0 |
| Graduate Degree | $107,500 | $0 |
| Total | $56,875 | $48,750 |
Family Income in Leeds
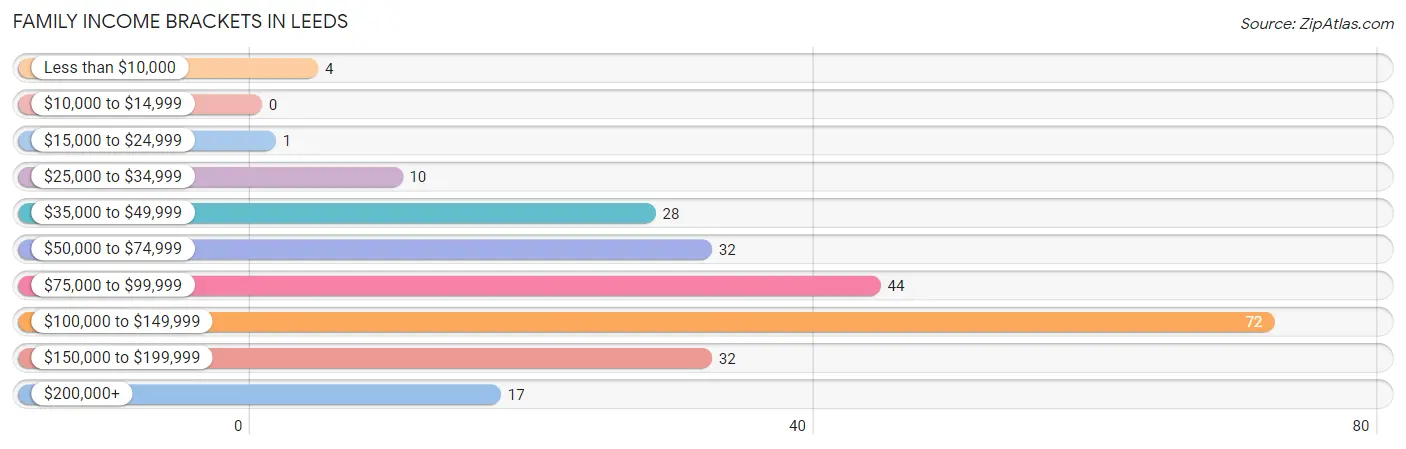
Family Income Brackets in Leeds
According to the Leeds family income data, there are 72 families falling into the $100,000 to $149,999 income range, which is the most common income bracket and makes up 30.0% of all families.
| Income Bracket | # Families | % Families |
| Less than $10,000 | 4 | 1.7% |
| $10,000 to $14,999 | 0 | 0.0% |
| $15,000 to $24,999 | 1 | 0.4% |
| $25,000 to $34,999 | 10 | 4.2% |
| $35,000 to $49,999 | 28 | 11.7% |
| $50,000 to $74,999 | 32 | 13.3% |
| $75,000 to $99,999 | 44 | 18.3% |
| $100,000 to $149,999 | 72 | 30.0% |
| $150,000 to $199,999 | 32 | 13.3% |
| $200,000+ | 17 | 7.1% |
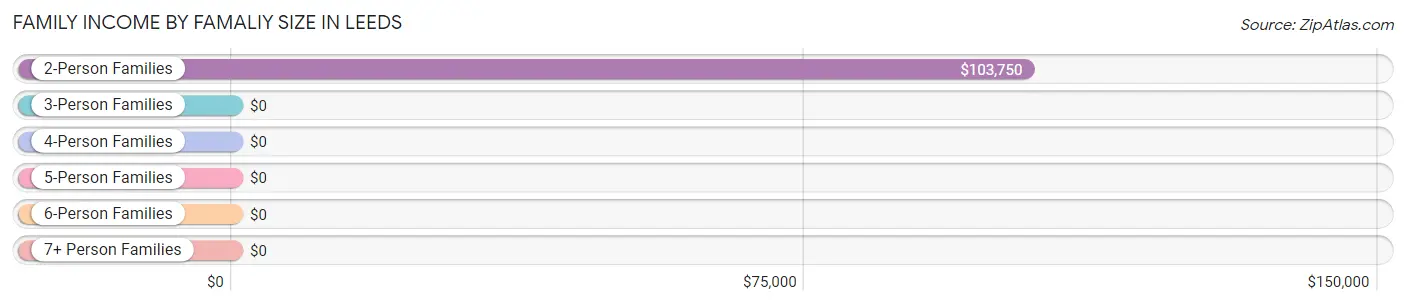
Family Income by Famaliy Size in Leeds
2-person families (176 | 73.3%) account for the highest median family income in Leeds with $103,750 per family, while 2-person families (176 | 73.3%) have the highest median income of $51,875 per family member.
| Income Bracket | # Families | Median Income |
| 2-Person Families | 176 (73.3%) | $103,750 |
| 3-Person Families | 19 (7.9%) | $0 |
| 4-Person Families | 20 (8.3%) | $0 |
| 5-Person Families | 15 (6.2%) | $0 |
| 6-Person Families | 8 (3.3%) | $0 |
| 7+ Person Families | 2 (0.8%) | $0 |
| Total | 240 (100.0%) | $108,750 |
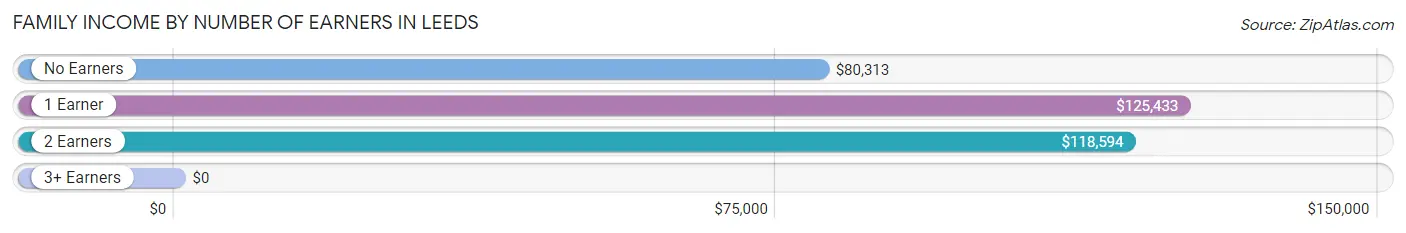
Family Income by Number of Earners in Leeds
| Number of Earners | # Families | Median Income |
| No Earners | 84 (35.0%) | $80,313 |
| 1 Earner | 86 (35.8%) | $125,433 |
| 2 Earners | 53 (22.1%) | $118,594 |
| 3+ Earners | 17 (7.1%) | $0 |
| Total | 240 (100.0%) | $108,750 |
Household Income in Leeds
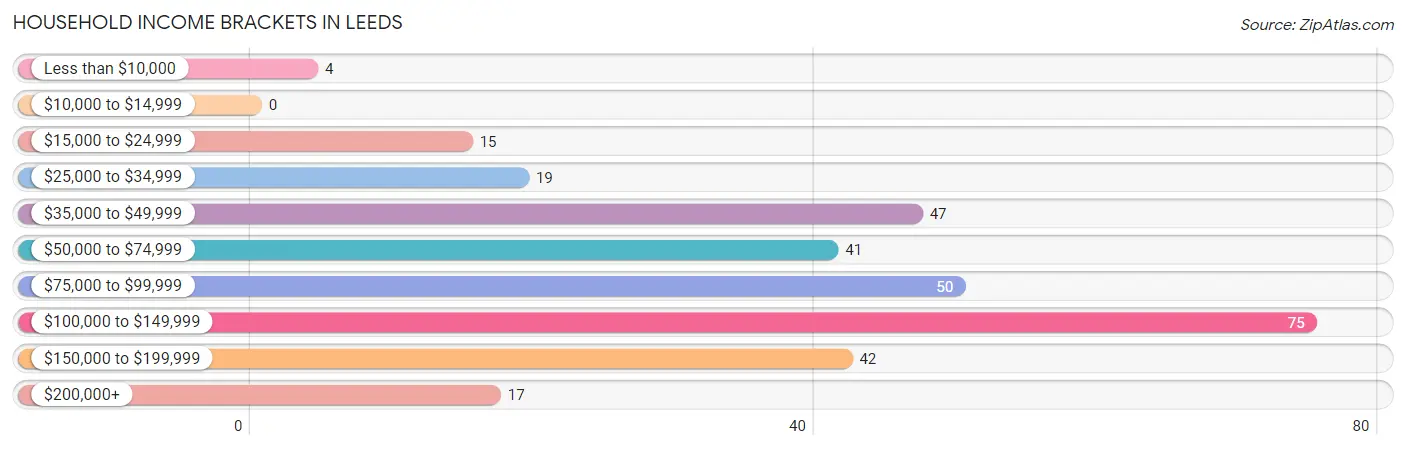
Household Income Brackets in Leeds
With 75 households falling in the category, the $100,000 to $149,999 income range is the most frequent in Leeds, accounting for 24.2% of all households.
| Income Bracket | # Households | % Households |
| Less than $10,000 | 4 | 1.3% |
| $10,000 to $14,999 | 0 | 0.0% |
| $15,000 to $24,999 | 15 | 4.8% |
| $25,000 to $34,999 | 19 | 6.1% |
| $35,000 to $49,999 | 47 | 15.2% |
| $50,000 to $74,999 | 41 | 13.2% |
| $75,000 to $99,999 | 50 | 16.1% |
| $100,000 to $149,999 | 75 | 24.2% |
| $150,000 to $199,999 | 42 | 13.5% |
| $200,000+ | 17 | 5.5% |
Household Income by Householder Age in Leeds
The median household income in Leeds is $82,188, with the highest median household income of $90,179 found in the 65+ years age bracket for the primary householder. A total of 147 households (47.4%) fall into this category.
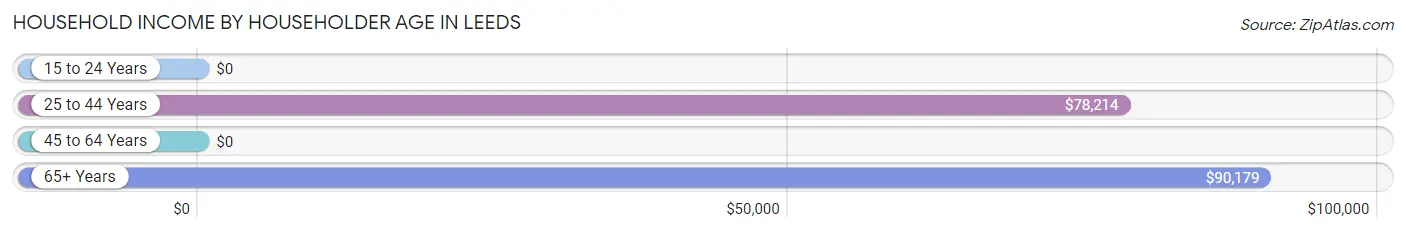
| Income Bracket | # Households | Median Income |
| 15 to 24 Years | 0 (0.0%) | $0 |
| 25 to 44 Years | 32 (10.3%) | $78,214 |
| 45 to 64 Years | 131 (42.3%) | $0 |
| 65+ Years | 147 (47.4%) | $90,179 |
| Total | 310 (100.0%) | $82,188 |
Poverty in Leeds
Income Below Poverty by Sex and Age in Leeds
With 1.2% poverty level for males and 15.3% for females among the residents of Leeds, 55 to 64 year old males and 45 to 54 year old females are the most vulnerable to poverty, with 4 males (5.6%) and 47 females (64.4%) in their respective age groups living below the poverty level.
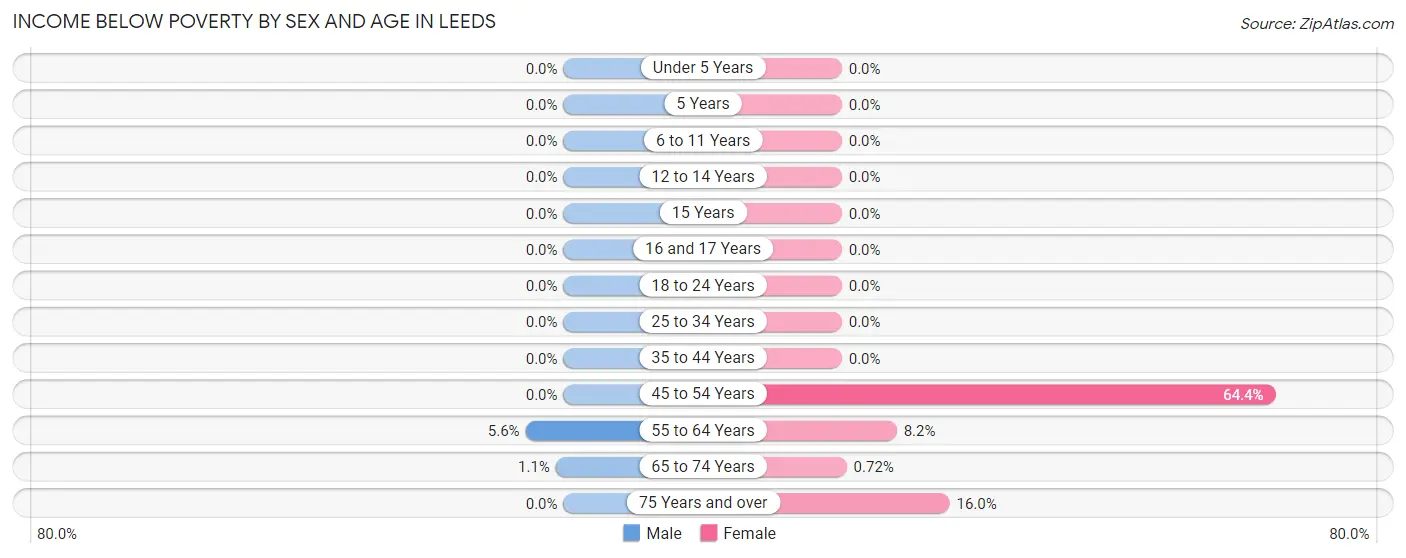
| Age Bracket | Male | Female |
| Under 5 Years | 0 (0.0%) | 0 (0.0%) |
| 5 Years | 0 (0.0%) | 0 (0.0%) |
| 6 to 11 Years | 0 (0.0%) | 0 (0.0%) |
| 12 to 14 Years | 0 (0.0%) | 0 (0.0%) |
| 15 Years | 0 (0.0%) | 0 (0.0%) |
| 16 and 17 Years | 0 (0.0%) | 0 (0.0%) |
| 18 to 24 Years | 0 (0.0%) | 0 (0.0%) |
| 25 to 34 Years | 0 (0.0%) | 0 (0.0%) |
| 35 to 44 Years | 0 (0.0%) | 0 (0.0%) |
| 45 to 54 Years | 0 (0.0%) | 47 (64.4%) |
| 55 to 64 Years | 4 (5.6%) | 4 (8.2%) |
| 65 to 74 Years | 1 (1.1%) | 1 (0.7%) |
| 75 Years and over | 0 (0.0%) | 8 (16.0%) |
| Total | 5 (1.2%) | 60 (15.3%) |
Income Above Poverty by Sex and Age in Leeds
According to the poverty statistics in Leeds, males aged under 5 years and females aged 6 to 11 years are the age groups that are most secure financially, with 100.0% of males and 100.0% of females in these age groups living above the poverty line.
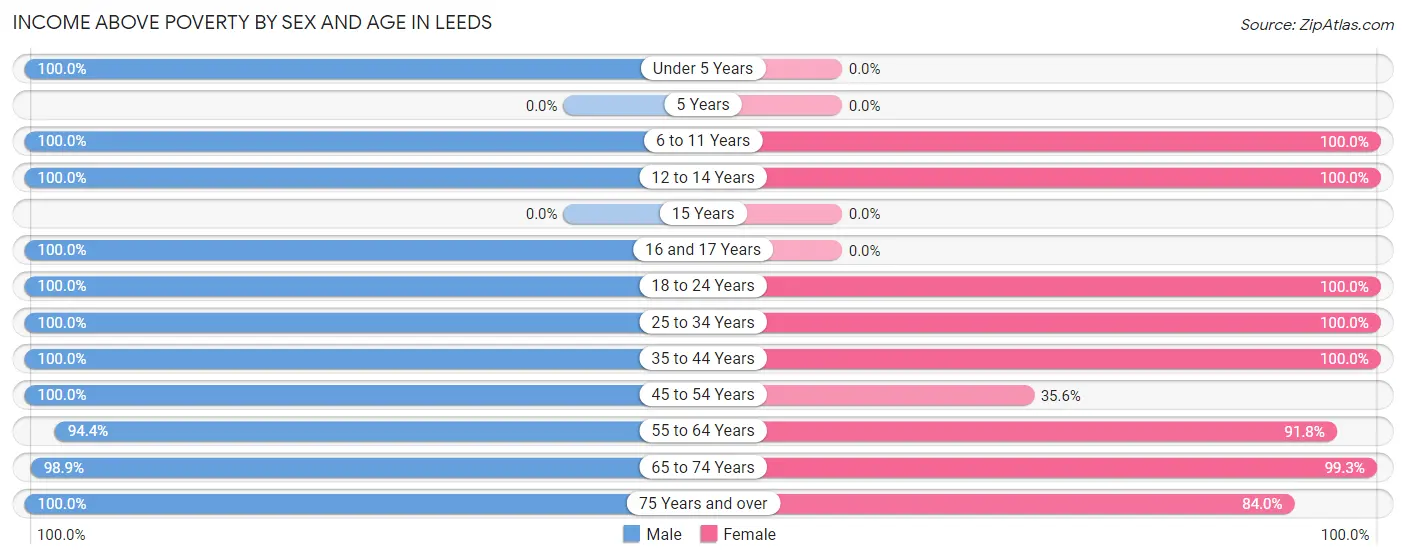
| Age Bracket | Male | Female |
| Under 5 Years | 20 (100.0%) | 0 (0.0%) |
| 5 Years | 0 (0.0%) | 0 (0.0%) |
| 6 to 11 Years | 13 (100.0%) | 20 (100.0%) |
| 12 to 14 Years | 2 (100.0%) | 10 (100.0%) |
| 15 Years | 0 (0.0%) | 0 (0.0%) |
| 16 and 17 Years | 11 (100.0%) | 0 (0.0%) |
| 18 to 24 Years | 16 (100.0%) | 3 (100.0%) |
| 25 to 34 Years | 40 (100.0%) | 22 (100.0%) |
| 35 to 44 Years | 35 (100.0%) | 26 (100.0%) |
| 45 to 54 Years | 76 (100.0%) | 26 (35.6%) |
| 55 to 64 Years | 67 (94.4%) | 45 (91.8%) |
| 65 to 74 Years | 87 (98.9%) | 138 (99.3%) |
| 75 Years and over | 34 (100.0%) | 42 (84.0%) |
| Total | 401 (98.8%) | 332 (84.7%) |
Income Below Poverty Among Married-Couple Families in Leeds
The poverty statistics for married-couple families in Leeds show that 2.9% or 5 of the total 172 families live below the poverty line. Families with no children have the highest poverty rate of 3.5%, comprising of 5 families. On the other hand, families with 1 or 2 children have the lowest poverty rate of 0.0%, which includes 0 families.
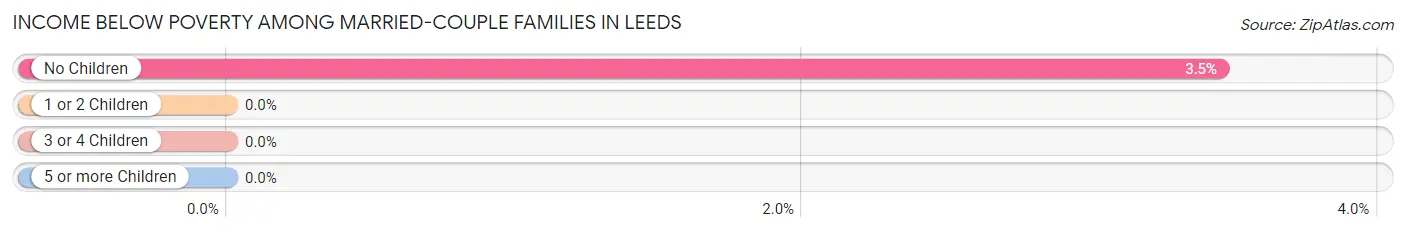
| Children | Above Poverty | Below Poverty |
| No Children | 140 (96.6%) | 5 (3.5%) |
| 1 or 2 Children | 7 (100.0%) | 0 (0.0%) |
| 3 or 4 Children | 18 (100.0%) | 0 (0.0%) |
| 5 or more Children | 2 (100.0%) | 0 (0.0%) |
| Total | 167 (97.1%) | 5 (2.9%) |
Income Below Poverty Among Single-Parent Households in Leeds
| Children | Single Father | Single Mother |
| No Children | 0 (0.0%) | 0 (0.0%) |
| 1 or 2 Children | 0 (0.0%) | 0 (0.0%) |
| 3 or 4 Children | 0 (0.0%) | 0 (0.0%) |
| 5 or more Children | 0 (0.0%) | 0 (0.0%) |
| Total | 0 (0.0%) | 0 (0.0%) |
Income Below Poverty Among Married-Couple vs Single-Parent Households in Leeds
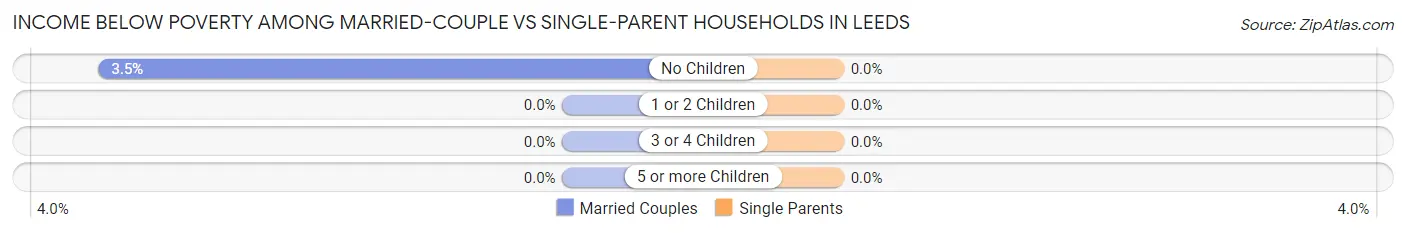
| Children | Married-Couple Families | Single-Parent Households |
| No Children | 5 (3.5%) | 0 (0.0%) |
| 1 or 2 Children | 0 (0.0%) | 0 (0.0%) |
| 3 or 4 Children | 0 (0.0%) | 0 (0.0%) |
| 5 or more Children | 0 (0.0%) | 0 (0.0%) |
| Total | 5 (2.9%) | 0 (0.0%) |
Race in Leeds
The most populous races in Leeds are White / Caucasian (739 | 92.6%), Hispanic or Latino (32 | 4.0%), and Two or more Races (24 | 3.0%).
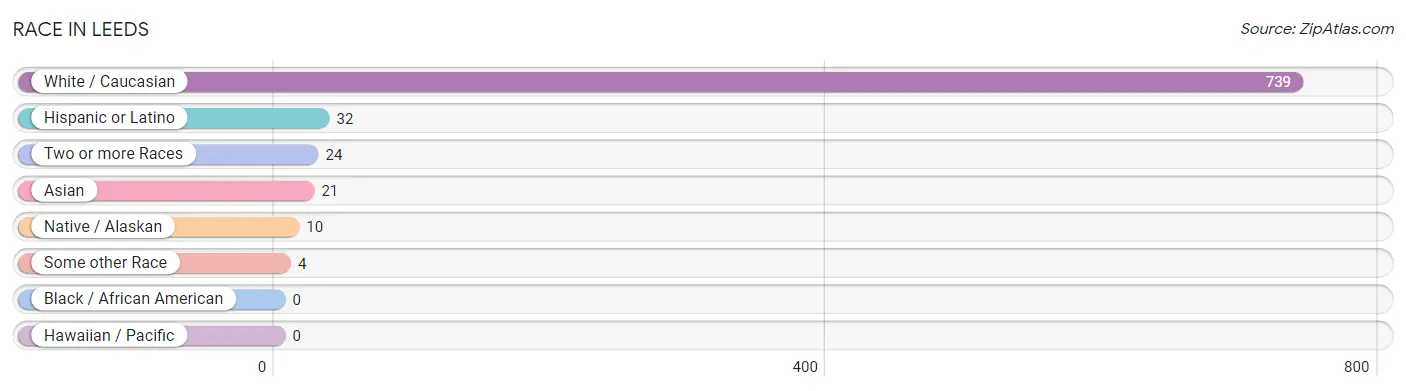
| Race | # Population | % Population |
| Asian | 21 | 2.6% |
| Black / African American | 0 | 0.0% |
| Hawaiian / Pacific | 0 | 0.0% |
| Hispanic or Latino | 32 | 4.0% |
| Native / Alaskan | 10 | 1.3% |
| White / Caucasian | 739 | 92.6% |
| Two or more Races | 24 | 3.0% |
| Some other Race | 4 | 0.5% |
| Total | 798 | 100.0% |
Ancestry in Leeds
The most populous ancestries reported in Leeds are English (284 | 35.6%), American (65 | 8.2%), Dutch (65 | 8.2%), German (65 | 8.2%), and Welsh (51 | 6.4%), together accounting for 66.4% of all Leeds residents.
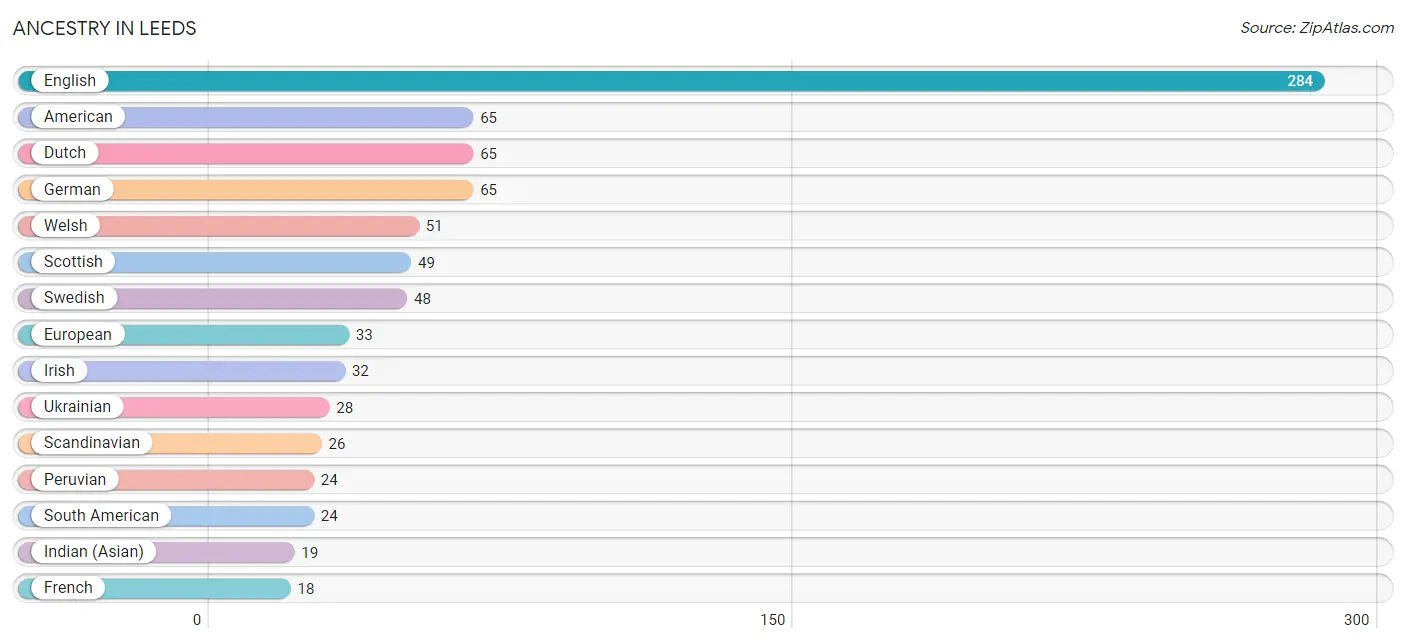
| Ancestry | # Population | % Population |
| American | 65 | 8.2% |
| Austrian | 4 | 0.5% |
| Bhutanese | 4 | 0.5% |
| British | 10 | 1.3% |
| Central American | 4 | 0.5% |
| Czech | 10 | 1.3% |
| Danish | 16 | 2.0% |
| Dutch | 65 | 8.2% |
| English | 284 | 35.6% |
| European | 33 | 4.1% |
| French | 18 | 2.3% |
| German | 65 | 8.2% |
| Guatemalan | 4 | 0.5% |
| Hungarian | 4 | 0.5% |
| Indian (Asian) | 19 | 2.4% |
| Irish | 32 | 4.0% |
| Italian | 9 | 1.1% |
| Korean | 7 | 0.9% |
| Mexican | 4 | 0.5% |
| Navajo | 10 | 1.3% |
| Northern European | 18 | 2.3% |
| Peruvian | 24 | 3.0% |
| Polish | 9 | 1.1% |
| Russian | 4 | 0.5% |
| Scandinavian | 26 | 3.3% |
| Scottish | 49 | 6.1% |
| Slavic | 14 | 1.8% |
| South American | 24 | 3.0% |
| Swedish | 48 | 6.0% |
| Ukrainian | 28 | 3.5% |
| Welsh | 51 | 6.4% | View All 31 Rows |
Immigrants in Leeds
The most numerous immigrant groups reported in Leeds came from Latin America (28 | 3.5%), Peru (24 | 3.0%), South America (24 | 3.0%), Asia (21 | 2.6%), and South Eastern Asia (21 | 2.6%), together accounting for 14.8% of all Leeds residents.
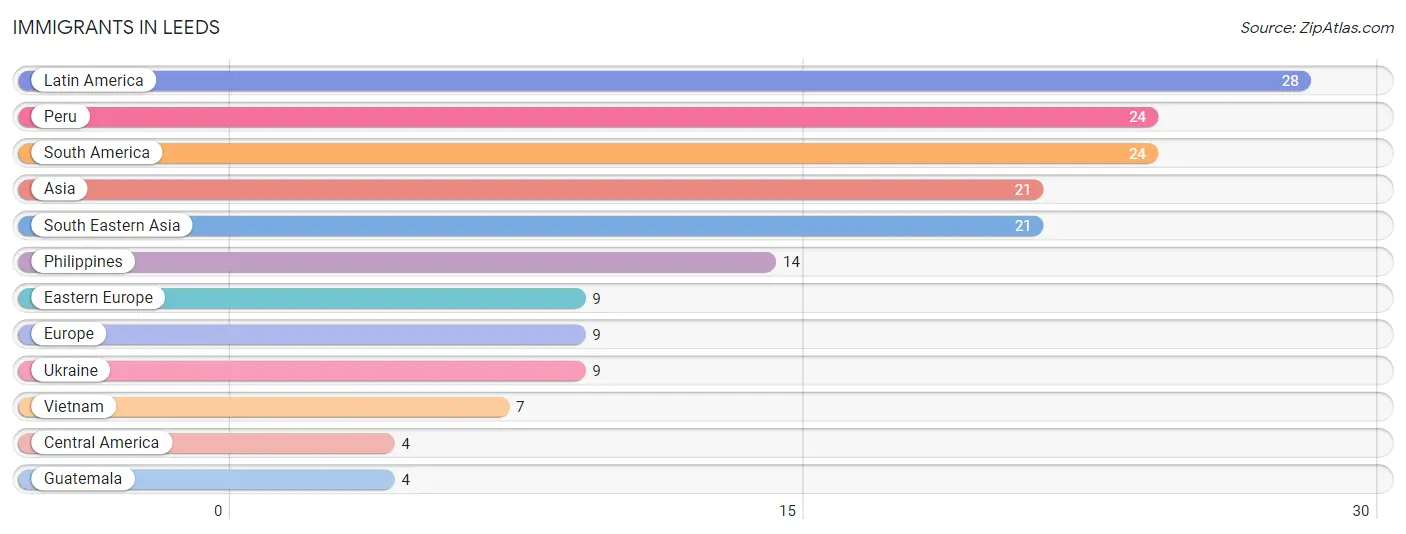
| Immigration Origin | # Population | % Population |
| Asia | 21 | 2.6% |
| Central America | 4 | 0.5% |
| Eastern Europe | 9 | 1.1% |
| Europe | 9 | 1.1% |
| Guatemala | 4 | 0.5% |
| Latin America | 28 | 3.5% |
| Peru | 24 | 3.0% |
| Philippines | 14 | 1.8% |
| South America | 24 | 3.0% |
| South Eastern Asia | 21 | 2.6% |
| Ukraine | 9 | 1.1% |
| Vietnam | 7 | 0.9% | View All 12 Rows |
Sex and Age in Leeds
Sex and Age in Leeds
The most populous age groups in Leeds are 50 to 54 Years (54 | 13.3%) for men and 70 to 74 Years (104 | 26.5%) for women.
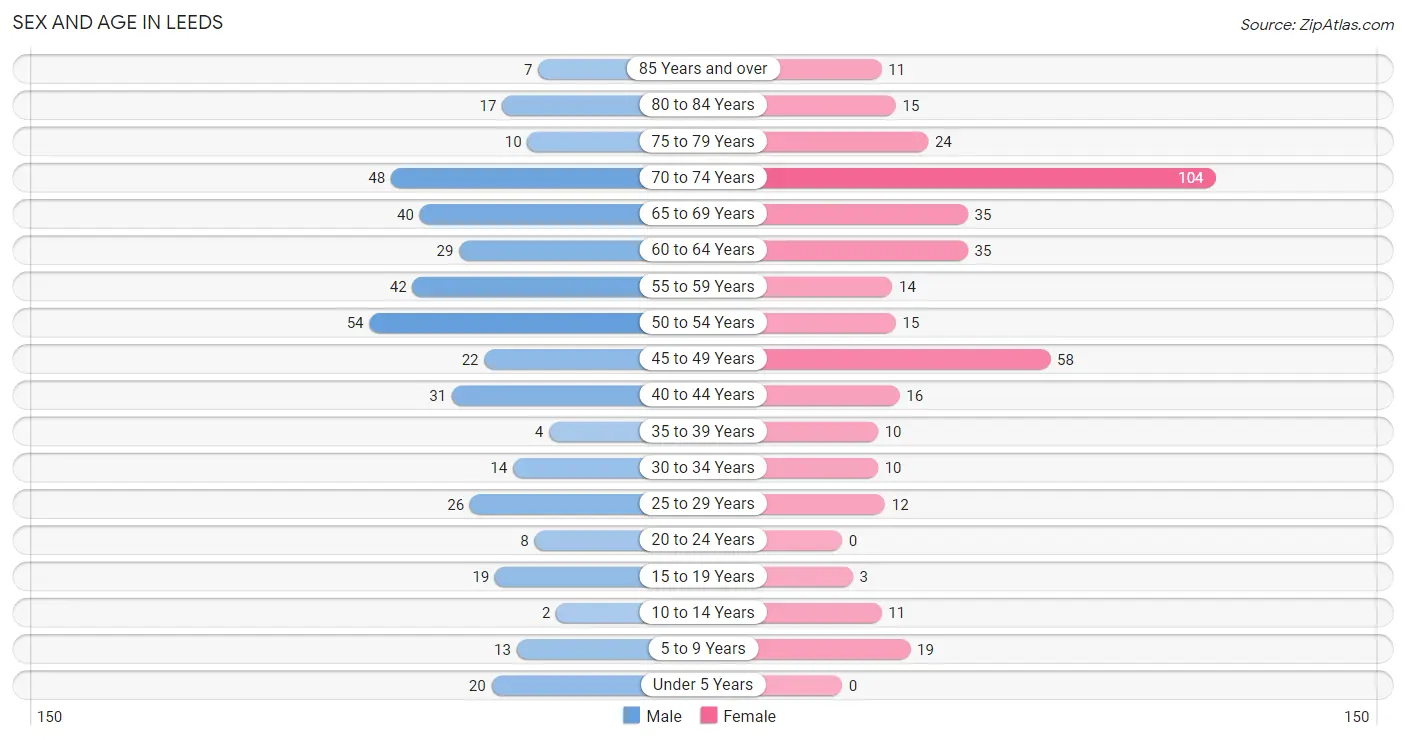
| Age Bracket | Male | Female |
| Under 5 Years | 20 (4.9%) | 0 (0.0%) |
| 5 to 9 Years | 13 (3.2%) | 19 (4.9%) |
| 10 to 14 Years | 2 (0.5%) | 11 (2.8%) |
| 15 to 19 Years | 19 (4.7%) | 3 (0.8%) |
| 20 to 24 Years | 8 (2.0%) | 0 (0.0%) |
| 25 to 29 Years | 26 (6.4%) | 12 (3.1%) |
| 30 to 34 Years | 14 (3.5%) | 10 (2.5%) |
| 35 to 39 Years | 4 (1.0%) | 10 (2.5%) |
| 40 to 44 Years | 31 (7.6%) | 16 (4.1%) |
| 45 to 49 Years | 22 (5.4%) | 58 (14.8%) |
| 50 to 54 Years | 54 (13.3%) | 15 (3.8%) |
| 55 to 59 Years | 42 (10.3%) | 14 (3.6%) |
| 60 to 64 Years | 29 (7.1%) | 35 (8.9%) |
| 65 to 69 Years | 40 (9.9%) | 35 (8.9%) |
| 70 to 74 Years | 48 (11.8%) | 104 (26.5%) |
| 75 to 79 Years | 10 (2.5%) | 24 (6.1%) |
| 80 to 84 Years | 17 (4.2%) | 15 (3.8%) |
| 85 Years and over | 7 (1.7%) | 11 (2.8%) |
| Total | 406 (100.0%) | 392 (100.0%) |
Families and Households in Leeds
Median Family Size in Leeds
The median family size in Leeds is 2.71 persons per family, with single female/mother families (13 | 5.4%) accounting for the largest median family size of 3.77 persons per family. On the other hand, single male/father families (55 | 22.9%) represent the smallest median family size with 2.20 persons per family.
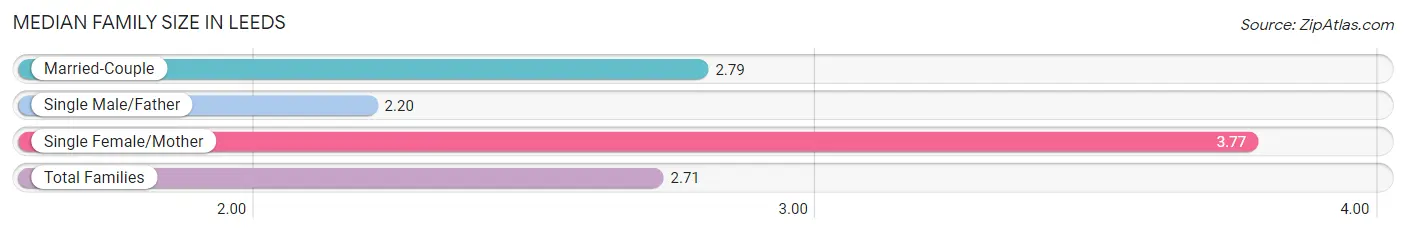
| Family Type | # Families | Family Size |
| Married-Couple | 172 (71.7%) | 2.79 |
| Single Male/Father | 55 (22.9%) | 2.20 |
| Single Female/Mother | 13 (5.4%) | 3.77 |
| Total Families | 240 (100.0%) | 2.71 |
Median Household Size in Leeds
The median household size in Leeds is 2.57 persons per household, with single female/mother households (13 | 4.2%) accounting for the largest median household size of 4.54 persons per household. non-family households (70 | 22.6%) represent the smallest median household size with 1.30 persons per household.
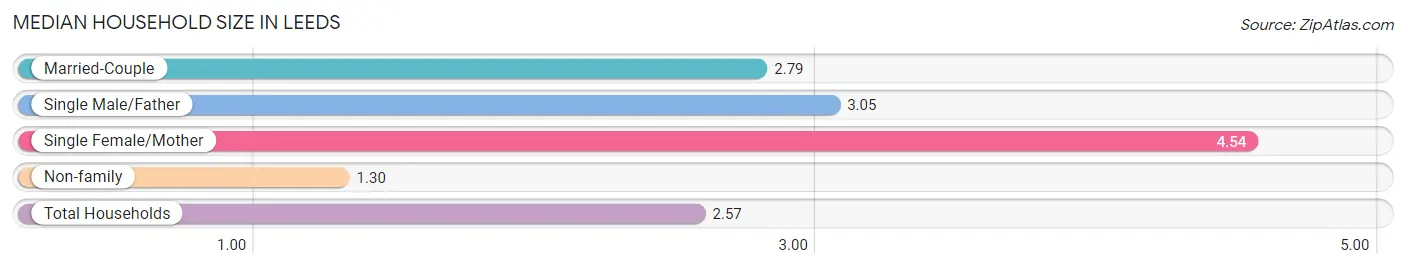
| Household Type | # Households | Household Size |
| Married-Couple | 172 (55.5%) | 2.79 |
| Single Male/Father | 55 (17.7%) | 3.05 |
| Single Female/Mother | 13 (4.2%) | 4.54 |
| Non-family | 70 (22.6%) | 1.30 |
| Total Households | 310 (100.0%) | 2.57 |
Household Size by Marriage Status in Leeds
Out of a total of 310 households in Leeds, 240 (77.4%) are family households, while 70 (22.6%) are nonfamily households. The most numerous type of family households are 2-person households, comprising 129, and the most common type of nonfamily households are 1-person households, comprising 49.
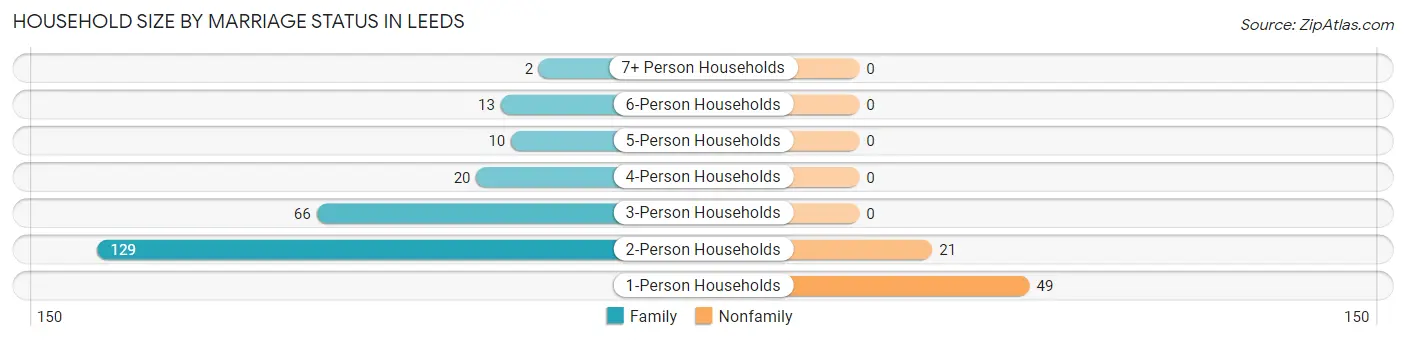
| Household Size | Family Households | Nonfamily Households |
| 1-Person Households | - | 49 (15.8%) |
| 2-Person Households | 129 (41.6%) | 21 (6.8%) |
| 3-Person Households | 66 (21.3%) | 0 (0.0%) |
| 4-Person Households | 20 (6.5%) | 0 (0.0%) |
| 5-Person Households | 10 (3.2%) | 0 (0.0%) |
| 6-Person Households | 13 (4.2%) | 0 (0.0%) |
| 7+ Person Households | 2 (0.6%) | 0 (0.0%) |
| Total | 240 (77.4%) | 70 (22.6%) |
Female Fertility in Leeds
Fertility by Age in Leeds
| Age Bracket | Women with Births | Births / 1,000 Women |
| 15 to 19 years | 0 (0.0%) | 0.0 |
| 20 to 34 years | 0 (0.0%) | 0.0 |
| 35 to 50 years | 0 (0.0%) | 0.0 |
| Total | 0 (0.0%) | 0.0 |
Fertility by Age by Marriage Status in Leeds
| Age Bracket | Married | Unmarried |
| 15 to 19 years | 0 (0.0%) | 0 (0.0%) |
| 20 to 34 years | 0 (0.0%) | 0 (0.0%) |
| 35 to 50 years | 0 (0.0%) | 0 (0.0%) |
| Total | 0 (0.0%) | 0 (0.0%) |
Fertility by Education in Leeds
| Educational Attainment | Women with Births | Births / 1,000 Women |
| Less than High School | 0 (0.0%) | 0.0 |
| High School Diploma | 0 (0.0%) | 0.0 |
| College or Associate's Degree | 0 (0.0%) | 0.0 |
| Bachelor's Degree | 0 (0.0%) | 0.0 |
| Graduate Degree | 0 (0.0%) | 0.0 |
| Total | 0 (0.0%) | 0.0 |
Fertility by Education by Marriage Status in Leeds
| Educational Attainment | Married | Unmarried |
| Less than High School | 0 (0.0%) | 0 (0.0%) |
| High School Diploma | 0 (0.0%) | 0 (0.0%) |
| College or Associate's Degree | 0 (0.0%) | 0 (0.0%) |
| Bachelor's Degree | 0 (0.0%) | 0 (0.0%) |
| Graduate Degree | 0 (0.0%) | 0 (0.0%) |
| Total | 0 (0.0%) | 0 (0.0%) |
Employment Characteristics in Leeds
Employment by Class of Employer in Leeds
Among the 315 employed individuals in Leeds, private company employees (228 | 72.4%), not-for-profit organizations (51 | 16.2%), and local government employees (15 | 4.8%) make up the most common classes of employment.
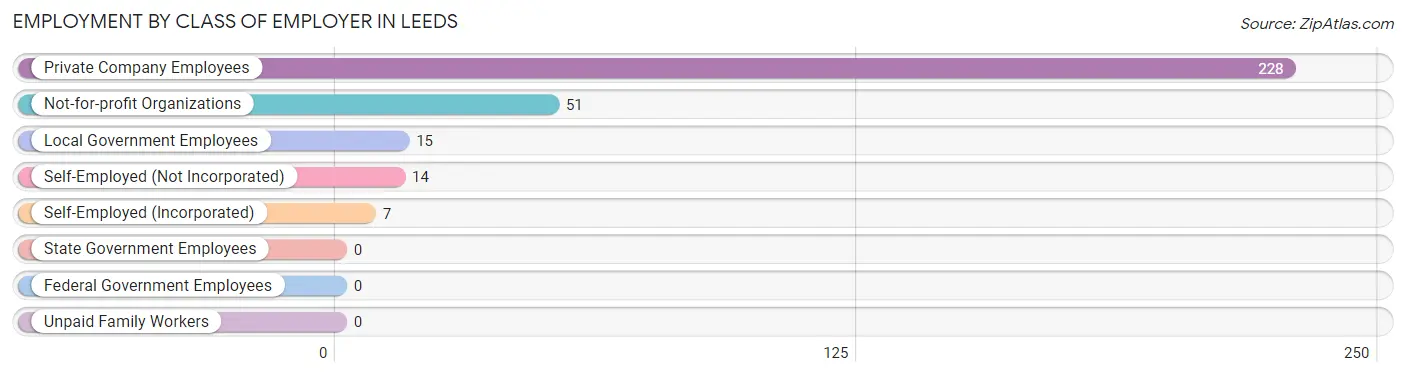
| Employer Class | # Employees | % Employees |
| Private Company Employees | 228 | 72.4% |
| Self-Employed (Incorporated) | 7 | 2.2% |
| Self-Employed (Not Incorporated) | 14 | 4.4% |
| Not-for-profit Organizations | 51 | 16.2% |
| Local Government Employees | 15 | 4.8% |
| State Government Employees | 0 | 0.0% |
| Federal Government Employees | 0 | 0.0% |
| Unpaid Family Workers | 0 | 0.0% |
| Total | 315 | 100.0% |
Employment Status by Age in Leeds
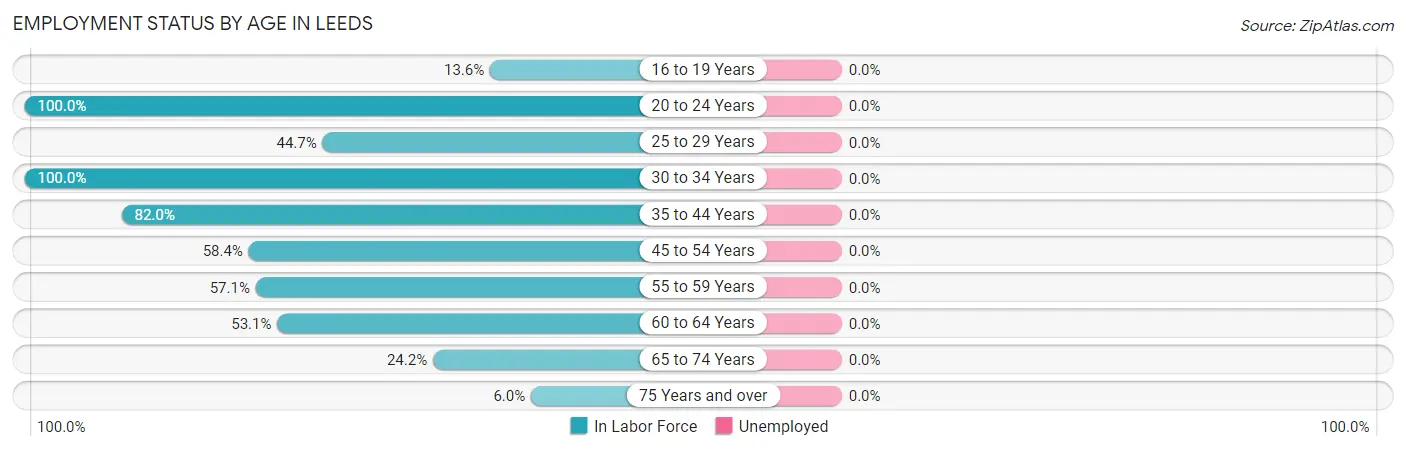
| Age Bracket | In Labor Force | Unemployed |
| 16 to 19 Years | 3 (13.6%) | 0 (0.0%) |
| 20 to 24 Years | 8 (100.0%) | 0 (0.0%) |
| 25 to 29 Years | 17 (44.7%) | 0 (0.0%) |
| 30 to 34 Years | 24 (100.0%) | 0 (0.0%) |
| 35 to 44 Years | 50 (82.0%) | 0 (0.0%) |
| 45 to 54 Years | 87 (58.4%) | 0 (0.0%) |
| 55 to 59 Years | 32 (57.1%) | 0 (0.0%) |
| 60 to 64 Years | 34 (53.1%) | 0 (0.0%) |
| 65 to 74 Years | 55 (24.2%) | 0 (0.0%) |
| 75 Years and over | 5 (6.0%) | 0 (0.0%) |
| Total | 315 (43.0%) | 0 (0.0%) |
Employment Status by Educational Attainment in Leeds
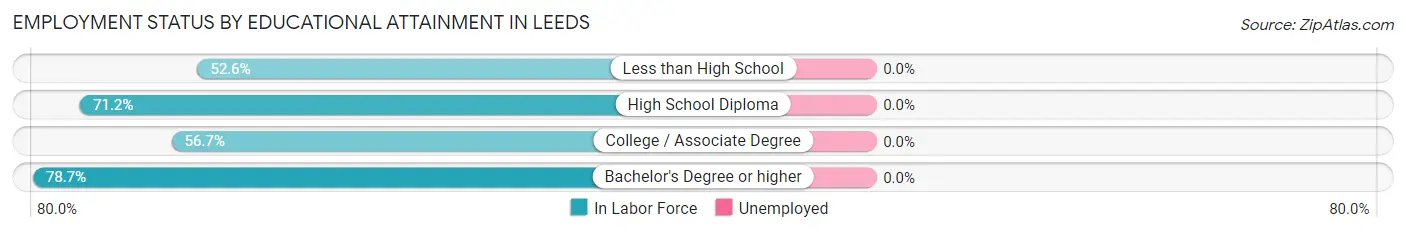
| Educational Attainment | In Labor Force | Unemployed |
| Less than High School | 60 (52.6%) | 0 (0.0%) |
| High School Diploma | 79 (71.2%) | 0 (0.0%) |
| College / Associate Degree | 68 (56.7%) | 0 (0.0%) |
| Bachelor's Degree or higher | 37 (78.7%) | 0 (0.0%) |
| Total | 244 (62.2%) | 0 (0.0%) |
Employment Occupations by Sex in Leeds
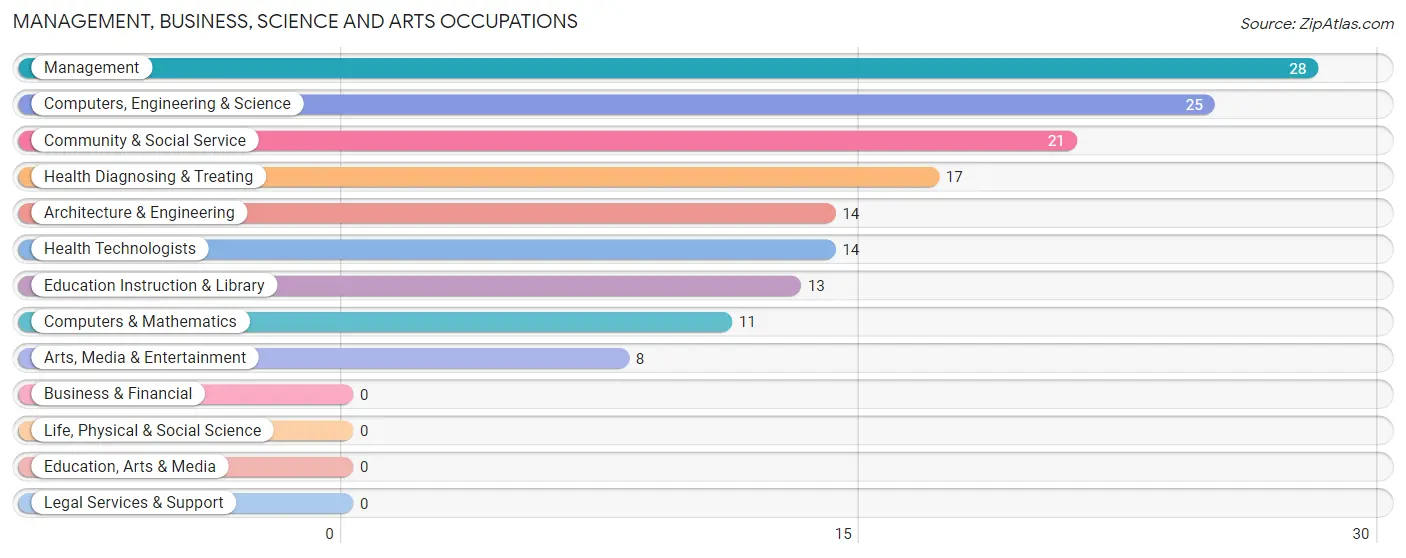
Management, Business, Science and Arts Occupations
The most common Management, Business, Science and Arts occupations in Leeds are Management (28 | 8.9%), Computers, Engineering & Science (25 | 7.9%), Community & Social Service (21 | 6.7%), Health Diagnosing & Treating (17 | 5.4%), and Architecture & Engineering (14 | 4.4%).
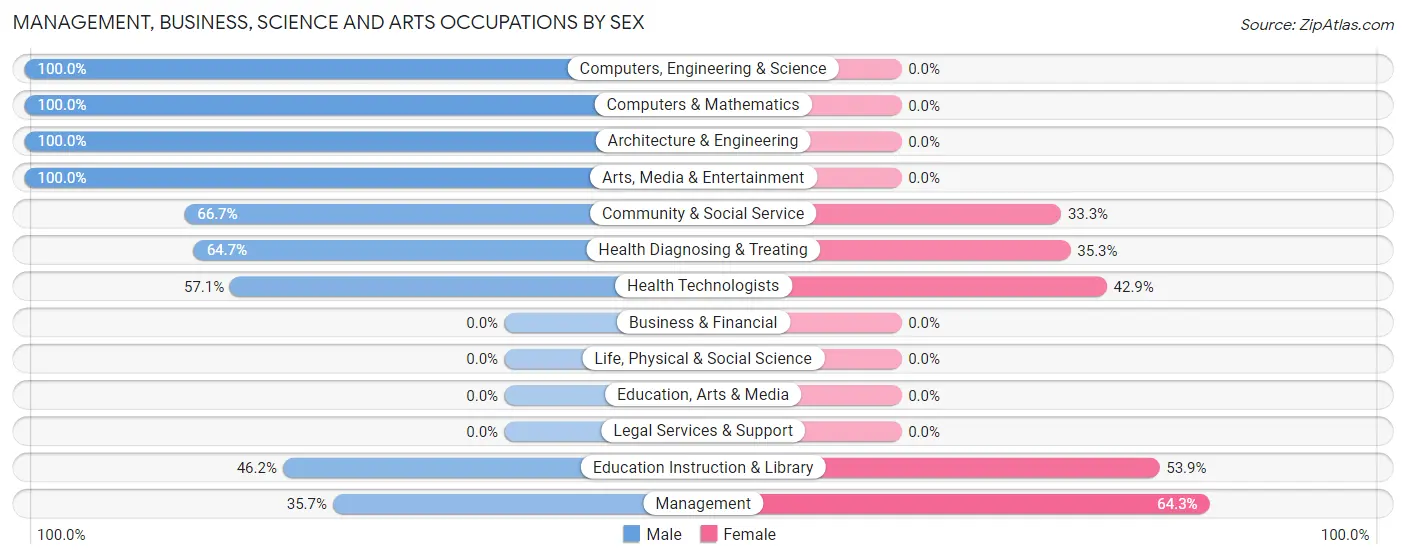
Management, Business, Science and Arts Occupations by Sex
Within the Management, Business, Science and Arts occupations in Leeds, the most male-oriented occupations are Computers, Engineering & Science (100.0%), Computers & Mathematics (100.0%), and Architecture & Engineering (100.0%), while the most female-oriented occupations are Management (64.3%), Education Instruction & Library (53.8%), and Health Technologists (42.9%).
| Occupation | Male | Female |
| Management | 10 (35.7%) | 18 (64.3%) |
| Business & Financial | 0 (0.0%) | 0 (0.0%) |
| Computers, Engineering & Science | 25 (100.0%) | 0 (0.0%) |
| Computers & Mathematics | 11 (100.0%) | 0 (0.0%) |
| Architecture & Engineering | 14 (100.0%) | 0 (0.0%) |
| Life, Physical & Social Science | 0 (0.0%) | 0 (0.0%) |
| Community & Social Service | 14 (66.7%) | 7 (33.3%) |
| Education, Arts & Media | 0 (0.0%) | 0 (0.0%) |
| Legal Services & Support | 0 (0.0%) | 0 (0.0%) |
| Education Instruction & Library | 6 (46.2%) | 7 (53.8%) |
| Arts, Media & Entertainment | 8 (100.0%) | 0 (0.0%) |
| Health Diagnosing & Treating | 11 (64.7%) | 6 (35.3%) |
| Health Technologists | 8 (57.1%) | 6 (42.9%) |
| Total (Category) | 60 (65.9%) | 31 (34.1%) |
| Total (Overall) | 217 (68.9%) | 98 (31.1%) |
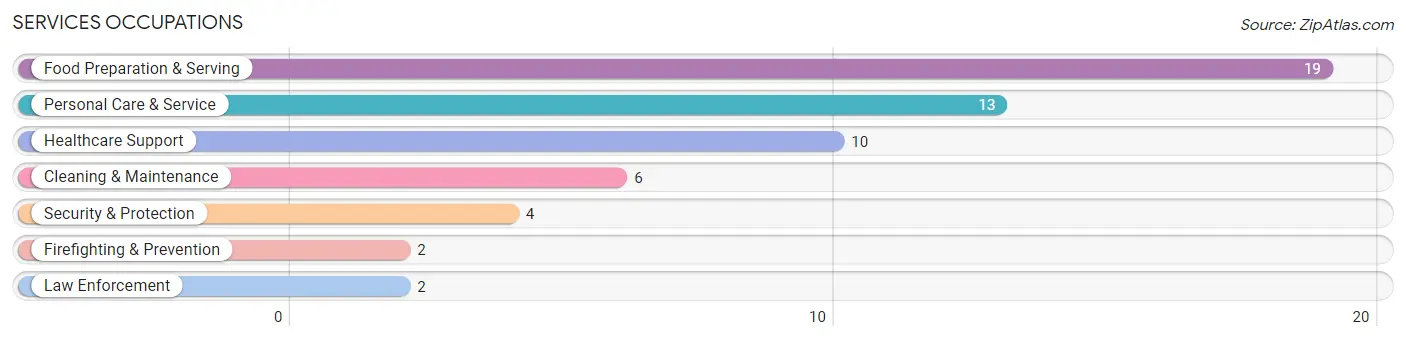
Services Occupations
The most common Services occupations in Leeds are Food Preparation & Serving (19 | 6.0%), Personal Care & Service (13 | 4.1%), Healthcare Support (10 | 3.2%), Cleaning & Maintenance (6 | 1.9%), and Security & Protection (4 | 1.3%).
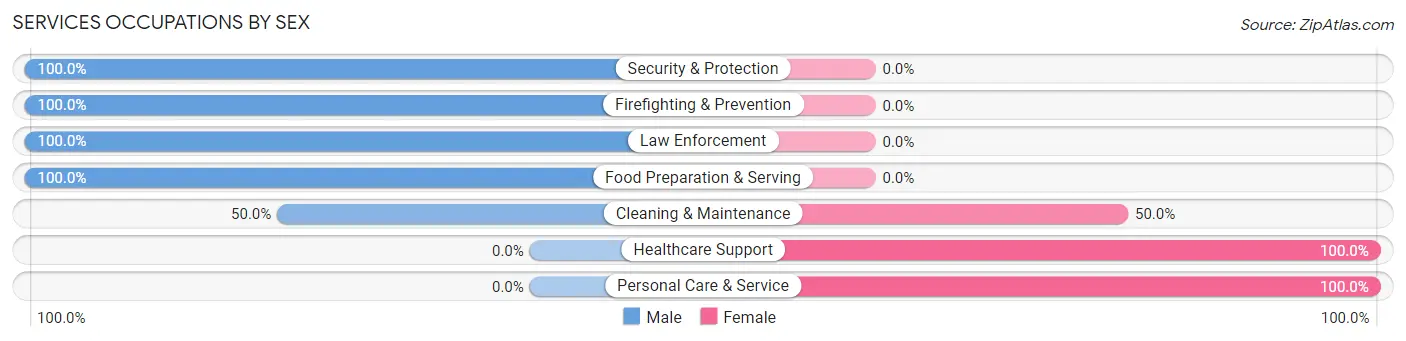
Services Occupations by Sex
Within the Services occupations in Leeds, the most male-oriented occupations are Security & Protection (100.0%), Firefighting & Prevention (100.0%), and Law Enforcement (100.0%), while the most female-oriented occupations are Healthcare Support (100.0%), Personal Care & Service (100.0%), and Cleaning & Maintenance (50.0%).
| Occupation | Male | Female |
| Healthcare Support | 0 (0.0%) | 10 (100.0%) |
| Security & Protection | 4 (100.0%) | 0 (0.0%) |
| Firefighting & Prevention | 2 (100.0%) | 0 (0.0%) |
| Law Enforcement | 2 (100.0%) | 0 (0.0%) |
| Food Preparation & Serving | 19 (100.0%) | 0 (0.0%) |
| Cleaning & Maintenance | 3 (50.0%) | 3 (50.0%) |
| Personal Care & Service | 0 (0.0%) | 13 (100.0%) |
| Total (Category) | 26 (50.0%) | 26 (50.0%) |
| Total (Overall) | 217 (68.9%) | 98 (31.1%) |
Sales and Office Occupations
The most common Sales and Office occupations in Leeds are Sales & Related (43 | 13.7%), and Office & Administration (18 | 5.7%).
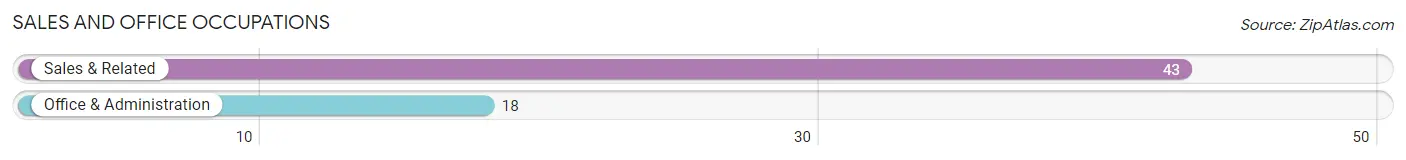
Sales and Office Occupations by Sex
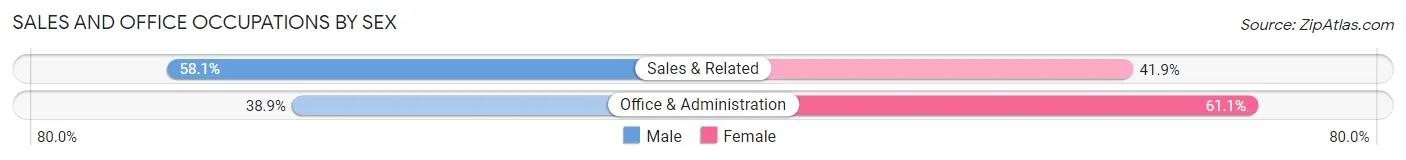
| Occupation | Male | Female |
| Sales & Related | 25 (58.1%) | 18 (41.9%) |
| Office & Administration | 7 (38.9%) | 11 (61.1%) |
| Total (Category) | 32 (52.5%) | 29 (47.5%) |
| Total (Overall) | 217 (68.9%) | 98 (31.1%) |
Natural Resources, Construction and Maintenance Occupations
The most common Natural Resources, Construction and Maintenance occupations in Leeds are Farming, Fishing & Forestry (9 | 2.9%), Installation, Maintenance & Repair (9 | 2.9%), and Construction & Extraction (3 | 0.9%).
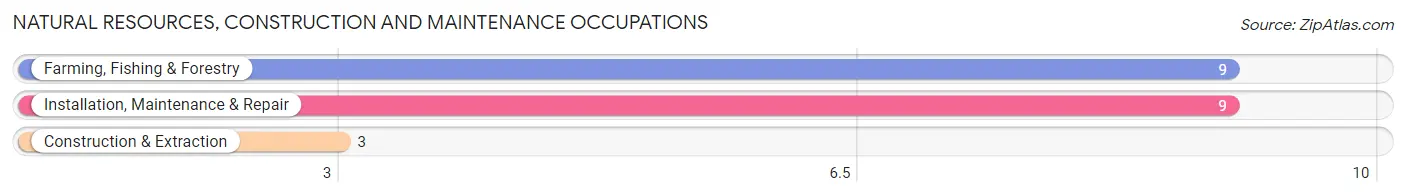
Natural Resources, Construction and Maintenance Occupations by Sex
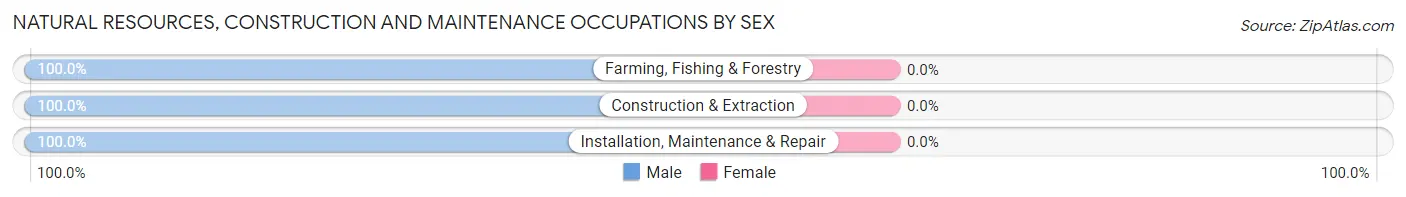
| Occupation | Male | Female |
| Farming, Fishing & Forestry | 9 (100.0%) | 0 (0.0%) |
| Construction & Extraction | 3 (100.0%) | 0 (0.0%) |
| Installation, Maintenance & Repair | 9 (100.0%) | 0 (0.0%) |
| Total (Category) | 21 (100.0%) | 0 (0.0%) |
| Total (Overall) | 217 (68.9%) | 98 (31.1%) |
Production, Transportation and Moving Occupations
The most common Production, Transportation and Moving occupations in Leeds are Material Moving (58 | 18.4%), Production (17 | 5.4%), and Transportation (15 | 4.8%).
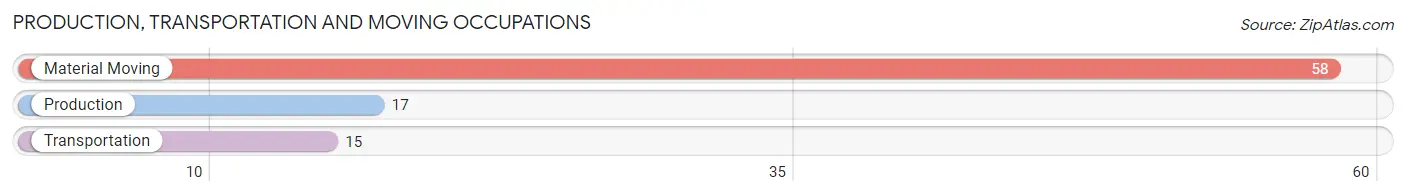
Production, Transportation and Moving Occupations by Sex
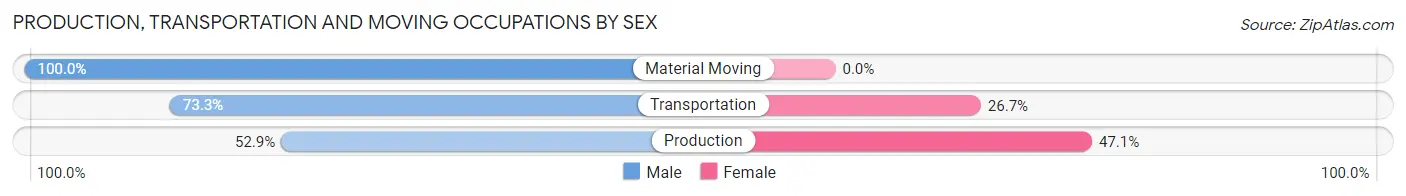
| Occupation | Male | Female |
| Production | 9 (52.9%) | 8 (47.1%) |
| Transportation | 11 (73.3%) | 4 (26.7%) |
| Material Moving | 58 (100.0%) | 0 (0.0%) |
| Total (Category) | 78 (86.7%) | 12 (13.3%) |
| Total (Overall) | 217 (68.9%) | 98 (31.1%) |
Employment Industries by Sex in Leeds
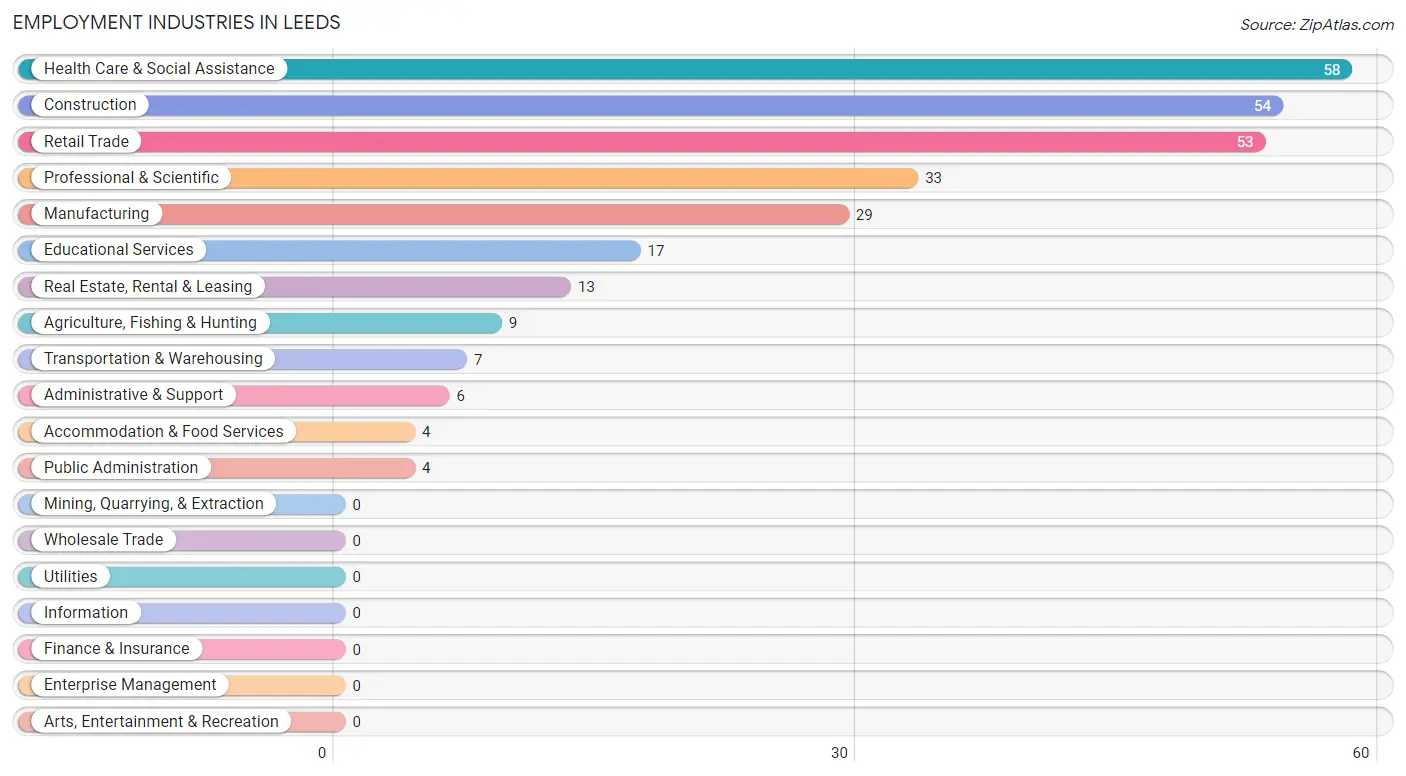
Employment Industries in Leeds
The major employment industries in Leeds include Health Care & Social Assistance (58 | 18.4%), Construction (54 | 17.1%), Retail Trade (53 | 16.8%), Professional & Scientific (33 | 10.5%), and Manufacturing (29 | 9.2%).
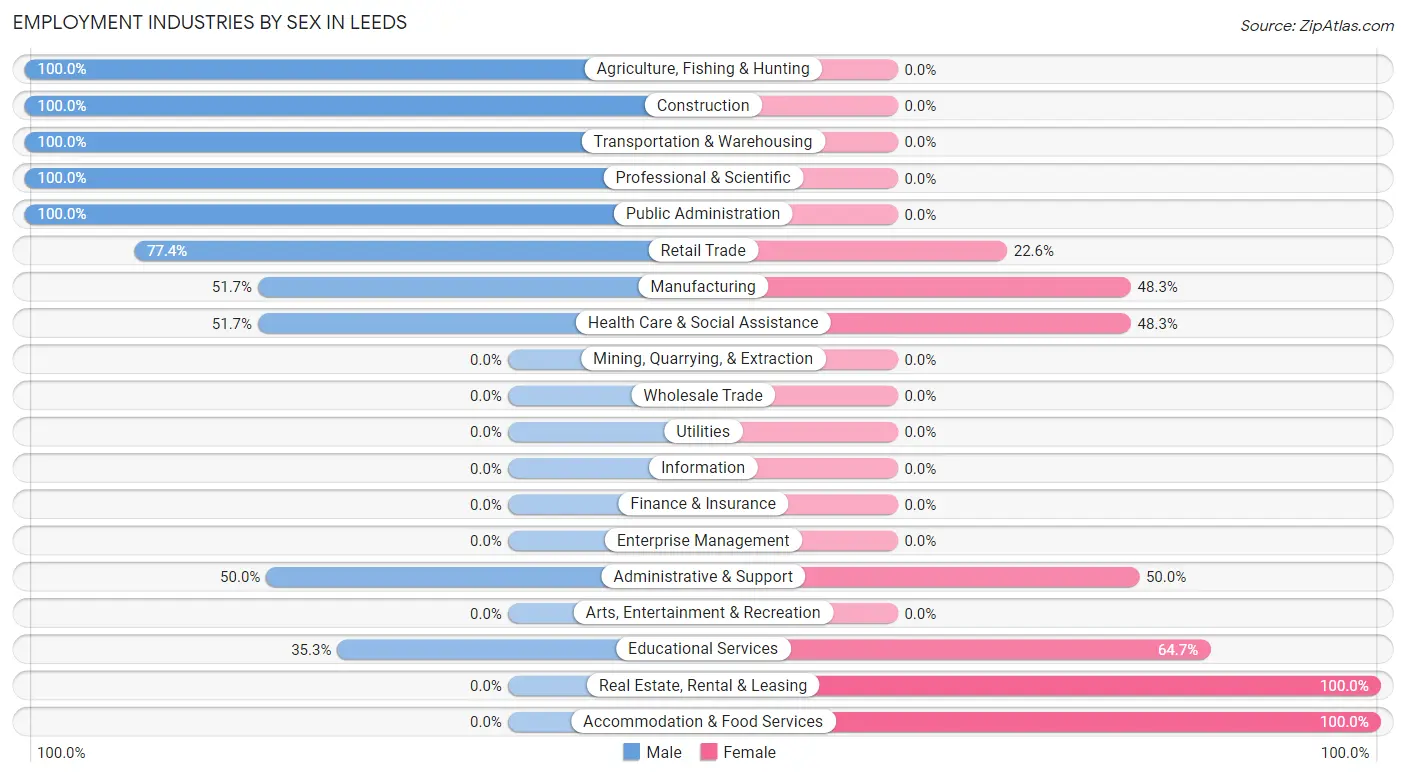
Employment Industries by Sex in Leeds
The Leeds industries that see more men than women are Agriculture, Fishing & Hunting (100.0%), Construction (100.0%), and Transportation & Warehousing (100.0%), whereas the industries that tend to have a higher number of women are Real Estate, Rental & Leasing (100.0%), Accommodation & Food Services (100.0%), and Educational Services (64.7%).
| Industry | Male | Female |
| Agriculture, Fishing & Hunting | 9 (100.0%) | 0 (0.0%) |
| Mining, Quarrying, & Extraction | 0 (0.0%) | 0 (0.0%) |
| Construction | 54 (100.0%) | 0 (0.0%) |
| Manufacturing | 15 (51.7%) | 14 (48.3%) |
| Wholesale Trade | 0 (0.0%) | 0 (0.0%) |
| Retail Trade | 41 (77.4%) | 12 (22.6%) |
| Transportation & Warehousing | 7 (100.0%) | 0 (0.0%) |
| Utilities | 0 (0.0%) | 0 (0.0%) |
| Information | 0 (0.0%) | 0 (0.0%) |
| Finance & Insurance | 0 (0.0%) | 0 (0.0%) |
| Real Estate, Rental & Leasing | 0 (0.0%) | 13 (100.0%) |
| Professional & Scientific | 33 (100.0%) | 0 (0.0%) |
| Enterprise Management | 0 (0.0%) | 0 (0.0%) |
| Administrative & Support | 3 (50.0%) | 3 (50.0%) |
| Educational Services | 6 (35.3%) | 11 (64.7%) |
| Health Care & Social Assistance | 30 (51.7%) | 28 (48.3%) |
| Arts, Entertainment & Recreation | 0 (0.0%) | 0 (0.0%) |
| Accommodation & Food Services | 0 (0.0%) | 4 (100.0%) |
| Public Administration | 4 (100.0%) | 0 (0.0%) |
| Total | 217 (68.9%) | 98 (31.1%) |
Education in Leeds
School Enrollment in Leeds
The most common levels of schooling among the 67 students in Leeds are elementary school (29 | 43.3%), high school (13 | 19.4%), and college / undergraduate (10 | 14.9%).
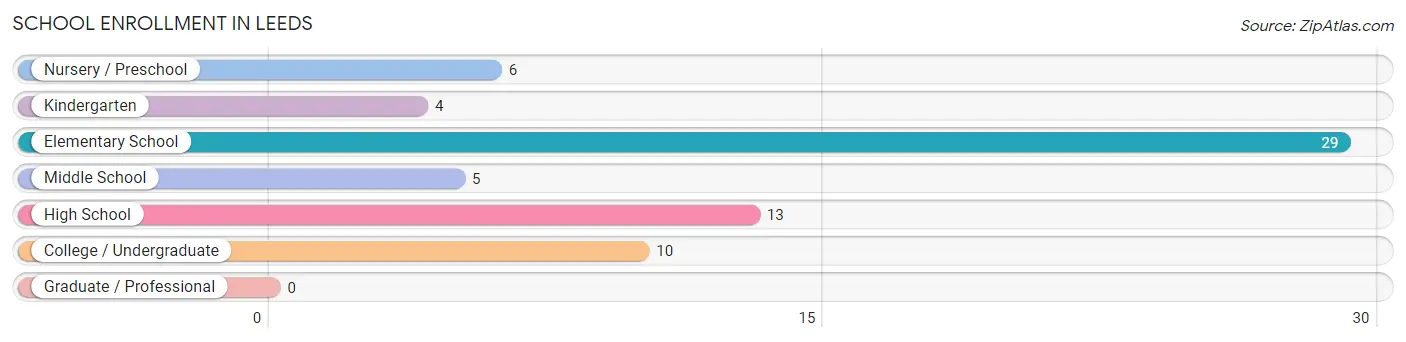
| School Level | # Students | % Students |
| Nursery / Preschool | 6 | 9.0% |
| Kindergarten | 4 | 6.0% |
| Elementary School | 29 | 43.3% |
| Middle School | 5 | 7.5% |
| High School | 13 | 19.4% |
| College / Undergraduate | 10 | 14.9% |
| Graduate / Professional | 0 | 0.0% |
| Total | 67 | 100.0% |
School Enrollment by Age by Funding Source in Leeds
Out of a total of 67 students who are enrolled in schools in Leeds, 3 (4.5%) attend a private institution, while the remaining 64 (95.5%) are enrolled in public schools. The age group of 10 to 14 year olds has the highest likelihood of being enrolled in private schools, with 3 (37.5% in the age bracket) enrolled. Conversely, the age group of 3 to 4 year olds has the lowest likelihood of being enrolled in a private school, with 6 (100.0% in the age bracket) attending a public institution.
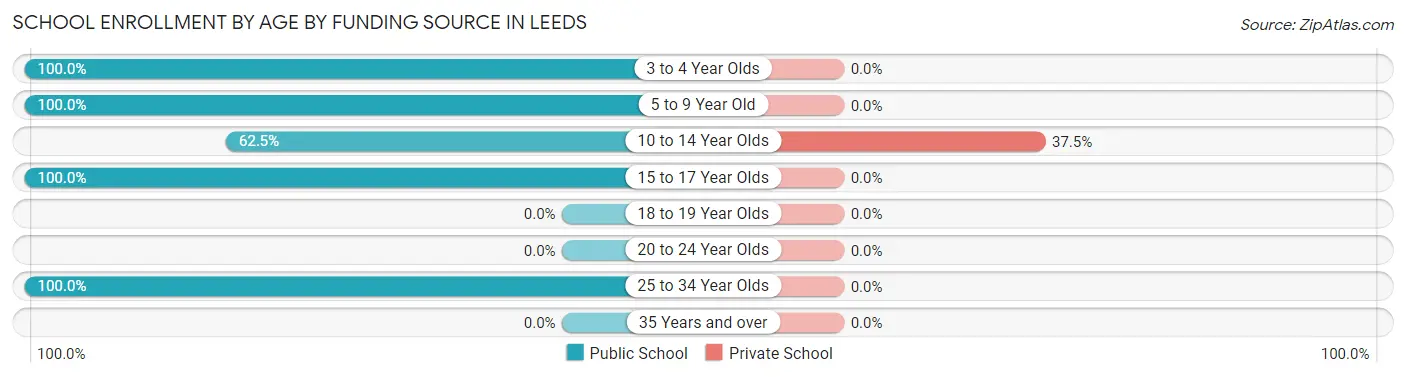
| Age Bracket | Public School | Private School |
| 3 to 4 Year Olds | 6 (100.0%) | 0 (0.0%) |
| 5 to 9 Year Old | 32 (100.0%) | 0 (0.0%) |
| 10 to 14 Year Olds | 5 (62.5%) | 3 (37.5%) |
| 15 to 17 Year Olds | 11 (100.0%) | 0 (0.0%) |
| 18 to 19 Year Olds | 0 (0.0%) | 0 (0.0%) |
| 20 to 24 Year Olds | 0 (0.0%) | 0 (0.0%) |
| 25 to 34 Year Olds | 10 (100.0%) | 0 (0.0%) |
| 35 Years and over | 0 (0.0%) | 0 (0.0%) |
| Total | 64 (95.5%) | 3 (4.5%) |
Educational Attainment by Field of Study in Leeds
Education (50 | 26.9%), science & technology (33 | 17.7%), bio, nature & agricultural (22 | 11.8%), engineering (19 | 10.2%), and arts & humanities (19 | 10.2%) are the most common fields of study among 186 individuals in Leeds who have obtained a bachelor's degree or higher.
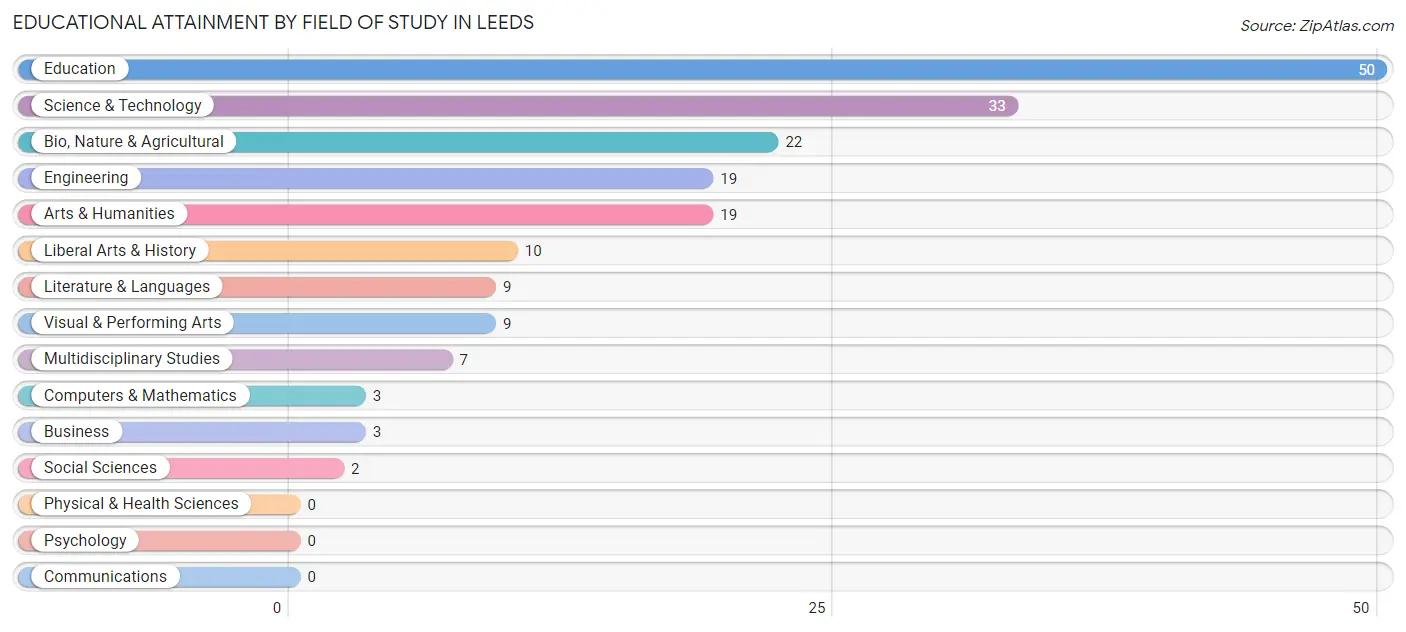
| Field of Study | # Graduates | % Graduates |
| Computers & Mathematics | 3 | 1.6% |
| Bio, Nature & Agricultural | 22 | 11.8% |
| Physical & Health Sciences | 0 | 0.0% |
| Psychology | 0 | 0.0% |
| Social Sciences | 2 | 1.1% |
| Engineering | 19 | 10.2% |
| Multidisciplinary Studies | 7 | 3.8% |
| Science & Technology | 33 | 17.7% |
| Business | 3 | 1.6% |
| Education | 50 | 26.9% |
| Literature & Languages | 9 | 4.8% |
| Liberal Arts & History | 10 | 5.4% |
| Visual & Performing Arts | 9 | 4.8% |
| Communications | 0 | 0.0% |
| Arts & Humanities | 19 | 10.2% |
| Total | 186 | 100.0% |
Transportation & Commute in Leeds
Vehicle Availability by Sex in Leeds
The most prevalent vehicle ownership categories in Leeds are males with 4 vehicles (108, accounting for 49.8%) and females with 4 vehicles (30, making up 110.2%).
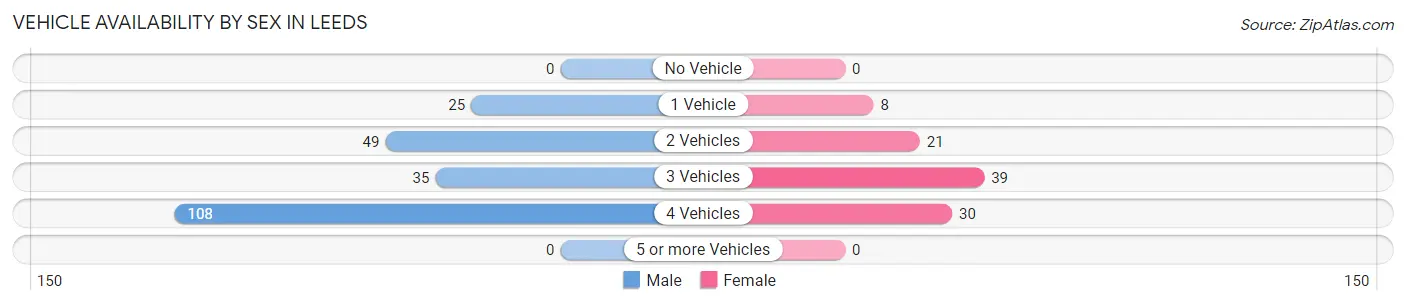
| Vehicles Available | Male | Female |
| No Vehicle | 0 (0.0%) | 0 (0.0%) |
| 1 Vehicle | 25 (11.5%) | 8 (8.2%) |
| 2 Vehicles | 49 (22.6%) | 21 (21.4%) |
| 3 Vehicles | 35 (16.1%) | 39 (39.8%) |
| 4 Vehicles | 108 (49.8%) | 30 (30.6%) |
| 5 or more Vehicles | 0 (0.0%) | 0 (0.0%) |
| Total | 217 (100.0%) | 98 (100.0%) |
Commute Time in Leeds
The most frequently occuring commute durations in Leeds are 30 to 34 minutes (79 commuters, 29.4%), 20 to 24 minutes (60 commuters, 22.3%), and 15 to 19 minutes (59 commuters, 21.9%).
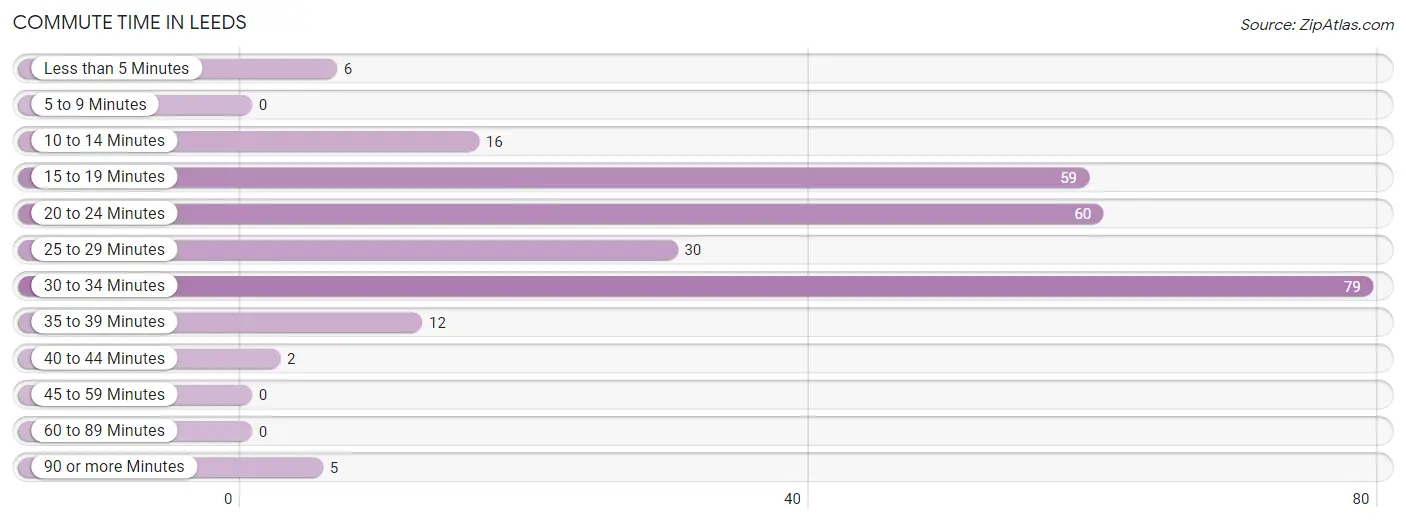
| Commute Time | # Commuters | % Commuters |
| Less than 5 Minutes | 6 | 2.2% |
| 5 to 9 Minutes | 0 | 0.0% |
| 10 to 14 Minutes | 16 | 5.9% |
| 15 to 19 Minutes | 59 | 21.9% |
| 20 to 24 Minutes | 60 | 22.3% |
| 25 to 29 Minutes | 30 | 11.2% |
| 30 to 34 Minutes | 79 | 29.4% |
| 35 to 39 Minutes | 12 | 4.5% |
| 40 to 44 Minutes | 2 | 0.7% |
| 45 to 59 Minutes | 0 | 0.0% |
| 60 to 89 Minutes | 0 | 0.0% |
| 90 or more Minutes | 5 | 1.9% |
Commute Time by Sex in Leeds
The most common commute times in Leeds are 30 to 34 minutes (75 commuters, 38.9%) for males and 25 to 29 minutes (27 commuters, 35.5%) for females.
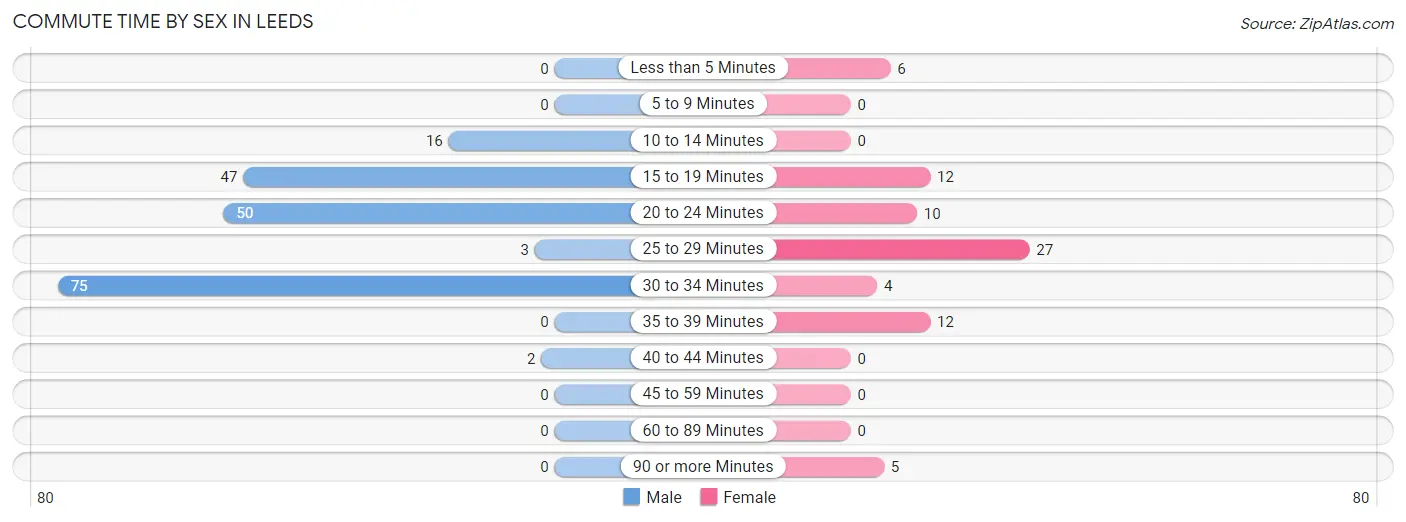
| Commute Time | Male | Female |
| Less than 5 Minutes | 0 (0.0%) | 6 (7.9%) |
| 5 to 9 Minutes | 0 (0.0%) | 0 (0.0%) |
| 10 to 14 Minutes | 16 (8.3%) | 0 (0.0%) |
| 15 to 19 Minutes | 47 (24.3%) | 12 (15.8%) |
| 20 to 24 Minutes | 50 (25.9%) | 10 (13.2%) |
| 25 to 29 Minutes | 3 (1.5%) | 27 (35.5%) |
| 30 to 34 Minutes | 75 (38.9%) | 4 (5.3%) |
| 35 to 39 Minutes | 0 (0.0%) | 12 (15.8%) |
| 40 to 44 Minutes | 2 (1.0%) | 0 (0.0%) |
| 45 to 59 Minutes | 0 (0.0%) | 0 (0.0%) |
| 60 to 89 Minutes | 0 (0.0%) | 0 (0.0%) |
| 90 or more Minutes | 0 (0.0%) | 5 (6.6%) |
Time of Departure to Work by Sex in Leeds
The most frequent times of departure to work in Leeds are 4:00 PM to 11:59 PM (55, 28.5%) for males and 8:00 AM to 8:29 AM (27, 35.5%) for females.
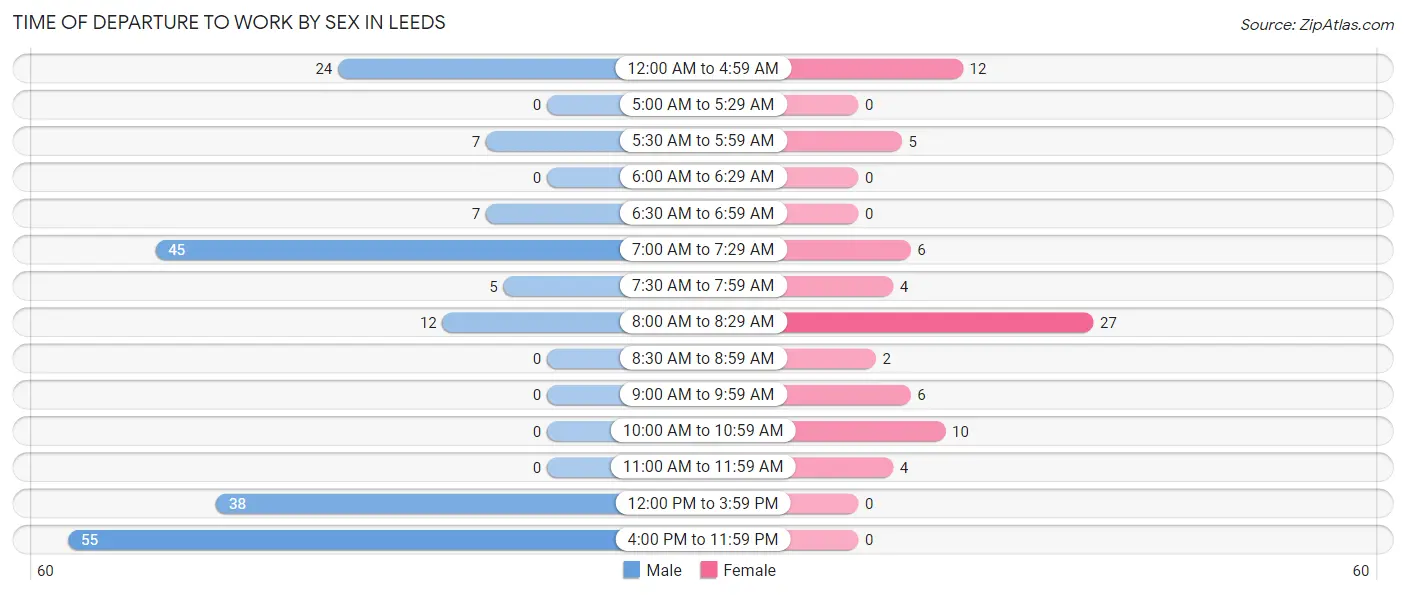
| Time of Departure | Male | Female |
| 12:00 AM to 4:59 AM | 24 (12.4%) | 12 (15.8%) |
| 5:00 AM to 5:29 AM | 0 (0.0%) | 0 (0.0%) |
| 5:30 AM to 5:59 AM | 7 (3.6%) | 5 (6.6%) |
| 6:00 AM to 6:29 AM | 0 (0.0%) | 0 (0.0%) |
| 6:30 AM to 6:59 AM | 7 (3.6%) | 0 (0.0%) |
| 7:00 AM to 7:29 AM | 45 (23.3%) | 6 (7.9%) |
| 7:30 AM to 7:59 AM | 5 (2.6%) | 4 (5.3%) |
| 8:00 AM to 8:29 AM | 12 (6.2%) | 27 (35.5%) |
| 8:30 AM to 8:59 AM | 0 (0.0%) | 2 (2.6%) |
| 9:00 AM to 9:59 AM | 0 (0.0%) | 6 (7.9%) |
| 10:00 AM to 10:59 AM | 0 (0.0%) | 10 (13.2%) |
| 11:00 AM to 11:59 AM | 0 (0.0%) | 4 (5.3%) |
| 12:00 PM to 3:59 PM | 38 (19.7%) | 0 (0.0%) |
| 4:00 PM to 11:59 PM | 55 (28.5%) | 0 (0.0%) |
| Total | 193 (100.0%) | 76 (100.0%) |
Housing Occupancy in Leeds
Occupancy by Ownership in Leeds
Of the total 310 dwellings in Leeds, owner-occupied units account for 250 (80.6%), while renter-occupied units make up 60 (19.4%).
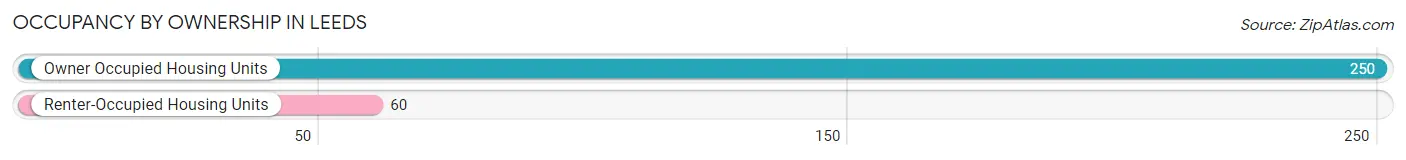
| Occupancy | # Housing Units | % Housing Units |
| Owner Occupied Housing Units | 250 | 80.6% |
| Renter-Occupied Housing Units | 60 | 19.4% |
| Total Occupied Housing Units | 310 | 100.0% |
Occupancy by Household Size in Leeds
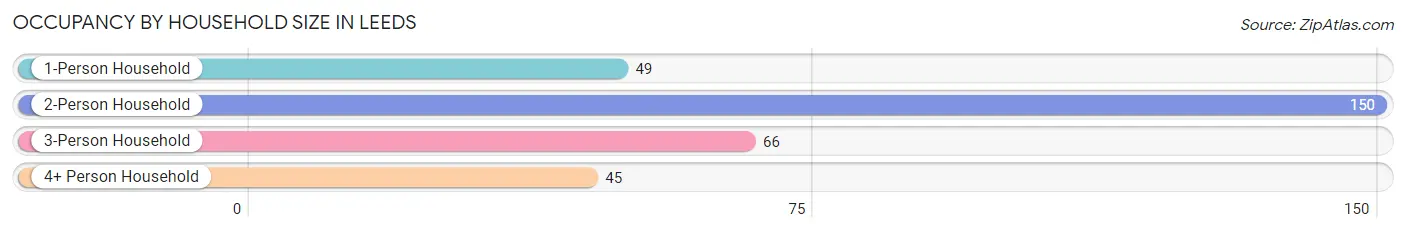
| Household Size | # Housing Units | % Housing Units |
| 1-Person Household | 49 | 15.8% |
| 2-Person Household | 150 | 48.4% |
| 3-Person Household | 66 | 21.3% |
| 4+ Person Household | 45 | 14.5% |
| Total Housing Units | 310 | 100.0% |
Occupancy by Ownership by Household Size in Leeds
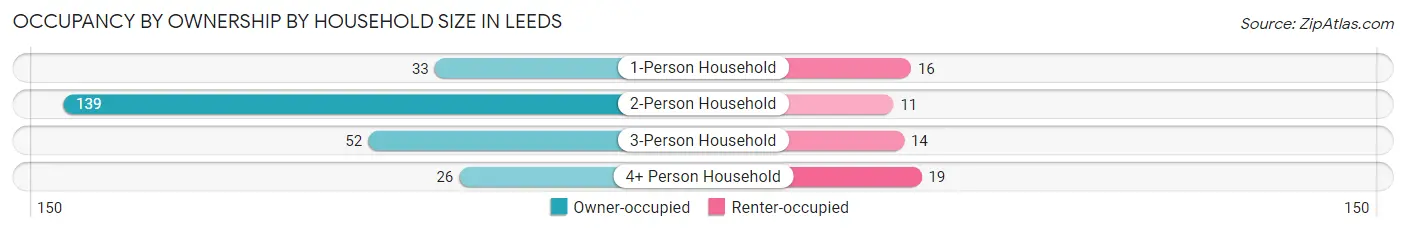
| Household Size | Owner-occupied | Renter-occupied |
| 1-Person Household | 33 (67.3%) | 16 (32.7%) |
| 2-Person Household | 139 (92.7%) | 11 (7.3%) |
| 3-Person Household | 52 (78.8%) | 14 (21.2%) |
| 4+ Person Household | 26 (57.8%) | 19 (42.2%) |
| Total Housing Units | 250 (80.6%) | 60 (19.4%) |
Occupancy by Educational Attainment in Leeds
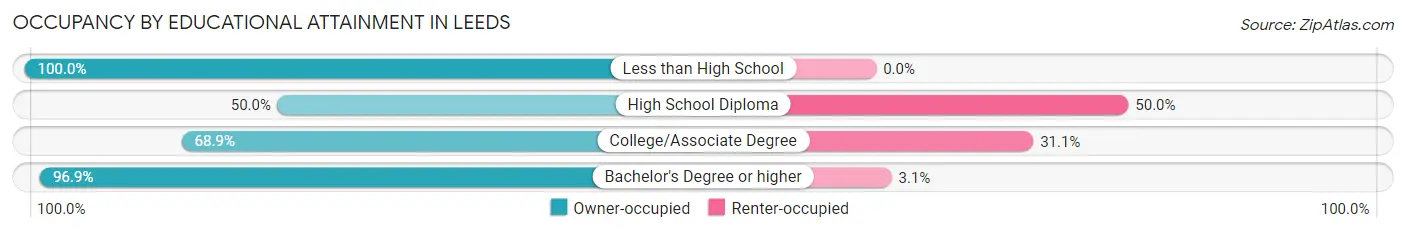
| Household Size | Owner-occupied | Renter-occupied |
| Less than High School | 58 (100.0%) | 0 (0.0%) |
| High School Diploma | 24 (50.0%) | 24 (50.0%) |
| College/Associate Degree | 73 (68.9%) | 33 (31.1%) |
| Bachelor's Degree or higher | 95 (96.9%) | 3 (3.1%) |
Occupancy by Age of Householder in Leeds
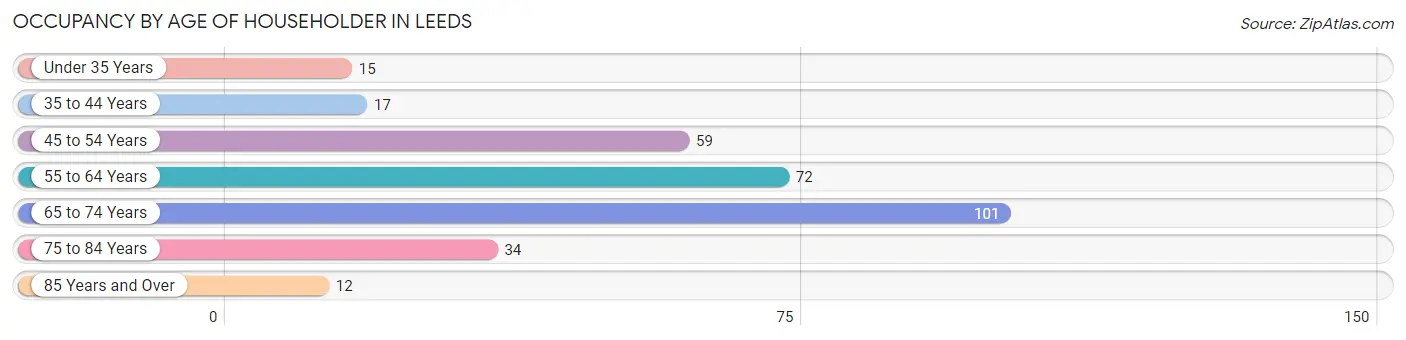
| Age Bracket | # Households | % Households |
| Under 35 Years | 15 | 4.8% |
| 35 to 44 Years | 17 | 5.5% |
| 45 to 54 Years | 59 | 19.0% |
| 55 to 64 Years | 72 | 23.2% |
| 65 to 74 Years | 101 | 32.6% |
| 75 to 84 Years | 34 | 11.0% |
| 85 Years and Over | 12 | 3.9% |
| Total | 310 | 100.0% |
Housing Finances in Leeds
Median Income by Occupancy in Leeds
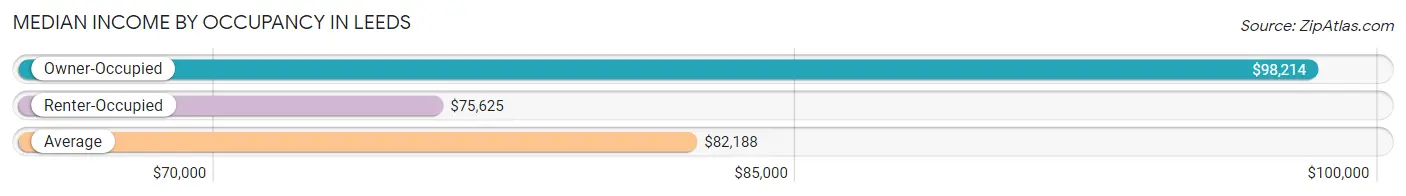
| Occupancy Type | # Households | Median Income |
| Owner-Occupied | 250 (80.6%) | $98,214 |
| Renter-Occupied | 60 (19.4%) | $75,625 |
| Average | 310 (100.0%) | $82,188 |
Occupancy by Householder Income Bracket in Leeds
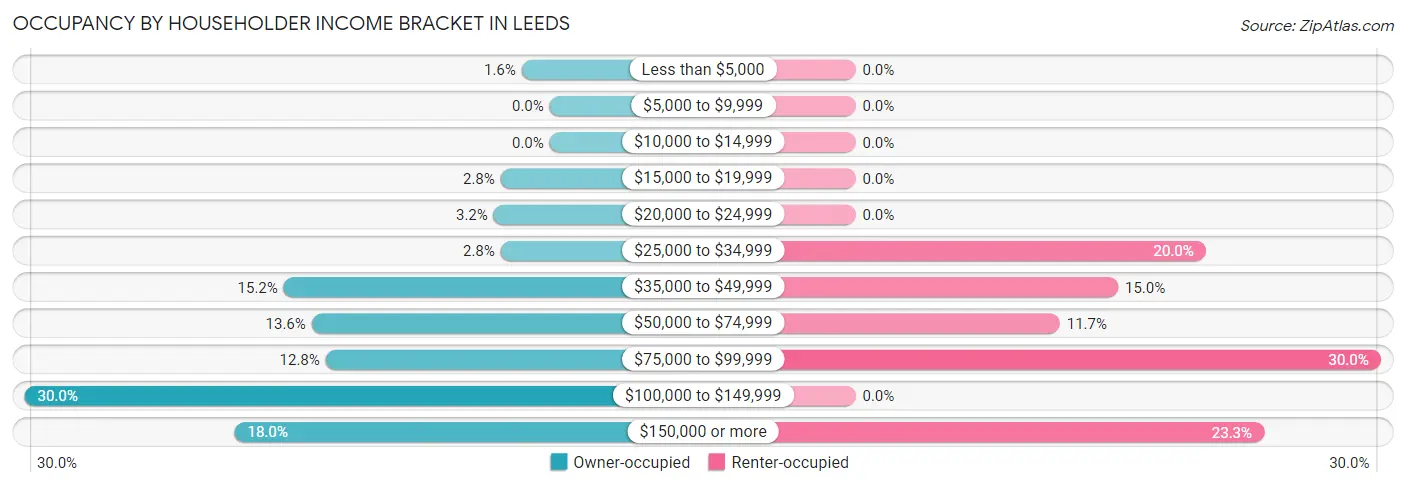
| Income Bracket | Owner-occupied | Renter-occupied |
| Less than $5,000 | 4 (1.6%) | 0 (0.0%) |
| $5,000 to $9,999 | 0 (0.0%) | 0 (0.0%) |
| $10,000 to $14,999 | 0 (0.0%) | 0 (0.0%) |
| $15,000 to $19,999 | 7 (2.8%) | 0 (0.0%) |
| $20,000 to $24,999 | 8 (3.2%) | 0 (0.0%) |
| $25,000 to $34,999 | 7 (2.8%) | 12 (20.0%) |
| $35,000 to $49,999 | 38 (15.2%) | 9 (15.0%) |
| $50,000 to $74,999 | 34 (13.6%) | 7 (11.7%) |
| $75,000 to $99,999 | 32 (12.8%) | 18 (30.0%) |
| $100,000 to $149,999 | 75 (30.0%) | 0 (0.0%) |
| $150,000 or more | 45 (18.0%) | 14 (23.3%) |
| Total | 250 (100.0%) | 60 (100.0%) |
Monthly Housing Cost Tiers in Leeds
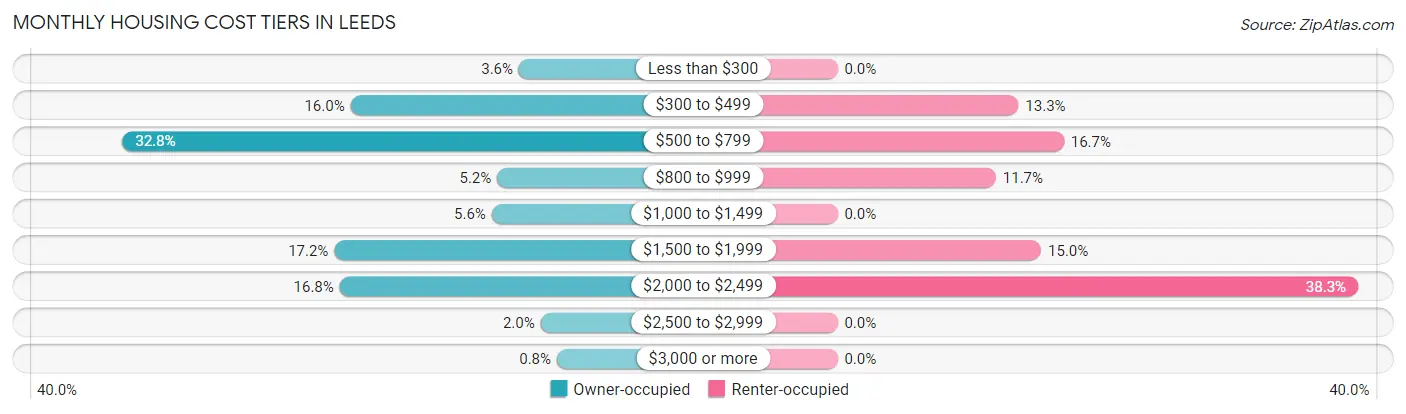
| Monthly Cost | Owner-occupied | Renter-occupied |
| Less than $300 | 9 (3.6%) | 0 (0.0%) |
| $300 to $499 | 40 (16.0%) | 8 (13.3%) |
| $500 to $799 | 82 (32.8%) | 10 (16.7%) |
| $800 to $999 | 13 (5.2%) | 7 (11.7%) |
| $1,000 to $1,499 | 14 (5.6%) | 0 (0.0%) |
| $1,500 to $1,999 | 43 (17.2%) | 9 (15.0%) |
| $2,000 to $2,499 | 42 (16.8%) | 23 (38.3%) |
| $2,500 to $2,999 | 5 (2.0%) | 0 (0.0%) |
| $3,000 or more | 2 (0.8%) | 0 (0.0%) |
| Total | 250 (100.0%) | 60 (100.0%) |
Physical Housing Characteristics in Leeds
Housing Structures in Leeds
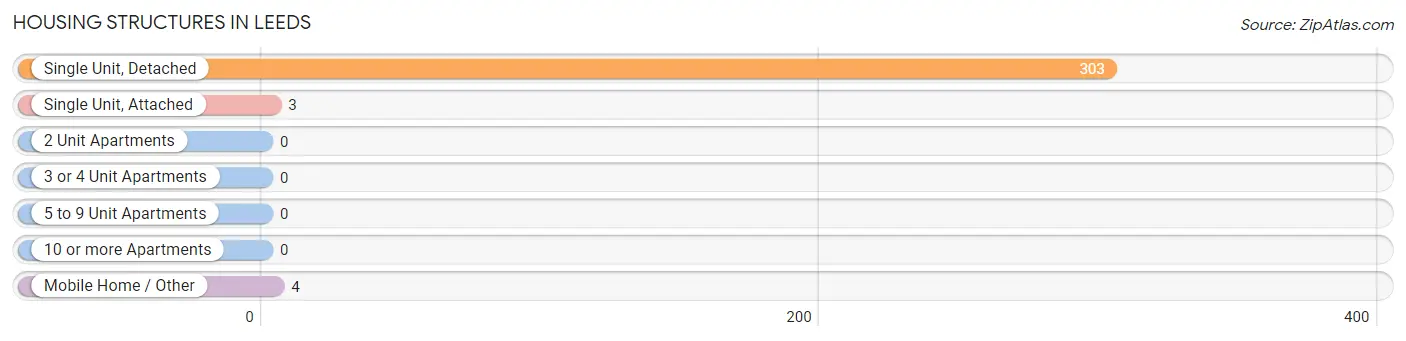
| Structure Type | # Housing Units | % Housing Units |
| Single Unit, Detached | 303 | 97.7% |
| Single Unit, Attached | 3 | 1.0% |
| 2 Unit Apartments | 0 | 0.0% |
| 3 or 4 Unit Apartments | 0 | 0.0% |
| 5 to 9 Unit Apartments | 0 | 0.0% |
| 10 or more Apartments | 0 | 0.0% |
| Mobile Home / Other | 4 | 1.3% |
| Total | 310 | 100.0% |
Housing Structures by Occupancy in Leeds
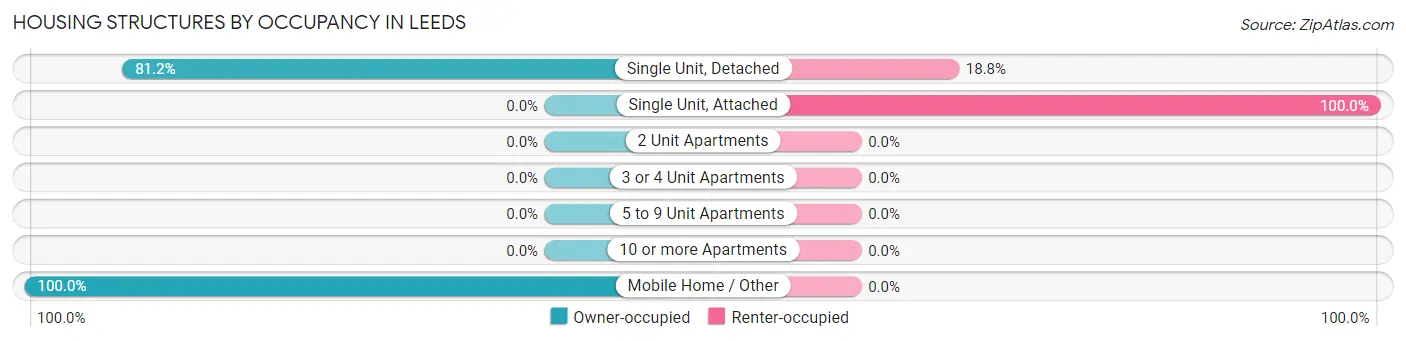
| Structure Type | Owner-occupied | Renter-occupied |
| Single Unit, Detached | 246 (81.2%) | 57 (18.8%) |
| Single Unit, Attached | 0 (0.0%) | 3 (100.0%) |
| 2 Unit Apartments | 0 (0.0%) | 0 (0.0%) |
| 3 or 4 Unit Apartments | 0 (0.0%) | 0 (0.0%) |
| 5 to 9 Unit Apartments | 0 (0.0%) | 0 (0.0%) |
| 10 or more Apartments | 0 (0.0%) | 0 (0.0%) |
| Mobile Home / Other | 4 (100.0%) | 0 (0.0%) |
| Total | 250 (80.6%) | 60 (19.4%) |
Housing Structures by Number of Rooms in Leeds
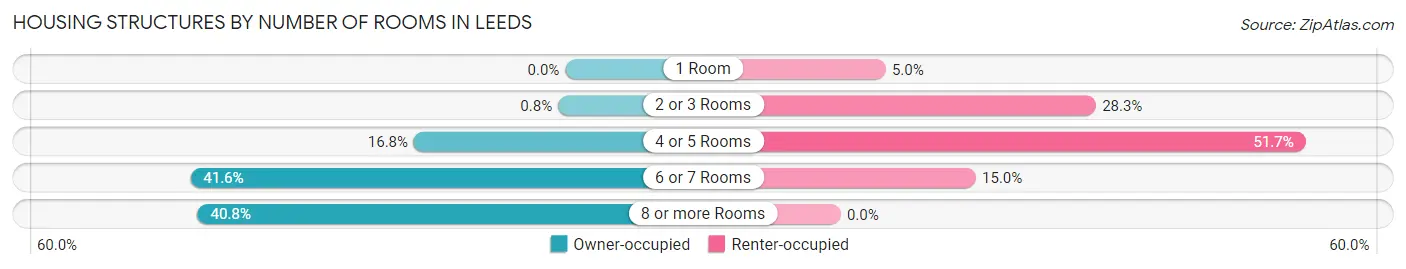
| Number of Rooms | Owner-occupied | Renter-occupied |
| 1 Room | 0 (0.0%) | 3 (5.0%) |
| 2 or 3 Rooms | 2 (0.8%) | 17 (28.3%) |
| 4 or 5 Rooms | 42 (16.8%) | 31 (51.7%) |
| 6 or 7 Rooms | 104 (41.6%) | 9 (15.0%) |
| 8 or more Rooms | 102 (40.8%) | 0 (0.0%) |
| Total | 250 (100.0%) | 60 (100.0%) |
Housing Structure by Heating Type in Leeds
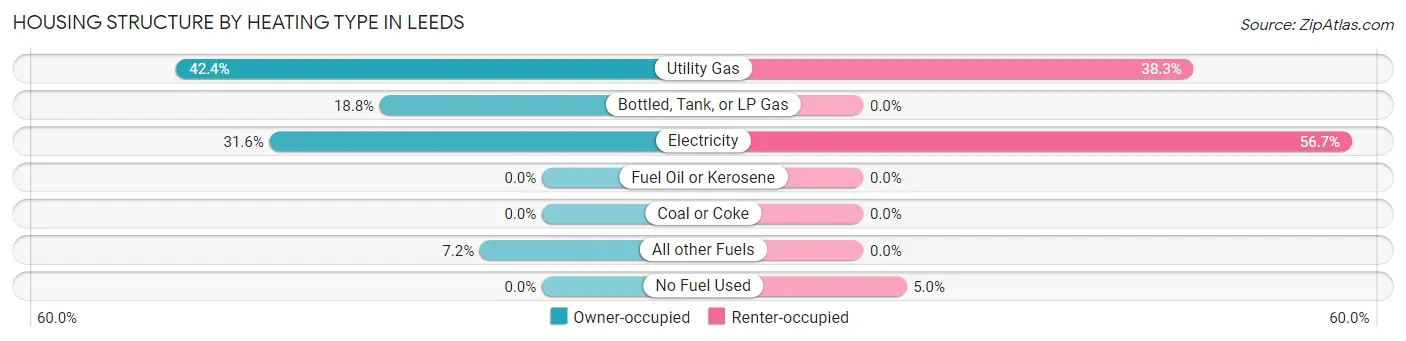
| Heating Type | Owner-occupied | Renter-occupied |
| Utility Gas | 106 (42.4%) | 23 (38.3%) |
| Bottled, Tank, or LP Gas | 47 (18.8%) | 0 (0.0%) |
| Electricity | 79 (31.6%) | 34 (56.7%) |
| Fuel Oil or Kerosene | 0 (0.0%) | 0 (0.0%) |
| Coal or Coke | 0 (0.0%) | 0 (0.0%) |
| All other Fuels | 18 (7.2%) | 0 (0.0%) |
| No Fuel Used | 0 (0.0%) | 3 (5.0%) |
| Total | 250 (100.0%) | 60 (100.0%) |
Household Vehicle Usage in Leeds
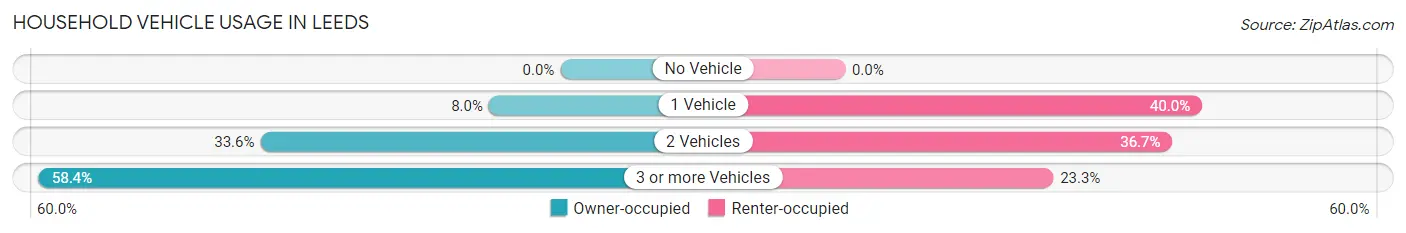
| Vehicles per Household | Owner-occupied | Renter-occupied |
| No Vehicle | 0 (0.0%) | 0 (0.0%) |
| 1 Vehicle | 20 (8.0%) | 24 (40.0%) |
| 2 Vehicles | 84 (33.6%) | 22 (36.7%) |
| 3 or more Vehicles | 146 (58.4%) | 14 (23.3%) |
| Total | 250 (100.0%) | 60 (100.0%) |
Real Estate & Mortgages in Leeds
Real Estate and Mortgage Overview in Leeds
| Characteristic | Without Mortgage | With Mortgage |
| Housing Units | 140 | 110 |
| Median Property Value | $370,600 | $493,800 |
| Median Household Income | $91,071 | $37 |
| Monthly Housing Costs | $613 | $2 |
| Real Estate Taxes | $1,658 | $0 |
Property Value by Mortgage Status in Leeds
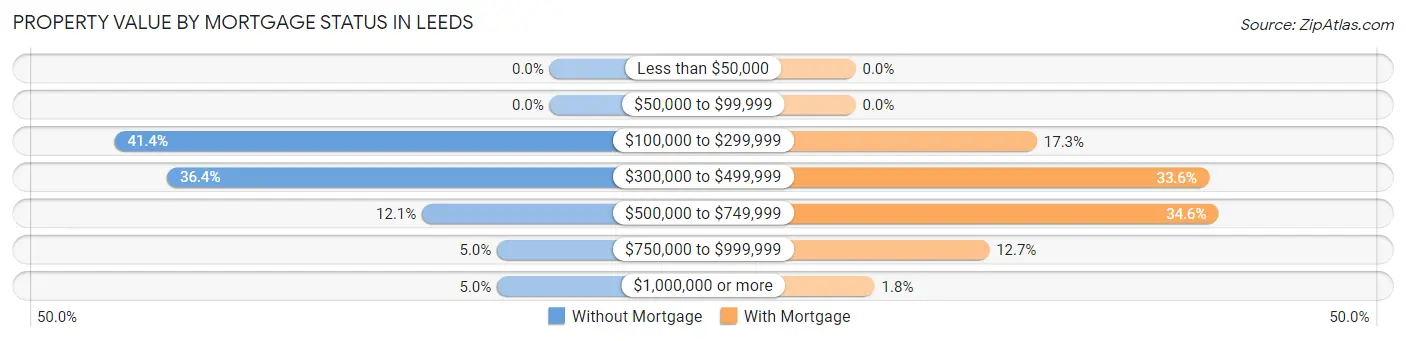
| Property Value | Without Mortgage | With Mortgage |
| Less than $50,000 | 0 (0.0%) | 0 (0.0%) |
| $50,000 to $99,999 | 0 (0.0%) | 0 (0.0%) |
| $100,000 to $299,999 | 58 (41.4%) | 19 (17.3%) |
| $300,000 to $499,999 | 51 (36.4%) | 37 (33.6%) |
| $500,000 to $749,999 | 17 (12.1%) | 38 (34.5%) |
| $750,000 to $999,999 | 7 (5.0%) | 14 (12.7%) |
| $1,000,000 or more | 7 (5.0%) | 2 (1.8%) |
| Total | 140 (100.0%) | 110 (100.0%) |
Household Income by Mortgage Status in Leeds
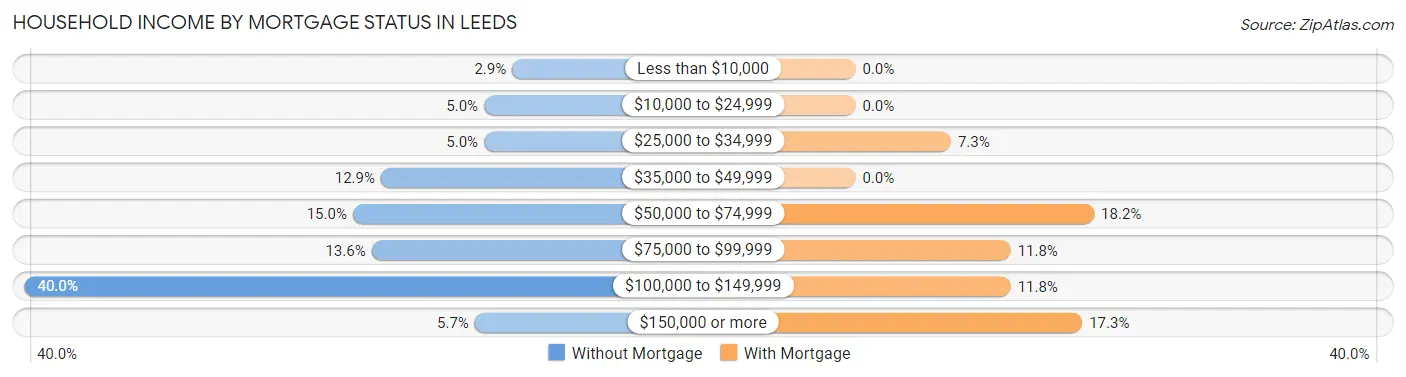
| Household Income | Without Mortgage | With Mortgage |
| Less than $10,000 | 4 (2.9%) | 0 (0.0%) |
| $10,000 to $24,999 | 7 (5.0%) | 0 (0.0%) |
| $25,000 to $34,999 | 7 (5.0%) | 8 (7.3%) |
| $35,000 to $49,999 | 18 (12.9%) | 0 (0.0%) |
| $50,000 to $74,999 | 21 (15.0%) | 20 (18.2%) |
| $75,000 to $99,999 | 19 (13.6%) | 13 (11.8%) |
| $100,000 to $149,999 | 56 (40.0%) | 13 (11.8%) |
| $150,000 or more | 8 (5.7%) | 19 (17.3%) |
| Total | 140 (100.0%) | 110 (100.0%) |
Property Value to Household Income Ratio in Leeds
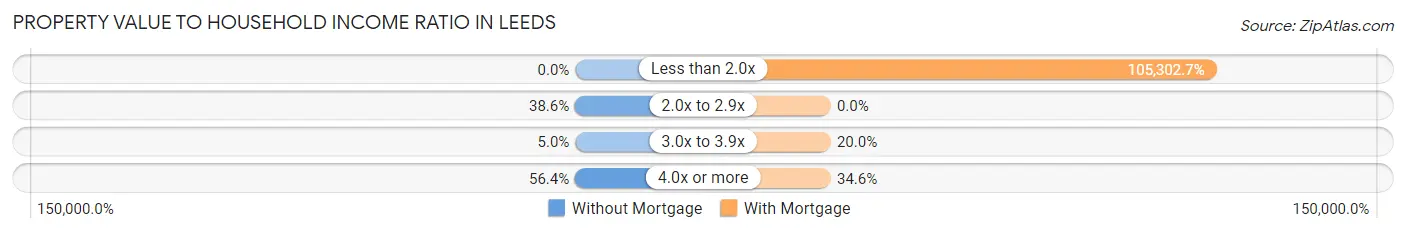
| Value-to-Income Ratio | Without Mortgage | With Mortgage |
| Less than 2.0x | 0 (0.0%) | 115,833 (105,302.7%) |
| 2.0x to 2.9x | 54 (38.6%) | 0 (0.0%) |
| 3.0x to 3.9x | 7 (5.0%) | 22 (20.0%) |
| 4.0x or more | 79 (56.4%) | 38 (34.5%) |
| Total | 140 (100.0%) | 110 (100.0%) |
Real Estate Taxes by Mortgage Status in Leeds
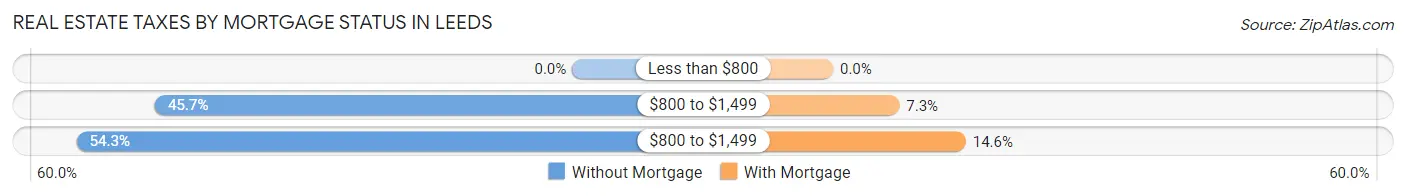
| Property Taxes | Without Mortgage | With Mortgage |
| Less than $800 | 0 (0.0%) | 0 (0.0%) |
| $800 to $1,499 | 64 (45.7%) | 8 (7.3%) |
| $800 to $1,499 | 76 (54.3%) | 16 (14.5%) |
| Total | 140 (100.0%) | 110 (100.0%) |
Health & Disability in Leeds
Health Insurance Coverage by Age in Leeds
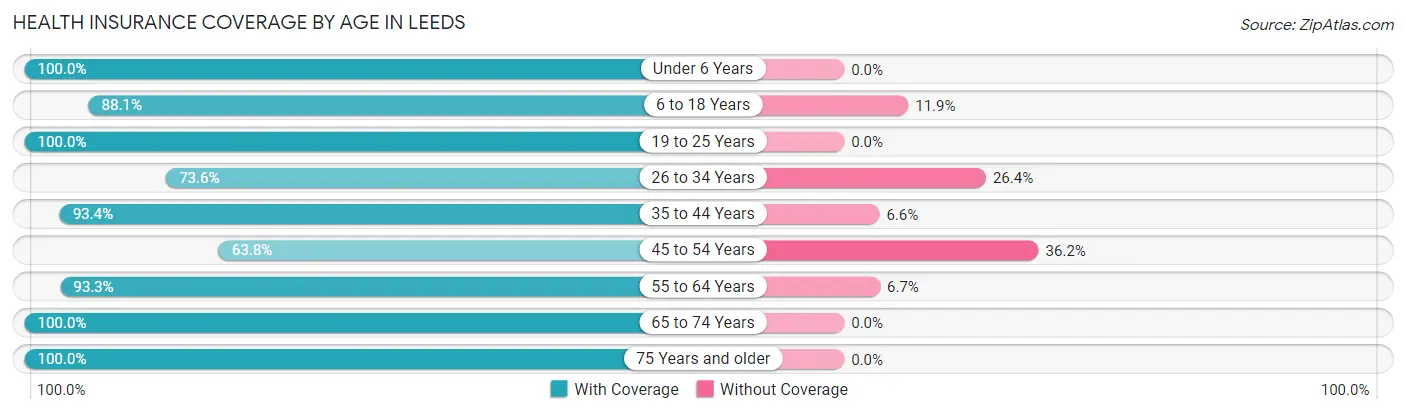
| Age Bracket | With Coverage | Without Coverage |
| Under 6 Years | 20 (100.0%) | 0 (0.0%) |
| 6 to 18 Years | 59 (88.1%) | 8 (11.9%) |
| 19 to 25 Years | 17 (100.0%) | 0 (0.0%) |
| 26 to 34 Years | 39 (73.6%) | 14 (26.4%) |
| 35 to 44 Years | 57 (93.4%) | 4 (6.6%) |
| 45 to 54 Years | 95 (63.8%) | 54 (36.2%) |
| 55 to 64 Years | 112 (93.3%) | 8 (6.7%) |
| 65 to 74 Years | 227 (100.0%) | 0 (0.0%) |
| 75 Years and older | 84 (100.0%) | 0 (0.0%) |
| Total | 710 (89.0%) | 88 (11.0%) |
Health Insurance Coverage by Citizenship Status in Leeds
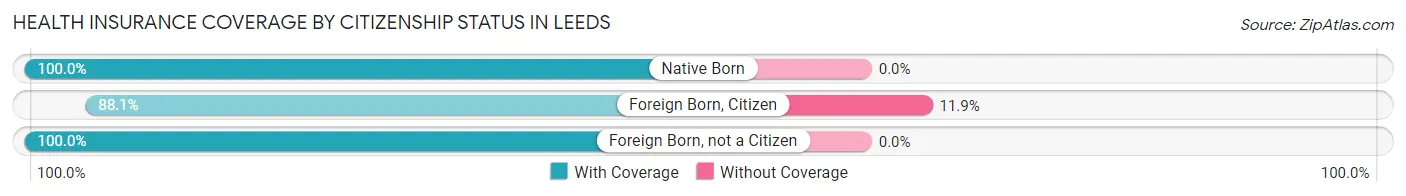
| Citizenship Status | With Coverage | Without Coverage |
| Native Born | 20 (100.0%) | 0 (0.0%) |
| Foreign Born, Citizen | 59 (88.1%) | 8 (11.9%) |
| Foreign Born, not a Citizen | 17 (100.0%) | 0 (0.0%) |
Health Insurance Coverage by Household Income in Leeds
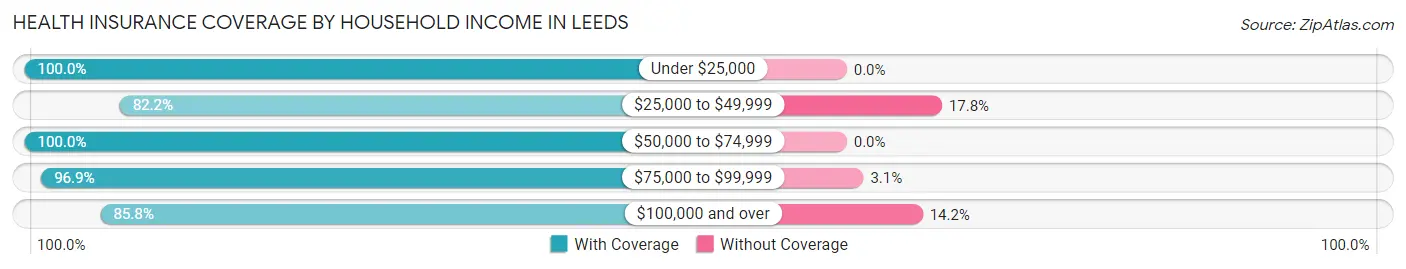
| Household Income | With Coverage | Without Coverage |
| Under $25,000 | 26 (100.0%) | 0 (0.0%) |
| $25,000 to $49,999 | 106 (82.2%) | 23 (17.8%) |
| $50,000 to $74,999 | 86 (100.0%) | 0 (0.0%) |
| $75,000 to $99,999 | 124 (96.9%) | 4 (3.1%) |
| $100,000 and over | 368 (85.8%) | 61 (14.2%) |
Public vs Private Health Insurance Coverage by Age in Leeds
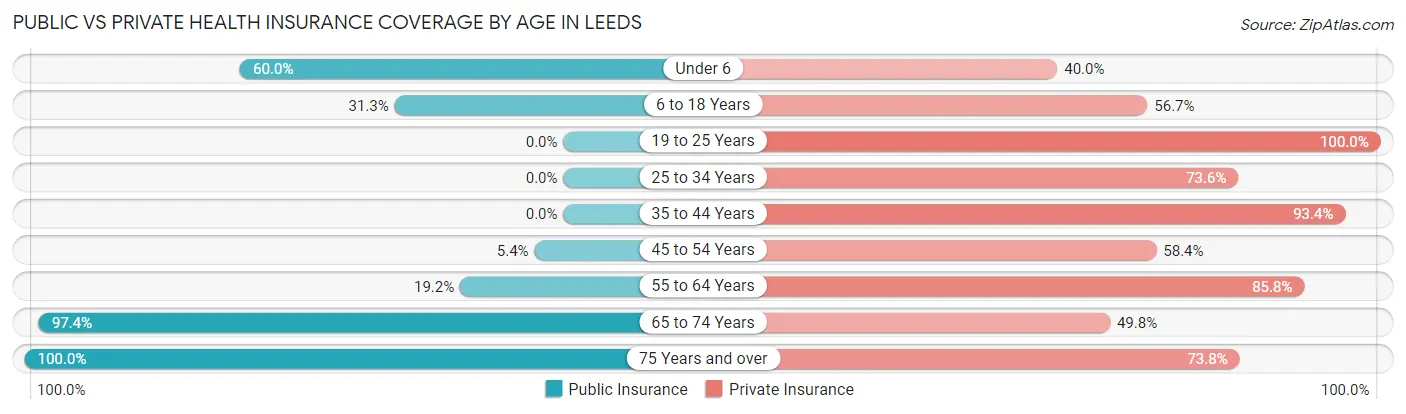
| Age Bracket | Public Insurance | Private Insurance |
| Under 6 | 12 (60.0%) | 8 (40.0%) |
| 6 to 18 Years | 21 (31.3%) | 38 (56.7%) |
| 19 to 25 Years | 0 (0.0%) | 17 (100.0%) |
| 25 to 34 Years | 0 (0.0%) | 39 (73.6%) |
| 35 to 44 Years | 0 (0.0%) | 57 (93.4%) |
| 45 to 54 Years | 8 (5.4%) | 87 (58.4%) |
| 55 to 64 Years | 23 (19.2%) | 103 (85.8%) |
| 65 to 74 Years | 221 (97.4%) | 113 (49.8%) |
| 75 Years and over | 84 (100.0%) | 62 (73.8%) |
| Total | 369 (46.2%) | 524 (65.7%) |
Disability Status by Sex by Age in Leeds
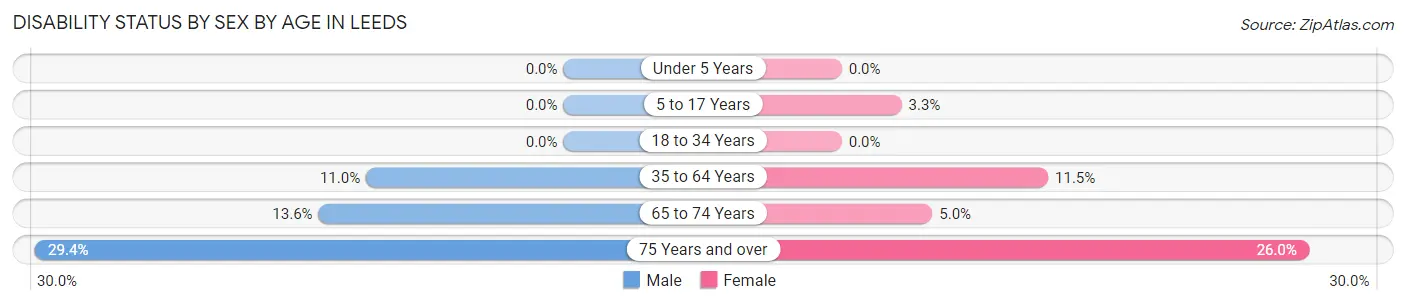
| Age Bracket | Male | Female |
| Under 5 Years | 0 (0.0%) | 0 (0.0%) |
| 5 to 17 Years | 0 (0.0%) | 1 (3.3%) |
| 18 to 34 Years | 0 (0.0%) | 0 (0.0%) |
| 35 to 64 Years | 20 (11.0%) | 17 (11.5%) |
| 65 to 74 Years | 12 (13.6%) | 7 (5.0%) |
| 75 Years and over | 10 (29.4%) | 13 (26.0%) |
Disability Class by Sex by Age in Leeds
Disability Class: Hearing Difficulty
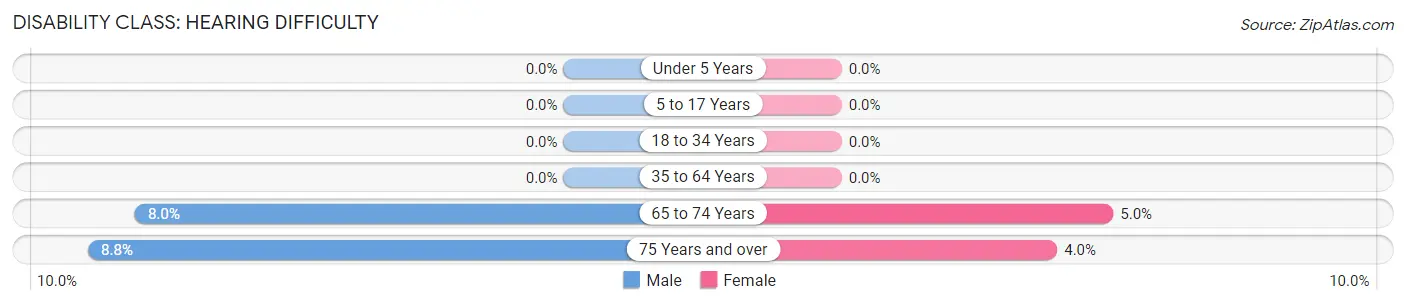
| Age Bracket | Male | Female |
| Under 5 Years | 0 (0.0%) | 0 (0.0%) |
| 5 to 17 Years | 0 (0.0%) | 0 (0.0%) |
| 18 to 34 Years | 0 (0.0%) | 0 (0.0%) |
| 35 to 64 Years | 0 (0.0%) | 0 (0.0%) |
| 65 to 74 Years | 7 (8.0%) | 7 (5.0%) |
| 75 Years and over | 3 (8.8%) | 2 (4.0%) |
Disability Class: Vision Difficulty
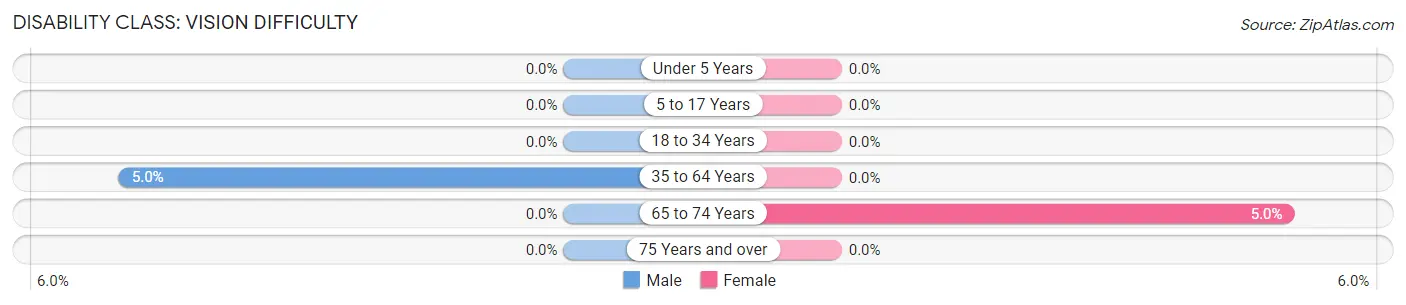
| Age Bracket | Male | Female |
| Under 5 Years | 0 (0.0%) | 0 (0.0%) |
| 5 to 17 Years | 0 (0.0%) | 0 (0.0%) |
| 18 to 34 Years | 0 (0.0%) | 0 (0.0%) |
| 35 to 64 Years | 9 (5.0%) | 0 (0.0%) |
| 65 to 74 Years | 0 (0.0%) | 7 (5.0%) |
| 75 Years and over | 0 (0.0%) | 0 (0.0%) |
Disability Class: Cognitive Difficulty
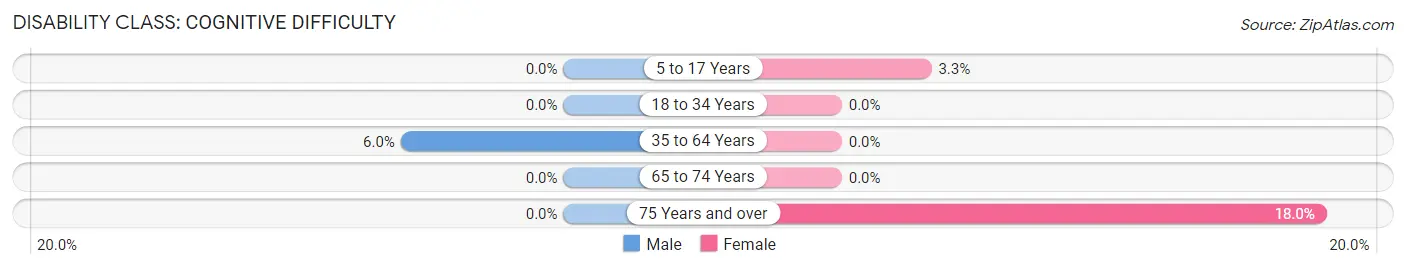
| Age Bracket | Male | Female |
| 5 to 17 Years | 0 (0.0%) | 1 (3.3%) |
| 18 to 34 Years | 0 (0.0%) | 0 (0.0%) |
| 35 to 64 Years | 11 (6.0%) | 0 (0.0%) |
| 65 to 74 Years | 0 (0.0%) | 0 (0.0%) |
| 75 Years and over | 0 (0.0%) | 9 (18.0%) |
Disability Class: Ambulatory Difficulty
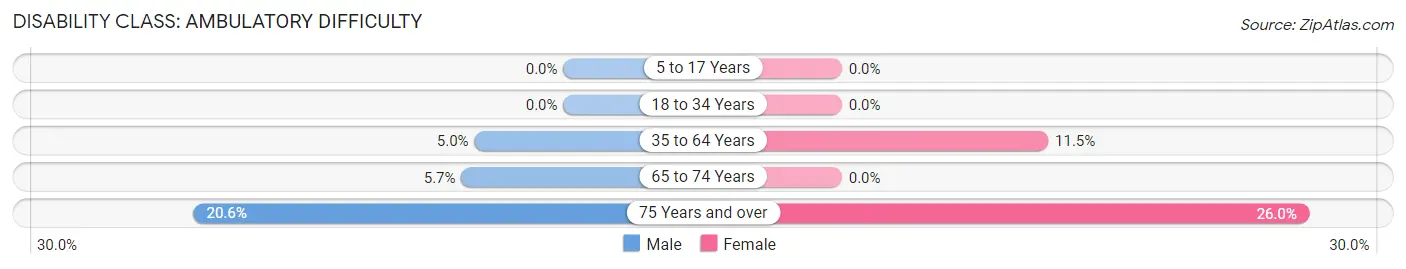
| Age Bracket | Male | Female |
| 5 to 17 Years | 0 (0.0%) | 0 (0.0%) |
| 18 to 34 Years | 0 (0.0%) | 0 (0.0%) |
| 35 to 64 Years | 9 (5.0%) | 17 (11.5%) |
| 65 to 74 Years | 5 (5.7%) | 0 (0.0%) |
| 75 Years and over | 7 (20.6%) | 13 (26.0%) |
Disability Class: Self-Care Difficulty
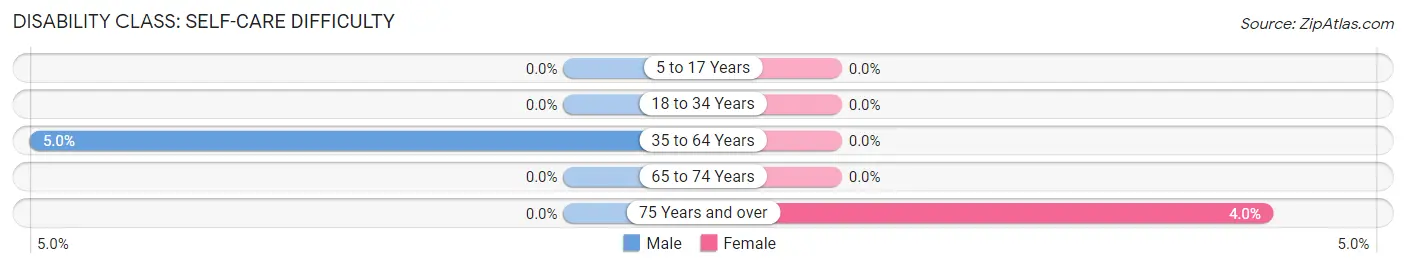
| Age Bracket | Male | Female |
| 5 to 17 Years | 0 (0.0%) | 0 (0.0%) |
| 18 to 34 Years | 0 (0.0%) | 0 (0.0%) |
| 35 to 64 Years | 9 (5.0%) | 0 (0.0%) |
| 65 to 74 Years | 0 (0.0%) | 0 (0.0%) |
| 75 Years and over | 0 (0.0%) | 2 (4.0%) |
Technology Access in Leeds
Computing Device Access in Leeds
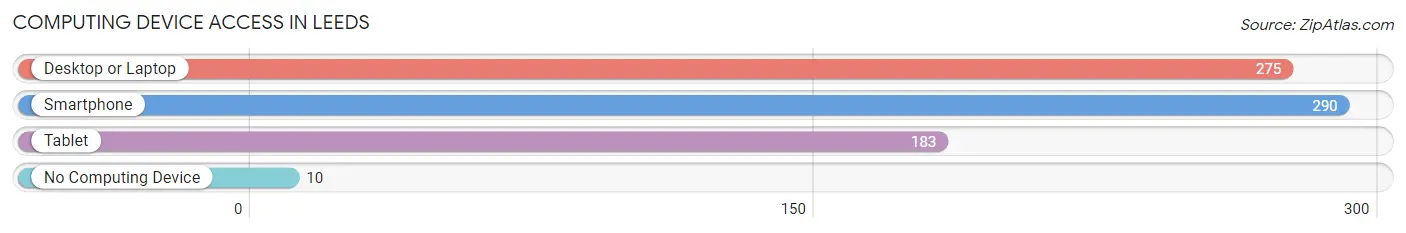
| Device Type | # Households | % Households |
| Desktop or Laptop | 275 | 88.7% |
| Smartphone | 290 | 93.5% |
| Tablet | 183 | 59.0% |
| No Computing Device | 10 | 3.2% |
| Total | 310 | 100.0% |
Internet Access in Leeds
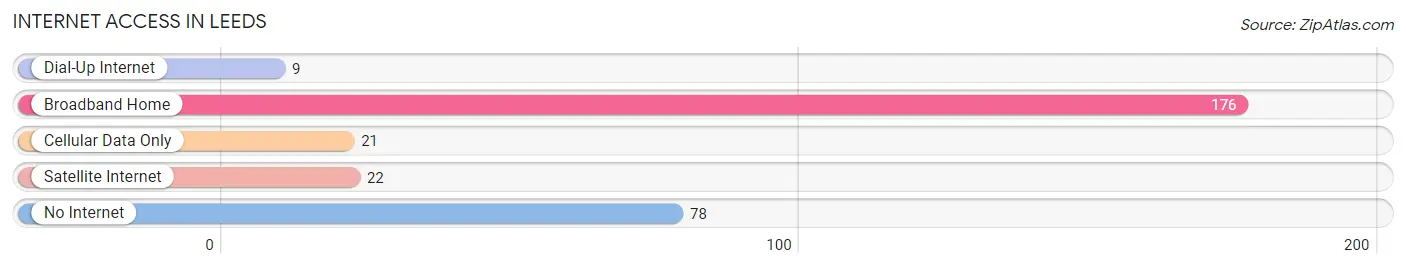
| Internet Type | # Households | % Households |
| Dial-Up Internet | 9 | 2.9% |
| Broadband Home | 176 | 56.8% |
| Cellular Data Only | 21 | 6.8% |
| Satellite Internet | 22 | 7.1% |
| No Internet | 78 | 25.2% |
| Total | 310 | 100.0% |
Leeds Summary
Leeds is a city located in the southwestern corner of Utah, United States. It is part of the St. George Metropolitan Statistical Area and is located in Washington County. The city is situated in a desert climate and is surrounded by the Red Cliffs National Conservation Area. Leeds is known for its rich history, diverse geography, vibrant economy, and diverse demographics.
History
Leeds was first settled in 1854 by Mormon pioneers from the Church of Jesus Christ of Latter-day Saints. The city was named after Leeds, England, and was originally part of the larger town of St. George. In 1877, Leeds was incorporated as a separate town. The city was a major hub for the mining industry in the late 19th and early 20th centuries, and was home to several large copper and lead mines. The city also served as a major stop on the Southern Pacific Railroad.
In the early 20th century, Leeds experienced a period of growth and prosperity. The city was home to several large businesses, including a flour mill, a brickyard, and a cannery. The city also had a thriving agricultural industry, with several large farms and ranches in the area.
Geography
Leeds is located in the southwestern corner of Utah, in Washington County. The city is situated in a desert climate, with hot summers and mild winters. The city is surrounded by the Red Cliffs National Conservation Area, which is home to a variety of wildlife, including bighorn sheep, mountain lions, and mule deer. The city is also located near several national parks, including Zion National Park, Bryce Canyon National Park, and Grand Staircase-Escalante National Monument.
Economy
Leeds has a vibrant economy, with a variety of industries and businesses. The city is home to several large companies, including a copper smelter, a lead smelter, and a cement plant. The city is also home to several large retail stores, including Walmart, Home Depot, and Lowe’s. The city is also home to several large agricultural operations, including cattle ranches and farms.
Demographics
As of the 2010 census, Leeds had a population of 2,845. The city has a diverse population, with a variety of ethnic and racial backgrounds. The city is predominantly white, with a large Hispanic population. The city also has a large Mormon population, with nearly 70% of the population identifying as members of the Church of Jesus Christ of Latter-day Saints. The city also has a large Native American population, with nearly 10% of the population identifying as Native American.
Common Questions
What is Per Capita Income in Leeds?
Per Capita income in Leeds is $38,439.
What is the Median Family Income in Leeds?
Median Family Income in Leeds is $108,750.
What is the Median Household income in Leeds?
Median Household Income in Leeds is $82,188.
What is Income or Wage Gap in Leeds?
Income or Wage Gap in Leeds is 14.1%.
Women in Leeds earn 85.9 cents for every dollar earned by a man.
What is Inequality or Gini Index in Leeds?
Inequality or Gini Index in Leeds is 0.33.
What is the Total Population of Leeds?
Total Population of Leeds is 798.
What is the Total Male Population of Leeds?
Total Male Population of Leeds is 406.
What is the Total Female Population of Leeds?
Total Female Population of Leeds is 392.
What is the Ratio of Males per 100 Females in Leeds?
There are 103.57 Males per 100 Females in Leeds.
What is the Ratio of Females per 100 Males in Leeds?
There are 96.55 Females per 100 Males in Leeds.
What is the Median Population Age in Leeds?
Median Population Age in Leeds is 58.4 Years.
What is the Average Family Size in Leeds
Average Family Size in Leeds is 2.7 People.
What is the Average Household Size in Leeds
Average Household Size in Leeds is 2.6 People.
How Large is the Labor Force in Leeds?
There are 315 People in the Labor Forcein in Leeds.
What is the Percentage of People in the Labor Force in Leeds?
43.0% of People are in the Labor Force in Leeds.