Sunset, UT Map & Demographics
Sunset Map
Sunset Overview
$25,274
PER CAPITA INCOME
$66,042
AVG FAMILY INCOME
$64,604
AVG HOUSEHOLD INCOME
40.5%
WAGE / INCOME GAP [ % ]
59.5¢/ $1
WAGE / INCOME GAP [ $ ]
0.32
INEQUALITY / GINI INDEX
5,443
TOTAL POPULATION
2,488
MALE POPULATION
2,955
FEMALE POPULATION
84.20
MALES / 100 FEMALES
118.77
FEMALES / 100 MALES
30.1
MEDIAN AGE
3.7
AVG FAMILY SIZE
3.2
AVG HOUSEHOLD SIZE
3,054
LABOR FORCE [ PEOPLE ]
74.2%
PERCENT IN LABOR FORCE
3.1%
UNEMPLOYMENT RATE
Income in Sunset
Income Overview in Sunset
Per Capita Income in Sunset is $25,274, while median incomes of families and households are $66,042 and $64,604 respectively.
| Characteristic | Number | Measure |
| Per Capita Income | 5,443 | $25,274 |
| Median Family Income | 1,162 | $66,042 |
| Mean Family Income | 1,162 | $77,024 |
| Median Household Income | 1,667 | $64,604 |
| Mean Household Income | 1,667 | $74,923 |
| Income Deficit | 1,162 | $0 |
| Wage / Income Gap (%) | 5,443 | 40.50% |
| Wage / Income Gap ($) | 5,443 | 59.50¢ per $1 |
| Gini / Inequality Index | 5,443 | 0.32 |
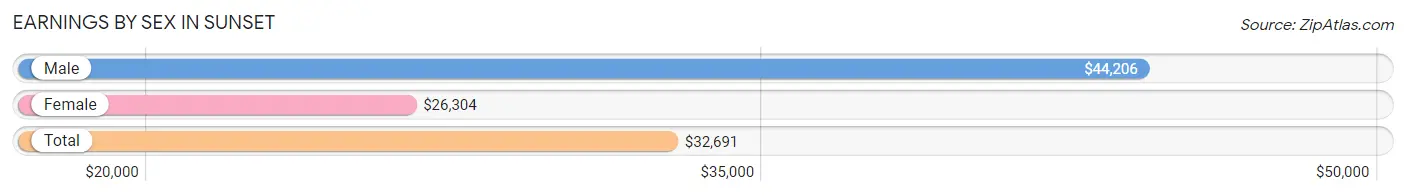
Earnings by Sex in Sunset
Average Earnings in Sunset are $32,691, $44,206 for men and $26,304 for women, a difference of 40.5%.
| Sex | Number | Average Earnings |
| Male | 1,627 (52.5%) | $44,206 |
| Female | 1,474 (47.5%) | $26,304 |
| Total | 3,101 (100.0%) | $32,691 |
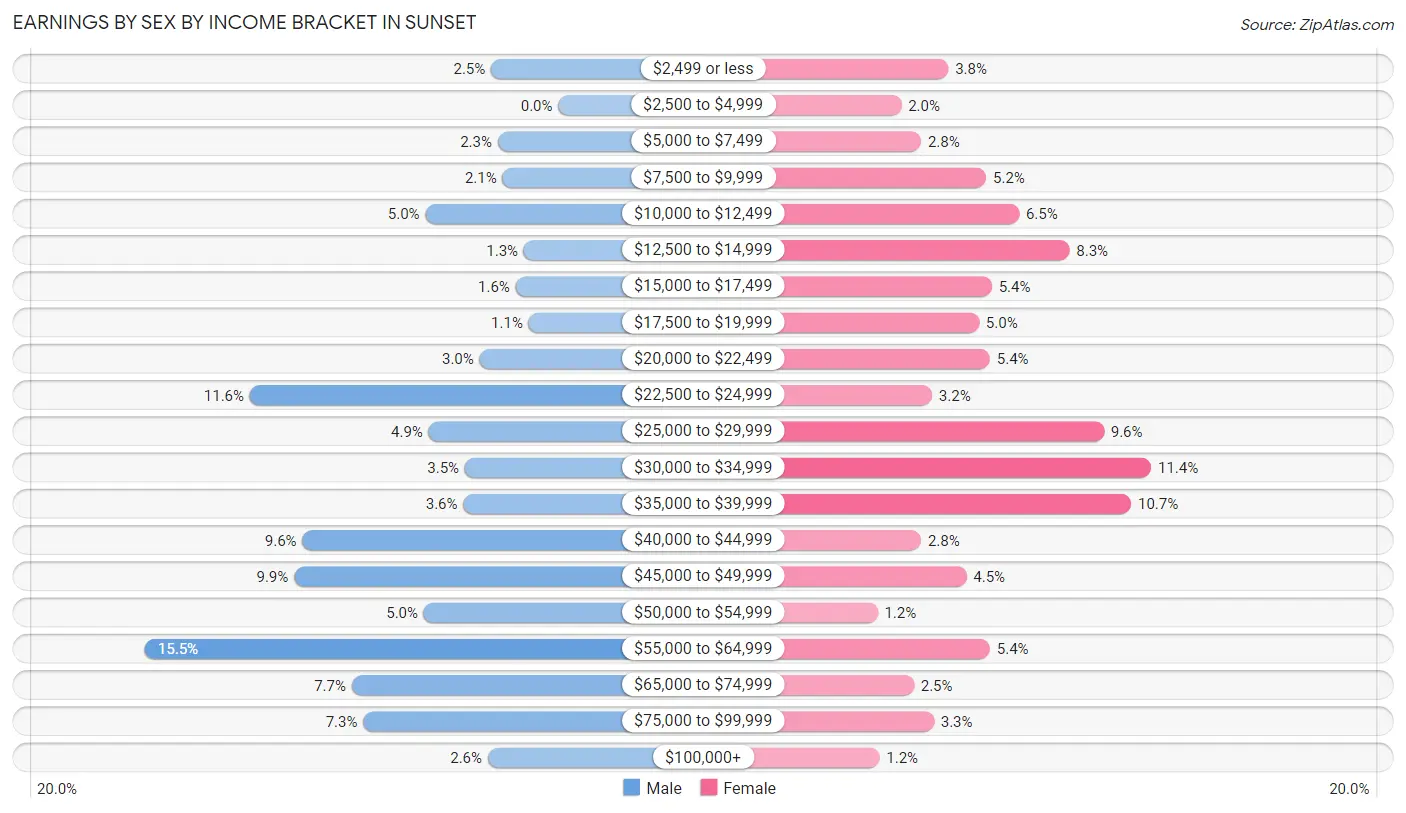
Earnings by Sex by Income Bracket in Sunset
The most common earnings brackets in Sunset are $55,000 to $64,999 for men (252 | 15.5%) and $30,000 to $34,999 for women (168 | 11.4%).
| Income | Male | Female |
| $2,499 or less | 41 (2.5%) | 56 (3.8%) |
| $2,500 to $4,999 | 0 (0.0%) | 30 (2.0%) |
| $5,000 to $7,499 | 37 (2.3%) | 41 (2.8%) |
| $7,500 to $9,999 | 34 (2.1%) | 77 (5.2%) |
| $10,000 to $12,499 | 81 (5.0%) | 95 (6.5%) |
| $12,500 to $14,999 | 21 (1.3%) | 123 (8.3%) |
| $15,000 to $17,499 | 26 (1.6%) | 80 (5.4%) |
| $17,500 to $19,999 | 18 (1.1%) | 73 (5.0%) |
| $20,000 to $22,499 | 48 (2.9%) | 79 (5.4%) |
| $22,500 to $24,999 | 188 (11.6%) | 47 (3.2%) |
| $25,000 to $29,999 | 79 (4.9%) | 142 (9.6%) |
| $30,000 to $34,999 | 57 (3.5%) | 168 (11.4%) |
| $35,000 to $39,999 | 58 (3.6%) | 157 (10.6%) |
| $40,000 to $44,999 | 156 (9.6%) | 41 (2.8%) |
| $45,000 to $49,999 | 161 (9.9%) | 66 (4.5%) |
| $50,000 to $54,999 | 82 (5.0%) | 17 (1.1%) |
| $55,000 to $64,999 | 252 (15.5%) | 79 (5.4%) |
| $65,000 to $74,999 | 126 (7.7%) | 37 (2.5%) |
| $75,000 to $99,999 | 119 (7.3%) | 48 (3.3%) |
| $100,000+ | 43 (2.6%) | 18 (1.2%) |
| Total | 1,627 (100.0%) | 1,474 (100.0%) |
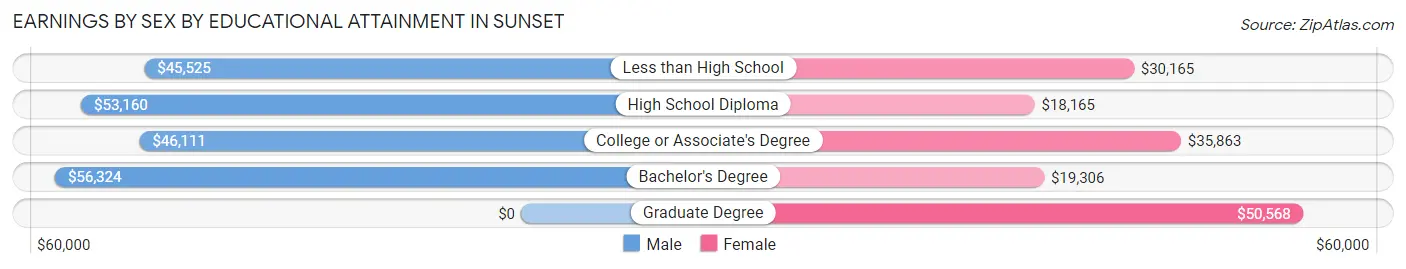
Earnings by Sex by Educational Attainment in Sunset
Average earnings in Sunset are $48,107 for men and $26,824 for women, a difference of 44.2%. Men with an educational attainment of bachelor's degree enjoy the highest average annual earnings of $56,324, while those with less than high school education earn the least with $45,525. Women with an educational attainment of graduate degree earn the most with the average annual earnings of $50,568, while those with high school diploma education have the smallest earnings of $18,165.
| Educational Attainment | Male Income | Female Income |
| Less than High School | $45,525 | $30,165 |
| High School Diploma | $53,160 | $18,165 |
| College or Associate's Degree | $46,111 | $35,863 |
| Bachelor's Degree | $56,324 | $19,306 |
| Graduate Degree | - | - |
| Total | $48,107 | $26,824 |
Family Income in Sunset
Family Income Brackets in Sunset
According to the Sunset family income data, there are 399 families falling into the $50,000 to $74,999 income range, which is the most common income bracket and makes up 34.3% of all families. Conversely, the less than $10,000 income bracket is the least frequent group with only 7 families (0.6%) belonging to this category.
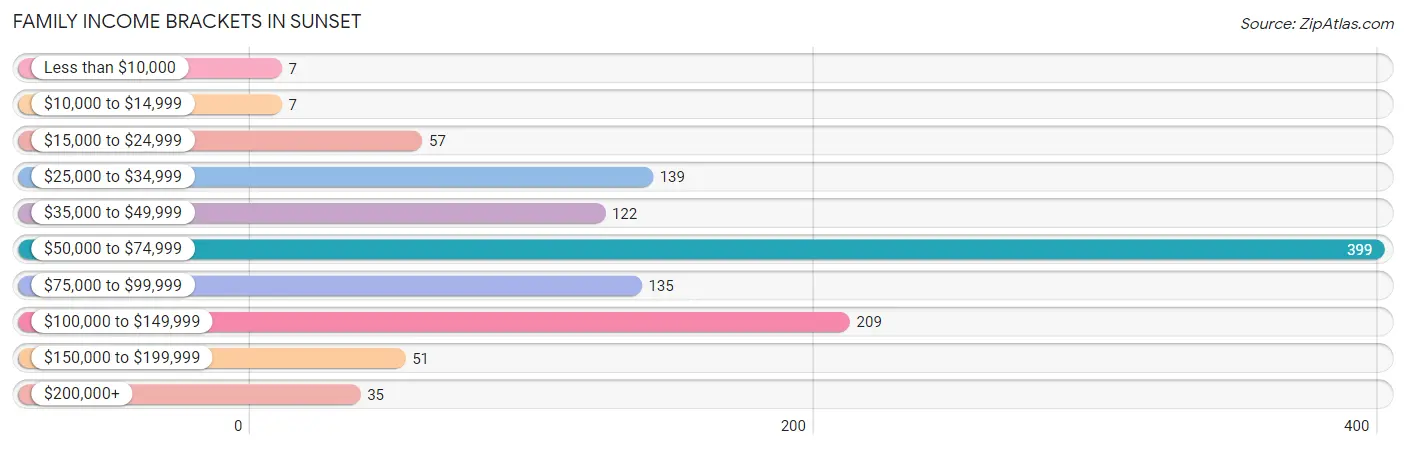
| Income Bracket | # Families | % Families |
| Less than $10,000 | 7 | 0.6% |
| $10,000 to $14,999 | 7 | 0.6% |
| $15,000 to $24,999 | 57 | 4.9% |
| $25,000 to $34,999 | 139 | 12.0% |
| $35,000 to $49,999 | 122 | 10.5% |
| $50,000 to $74,999 | 399 | 34.3% |
| $75,000 to $99,999 | 135 | 11.6% |
| $100,000 to $149,999 | 209 | 18.0% |
| $150,000 to $199,999 | 51 | 4.4% |
| $200,000+ | 35 | 3.0% |
Family Income by Famaliy Size in Sunset
7+ person families (49 | 4.2%) account for the highest median family income in Sunset with $163,203 per family, while 2-person families (388 | 33.4%) have the highest median income of $28,334 per family member.
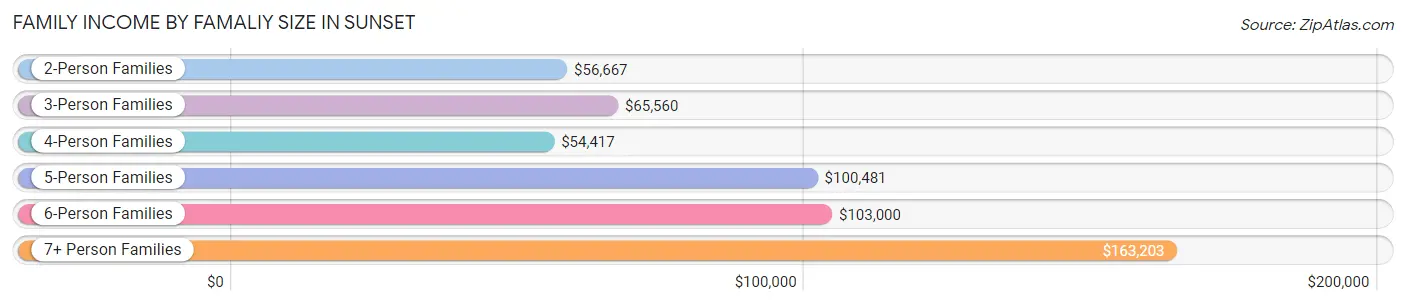
| Income Bracket | # Families | Median Income |
| 2-Person Families | 388 (33.4%) | $56,667 |
| 3-Person Families | 391 (33.7%) | $65,560 |
| 4-Person Families | 133 (11.5%) | $54,417 |
| 5-Person Families | 121 (10.4%) | $100,481 |
| 6-Person Families | 80 (6.9%) | $103,000 |
| 7+ Person Families | 49 (4.2%) | $163,203 |
| Total | 1,162 (100.0%) | $66,042 |
Family Income by Number of Earners in Sunset
The median family income in Sunset is $66,042, with families comprising 3+ earners (164) having the highest median family income of $118,750, while families with no earners (65) have the lowest median family income of $41,146, accounting for 14.1% and 5.6% of families, respectively.
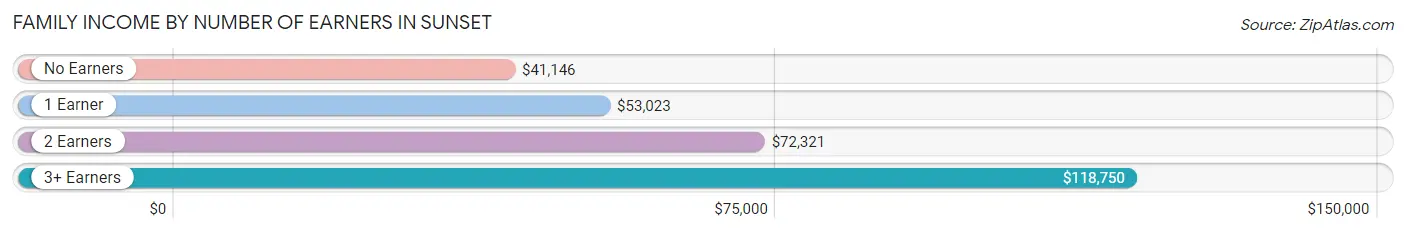
| Number of Earners | # Families | Median Income |
| No Earners | 65 (5.6%) | $41,146 |
| 1 Earner | 442 (38.0%) | $53,023 |
| 2 Earners | 491 (42.2%) | $72,321 |
| 3+ Earners | 164 (14.1%) | $118,750 |
| Total | 1,162 (100.0%) | $66,042 |
Household Income in Sunset
Household Income Brackets in Sunset
With 510 households falling in the category, the $50,000 to $74,999 income range is the most frequent in Sunset, accounting for 30.6% of all households. In contrast, only 22 households (1.3%) fall into the $10,000 to $14,999 income bracket, making it the least populous group.
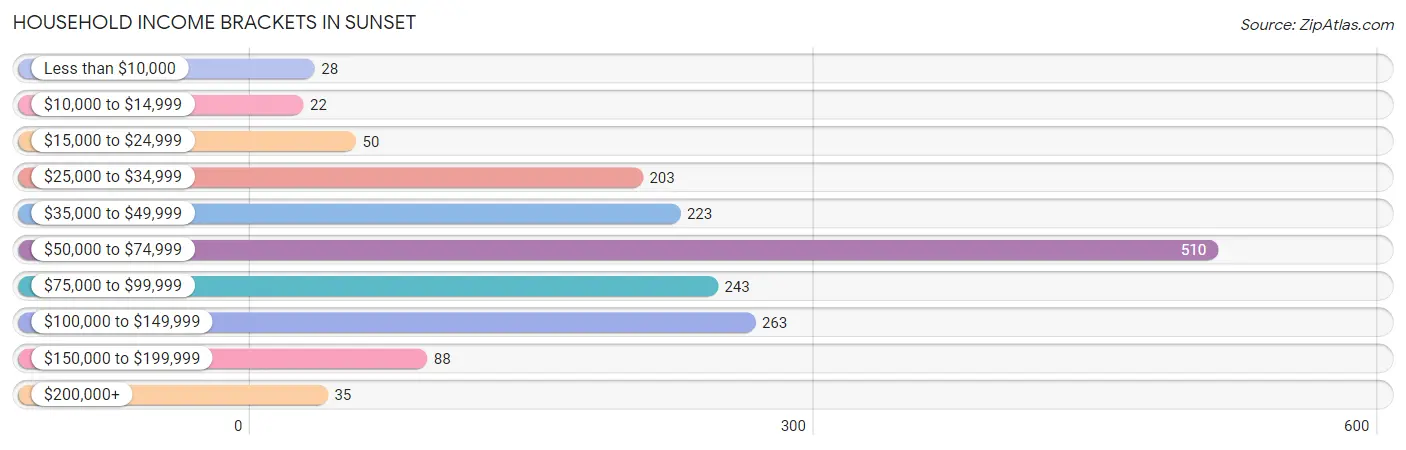
| Income Bracket | # Households | % Households |
| Less than $10,000 | 28 | 1.7% |
| $10,000 to $14,999 | 22 | 1.3% |
| $15,000 to $24,999 | 50 | 3.0% |
| $25,000 to $34,999 | 203 | 12.2% |
| $35,000 to $49,999 | 223 | 13.4% |
| $50,000 to $74,999 | 510 | 30.6% |
| $75,000 to $99,999 | 243 | 14.6% |
| $100,000 to $149,999 | 263 | 15.8% |
| $150,000 to $199,999 | 88 | 5.3% |
| $200,000+ | 35 | 2.1% |
Household Income by Householder Age in Sunset
The median household income in Sunset is $64,604, with the highest median household income of $68,911 found in the 45 to 64 years age bracket for the primary householder. A total of 541 households (32.5%) fall into this category. Meanwhile, the 15 to 24 years age bracket for the primary householder has the lowest median household income of $54,917, with 127 households (7.6%) in this group.
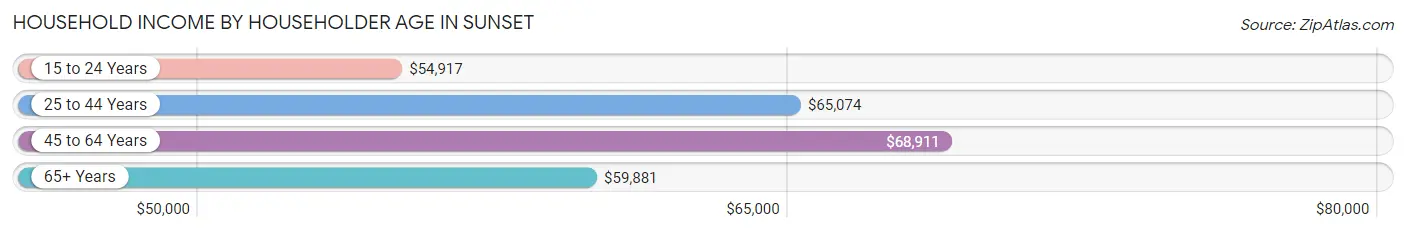
| Income Bracket | # Households | Median Income |
| 15 to 24 Years | 127 (7.6%) | $54,917 |
| 25 to 44 Years | 665 (39.9%) | $65,074 |
| 45 to 64 Years | 541 (32.5%) | $68,911 |
| 65+ Years | 334 (20.0%) | $59,881 |
| Total | 1,667 (100.0%) | $64,604 |
Poverty in Sunset
Income Below Poverty by Sex and Age in Sunset
With 4.8% poverty level for males and 17.4% for females among the residents of Sunset, 15 year old males and 5 year old females are the most vulnerable to poverty, with 11 males (32.4%) and 37 females (64.9%) in their respective age groups living below the poverty level.
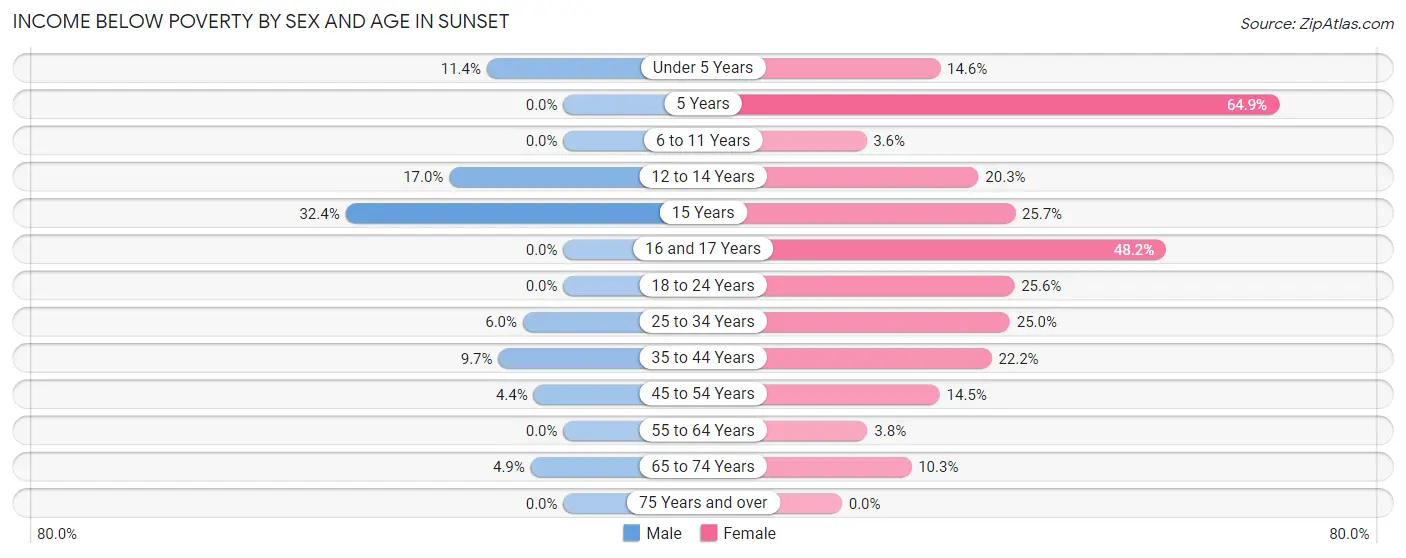
| Age Bracket | Male | Female |
| Under 5 Years | 24 (11.4%) | 34 (14.6%) |
| 5 Years | 0 (0.0%) | 37 (64.9%) |
| 6 to 11 Years | 0 (0.0%) | 12 (3.6%) |
| 12 to 14 Years | 10 (17.0%) | 28 (20.3%) |
| 15 Years | 11 (32.4%) | 9 (25.7%) |
| 16 and 17 Years | 0 (0.0%) | 26 (48.1%) |
| 18 to 24 Years | 0 (0.0%) | 86 (25.6%) |
| 25 to 34 Years | 34 (6.0%) | 137 (24.9%) |
| 35 to 44 Years | 22 (9.7%) | 62 (22.2%) |
| 45 to 54 Years | 11 (4.4%) | 51 (14.5%) |
| 55 to 64 Years | 0 (0.0%) | 9 (3.8%) |
| 65 to 74 Years | 7 (4.9%) | 20 (10.3%) |
| 75 Years and over | 0 (0.0%) | 0 (0.0%) |
| Total | 119 (4.8%) | 511 (17.4%) |
Income Above Poverty by Sex and Age in Sunset
According to the poverty statistics in Sunset, males aged 6 to 11 years and females aged 75 years and over are the age groups that are most secure financially, with 100.0% of males and 100.0% of females in these age groups living above the poverty line.
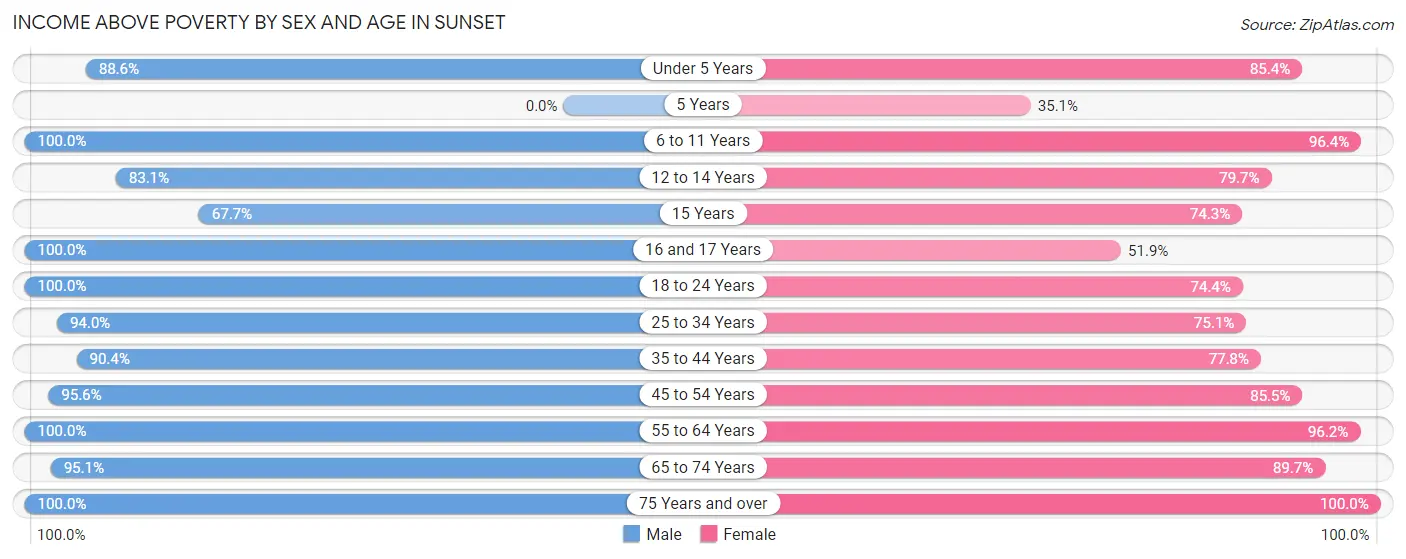
| Age Bracket | Male | Female |
| Under 5 Years | 187 (88.6%) | 199 (85.4%) |
| 5 Years | 0 (0.0%) | 20 (35.1%) |
| 6 to 11 Years | 229 (100.0%) | 319 (96.4%) |
| 12 to 14 Years | 49 (83.1%) | 110 (79.7%) |
| 15 Years | 23 (67.6%) | 26 (74.3%) |
| 16 and 17 Years | 45 (100.0%) | 28 (51.8%) |
| 18 to 24 Years | 429 (100.0%) | 250 (74.4%) |
| 25 to 34 Years | 532 (94.0%) | 412 (75.0%) |
| 35 to 44 Years | 206 (90.3%) | 217 (77.8%) |
| 45 to 54 Years | 238 (95.6%) | 300 (85.5%) |
| 55 to 64 Years | 210 (100.0%) | 228 (96.2%) |
| 65 to 74 Years | 137 (95.1%) | 174 (89.7%) |
| 75 Years and over | 73 (100.0%) | 139 (100.0%) |
| Total | 2,358 (95.2%) | 2,422 (82.6%) |
Income Below Poverty Among Married-Couple Families in Sunset
The poverty statistics for married-couple families in Sunset show that 2.8% or 21 of the total 746 families live below the poverty line. Families with 3 or 4 children have the highest poverty rate of 8.4%, comprising of 14 families. On the other hand, families with 1 or 2 children have the lowest poverty rate of 0.0%, which includes 0 families.
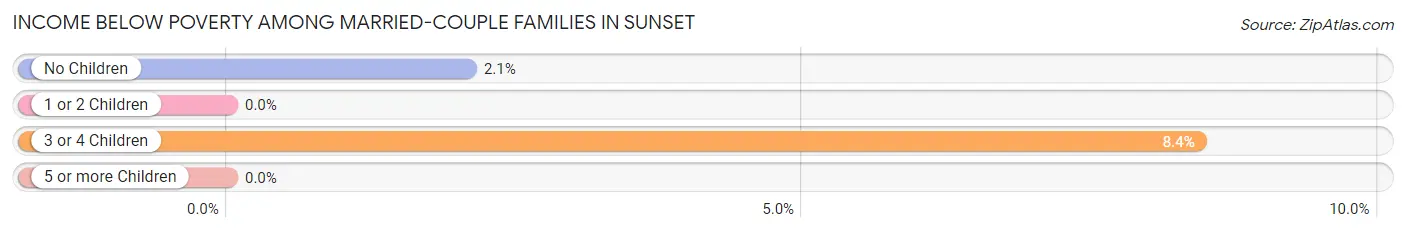
| Children | Above Poverty | Below Poverty |
| No Children | 330 (97.9%) | 7 (2.1%) |
| 1 or 2 Children | 229 (100.0%) | 0 (0.0%) |
| 3 or 4 Children | 152 (91.6%) | 14 (8.4%) |
| 5 or more Children | 14 (100.0%) | 0 (0.0%) |
| Total | 725 (97.2%) | 21 (2.8%) |
Income Below Poverty Among Single-Parent Households in Sunset
According to the poverty data in Sunset, 16.4% or 21 single-father households and 21.9% or 63 single-mother households are living below the poverty line. Among single-father households, those with 3 or 4 children have the highest poverty rate, with 21 households (70.0%) experiencing poverty. Likewise, among single-mother households, those with 1 or 2 children have the highest poverty rate, with 56 households (28.4%) falling below the poverty line.
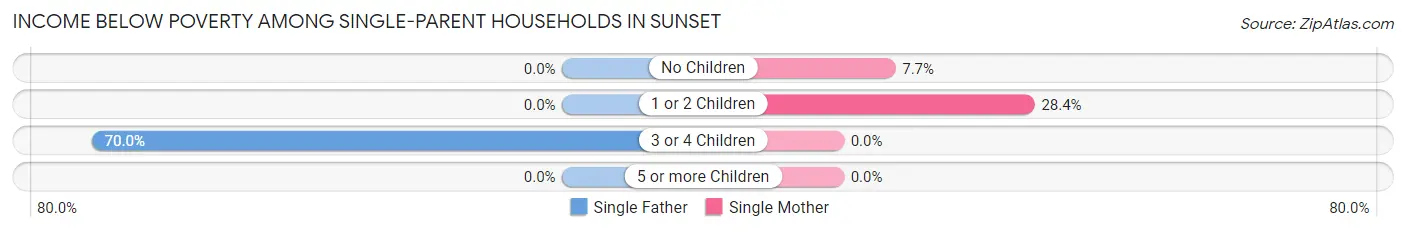
| Children | Single Father | Single Mother |
| No Children | 0 (0.0%) | 7 (7.7%) |
| 1 or 2 Children | 0 (0.0%) | 56 (28.4%) |
| 3 or 4 Children | 21 (70.0%) | 0 (0.0%) |
| 5 or more Children | 0 (0.0%) | 0 (0.0%) |
| Total | 21 (16.4%) | 63 (21.9%) |
Income Below Poverty Among Married-Couple vs Single-Parent Households in Sunset
The poverty data for Sunset shows that 21 of the married-couple family households (2.8%) and 84 of the single-parent households (20.2%) are living below the poverty level. Within the married-couple family households, those with 3 or 4 children have the highest poverty rate, with 14 households (8.4%) falling below the poverty line. Among the single-parent households, those with 3 or 4 children have the highest poverty rate, with 21 household (70.0%) living below poverty.
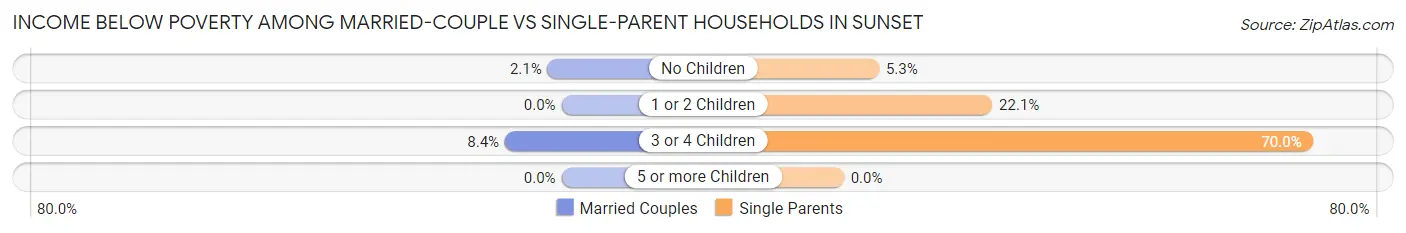
| Children | Married-Couple Families | Single-Parent Households |
| No Children | 7 (2.1%) | 7 (5.3%) |
| 1 or 2 Children | 0 (0.0%) | 56 (22.1%) |
| 3 or 4 Children | 14 (8.4%) | 21 (70.0%) |
| 5 or more Children | 0 (0.0%) | 0 (0.0%) |
| Total | 21 (2.8%) | 84 (20.2%) |
Race in Sunset
The most populous races in Sunset are White / Caucasian (4,840 | 88.9%), Hispanic or Latino (940 | 17.3%), and Two or more Races (478 | 8.8%).
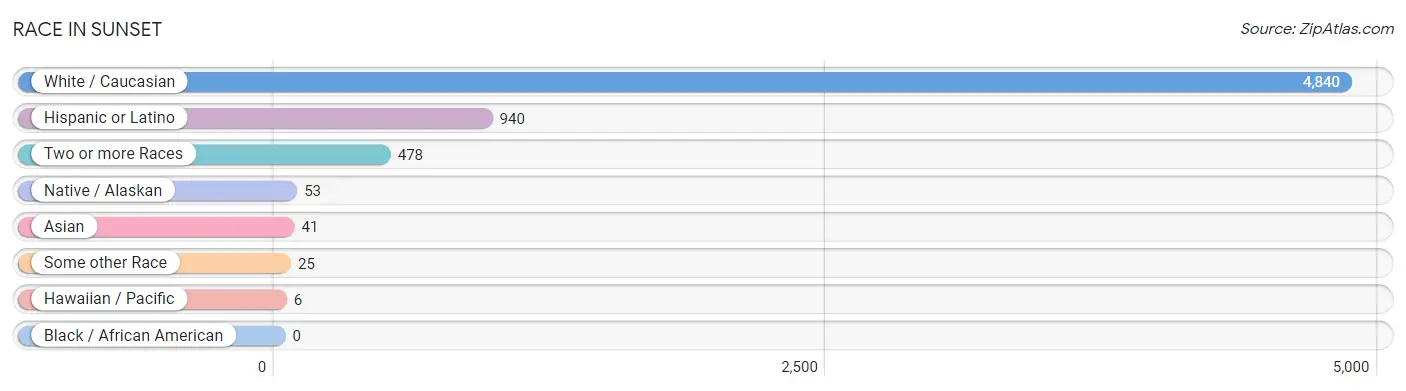
| Race | # Population | % Population |
| Asian | 41 | 0.7% |
| Black / African American | 0 | 0.0% |
| Hawaiian / Pacific | 6 | 0.1% |
| Hispanic or Latino | 940 | 17.3% |
| Native / Alaskan | 53 | 1.0% |
| White / Caucasian | 4,840 | 88.9% |
| Two or more Races | 478 | 8.8% |
| Some other Race | 25 | 0.5% |
| Total | 5,443 | 100.0% |
Ancestry in Sunset
The most populous ancestries reported in Sunset are English (1,013 | 18.6%), Mexican (921 | 16.9%), Irish (557 | 10.2%), German (331 | 6.1%), and American (287 | 5.3%), together accounting for 57.1% of all Sunset residents.
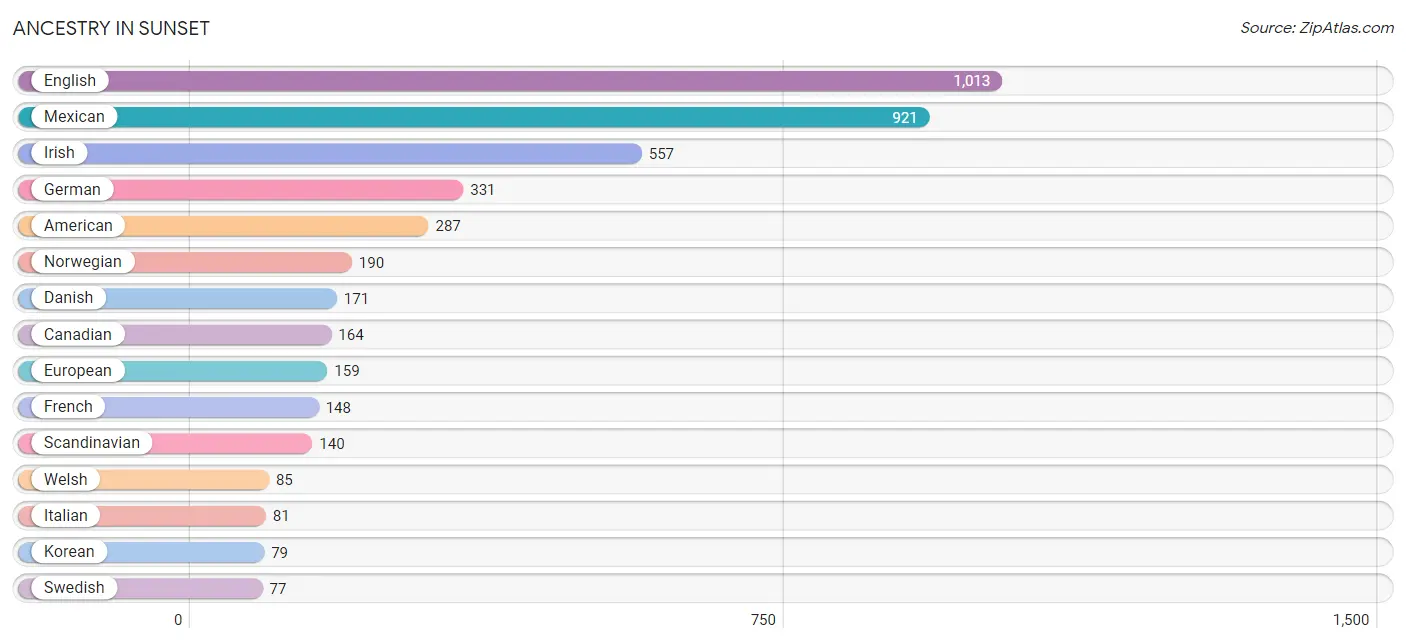
| Ancestry | # Population | % Population |
| American | 287 | 5.3% |
| Apache | 15 | 0.3% |
| Austrian | 35 | 0.6% |
| Bangladeshi | 22 | 0.4% |
| British | 49 | 0.9% |
| Cambodian | 7 | 0.1% |
| Canadian | 164 | 3.0% |
| Central American | 6 | 0.1% |
| Central American Indian | 6 | 0.1% |
| Cherokee | 25 | 0.5% |
| Colombian | 13 | 0.2% |
| Czech | 12 | 0.2% |
| Danish | 171 | 3.1% |
| Delaware | 18 | 0.3% |
| Dutch | 30 | 0.5% |
| English | 1,013 | 18.6% |
| European | 159 | 2.9% |
| French | 148 | 2.7% |
| German | 331 | 6.1% |
| Guatemalan | 6 | 0.1% |
| Irish | 557 | 10.2% |
| Italian | 81 | 1.5% |
| Jamaican | 22 | 0.4% |
| Korean | 79 | 1.5% |
| Mexican | 921 | 16.9% |
| Mexican American Indian | 10 | 0.2% |
| Navajo | 30 | 0.5% |
| Norwegian | 190 | 3.5% |
| Polish | 31 | 0.6% |
| Portuguese | 21 | 0.4% |
| Samoan | 31 | 0.6% |
| Scandinavian | 140 | 2.6% |
| Scotch-Irish | 5 | 0.1% |
| Scottish | 65 | 1.2% |
| Sioux | 6 | 0.1% |
| Slovak | 22 | 0.4% |
| South American | 13 | 0.2% |
| Sri Lankan | 58 | 1.1% |
| Swedish | 77 | 1.4% |
| Swiss | 12 | 0.2% |
| Welsh | 85 | 1.6% | View All 41 Rows |
Immigrants in Sunset
The most numerous immigrant groups reported in Sunset came from Latin America (283 | 5.2%), Central America (270 | 5.0%), Mexico (270 | 5.0%), Asia (28 | 0.5%), and South Eastern Asia (28 | 0.5%), together accounting for 16.1% of all Sunset residents.
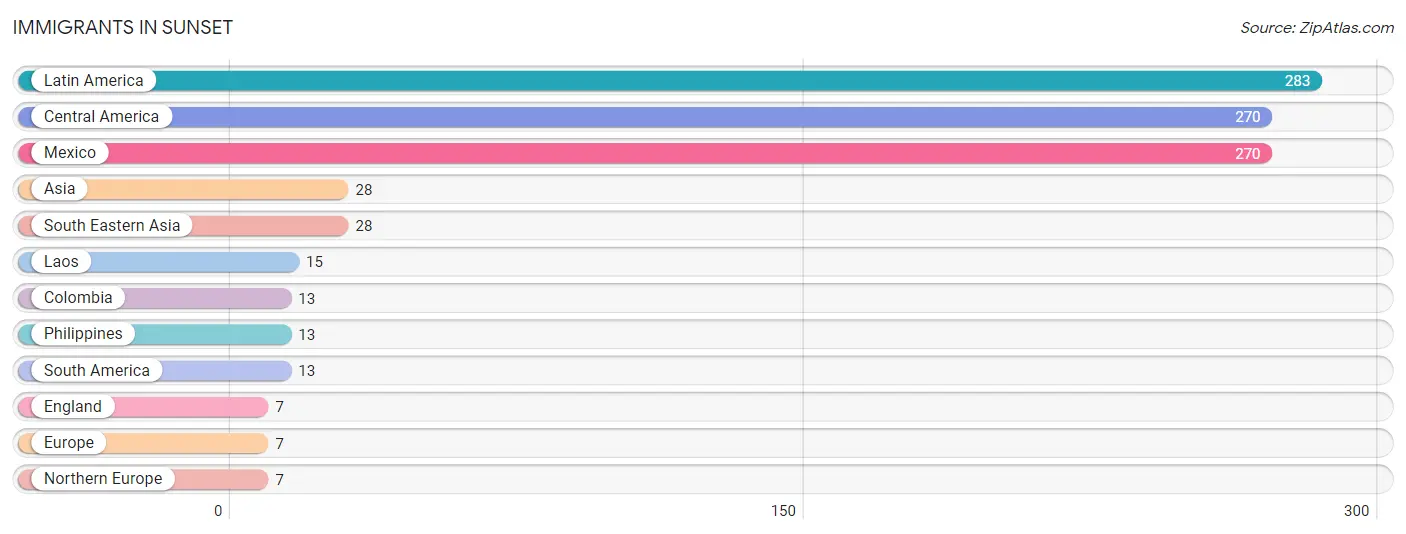
| Immigration Origin | # Population | % Population |
| Asia | 28 | 0.5% |
| Central America | 270 | 5.0% |
| Colombia | 13 | 0.2% |
| England | 7 | 0.1% |
| Europe | 7 | 0.1% |
| Laos | 15 | 0.3% |
| Latin America | 283 | 5.2% |
| Mexico | 270 | 5.0% |
| Northern Europe | 7 | 0.1% |
| Philippines | 13 | 0.2% |
| South America | 13 | 0.2% |
| South Eastern Asia | 28 | 0.5% | View All 12 Rows |
Sex and Age in Sunset
Sex and Age in Sunset
The most populous age groups in Sunset are 20 to 24 Years (316 | 12.7%) for men and 5 to 9 Years (337 | 11.4%) for women.
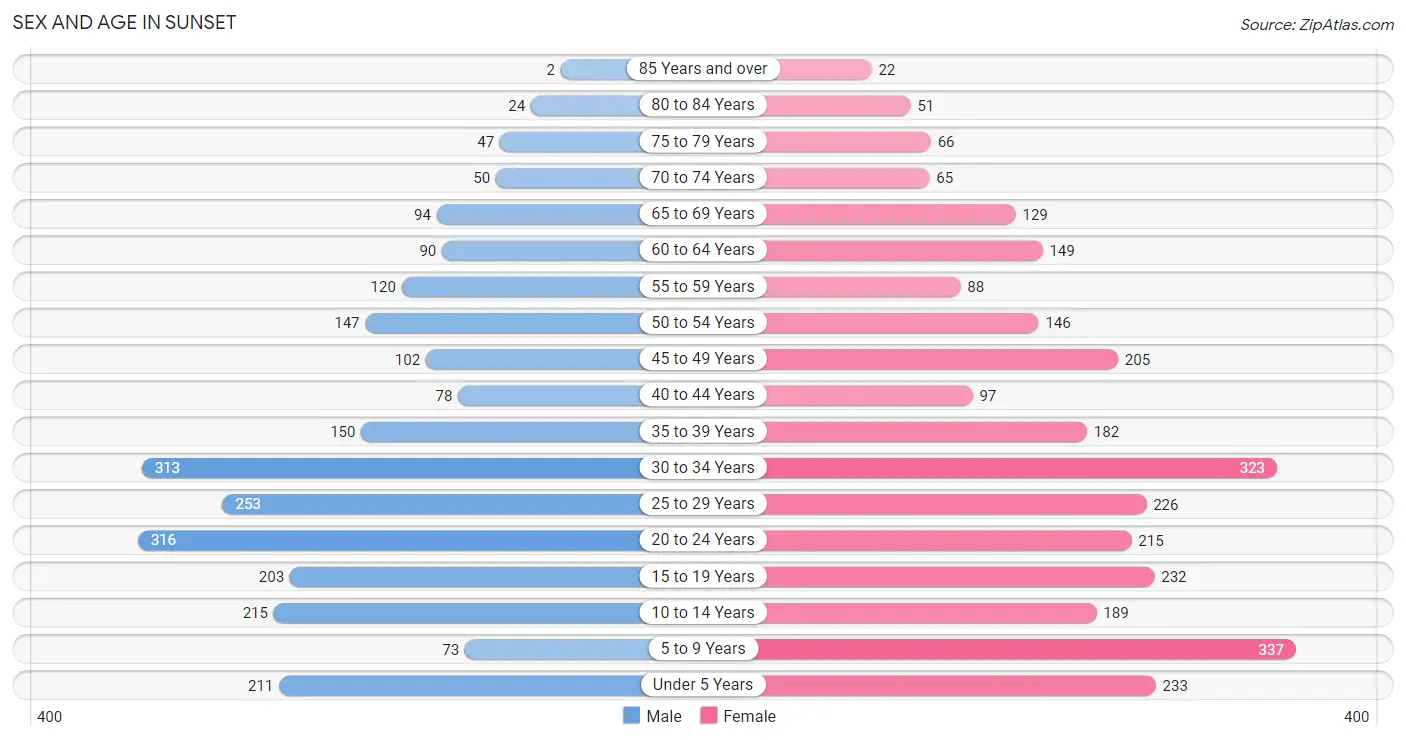
| Age Bracket | Male | Female |
| Under 5 Years | 211 (8.5%) | 233 (7.9%) |
| 5 to 9 Years | 73 (2.9%) | 337 (11.4%) |
| 10 to 14 Years | 215 (8.6%) | 189 (6.4%) |
| 15 to 19 Years | 203 (8.2%) | 232 (7.9%) |
| 20 to 24 Years | 316 (12.7%) | 215 (7.3%) |
| 25 to 29 Years | 253 (10.2%) | 226 (7.6%) |
| 30 to 34 Years | 313 (12.6%) | 323 (10.9%) |
| 35 to 39 Years | 150 (6.0%) | 182 (6.2%) |
| 40 to 44 Years | 78 (3.1%) | 97 (3.3%) |
| 45 to 49 Years | 102 (4.1%) | 205 (6.9%) |
| 50 to 54 Years | 147 (5.9%) | 146 (4.9%) |
| 55 to 59 Years | 120 (4.8%) | 88 (3.0%) |
| 60 to 64 Years | 90 (3.6%) | 149 (5.0%) |
| 65 to 69 Years | 94 (3.8%) | 129 (4.4%) |
| 70 to 74 Years | 50 (2.0%) | 65 (2.2%) |
| 75 to 79 Years | 47 (1.9%) | 66 (2.2%) |
| 80 to 84 Years | 24 (1.0%) | 51 (1.7%) |
| 85 Years and over | 2 (0.1%) | 22 (0.7%) |
| Total | 2,488 (100.0%) | 2,955 (100.0%) |
Families and Households in Sunset
Median Family Size in Sunset
The median family size in Sunset is 3.74 persons per family, with married-couple families (746 | 64.2%) accounting for the largest median family size of 4.18 persons per family. On the other hand, single female/mother families (288 | 24.8%) represent the smallest median family size with 2.90 persons per family.
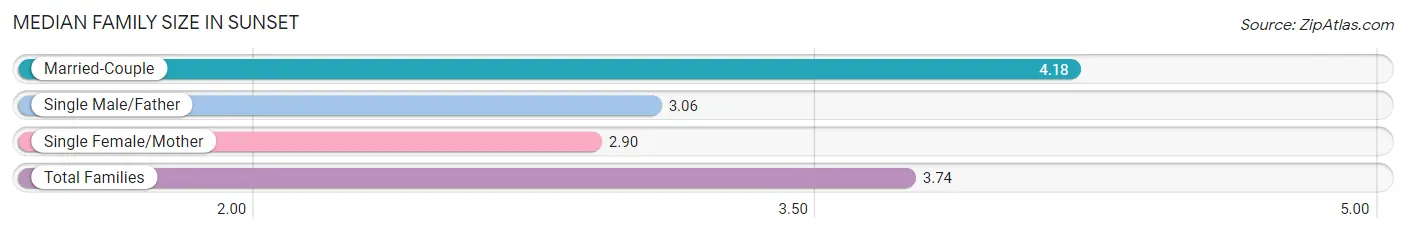
| Family Type | # Families | Family Size |
| Married-Couple | 746 (64.2%) | 4.18 |
| Single Male/Father | 128 (11.0%) | 3.06 |
| Single Female/Mother | 288 (24.8%) | 2.90 |
| Total Families | 1,162 (100.0%) | 3.74 |
Median Household Size in Sunset
The median household size in Sunset is 3.25 persons per household, with married-couple households (746 | 44.8%) accounting for the largest median household size of 4.23 persons per household. non-family households (505 | 30.3%) represent the smallest median household size with 1.39 persons per household.
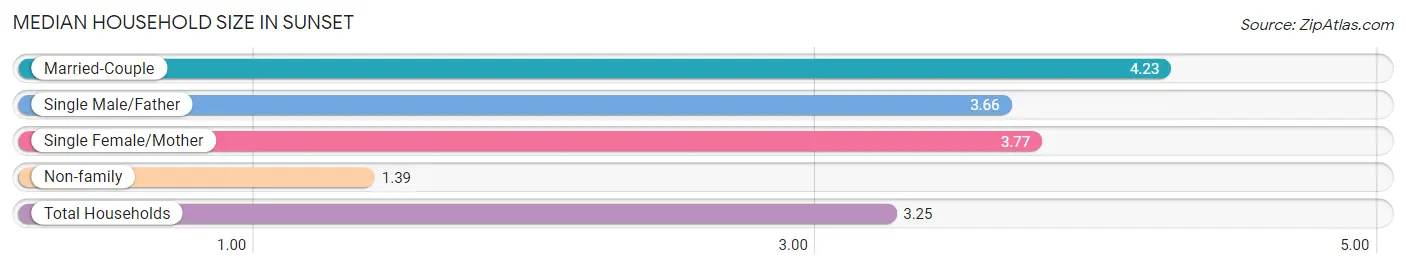
| Household Type | # Households | Household Size |
| Married-Couple | 746 (44.8%) | 4.23 |
| Single Male/Father | 128 (7.7%) | 3.66 |
| Single Female/Mother | 288 (17.3%) | 3.77 |
| Non-family | 505 (30.3%) | 1.39 |
| Total Households | 1,667 (100.0%) | 3.25 |
Household Size by Marriage Status in Sunset
Out of a total of 1,667 households in Sunset, 1,162 (69.7%) are family households, while 505 (30.3%) are nonfamily households. The most numerous type of family households are 3-person households, comprising 349, and the most common type of nonfamily households are 1-person households, comprising 390.
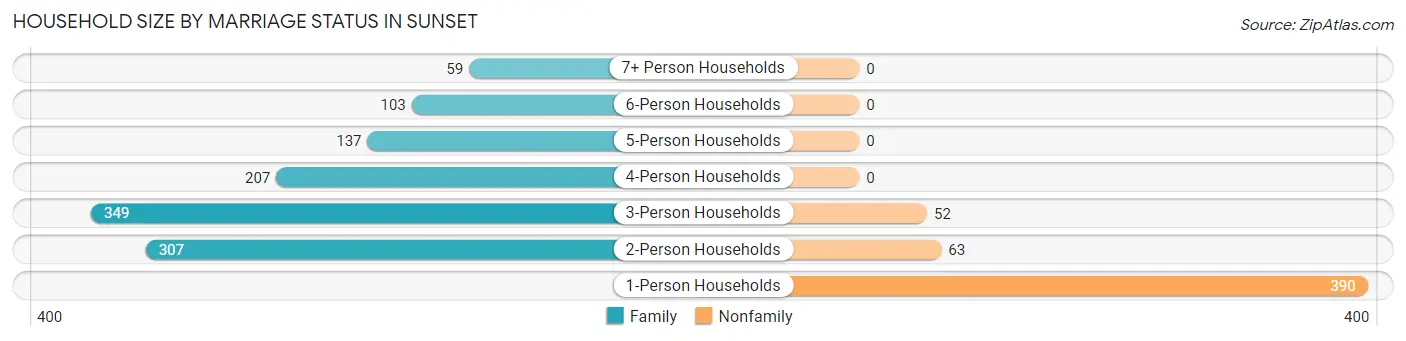
| Household Size | Family Households | Nonfamily Households |
| 1-Person Households | - | 390 (23.4%) |
| 2-Person Households | 307 (18.4%) | 63 (3.8%) |
| 3-Person Households | 349 (20.9%) | 52 (3.1%) |
| 4-Person Households | 207 (12.4%) | 0 (0.0%) |
| 5-Person Households | 137 (8.2%) | 0 (0.0%) |
| 6-Person Households | 103 (6.2%) | 0 (0.0%) |
| 7+ Person Households | 59 (3.5%) | 0 (0.0%) |
| Total | 1,162 (69.7%) | 505 (30.3%) |
Female Fertility in Sunset
Fertility by Age in Sunset
Average fertility rate in Sunset is 72.0 births per 1,000 women. Women in the age bracket of 20 to 34 years have the highest fertility rate with 143.0 births per 1,000 women. Women in the age bracket of 20 to 34 years acount for 100.0% of all women with births.
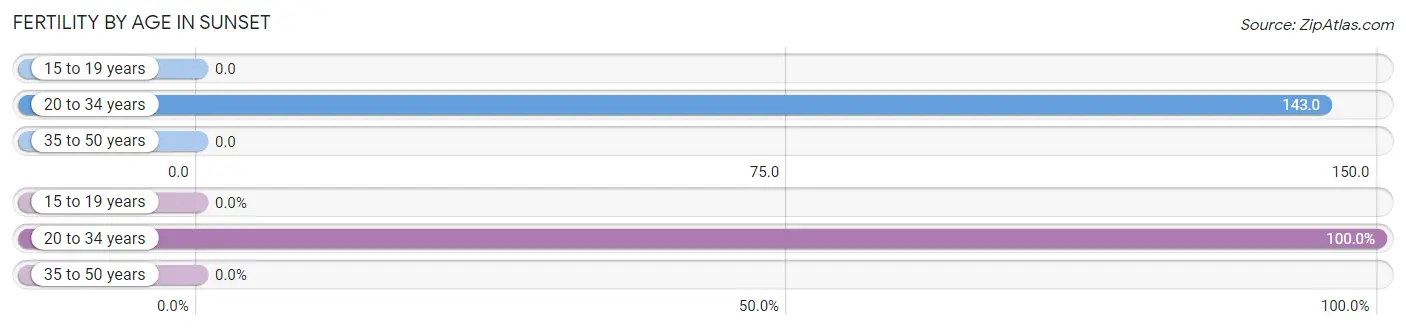
| Age Bracket | Women with Births | Births / 1,000 Women |
| 15 to 19 years | 0 (0.0%) | 0.0 |
| 20 to 34 years | 109 (100.0%) | 143.0 |
| 35 to 50 years | 0 (0.0%) | 0.0 |
| Total | 109 (100.0%) | 72.0 |
Fertility by Age by Marriage Status in Sunset
56.0% of women with births (109) in Sunset are married. The highest percentage of unmarried women with births falls into 20 to 34 years age bracket with 44.0% of them unmarried at the time of birth, while the lowest percentage of unmarried women with births belong to 20 to 34 years age bracket with 44.0% of them unmarried.
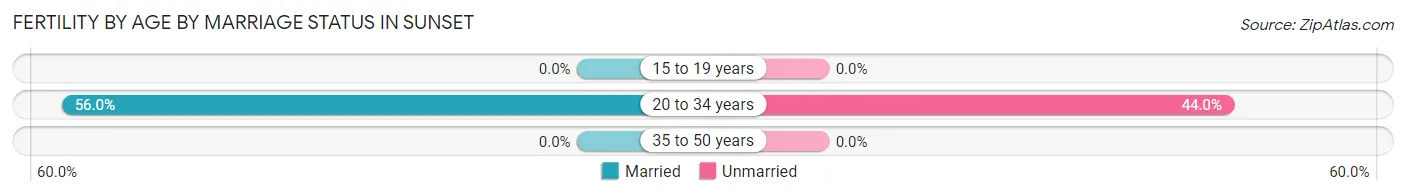
| Age Bracket | Married | Unmarried |
| 15 to 19 years | 0 (0.0%) | 0 (0.0%) |
| 20 to 34 years | 61 (56.0%) | 48 (44.0%) |
| 35 to 50 years | 0 (0.0%) | 0 (0.0%) |
| Total | 61 (56.0%) | 48 (44.0%) |
Fertility by Education in Sunset
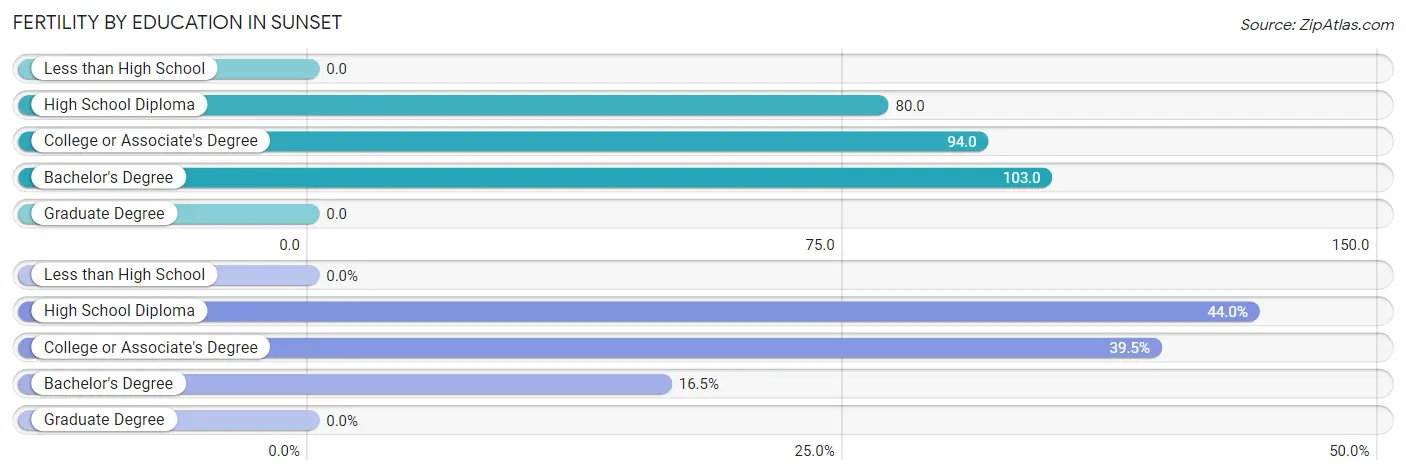
| Educational Attainment | Women with Births | Births / 1,000 Women |
| Less than High School | 0 (0.0%) | 0.0 |
| High School Diploma | 48 (44.0%) | 80.0 |
| College or Associate's Degree | 43 (39.5%) | 94.0 |
| Bachelor's Degree | 18 (16.5%) | 103.0 |
| Graduate Degree | 0 (0.0%) | 0.0 |
| Total | 109 (100.0%) | 72.0 |
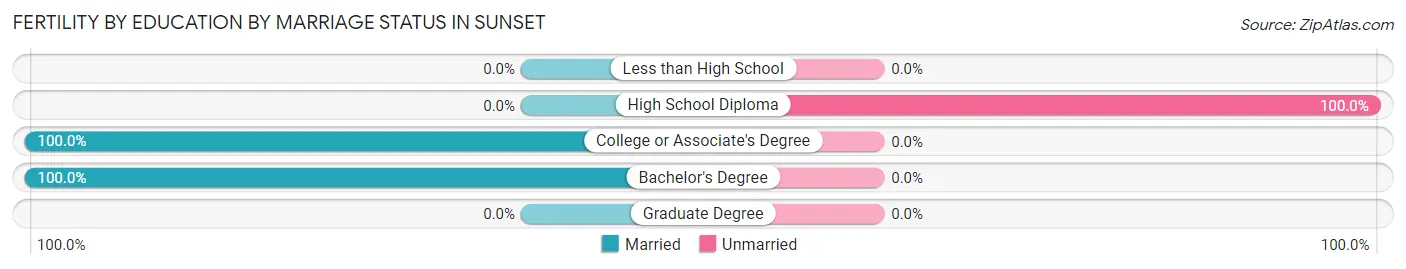
Fertility by Education by Marriage Status in Sunset
44.0% of women with births in Sunset are unmarried. Women with the educational attainment of college or associate's degree are most likely to be married with 100.0% of them married at childbirth, while women with the educational attainment of high school diploma are least likely to be married with 100.0% of them unmarried at childbirth.
| Educational Attainment | Married | Unmarried |
| Less than High School | 0 (0.0%) | 0 (0.0%) |
| High School Diploma | 0 (0.0%) | 48 (100.0%) |
| College or Associate's Degree | 43 (100.0%) | 0 (0.0%) |
| Bachelor's Degree | 18 (100.0%) | 0 (0.0%) |
| Graduate Degree | 0 (0.0%) | 0 (0.0%) |
| Total | 61 (56.0%) | 48 (44.0%) |
Employment Characteristics in Sunset
Employment by Class of Employer in Sunset
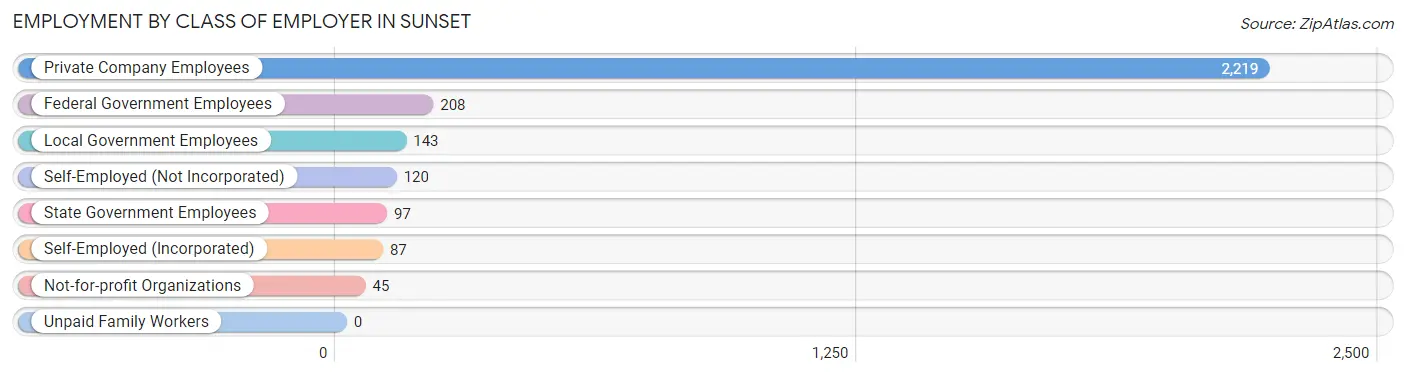
Among the 2,919 employed individuals in Sunset, private company employees (2,219 | 76.0%), federal government employees (208 | 7.1%), and local government employees (143 | 4.9%) make up the most common classes of employment.
| Employer Class | # Employees | % Employees |
| Private Company Employees | 2,219 | 76.0% |
| Self-Employed (Incorporated) | 87 | 3.0% |
| Self-Employed (Not Incorporated) | 120 | 4.1% |
| Not-for-profit Organizations | 45 | 1.5% |
| Local Government Employees | 143 | 4.9% |
| State Government Employees | 97 | 3.3% |
| Federal Government Employees | 208 | 7.1% |
| Unpaid Family Workers | 0 | 0.0% |
| Total | 2,919 | 100.0% |
Employment Status by Age in Sunset
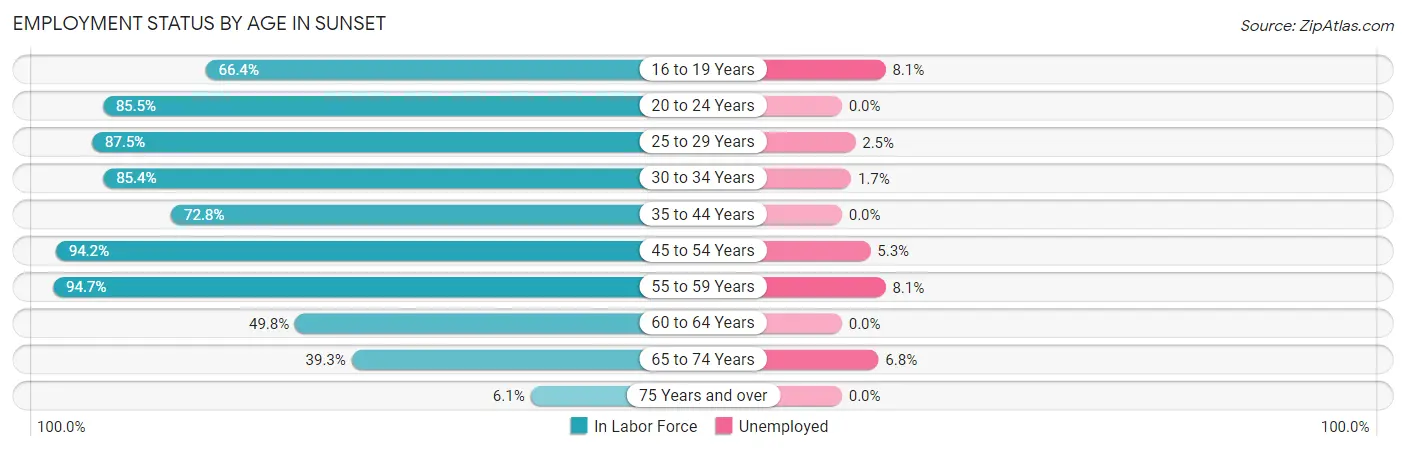
According to the labor force statistics for Sunset, out of the total population over 16 years of age (4,116), 74.2% or 3,054 individuals are in the labor force, with 3.1% or 95 of them unemployed. The age group with the highest labor force participation rate is 55 to 59 years, with 94.7% or 197 individuals in the labor force. Within the labor force, the 16 to 19 years age range has the highest percentage of unemployed individuals, with 8.1% or 20 of them being unemployed.
| Age Bracket | In Labor Force | Unemployed |
| 16 to 19 Years | 243 (66.4%) | 20 (8.1%) |
| 20 to 24 Years | 454 (85.5%) | 0 (0.0%) |
| 25 to 29 Years | 419 (87.5%) | 10 (2.5%) |
| 30 to 34 Years | 543 (85.4%) | 9 (1.7%) |
| 35 to 44 Years | 369 (72.8%) | 0 (0.0%) |
| 45 to 54 Years | 565 (94.2%) | 30 (5.3%) |
| 55 to 59 Years | 197 (94.7%) | 16 (8.1%) |
| 60 to 64 Years | 119 (49.8%) | 0 (0.0%) |
| 65 to 74 Years | 133 (39.3%) | 9 (6.8%) |
| 75 Years and over | 13 (6.1%) | 0 (0.0%) |
| Total | 3,054 (74.2%) | 95 (3.1%) |
Employment Status by Educational Attainment in Sunset
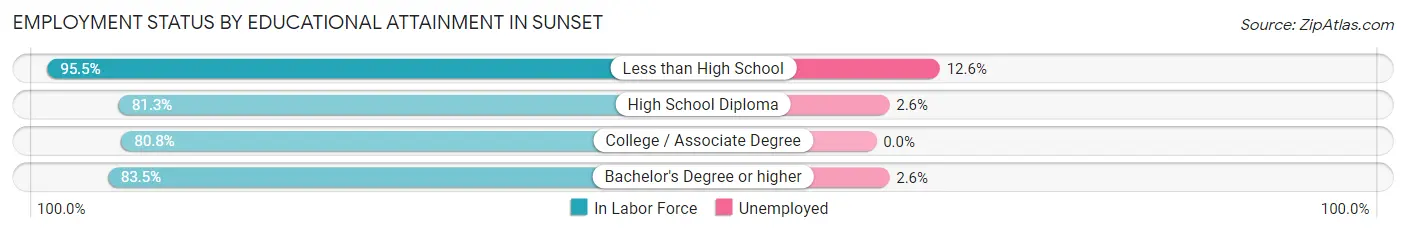
According to labor force statistics for Sunset, 82.9% of individuals (2,213) out of the total population between 25 and 64 years of age (2,669) are in the labor force, with 3.0% or 66 of them being unemployed. The group with the highest labor force participation rate are those with the educational attainment of less than high school, with 95.5% or 253 individuals in the labor force. Within the labor force, individuals with less than high school education have the highest percentage of unemployment, with 12.6% or 32 of them being unemployed.
| Educational Attainment | In Labor Force | Unemployed |
| Less than High School | 253 (95.5%) | 33 (12.6%) |
| High School Diploma | 959 (81.3%) | 31 (2.6%) |
| College / Associate Degree | 677 (80.8%) | 0 (0.0%) |
| Bachelor's Degree or higher | 323 (83.5%) | 10 (2.6%) |
| Total | 2,213 (82.9%) | 80 (3.0%) |
Employment Occupations by Sex in Sunset
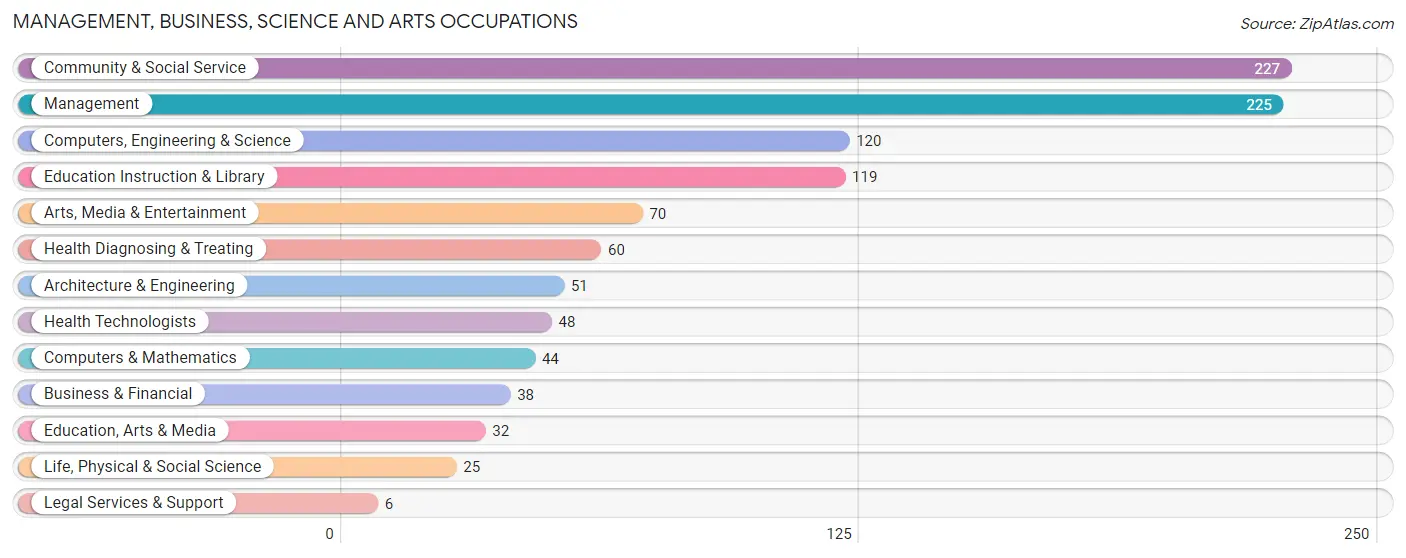
Management, Business, Science and Arts Occupations
The most common Management, Business, Science and Arts occupations in Sunset are Community & Social Service (227 | 7.8%), Management (225 | 7.7%), Computers, Engineering & Science (120 | 4.1%), Education Instruction & Library (119 | 4.1%), and Arts, Media & Entertainment (70 | 2.4%).
Management, Business, Science and Arts Occupations by Sex
Within the Management, Business, Science and Arts occupations in Sunset, the most male-oriented occupations are Architecture & Engineering (100.0%), Legal Services & Support (100.0%), and Business & Financial (65.8%), while the most female-oriented occupations are Health Technologists (100.0%), Arts, Media & Entertainment (90.0%), and Health Diagnosing & Treating (80.0%).
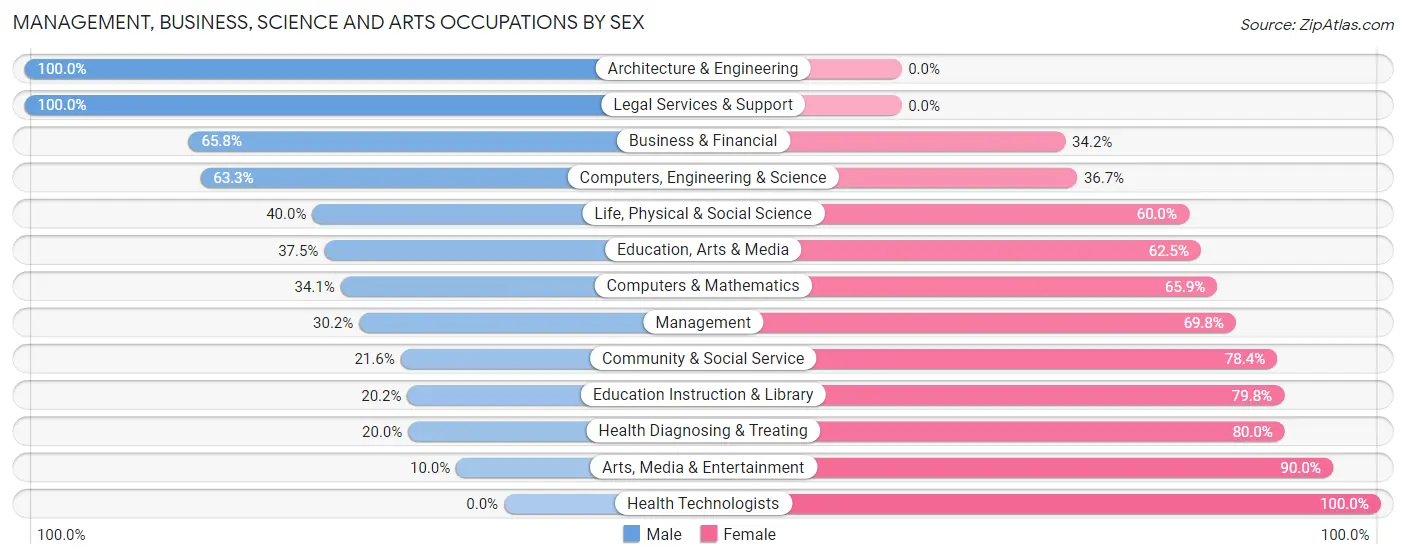
| Occupation | Male | Female |
| Management | 68 (30.2%) | 157 (69.8%) |
| Business & Financial | 25 (65.8%) | 13 (34.2%) |
| Computers, Engineering & Science | 76 (63.3%) | 44 (36.7%) |
| Computers & Mathematics | 15 (34.1%) | 29 (65.9%) |
| Architecture & Engineering | 51 (100.0%) | 0 (0.0%) |
| Life, Physical & Social Science | 10 (40.0%) | 15 (60.0%) |
| Community & Social Service | 49 (21.6%) | 178 (78.4%) |
| Education, Arts & Media | 12 (37.5%) | 20 (62.5%) |
| Legal Services & Support | 6 (100.0%) | 0 (0.0%) |
| Education Instruction & Library | 24 (20.2%) | 95 (79.8%) |
| Arts, Media & Entertainment | 7 (10.0%) | 63 (90.0%) |
| Health Diagnosing & Treating | 12 (20.0%) | 48 (80.0%) |
| Health Technologists | 0 (0.0%) | 48 (100.0%) |
| Total (Category) | 230 (34.3%) | 440 (65.7%) |
| Total (Overall) | 1,521 (52.4%) | 1,384 (47.6%) |
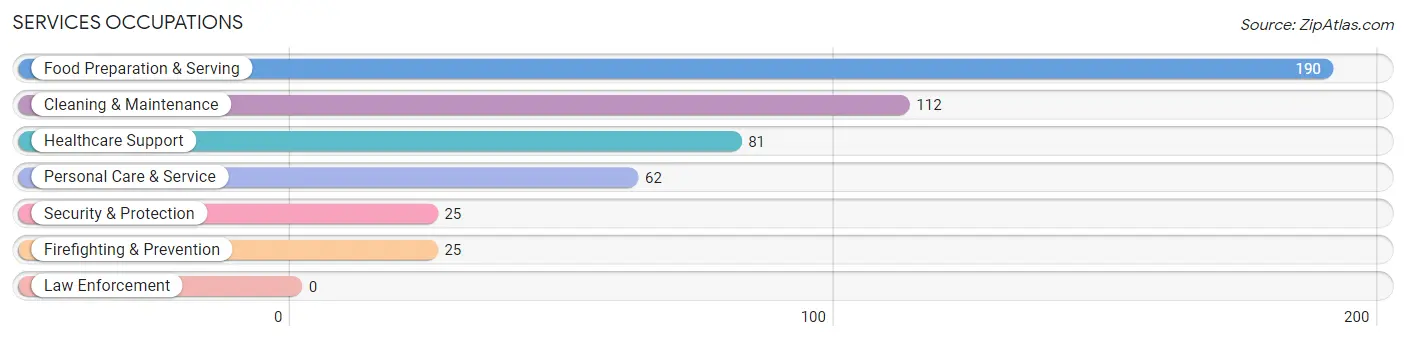
Services Occupations
The most common Services occupations in Sunset are Food Preparation & Serving (190 | 6.5%), Cleaning & Maintenance (112 | 3.9%), Healthcare Support (81 | 2.8%), Personal Care & Service (62 | 2.1%), and Security & Protection (25 | 0.9%).
Services Occupations by Sex
Within the Services occupations in Sunset, the most male-oriented occupations are Security & Protection (100.0%), Firefighting & Prevention (100.0%), and Cleaning & Maintenance (49.1%), while the most female-oriented occupations are Healthcare Support (100.0%), Food Preparation & Serving (76.3%), and Personal Care & Service (53.2%).
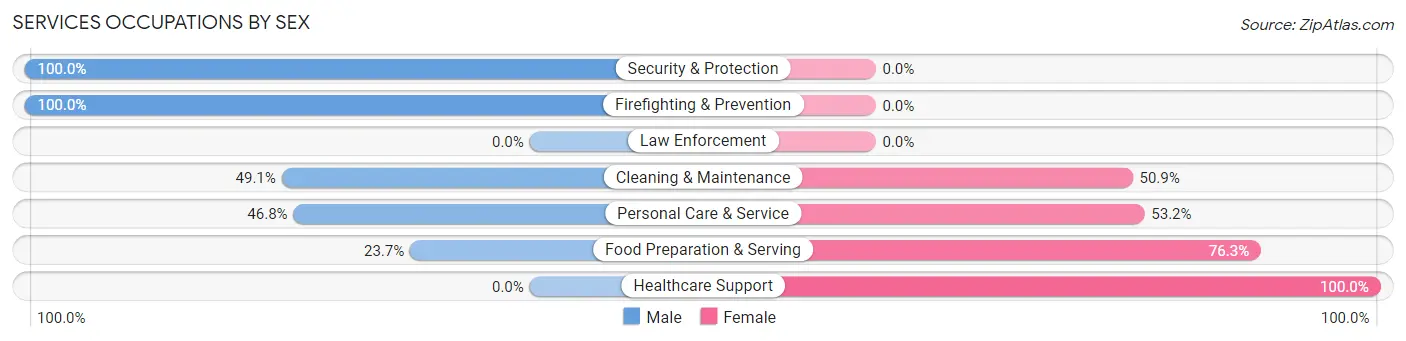
| Occupation | Male | Female |
| Healthcare Support | 0 (0.0%) | 81 (100.0%) |
| Security & Protection | 25 (100.0%) | 0 (0.0%) |
| Firefighting & Prevention | 25 (100.0%) | 0 (0.0%) |
| Law Enforcement | 0 (0.0%) | 0 (0.0%) |
| Food Preparation & Serving | 45 (23.7%) | 145 (76.3%) |
| Cleaning & Maintenance | 55 (49.1%) | 57 (50.9%) |
| Personal Care & Service | 29 (46.8%) | 33 (53.2%) |
| Total (Category) | 154 (32.8%) | 316 (67.2%) |
| Total (Overall) | 1,521 (52.4%) | 1,384 (47.6%) |
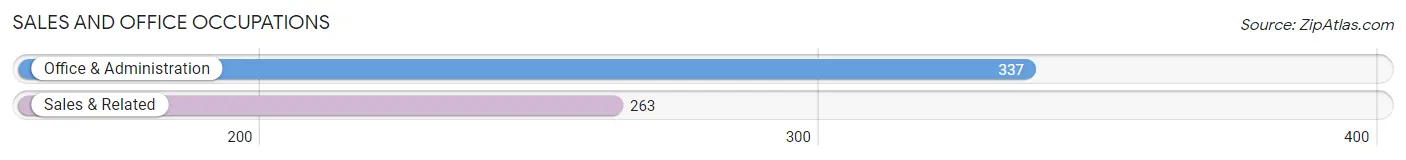
Sales and Office Occupations
The most common Sales and Office occupations in Sunset are Office & Administration (337 | 11.6%), and Sales & Related (263 | 9.0%).
Sales and Office Occupations by Sex
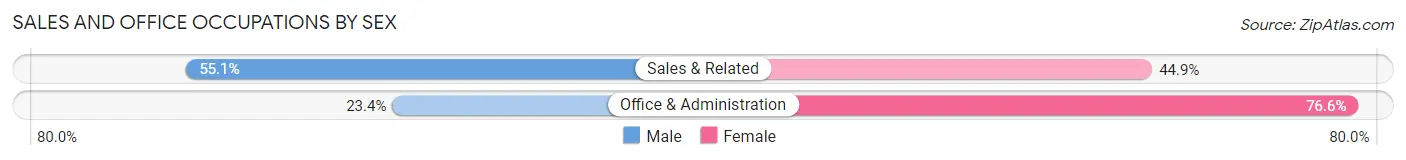
| Occupation | Male | Female |
| Sales & Related | 145 (55.1%) | 118 (44.9%) |
| Office & Administration | 79 (23.4%) | 258 (76.6%) |
| Total (Category) | 224 (37.3%) | 376 (62.7%) |
| Total (Overall) | 1,521 (52.4%) | 1,384 (47.6%) |
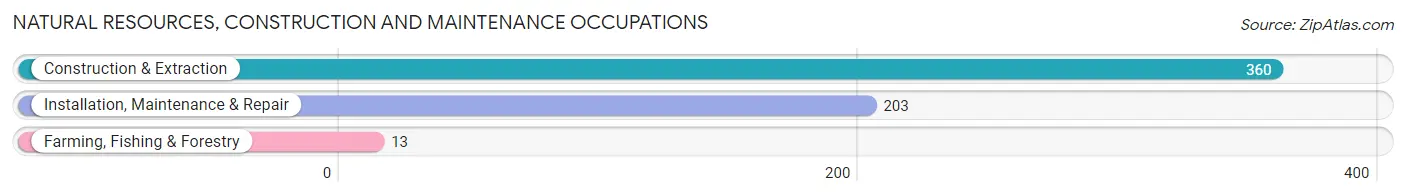
Natural Resources, Construction and Maintenance Occupations
The most common Natural Resources, Construction and Maintenance occupations in Sunset are Construction & Extraction (360 | 12.4%), Installation, Maintenance & Repair (203 | 7.0%), and Farming, Fishing & Forestry (13 | 0.4%).
Natural Resources, Construction and Maintenance Occupations by Sex
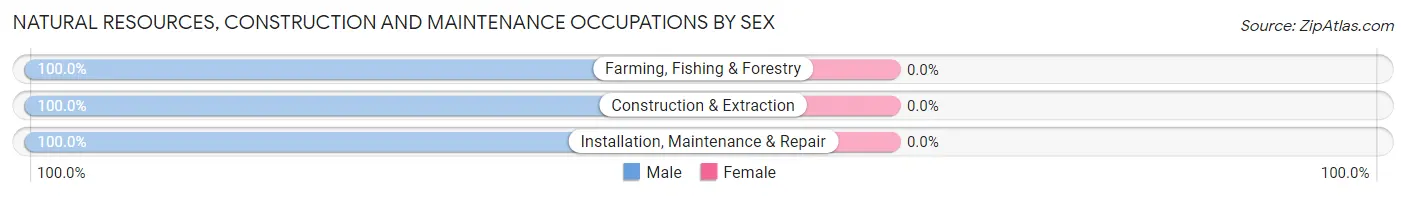
| Occupation | Male | Female |
| Farming, Fishing & Forestry | 13 (100.0%) | 0 (0.0%) |
| Construction & Extraction | 360 (100.0%) | 0 (0.0%) |
| Installation, Maintenance & Repair | 203 (100.0%) | 0 (0.0%) |
| Total (Category) | 576 (100.0%) | 0 (0.0%) |
| Total (Overall) | 1,521 (52.4%) | 1,384 (47.6%) |
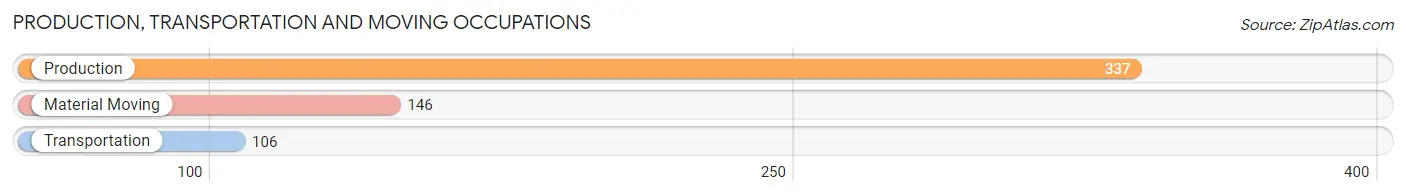
Production, Transportation and Moving Occupations
The most common Production, Transportation and Moving occupations in Sunset are Production (337 | 11.6%), Material Moving (146 | 5.0%), and Transportation (106 | 3.6%).
Production, Transportation and Moving Occupations by Sex
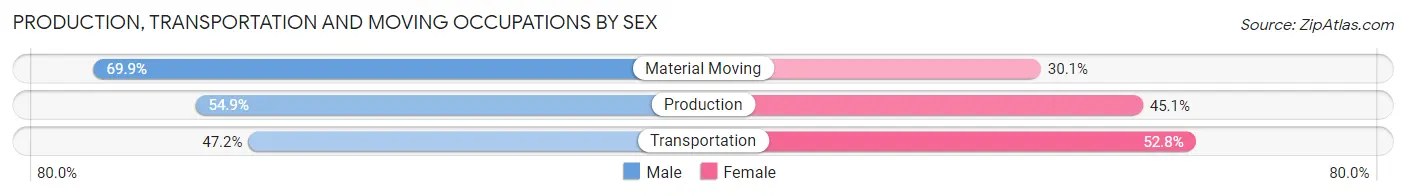
| Occupation | Male | Female |
| Production | 185 (54.9%) | 152 (45.1%) |
| Transportation | 50 (47.2%) | 56 (52.8%) |
| Material Moving | 102 (69.9%) | 44 (30.1%) |
| Total (Category) | 337 (57.2%) | 252 (42.8%) |
| Total (Overall) | 1,521 (52.4%) | 1,384 (47.6%) |
Employment Industries by Sex in Sunset
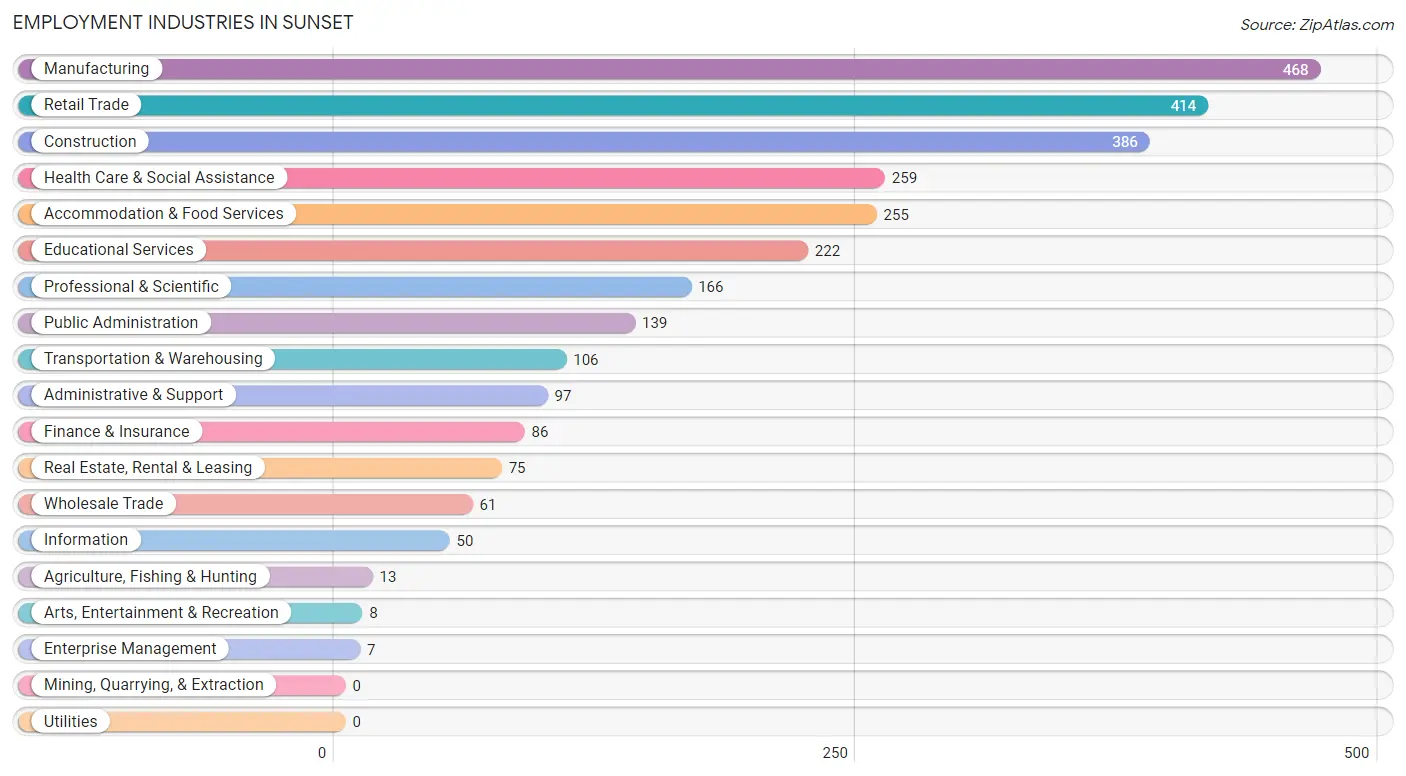
Employment Industries in Sunset
The major employment industries in Sunset include Manufacturing (468 | 16.1%), Retail Trade (414 | 14.2%), Construction (386 | 13.3%), Health Care & Social Assistance (259 | 8.9%), and Accommodation & Food Services (255 | 8.8%).
Employment Industries by Sex in Sunset
The Sunset industries that see more men than women are Agriculture, Fishing & Hunting (100.0%), Enterprise Management (100.0%), and Construction (96.6%), whereas the industries that tend to have a higher number of women are Arts, Entertainment & Recreation (100.0%), Health Care & Social Assistance (90.7%), and Real Estate, Rental & Leasing (88.0%).
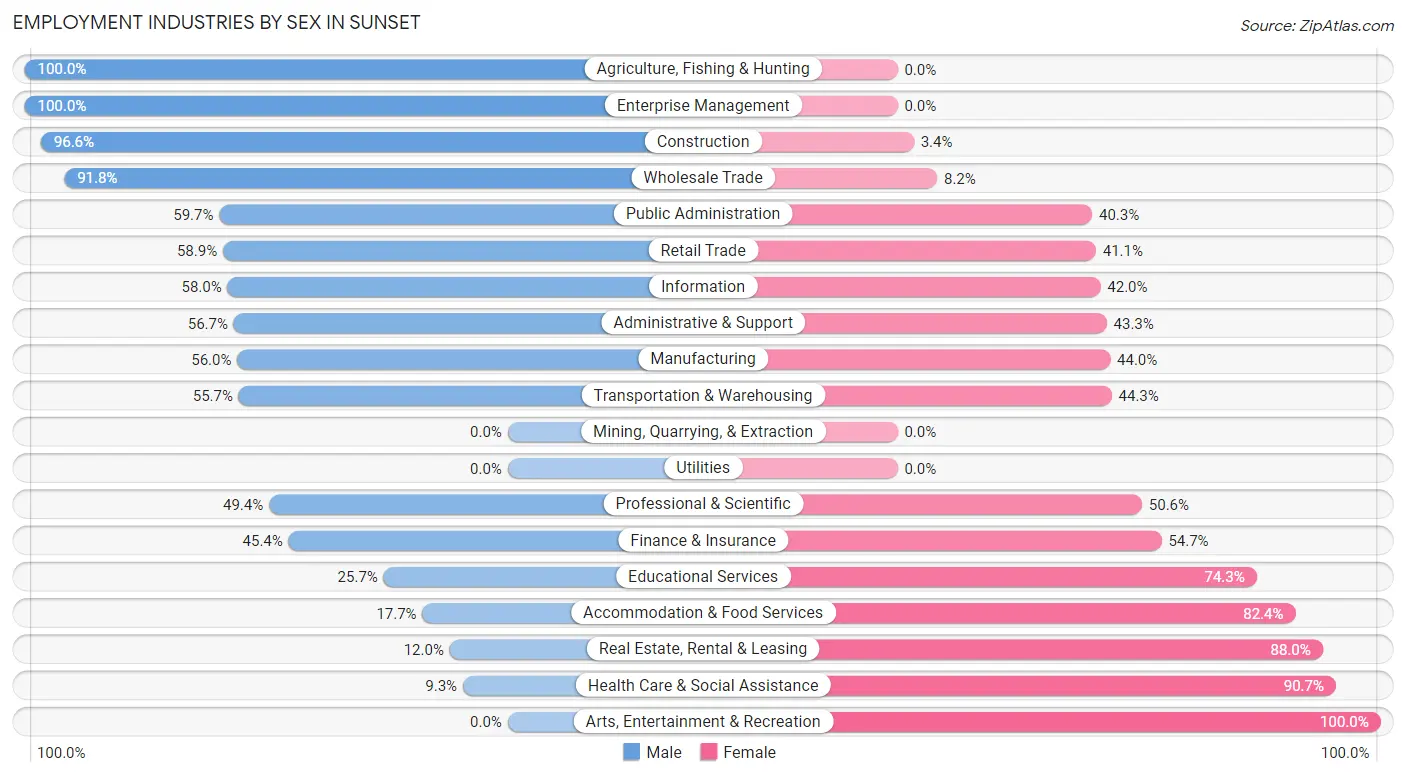
| Industry | Male | Female |
| Agriculture, Fishing & Hunting | 13 (100.0%) | 0 (0.0%) |
| Mining, Quarrying, & Extraction | 0 (0.0%) | 0 (0.0%) |
| Construction | 373 (96.6%) | 13 (3.4%) |
| Manufacturing | 262 (56.0%) | 206 (44.0%) |
| Wholesale Trade | 56 (91.8%) | 5 (8.2%) |
| Retail Trade | 244 (58.9%) | 170 (41.1%) |
| Transportation & Warehousing | 59 (55.7%) | 47 (44.3%) |
| Utilities | 0 (0.0%) | 0 (0.0%) |
| Information | 29 (58.0%) | 21 (42.0%) |
| Finance & Insurance | 39 (45.4%) | 47 (54.6%) |
| Real Estate, Rental & Leasing | 9 (12.0%) | 66 (88.0%) |
| Professional & Scientific | 82 (49.4%) | 84 (50.6%) |
| Enterprise Management | 7 (100.0%) | 0 (0.0%) |
| Administrative & Support | 55 (56.7%) | 42 (43.3%) |
| Educational Services | 57 (25.7%) | 165 (74.3%) |
| Health Care & Social Assistance | 24 (9.3%) | 235 (90.7%) |
| Arts, Entertainment & Recreation | 0 (0.0%) | 8 (100.0%) |
| Accommodation & Food Services | 45 (17.6%) | 210 (82.4%) |
| Public Administration | 83 (59.7%) | 56 (40.3%) |
| Total | 1,521 (52.4%) | 1,384 (47.6%) |
Education in Sunset
School Enrollment in Sunset
The most common levels of schooling among the 1,381 students in Sunset are elementary school (383 | 27.7%), college / undergraduate (300 | 21.7%), and high school (299 | 21.6%).
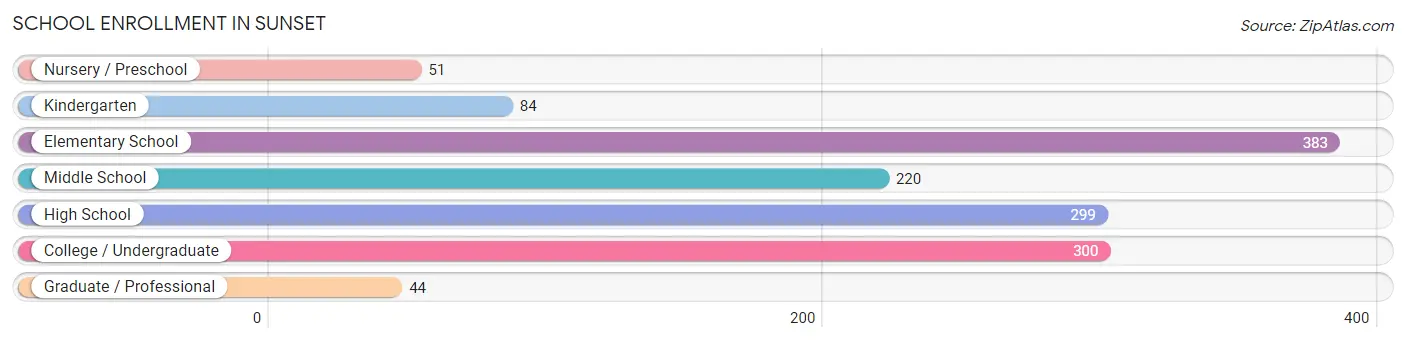
| School Level | # Students | % Students |
| Nursery / Preschool | 51 | 3.7% |
| Kindergarten | 84 | 6.1% |
| Elementary School | 383 | 27.7% |
| Middle School | 220 | 15.9% |
| High School | 299 | 21.6% |
| College / Undergraduate | 300 | 21.7% |
| Graduate / Professional | 44 | 3.2% |
| Total | 1,381 | 100.0% |
School Enrollment by Age by Funding Source in Sunset
Out of a total of 1,381 students who are enrolled in schools in Sunset, 69 (5.0%) attend a private institution, while the remaining 1,312 (95.0%) are enrolled in public schools. The age group of 18 to 19 year olds has the highest likelihood of being enrolled in private schools, with 18 (29.0% in the age bracket) enrolled. Conversely, the age group of 20 to 24 year olds has the lowest likelihood of being enrolled in a private school, with 97 (100.0% in the age bracket) attending a public institution.
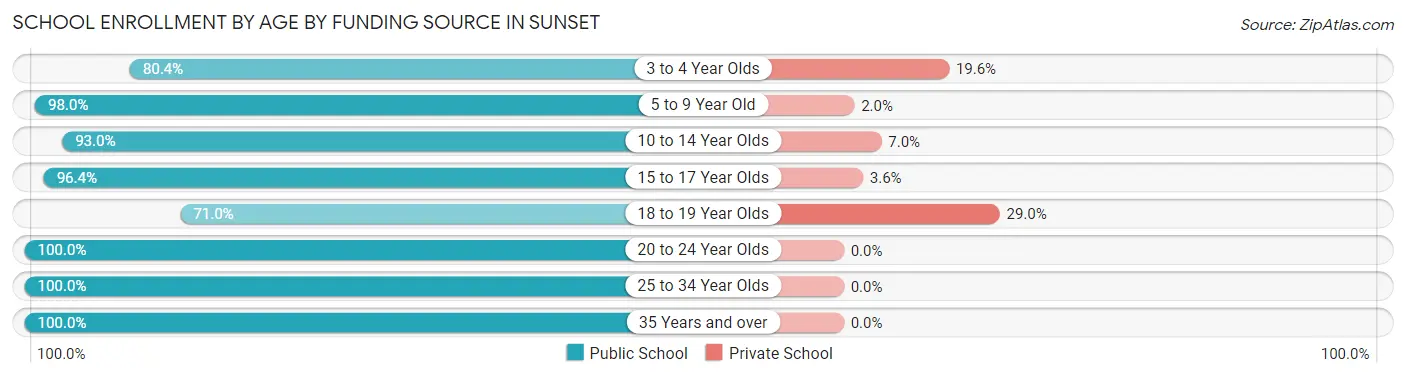
| Age Bracket | Public School | Private School |
| 3 to 4 Year Olds | 41 (80.4%) | 10 (19.6%) |
| 5 to 9 Year Old | 350 (98.0%) | 7 (2.0%) |
| 10 to 14 Year Olds | 371 (93.0%) | 28 (7.0%) |
| 15 to 17 Year Olds | 162 (96.4%) | 6 (3.6%) |
| 18 to 19 Year Olds | 44 (71.0%) | 18 (29.0%) |
| 20 to 24 Year Olds | 97 (100.0%) | 0 (0.0%) |
| 25 to 34 Year Olds | 166 (100.0%) | 0 (0.0%) |
| 35 Years and over | 81 (100.0%) | 0 (0.0%) |
| Total | 1,312 (95.0%) | 69 (5.0%) |
Educational Attainment by Field of Study in Sunset
Arts & humanities (56 | 12.5%), business (53 | 11.8%), science & technology (52 | 11.6%), computers & mathematics (45 | 10.0%), and liberal arts & history (45 | 10.0%) are the most common fields of study among 448 individuals in Sunset who have obtained a bachelor's degree or higher.
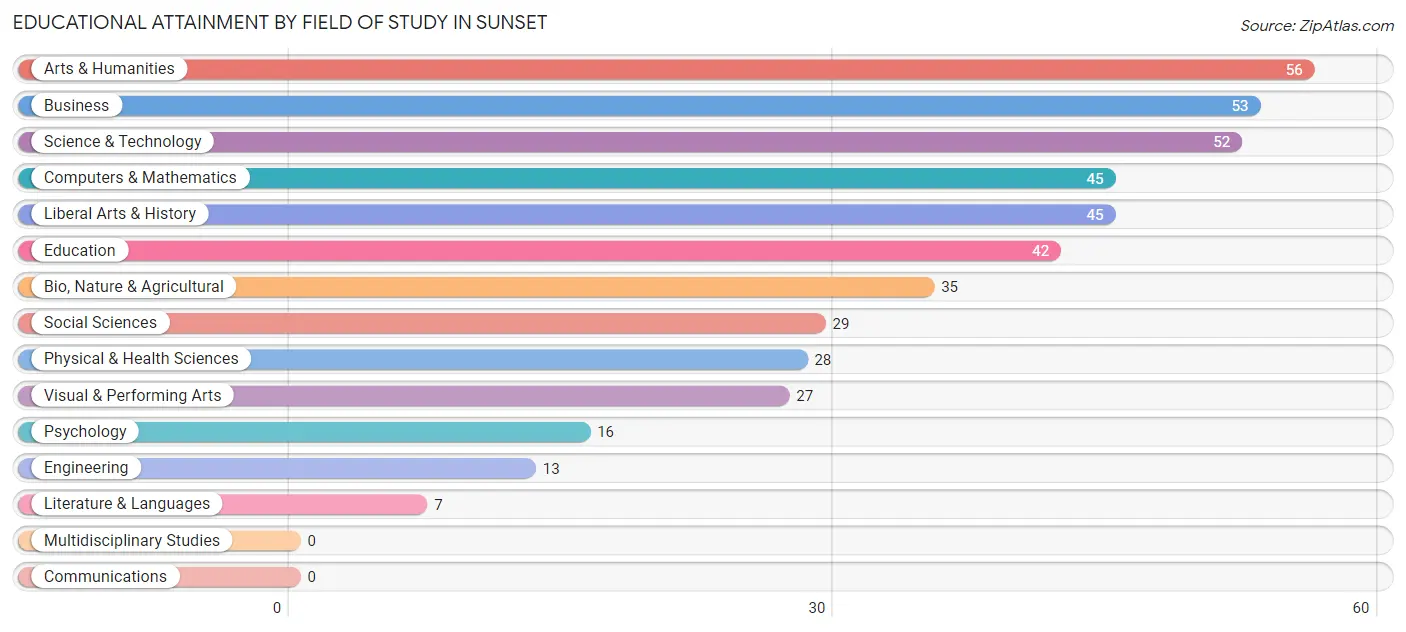
| Field of Study | # Graduates | % Graduates |
| Computers & Mathematics | 45 | 10.0% |
| Bio, Nature & Agricultural | 35 | 7.8% |
| Physical & Health Sciences | 28 | 6.2% |
| Psychology | 16 | 3.6% |
| Social Sciences | 29 | 6.5% |
| Engineering | 13 | 2.9% |
| Multidisciplinary Studies | 0 | 0.0% |
| Science & Technology | 52 | 11.6% |
| Business | 53 | 11.8% |
| Education | 42 | 9.4% |
| Literature & Languages | 7 | 1.6% |
| Liberal Arts & History | 45 | 10.0% |
| Visual & Performing Arts | 27 | 6.0% |
| Communications | 0 | 0.0% |
| Arts & Humanities | 56 | 12.5% |
| Total | 448 | 100.0% |
Transportation & Commute in Sunset
Vehicle Availability by Sex in Sunset
The most prevalent vehicle ownership categories in Sunset are males with 2 vehicles (550, accounting for 36.0%) and females with 2 vehicles (516, making up 40.5%).
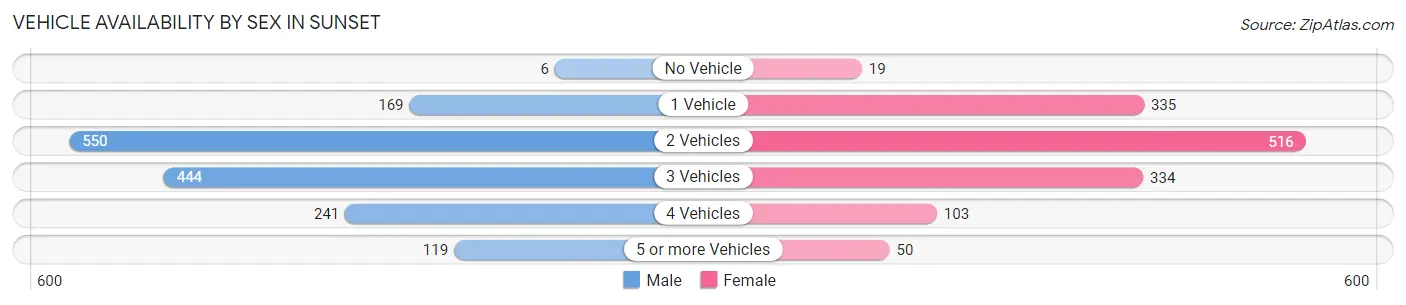
| Vehicles Available | Male | Female |
| No Vehicle | 6 (0.4%) | 19 (1.4%) |
| 1 Vehicle | 169 (11.1%) | 335 (24.7%) |
| 2 Vehicles | 550 (36.0%) | 516 (38.0%) |
| 3 Vehicles | 444 (29.0%) | 334 (24.6%) |
| 4 Vehicles | 241 (15.8%) | 103 (7.6%) |
| 5 or more Vehicles | 119 (7.8%) | 50 (3.7%) |
| Total | 1,529 (100.0%) | 1,357 (100.0%) |
Commute Time in Sunset
The most frequently occuring commute durations in Sunset are 15 to 19 minutes (850 commuters, 31.0%), 10 to 14 minutes (520 commuters, 19.0%), and 20 to 24 minutes (370 commuters, 13.5%).
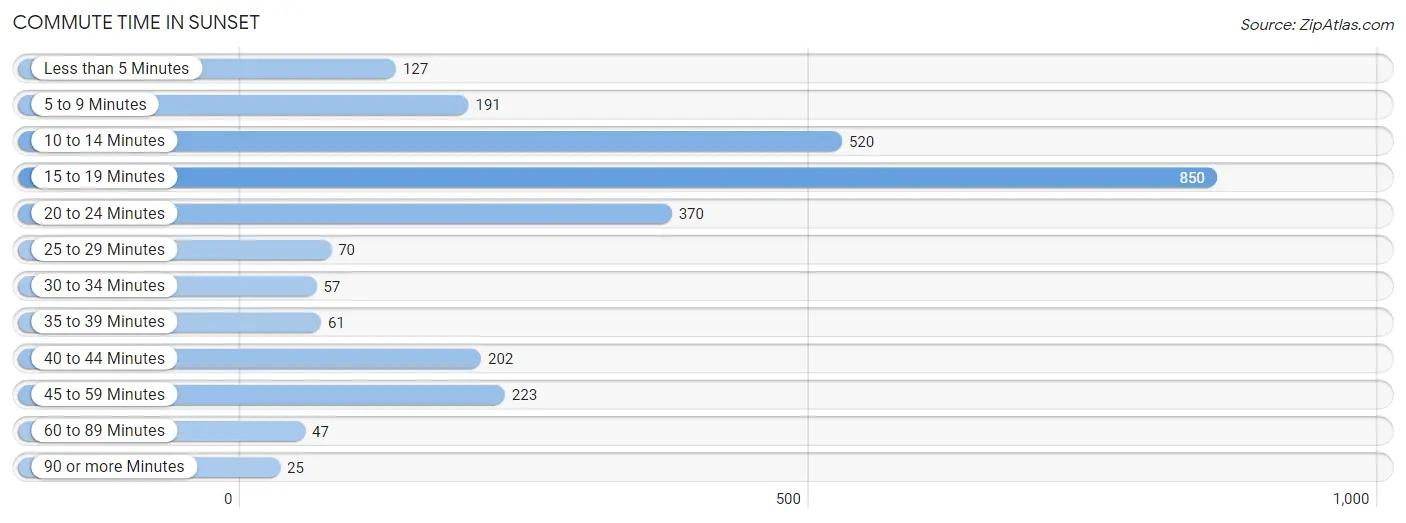
| Commute Time | # Commuters | % Commuters |
| Less than 5 Minutes | 127 | 4.6% |
| 5 to 9 Minutes | 191 | 7.0% |
| 10 to 14 Minutes | 520 | 19.0% |
| 15 to 19 Minutes | 850 | 31.0% |
| 20 to 24 Minutes | 370 | 13.5% |
| 25 to 29 Minutes | 70 | 2.5% |
| 30 to 34 Minutes | 57 | 2.1% |
| 35 to 39 Minutes | 61 | 2.2% |
| 40 to 44 Minutes | 202 | 7.4% |
| 45 to 59 Minutes | 223 | 8.1% |
| 60 to 89 Minutes | 47 | 1.7% |
| 90 or more Minutes | 25 | 0.9% |
Commute Time by Sex in Sunset
The most common commute times in Sunset are 15 to 19 minutes (442 commuters, 30.1%) for males and 15 to 19 minutes (408 commuters, 32.0%) for females.
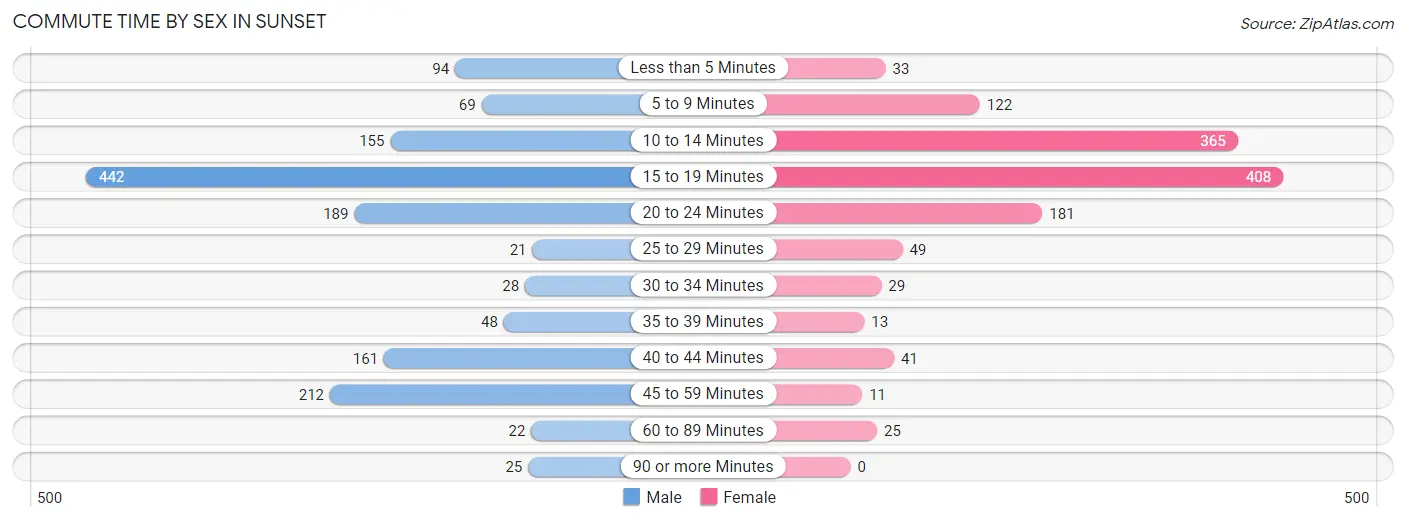
| Commute Time | Male | Female |
| Less than 5 Minutes | 94 (6.4%) | 33 (2.6%) |
| 5 to 9 Minutes | 69 (4.7%) | 122 (9.6%) |
| 10 to 14 Minutes | 155 (10.6%) | 365 (28.6%) |
| 15 to 19 Minutes | 442 (30.1%) | 408 (32.0%) |
| 20 to 24 Minutes | 189 (12.9%) | 181 (14.2%) |
| 25 to 29 Minutes | 21 (1.4%) | 49 (3.8%) |
| 30 to 34 Minutes | 28 (1.9%) | 29 (2.3%) |
| 35 to 39 Minutes | 48 (3.3%) | 13 (1.0%) |
| 40 to 44 Minutes | 161 (11.0%) | 41 (3.2%) |
| 45 to 59 Minutes | 212 (14.5%) | 11 (0.9%) |
| 60 to 89 Minutes | 22 (1.5%) | 25 (2.0%) |
| 90 or more Minutes | 25 (1.7%) | 0 (0.0%) |
Time of Departure to Work by Sex in Sunset
The most frequent times of departure to work in Sunset are 6:00 AM to 6:29 AM (392, 26.7%) for males and 7:00 AM to 7:29 AM (194, 15.2%) for females.
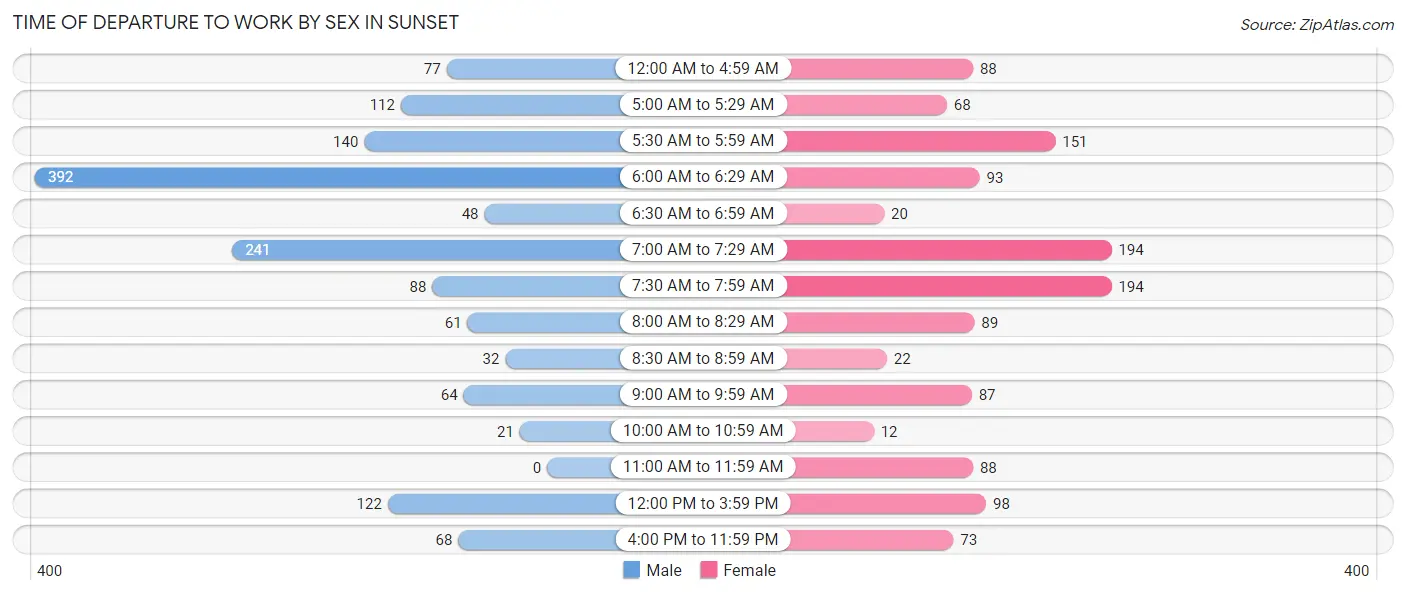
| Time of Departure | Male | Female |
| 12:00 AM to 4:59 AM | 77 (5.2%) | 88 (6.9%) |
| 5:00 AM to 5:29 AM | 112 (7.6%) | 68 (5.3%) |
| 5:30 AM to 5:59 AM | 140 (9.6%) | 151 (11.8%) |
| 6:00 AM to 6:29 AM | 392 (26.7%) | 93 (7.3%) |
| 6:30 AM to 6:59 AM | 48 (3.3%) | 20 (1.6%) |
| 7:00 AM to 7:29 AM | 241 (16.4%) | 194 (15.2%) |
| 7:30 AM to 7:59 AM | 88 (6.0%) | 194 (15.2%) |
| 8:00 AM to 8:29 AM | 61 (4.2%) | 89 (7.0%) |
| 8:30 AM to 8:59 AM | 32 (2.2%) | 22 (1.7%) |
| 9:00 AM to 9:59 AM | 64 (4.4%) | 87 (6.8%) |
| 10:00 AM to 10:59 AM | 21 (1.4%) | 12 (0.9%) |
| 11:00 AM to 11:59 AM | 0 (0.0%) | 88 (6.9%) |
| 12:00 PM to 3:59 PM | 122 (8.3%) | 98 (7.7%) |
| 4:00 PM to 11:59 PM | 68 (4.6%) | 73 (5.7%) |
| Total | 1,466 (100.0%) | 1,277 (100.0%) |
Housing Occupancy in Sunset
Occupancy by Ownership in Sunset
Of the total 1,667 dwellings in Sunset, owner-occupied units account for 1,157 (69.4%), while renter-occupied units make up 510 (30.6%).
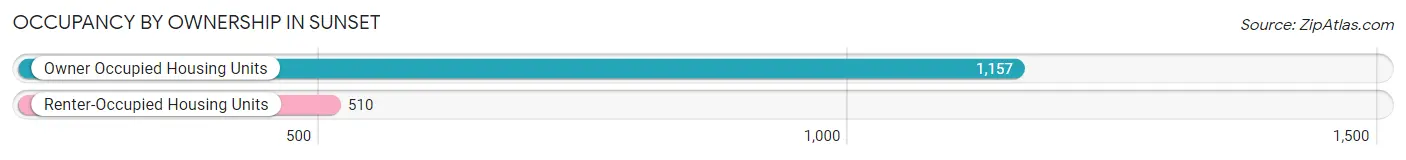
| Occupancy | # Housing Units | % Housing Units |
| Owner Occupied Housing Units | 1,157 | 69.4% |
| Renter-Occupied Housing Units | 510 | 30.6% |
| Total Occupied Housing Units | 1,667 | 100.0% |
Occupancy by Household Size in Sunset
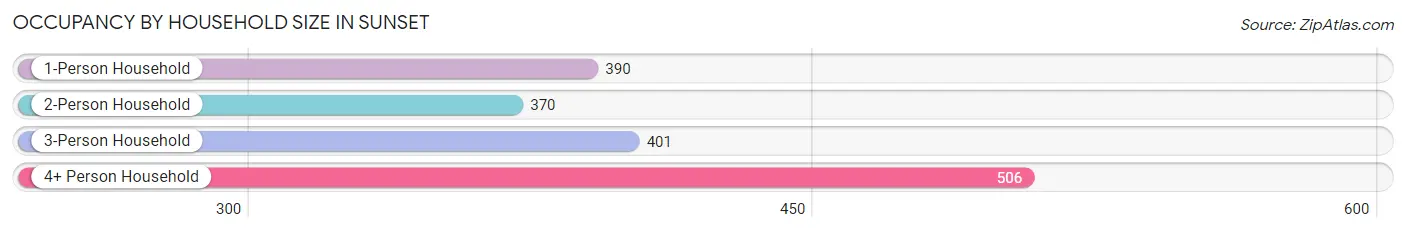
| Household Size | # Housing Units | % Housing Units |
| 1-Person Household | 390 | 23.4% |
| 2-Person Household | 370 | 22.2% |
| 3-Person Household | 401 | 24.1% |
| 4+ Person Household | 506 | 30.3% |
| Total Housing Units | 1,667 | 100.0% |
Occupancy by Ownership by Household Size in Sunset
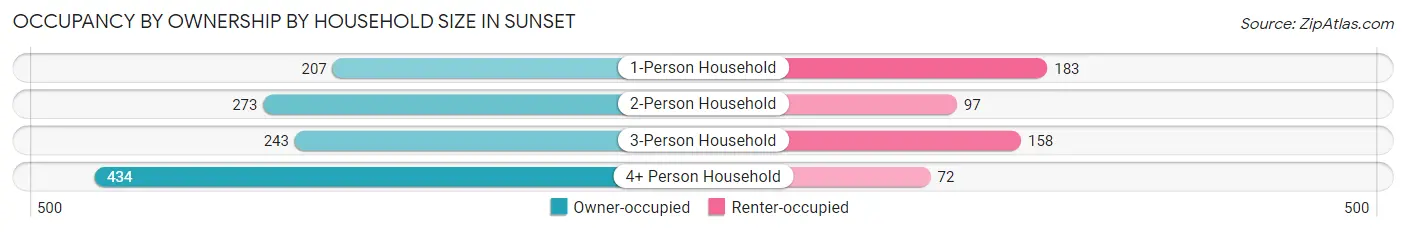
| Household Size | Owner-occupied | Renter-occupied |
| 1-Person Household | 207 (53.1%) | 183 (46.9%) |
| 2-Person Household | 273 (73.8%) | 97 (26.2%) |
| 3-Person Household | 243 (60.6%) | 158 (39.4%) |
| 4+ Person Household | 434 (85.8%) | 72 (14.2%) |
| Total Housing Units | 1,157 (69.4%) | 510 (30.6%) |
Occupancy by Educational Attainment in Sunset
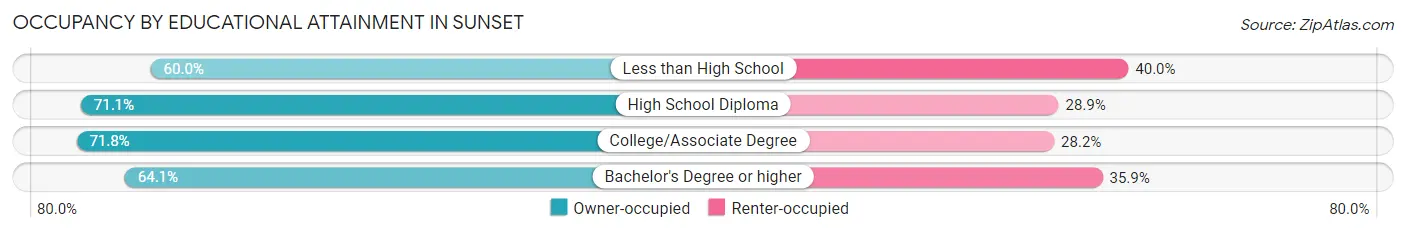
| Household Size | Owner-occupied | Renter-occupied |
| Less than High School | 78 (60.0%) | 52 (40.0%) |
| High School Diploma | 430 (71.1%) | 175 (28.9%) |
| College/Associate Degree | 483 (71.8%) | 190 (28.2%) |
| Bachelor's Degree or higher | 166 (64.1%) | 93 (35.9%) |
Occupancy by Age of Householder in Sunset

| Age Bracket | # Households | % Households |
| Under 35 Years | 557 | 33.4% |
| 35 to 44 Years | 235 | 14.1% |
| 45 to 54 Years | 244 | 14.6% |
| 55 to 64 Years | 297 | 17.8% |
| 65 to 74 Years | 170 | 10.2% |
| 75 to 84 Years | 152 | 9.1% |
| 85 Years and Over | 12 | 0.7% |
| Total | 1,667 | 100.0% |
Housing Finances in Sunset
Median Income by Occupancy in Sunset
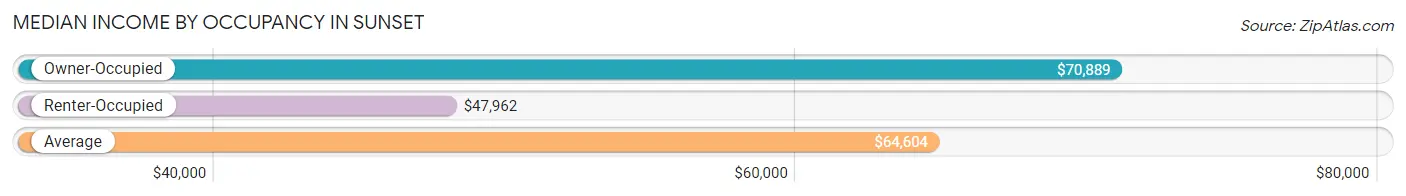
| Occupancy Type | # Households | Median Income |
| Owner-Occupied | 1,157 (69.4%) | $70,889 |
| Renter-Occupied | 510 (30.6%) | $47,962 |
| Average | 1,667 (100.0%) | $64,604 |
Occupancy by Householder Income Bracket in Sunset
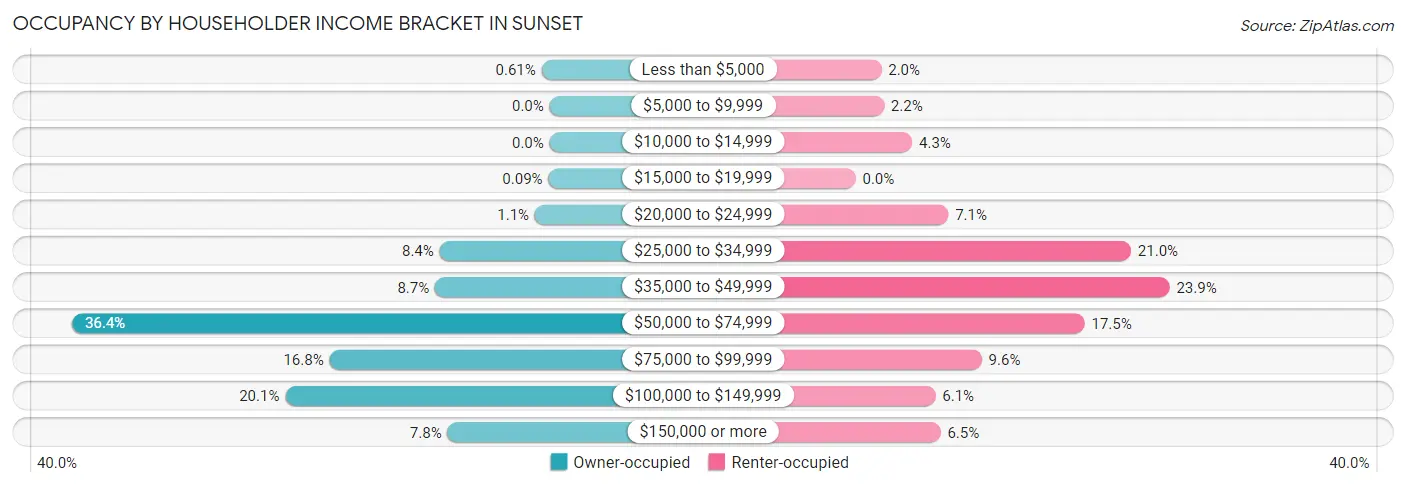
| Income Bracket | Owner-occupied | Renter-occupied |
| Less than $5,000 | 7 (0.6%) | 10 (2.0%) |
| $5,000 to $9,999 | 0 (0.0%) | 11 (2.2%) |
| $10,000 to $14,999 | 0 (0.0%) | 22 (4.3%) |
| $15,000 to $19,999 | 1 (0.1%) | 0 (0.0%) |
| $20,000 to $24,999 | 13 (1.1%) | 36 (7.1%) |
| $25,000 to $34,999 | 97 (8.4%) | 107 (21.0%) |
| $35,000 to $49,999 | 101 (8.7%) | 122 (23.9%) |
| $50,000 to $74,999 | 421 (36.4%) | 89 (17.4%) |
| $75,000 to $99,999 | 194 (16.8%) | 49 (9.6%) |
| $100,000 to $149,999 | 233 (20.1%) | 31 (6.1%) |
| $150,000 or more | 90 (7.8%) | 33 (6.5%) |
| Total | 1,157 (100.0%) | 510 (100.0%) |
Monthly Housing Cost Tiers in Sunset
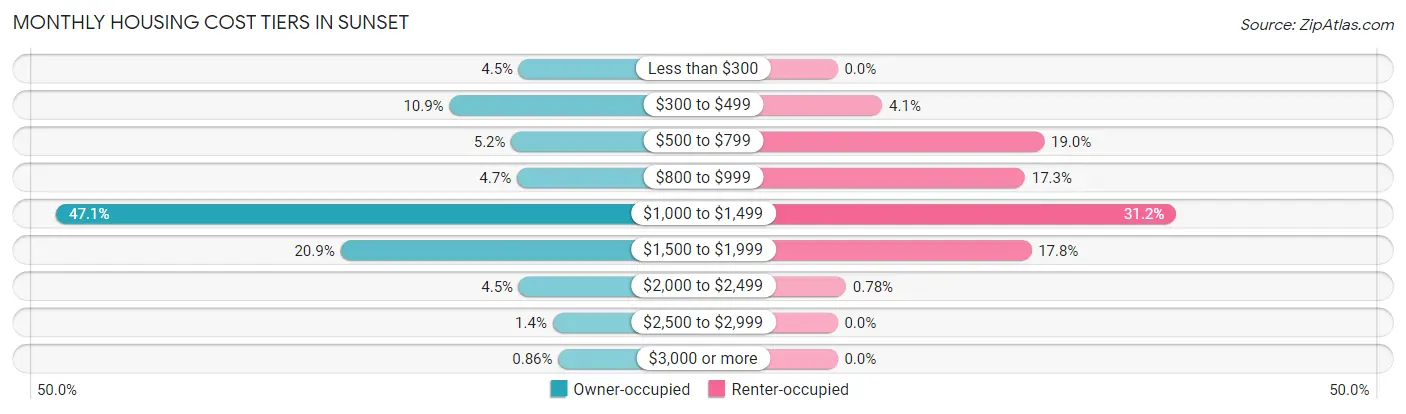
| Monthly Cost | Owner-occupied | Renter-occupied |
| Less than $300 | 52 (4.5%) | 0 (0.0%) |
| $300 to $499 | 126 (10.9%) | 21 (4.1%) |
| $500 to $799 | 60 (5.2%) | 97 (19.0%) |
| $800 to $999 | 54 (4.7%) | 88 (17.2%) |
| $1,000 to $1,499 | 545 (47.1%) | 159 (31.2%) |
| $1,500 to $1,999 | 242 (20.9%) | 91 (17.8%) |
| $2,000 to $2,499 | 52 (4.5%) | 4 (0.8%) |
| $2,500 to $2,999 | 16 (1.4%) | 0 (0.0%) |
| $3,000 or more | 10 (0.9%) | 0 (0.0%) |
| Total | 1,157 (100.0%) | 510 (100.0%) |
Physical Housing Characteristics in Sunset
Housing Structures in Sunset
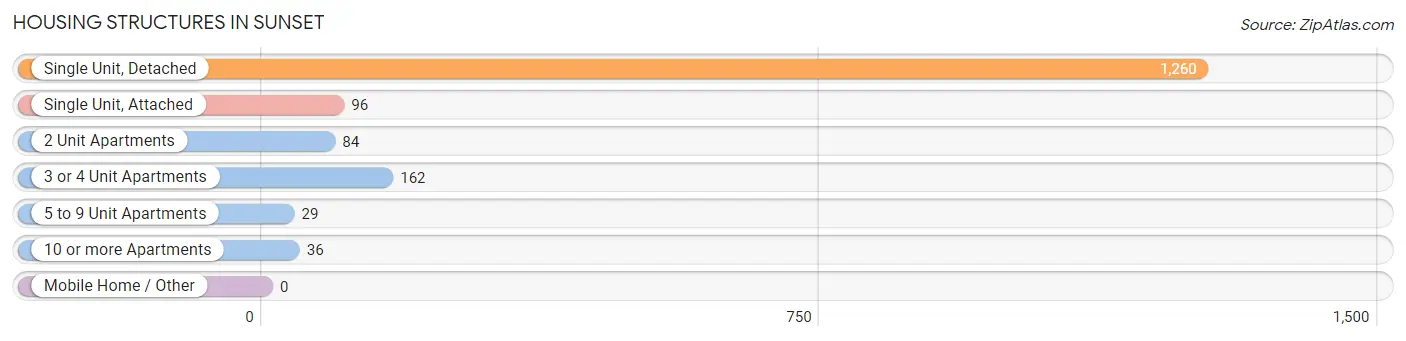
| Structure Type | # Housing Units | % Housing Units |
| Single Unit, Detached | 1,260 | 75.6% |
| Single Unit, Attached | 96 | 5.8% |
| 2 Unit Apartments | 84 | 5.0% |
| 3 or 4 Unit Apartments | 162 | 9.7% |
| 5 to 9 Unit Apartments | 29 | 1.7% |
| 10 or more Apartments | 36 | 2.2% |
| Mobile Home / Other | 0 | 0.0% |
| Total | 1,667 | 100.0% |
Housing Structures by Occupancy in Sunset
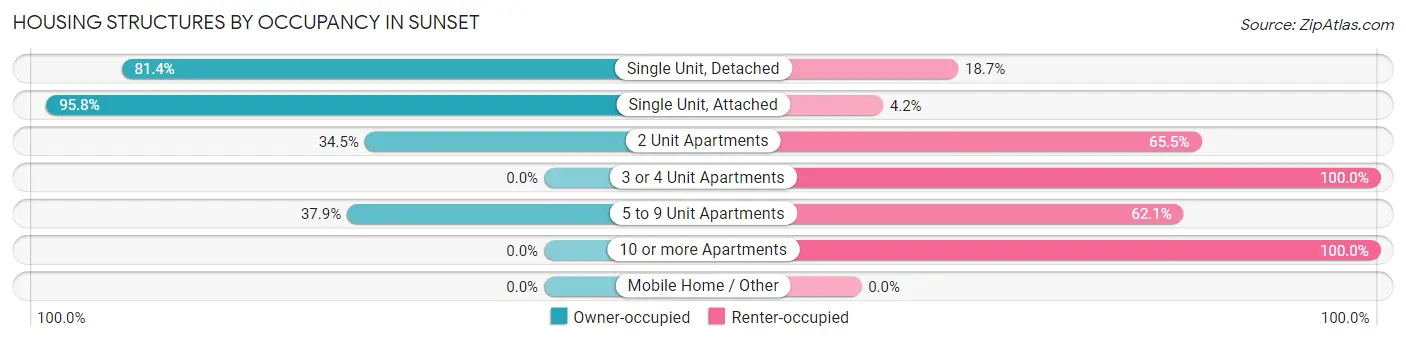
| Structure Type | Owner-occupied | Renter-occupied |
| Single Unit, Detached | 1,025 (81.4%) | 235 (18.6%) |
| Single Unit, Attached | 92 (95.8%) | 4 (4.2%) |
| 2 Unit Apartments | 29 (34.5%) | 55 (65.5%) |
| 3 or 4 Unit Apartments | 0 (0.0%) | 162 (100.0%) |
| 5 to 9 Unit Apartments | 11 (37.9%) | 18 (62.1%) |
| 10 or more Apartments | 0 (0.0%) | 36 (100.0%) |
| Mobile Home / Other | 0 (0.0%) | 0 (0.0%) |
| Total | 1,157 (69.4%) | 510 (30.6%) |
Housing Structures by Number of Rooms in Sunset
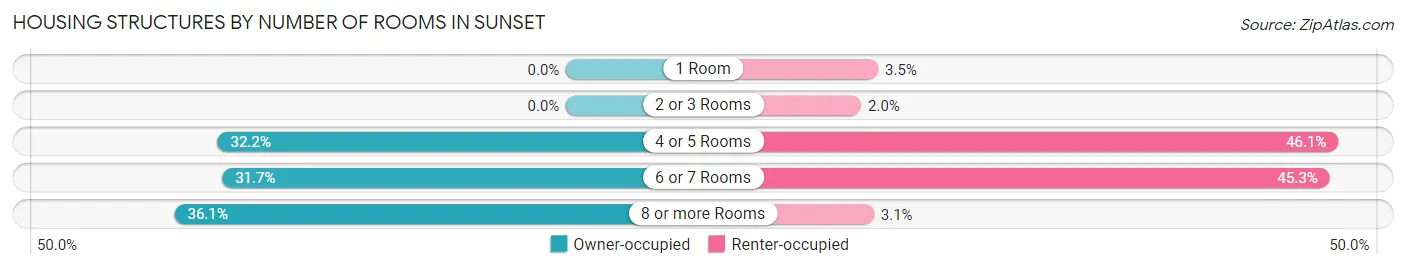
| Number of Rooms | Owner-occupied | Renter-occupied |
| 1 Room | 0 (0.0%) | 18 (3.5%) |
| 2 or 3 Rooms | 0 (0.0%) | 10 (2.0%) |
| 4 or 5 Rooms | 372 (32.2%) | 235 (46.1%) |
| 6 or 7 Rooms | 367 (31.7%) | 231 (45.3%) |
| 8 or more Rooms | 418 (36.1%) | 16 (3.1%) |
| Total | 1,157 (100.0%) | 510 (100.0%) |
Housing Structure by Heating Type in Sunset
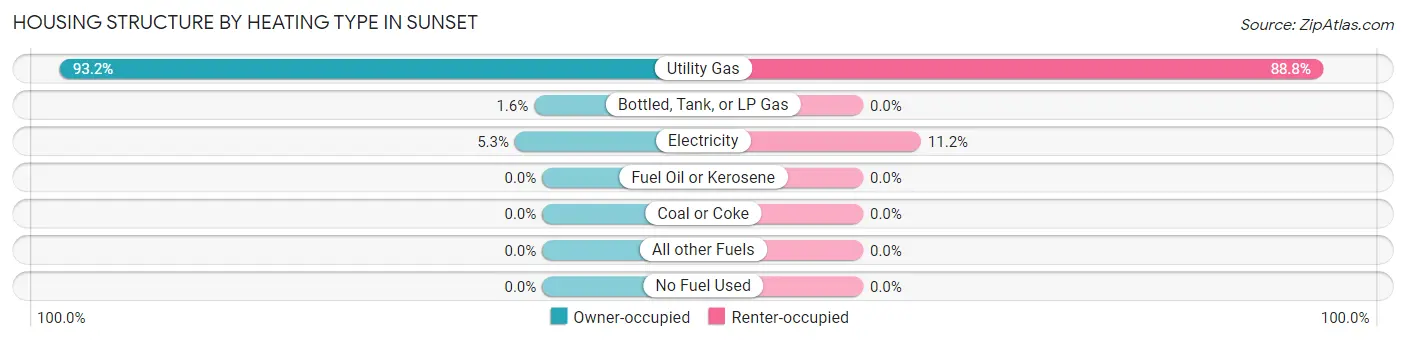
| Heating Type | Owner-occupied | Renter-occupied |
| Utility Gas | 1,078 (93.2%) | 453 (88.8%) |
| Bottled, Tank, or LP Gas | 18 (1.6%) | 0 (0.0%) |
| Electricity | 61 (5.3%) | 57 (11.2%) |
| Fuel Oil or Kerosene | 0 (0.0%) | 0 (0.0%) |
| Coal or Coke | 0 (0.0%) | 0 (0.0%) |
| All other Fuels | 0 (0.0%) | 0 (0.0%) |
| No Fuel Used | 0 (0.0%) | 0 (0.0%) |
| Total | 1,157 (100.0%) | 510 (100.0%) |
Household Vehicle Usage in Sunset
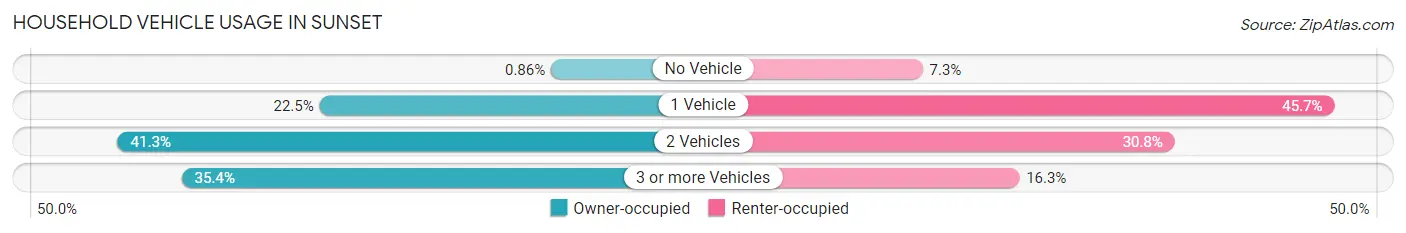
| Vehicles per Household | Owner-occupied | Renter-occupied |
| No Vehicle | 10 (0.9%) | 37 (7.2%) |
| 1 Vehicle | 260 (22.5%) | 233 (45.7%) |
| 2 Vehicles | 478 (41.3%) | 157 (30.8%) |
| 3 or more Vehicles | 409 (35.3%) | 83 (16.3%) |
| Total | 1,157 (100.0%) | 510 (100.0%) |
Real Estate & Mortgages in Sunset
Real Estate and Mortgage Overview in Sunset
| Characteristic | Without Mortgage | With Mortgage |
| Housing Units | 241 | 916 |
| Median Property Value | $220,100 | $263,300 |
| Median Household Income | $70,189 | $83 |
| Monthly Housing Costs | $382 | $10 |
| Real Estate Taxes | $1,623 | $19 |
Property Value by Mortgage Status in Sunset
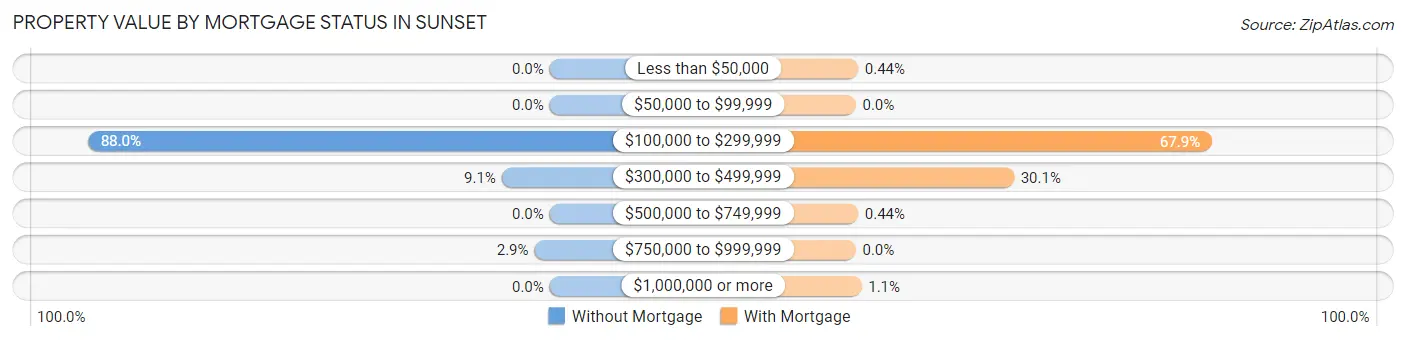
| Property Value | Without Mortgage | With Mortgage |
| Less than $50,000 | 0 (0.0%) | 4 (0.4%) |
| $50,000 to $99,999 | 0 (0.0%) | 0 (0.0%) |
| $100,000 to $299,999 | 212 (88.0%) | 622 (67.9%) |
| $300,000 to $499,999 | 22 (9.1%) | 276 (30.1%) |
| $500,000 to $749,999 | 0 (0.0%) | 4 (0.4%) |
| $750,000 to $999,999 | 7 (2.9%) | 0 (0.0%) |
| $1,000,000 or more | 0 (0.0%) | 10 (1.1%) |
| Total | 241 (100.0%) | 916 (100.0%) |
Household Income by Mortgage Status in Sunset
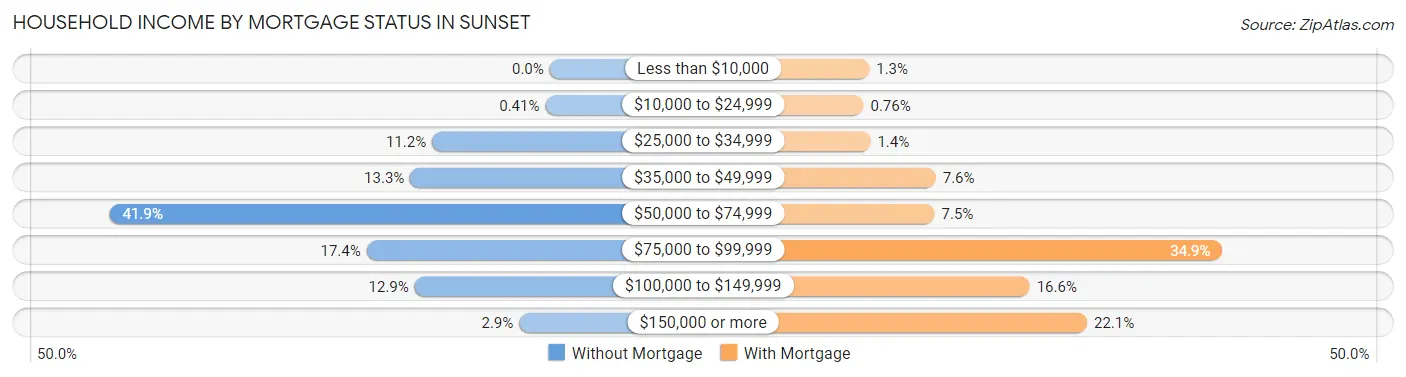
| Household Income | Without Mortgage | With Mortgage |
| Less than $10,000 | 0 (0.0%) | 12 (1.3%) |
| $10,000 to $24,999 | 1 (0.4%) | 7 (0.8%) |
| $25,000 to $34,999 | 27 (11.2%) | 13 (1.4%) |
| $35,000 to $49,999 | 32 (13.3%) | 70 (7.6%) |
| $50,000 to $74,999 | 101 (41.9%) | 69 (7.5%) |
| $75,000 to $99,999 | 42 (17.4%) | 320 (34.9%) |
| $100,000 to $149,999 | 31 (12.9%) | 152 (16.6%) |
| $150,000 or more | 7 (2.9%) | 202 (22.1%) |
| Total | 241 (100.0%) | 916 (100.0%) |
Property Value to Household Income Ratio in Sunset
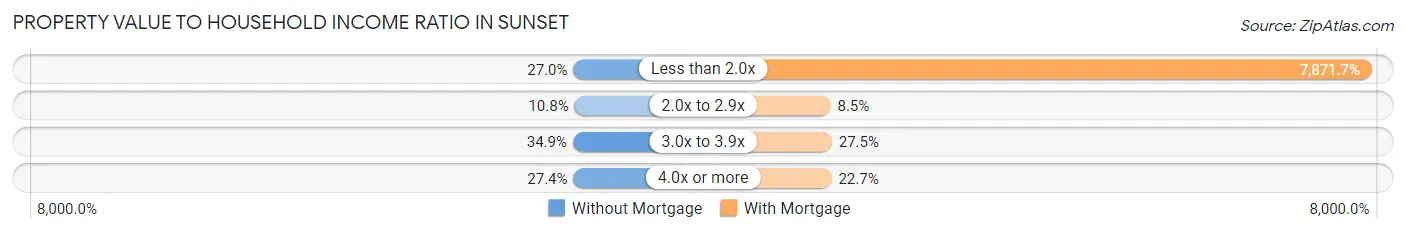
| Value-to-Income Ratio | Without Mortgage | With Mortgage |
| Less than 2.0x | 65 (27.0%) | 72,105 (7,871.7%) |
| 2.0x to 2.9x | 26 (10.8%) | 78 (8.5%) |
| 3.0x to 3.9x | 84 (34.8%) | 252 (27.5%) |
| 4.0x or more | 66 (27.4%) | 208 (22.7%) |
| Total | 241 (100.0%) | 916 (100.0%) |
Real Estate Taxes by Mortgage Status in Sunset
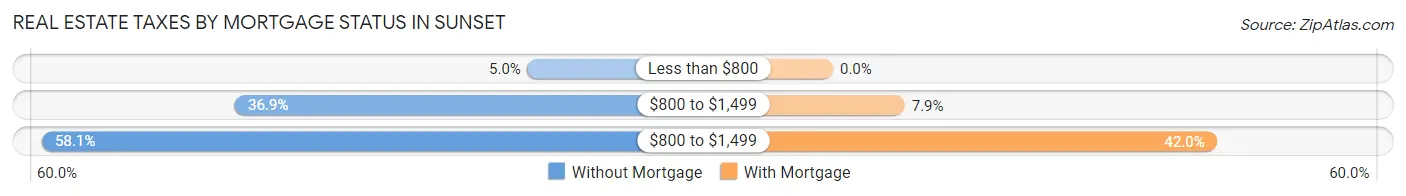
| Property Taxes | Without Mortgage | With Mortgage |
| Less than $800 | 12 (5.0%) | 0 (0.0%) |
| $800 to $1,499 | 89 (36.9%) | 72 (7.9%) |
| $800 to $1,499 | 140 (58.1%) | 385 (42.0%) |
| Total | 241 (100.0%) | 916 (100.0%) |
Health & Disability in Sunset
Health Insurance Coverage by Age in Sunset
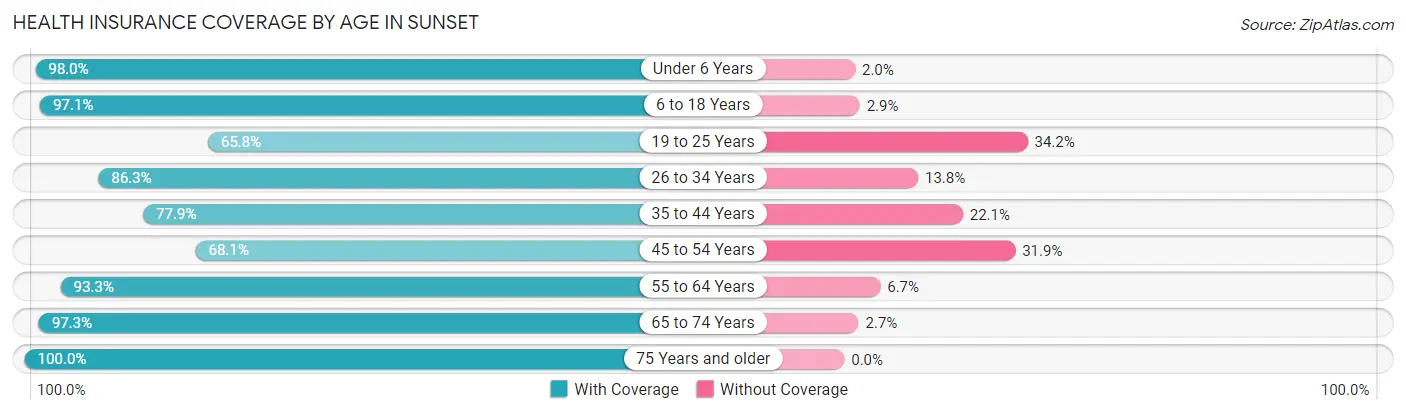
| Age Bracket | With Coverage | Without Coverage |
| Under 6 Years | 491 (98.0%) | 10 (2.0%) |
| 6 to 18 Years | 1,010 (97.1%) | 30 (2.9%) |
| 19 to 25 Years | 497 (65.8%) | 258 (34.2%) |
| 26 to 34 Years | 853 (86.3%) | 136 (13.8%) |
| 35 to 44 Years | 395 (77.9%) | 112 (22.1%) |
| 45 to 54 Years | 406 (68.1%) | 190 (31.9%) |
| 55 to 64 Years | 417 (93.3%) | 30 (6.7%) |
| 65 to 74 Years | 329 (97.3%) | 9 (2.7%) |
| 75 Years and older | 212 (100.0%) | 0 (0.0%) |
| Total | 4,610 (85.6%) | 775 (14.4%) |
Health Insurance Coverage by Citizenship Status in Sunset
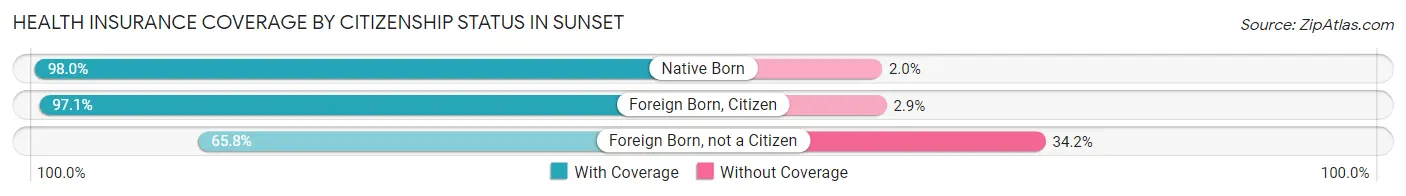
| Citizenship Status | With Coverage | Without Coverage |
| Native Born | 491 (98.0%) | 10 (2.0%) |
| Foreign Born, Citizen | 1,010 (97.1%) | 30 (2.9%) |
| Foreign Born, not a Citizen | 497 (65.8%) | 258 (34.2%) |
Health Insurance Coverage by Household Income in Sunset
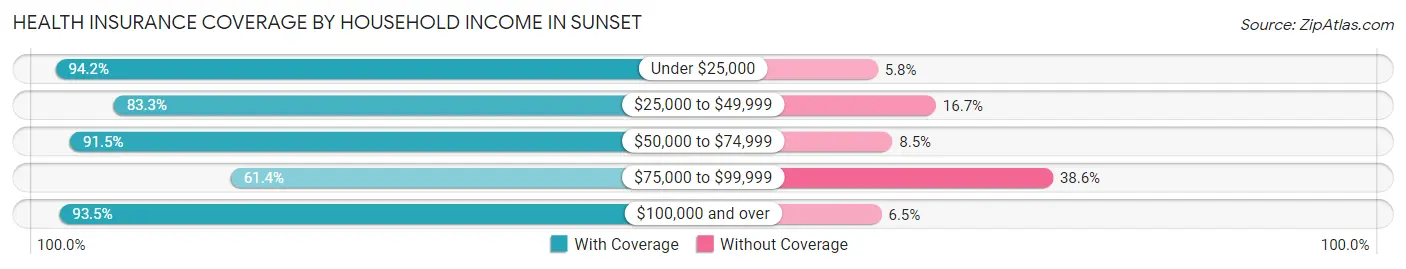
| Household Income | With Coverage | Without Coverage |
| Under $25,000 | 162 (94.2%) | 10 (5.8%) |
| $25,000 to $49,999 | 818 (83.3%) | 164 (16.7%) |
| $50,000 to $74,999 | 1,445 (91.5%) | 135 (8.5%) |
| $75,000 to $99,999 | 561 (61.4%) | 353 (38.6%) |
| $100,000 and over | 1,624 (93.5%) | 113 (6.5%) |
Public vs Private Health Insurance Coverage by Age in Sunset
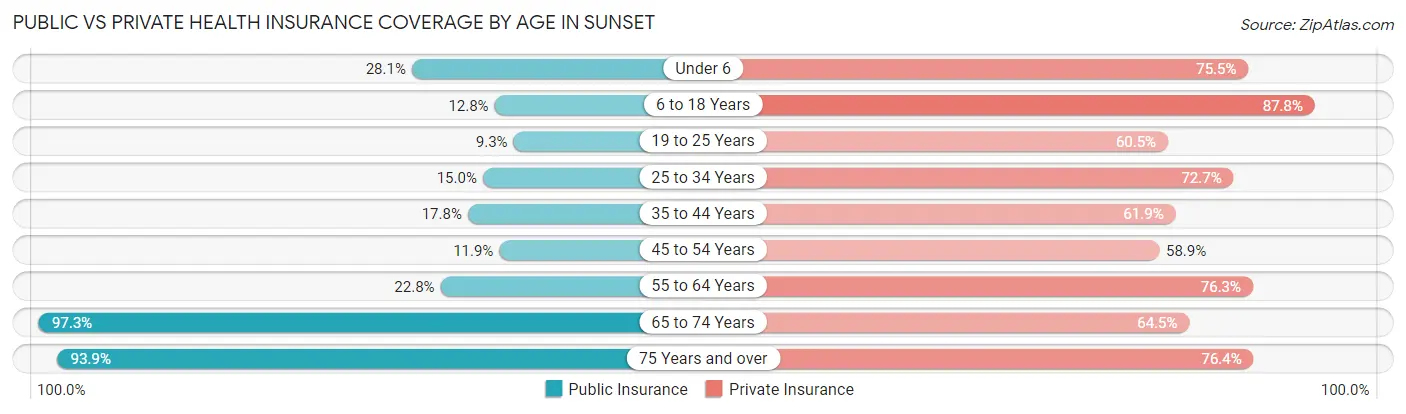
| Age Bracket | Public Insurance | Private Insurance |
| Under 6 | 141 (28.1%) | 378 (75.4%) |
| 6 to 18 Years | 133 (12.8%) | 913 (87.8%) |
| 19 to 25 Years | 70 (9.3%) | 457 (60.5%) |
| 25 to 34 Years | 148 (15.0%) | 719 (72.7%) |
| 35 to 44 Years | 90 (17.7%) | 314 (61.9%) |
| 45 to 54 Years | 71 (11.9%) | 351 (58.9%) |
| 55 to 64 Years | 102 (22.8%) | 341 (76.3%) |
| 65 to 74 Years | 329 (97.3%) | 218 (64.5%) |
| 75 Years and over | 199 (93.9%) | 162 (76.4%) |
| Total | 1,283 (23.8%) | 3,853 (71.6%) |
Disability Status by Sex by Age in Sunset
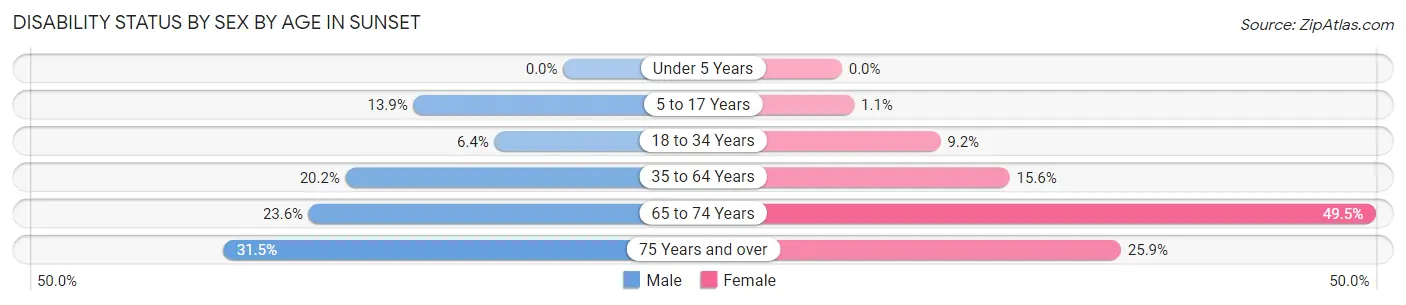
| Age Bracket | Male | Female |
| Under 5 Years | 0 (0.0%) | 0 (0.0%) |
| 5 to 17 Years | 51 (13.9%) | 7 (1.1%) |
| 18 to 34 Years | 62 (6.4%) | 81 (9.1%) |
| 35 to 64 Years | 138 (20.2%) | 135 (15.6%) |
| 65 to 74 Years | 34 (23.6%) | 96 (49.5%) |
| 75 Years and over | 23 (31.5%) | 36 (25.9%) |
Disability Class by Sex by Age in Sunset
Disability Class: Hearing Difficulty
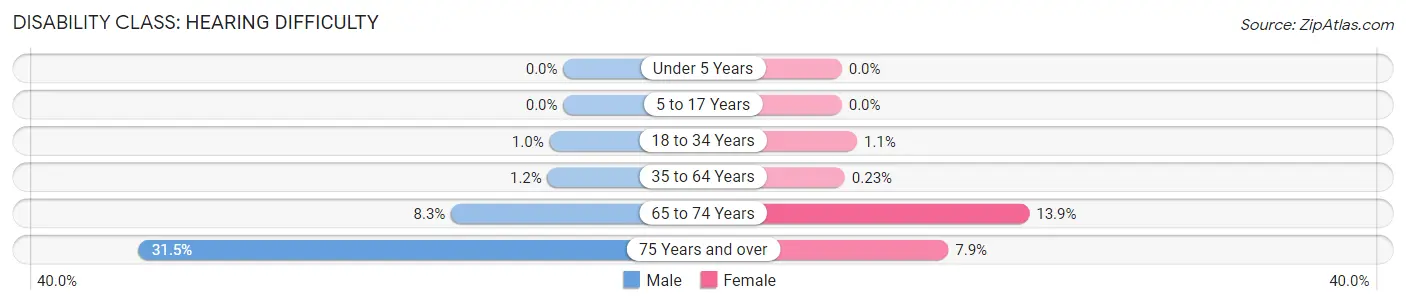
| Age Bracket | Male | Female |
| Under 5 Years | 0 (0.0%) | 0 (0.0%) |
| 5 to 17 Years | 0 (0.0%) | 0 (0.0%) |
| 18 to 34 Years | 10 (1.0%) | 10 (1.1%) |
| 35 to 64 Years | 8 (1.2%) | 2 (0.2%) |
| 65 to 74 Years | 12 (8.3%) | 27 (13.9%) |
| 75 Years and over | 23 (31.5%) | 11 (7.9%) |
Disability Class: Vision Difficulty
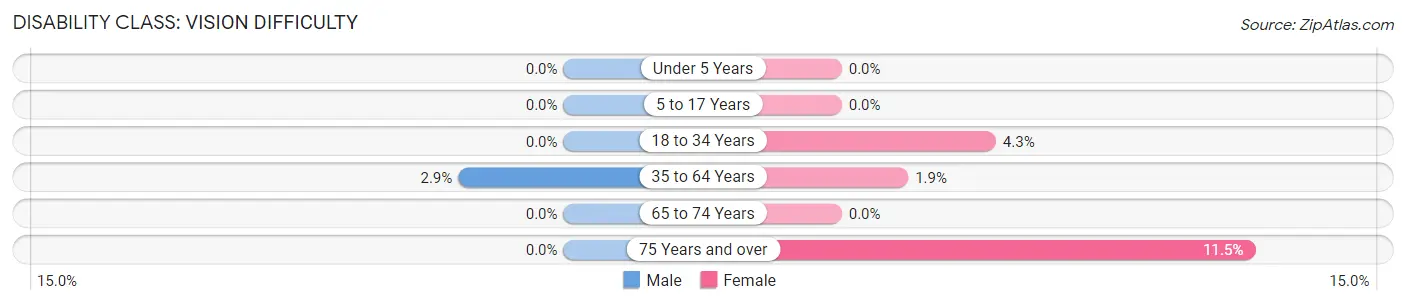
| Age Bracket | Male | Female |
| Under 5 Years | 0 (0.0%) | 0 (0.0%) |
| 5 to 17 Years | 0 (0.0%) | 0 (0.0%) |
| 18 to 34 Years | 0 (0.0%) | 38 (4.3%) |
| 35 to 64 Years | 20 (2.9%) | 16 (1.8%) |
| 65 to 74 Years | 0 (0.0%) | 0 (0.0%) |
| 75 Years and over | 0 (0.0%) | 16 (11.5%) |
Disability Class: Cognitive Difficulty
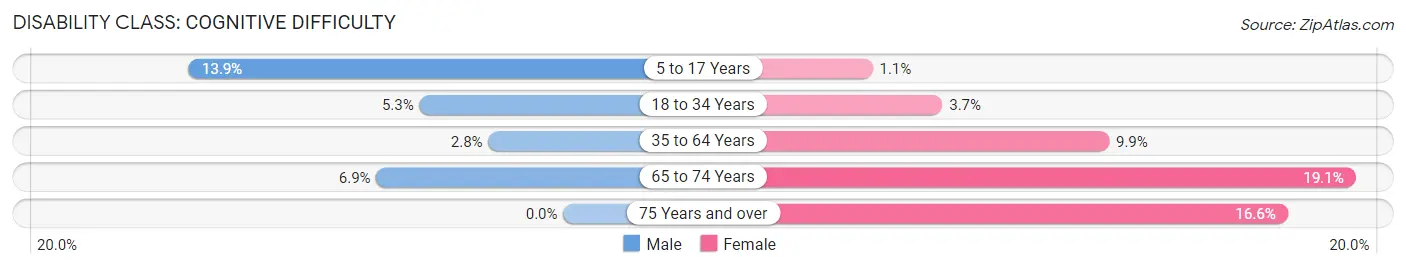
| Age Bracket | Male | Female |
| 5 to 17 Years | 51 (13.9%) | 7 (1.1%) |
| 18 to 34 Years | 52 (5.3%) | 33 (3.7%) |
| 35 to 64 Years | 19 (2.8%) | 86 (9.9%) |
| 65 to 74 Years | 10 (6.9%) | 37 (19.1%) |
| 75 Years and over | 0 (0.0%) | 23 (16.6%) |
Disability Class: Ambulatory Difficulty
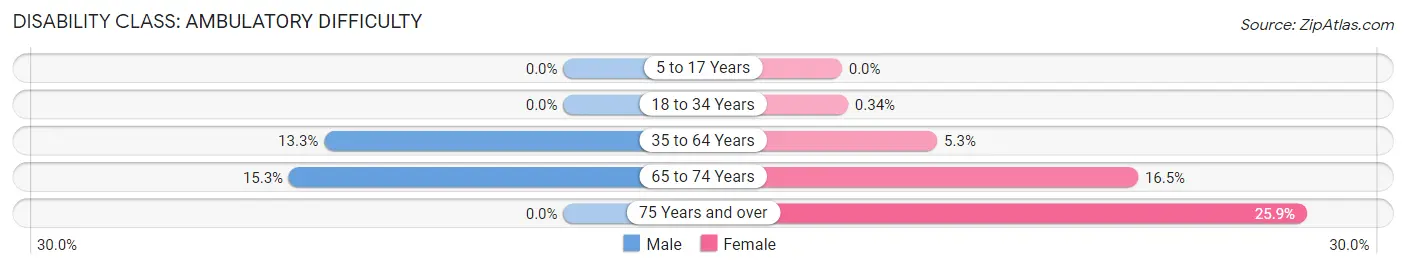
| Age Bracket | Male | Female |
| 5 to 17 Years | 0 (0.0%) | 0 (0.0%) |
| 18 to 34 Years | 0 (0.0%) | 3 (0.3%) |
| 35 to 64 Years | 91 (13.3%) | 46 (5.3%) |
| 65 to 74 Years | 22 (15.3%) | 32 (16.5%) |
| 75 Years and over | 0 (0.0%) | 36 (25.9%) |
Disability Class: Self-Care Difficulty
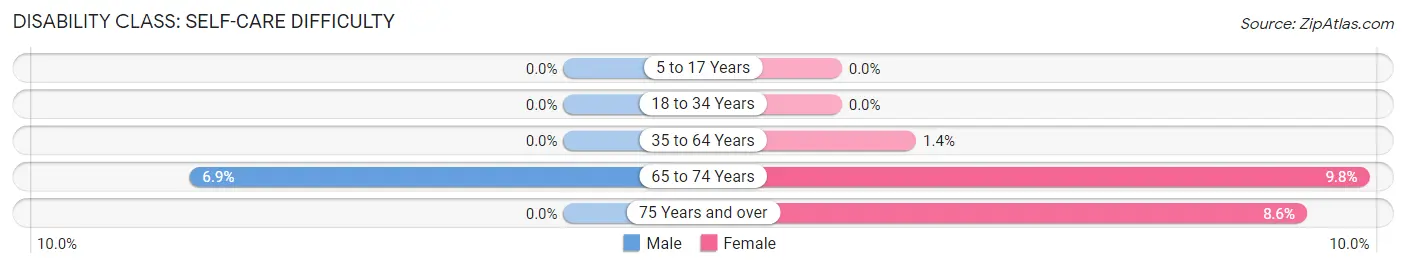
| Age Bracket | Male | Female |
| 5 to 17 Years | 0 (0.0%) | 0 (0.0%) |
| 18 to 34 Years | 0 (0.0%) | 0 (0.0%) |
| 35 to 64 Years | 0 (0.0%) | 12 (1.4%) |
| 65 to 74 Years | 10 (6.9%) | 19 (9.8%) |
| 75 Years and over | 0 (0.0%) | 12 (8.6%) |
Technology Access in Sunset
Computing Device Access in Sunset
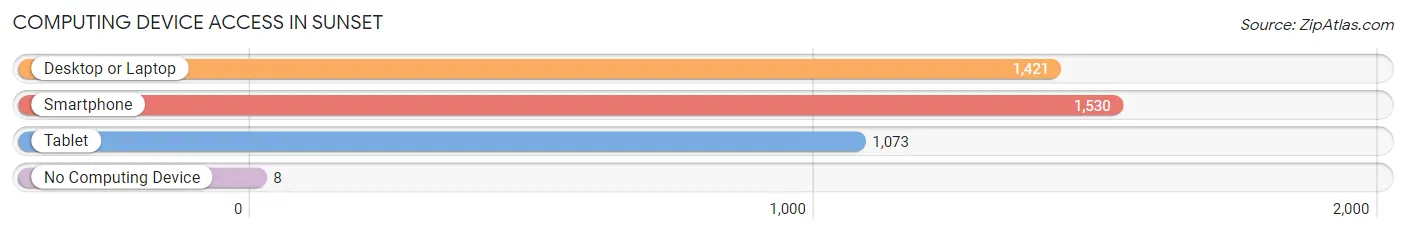
| Device Type | # Households | % Households |
| Desktop or Laptop | 1,421 | 85.2% |
| Smartphone | 1,530 | 91.8% |
| Tablet | 1,073 | 64.4% |
| No Computing Device | 8 | 0.5% |
| Total | 1,667 | 100.0% |
Internet Access in Sunset
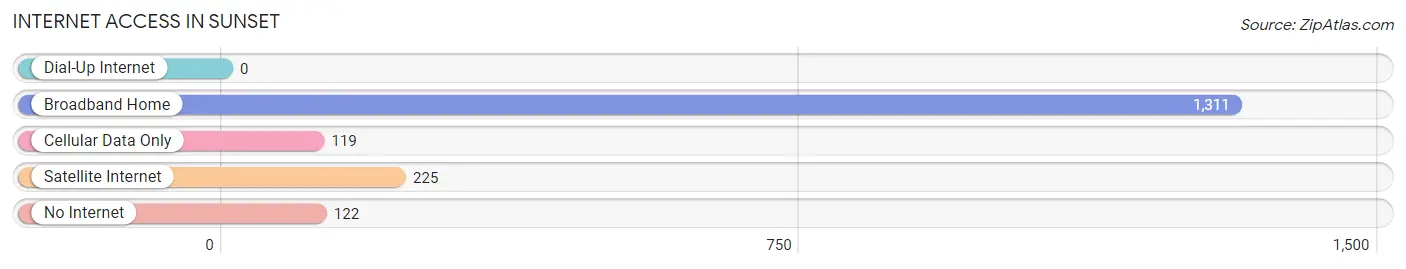
| Internet Type | # Households | % Households |
| Dial-Up Internet | 0 | 0.0% |
| Broadband Home | 1,311 | 78.6% |
| Cellular Data Only | 119 | 7.1% |
| Satellite Internet | 225 | 13.5% |
| No Internet | 122 | 7.3% |
| Total | 1,667 | 100.0% |
Sunset Summary
Sunset is a small city located in Davis County, Utah, United States. It is part of the Ogden-Clearfield Metropolitan Statistical Area. The population was 8,541 at the 2010 census.
History
Sunset was first settled in 1854 by a group of Mormon pioneers led by William H. Adams. The settlement was originally known as North Hooper, but was later renamed Sunset in 1868. The name was chosen to reflect the beautiful sunsets that could be seen from the area.
In 1877, the Utah Central Railroad was built through the area, connecting it to the rest of the state. This allowed for the growth of the city, and by 1880 the population had grown to over 500 people.
In the early 1900s, Sunset was a thriving agricultural community. The area was known for its production of sugar beets, potatoes, and other crops. The city also had a number of businesses, including a bank, a hotel, and a newspaper.
Geography
Sunset is located in northern Davis County, Utah, at the intersection of Interstate 15 and U.S. Route 89. It is about 20 miles north of Salt Lake City and about 10 miles south of Ogden.
The city has a total area of 4.2 square miles, all of which is land. The city is located in a valley surrounded by mountains, including the Wasatch Range to the east and the Oquirrh Mountains to the west.
Economy
Sunset’s economy is largely based on agriculture and manufacturing. The city is home to several large agricultural companies, including the Utah Sugar Company and the Utah Potato Company.
The city also has a number of manufacturing companies, including a plastics factory and a metal fabrication plant.
Demographics
As of the 2010 census, there were 8,541 people, 2,845 households, and 2,092 families living in the city. The population density was 2,037.3 people per square mile.
The racial makeup of the city was 91.2% White, 0.7% African American, 0.7% Native American, 0.7% Asian, 0.1% Pacific Islander, 4.7% from other races, and 2.0% from two or more races. Hispanic or Latino of any race were 8.3% of the population.
The median income for a household in the city was $50,945, and the median income for a family was $58,945. The per capita income for the city was $20,945. About 4.7% of families and 6.2% of the population were below the poverty line, including 8.2% of those under age 18 and 4.2% of those age 65 or over.
Common Questions
What is Per Capita Income in Sunset?
Per Capita income in Sunset is $25,274.
What is the Median Family Income in Sunset?
Median Family Income in Sunset is $66,042.
What is the Median Household income in Sunset?
Median Household Income in Sunset is $64,604.
What is Income or Wage Gap in Sunset?
Income or Wage Gap in Sunset is 40.5%.
Women in Sunset earn 59.5 cents for every dollar earned by a man.
What is Inequality or Gini Index in Sunset?
Inequality or Gini Index in Sunset is 0.32.
What is the Total Population of Sunset?
Total Population of Sunset is 5,443.
What is the Total Male Population of Sunset?
Total Male Population of Sunset is 2,488.
What is the Total Female Population of Sunset?
Total Female Population of Sunset is 2,955.
What is the Ratio of Males per 100 Females in Sunset?
There are 84.20 Males per 100 Females in Sunset.
What is the Ratio of Females per 100 Males in Sunset?
There are 118.77 Females per 100 Males in Sunset.
What is the Median Population Age in Sunset?
Median Population Age in Sunset is 30.1 Years.
What is the Average Family Size in Sunset
Average Family Size in Sunset is 3.7 People.
What is the Average Household Size in Sunset
Average Household Size in Sunset is 3.2 People.
How Large is the Labor Force in Sunset?
There are 3,054 People in the Labor Forcein in Sunset.
What is the Percentage of People in the Labor Force in Sunset?
74.2% of People are in the Labor Force in Sunset.
What is the Unemployment Rate in Sunset?
Unemployment Rate in Sunset is 3.1%.