Payson, UT Map & Demographics
Payson Map
Payson Overview
$28,022
PER CAPITA INCOME
$89,524
AVG FAMILY INCOME
$81,387
AVG HOUSEHOLD INCOME
45.0%
WAGE / INCOME GAP [ % ]
55.0¢/ $1
WAGE / INCOME GAP [ $ ]
$9,503
FAMILY INCOME DEFICIT
0.36
INEQUALITY / GINI INDEX
21,529
TOTAL POPULATION
11,299
MALE POPULATION
10,230
FEMALE POPULATION
110.45
MALES / 100 FEMALES
90.54
FEMALES / 100 MALES
27.8
MEDIAN AGE
3.8
AVG FAMILY SIZE
3.5
AVG HOUSEHOLD SIZE
10,963
LABOR FORCE [ PEOPLE ]
69.6%
PERCENT IN LABOR FORCE
4.9%
UNEMPLOYMENT RATE
Payson Zip Codes
Payson Area Codes
Income in Payson
Income Overview in Payson
Per Capita Income in Payson is $28,022, while median incomes of families and households are $89,524 and $81,387 respectively.
| Characteristic | Number | Measure |
| Per Capita Income | 21,529 | $28,022 |
| Median Family Income | 5,125 | $89,524 |
| Mean Family Income | 5,125 | $103,676 |
| Median Household Income | 6,150 | $81,387 |
| Mean Household Income | 6,150 | $96,820 |
| Income Deficit | 5,125 | $9,503 |
| Wage / Income Gap (%) | 21,529 | 45.01% |
| Wage / Income Gap ($) | 21,529 | 54.99¢ per $1 |
| Gini / Inequality Index | 21,529 | 0.36 |
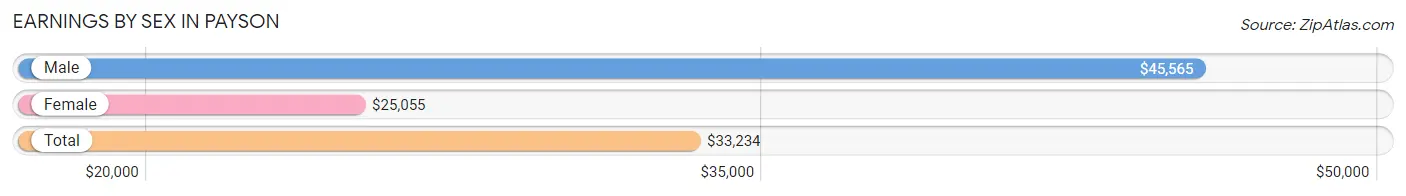
Earnings by Sex in Payson
Average Earnings in Payson are $33,234, $45,565 for men and $25,055 for women, a difference of 45.0%.
| Sex | Number | Average Earnings |
| Male | 6,451 (55.3%) | $45,565 |
| Female | 5,211 (44.7%) | $25,055 |
| Total | 11,662 (100.0%) | $33,234 |
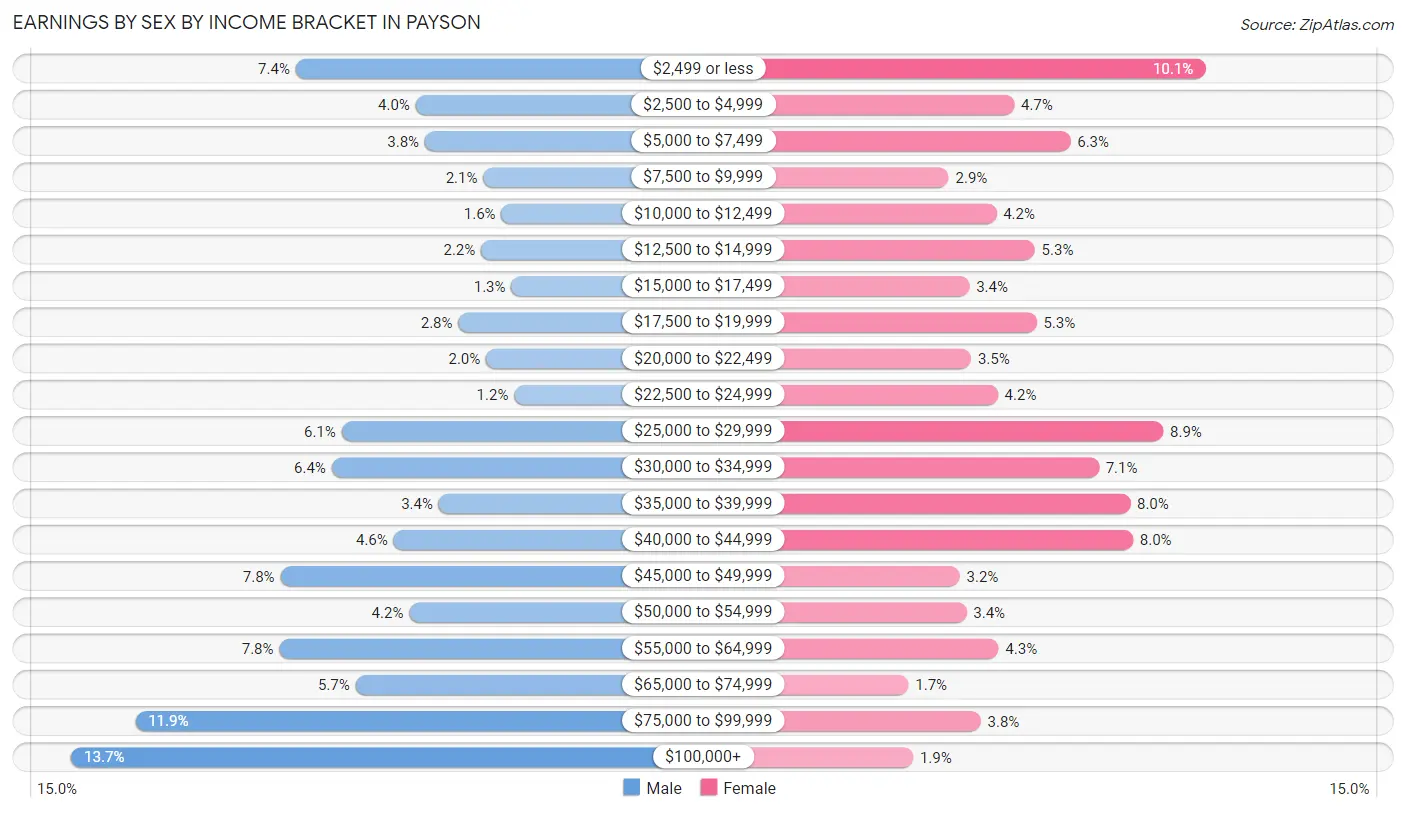
Earnings by Sex by Income Bracket in Payson
The most common earnings brackets in Payson are $100,000+ for men (883 | 13.7%) and $2,499 or less for women (525 | 10.1%).
| Income | Male | Female |
| $2,499 or less | 476 (7.4%) | 525 (10.1%) |
| $2,500 to $4,999 | 259 (4.0%) | 245 (4.7%) |
| $5,000 to $7,499 | 242 (3.7%) | 327 (6.3%) |
| $7,500 to $9,999 | 136 (2.1%) | 149 (2.9%) |
| $10,000 to $12,499 | 103 (1.6%) | 219 (4.2%) |
| $12,500 to $14,999 | 140 (2.2%) | 275 (5.3%) |
| $15,000 to $17,499 | 85 (1.3%) | 179 (3.4%) |
| $17,500 to $19,999 | 181 (2.8%) | 278 (5.3%) |
| $20,000 to $22,499 | 131 (2.0%) | 182 (3.5%) |
| $22,500 to $24,999 | 80 (1.2%) | 221 (4.2%) |
| $25,000 to $29,999 | 393 (6.1%) | 463 (8.9%) |
| $30,000 to $34,999 | 411 (6.4%) | 369 (7.1%) |
| $35,000 to $39,999 | 217 (3.4%) | 415 (8.0%) |
| $40,000 to $44,999 | 299 (4.6%) | 419 (8.0%) |
| $45,000 to $49,999 | 504 (7.8%) | 165 (3.2%) |
| $50,000 to $54,999 | 270 (4.2%) | 175 (3.4%) |
| $55,000 to $64,999 | 506 (7.8%) | 222 (4.3%) |
| $65,000 to $74,999 | 368 (5.7%) | 90 (1.7%) |
| $75,000 to $99,999 | 767 (11.9%) | 196 (3.8%) |
| $100,000+ | 883 (13.7%) | 97 (1.9%) |
| Total | 6,451 (100.0%) | 5,211 (100.0%) |
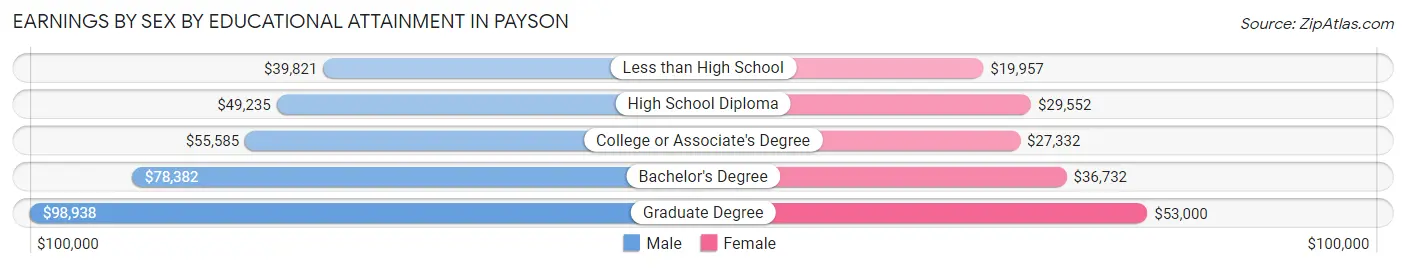
Earnings by Sex by Educational Attainment in Payson
Average earnings in Payson are $57,044 for men and $30,110 for women, a difference of 47.2%. Men with an educational attainment of graduate degree enjoy the highest average annual earnings of $98,938, while those with less than high school education earn the least with $39,821. Women with an educational attainment of graduate degree earn the most with the average annual earnings of $53,000, while those with less than high school education have the smallest earnings of $19,957.
| Educational Attainment | Male Income | Female Income |
| Less than High School | $39,821 | $19,957 |
| High School Diploma | $49,235 | $29,552 |
| College or Associate's Degree | $55,585 | $27,332 |
| Bachelor's Degree | $78,382 | $36,732 |
| Graduate Degree | $98,938 | $53,000 |
| Total | $57,044 | $30,110 |
Family Income in Payson
Family Income Brackets in Payson
According to the Payson family income data, there are 1,332 families falling into the $100,000 to $149,999 income range, which is the most common income bracket and makes up 26.0% of all families. Conversely, the less than $10,000 income bracket is the least frequent group with only 26 families (0.5%) belonging to this category.
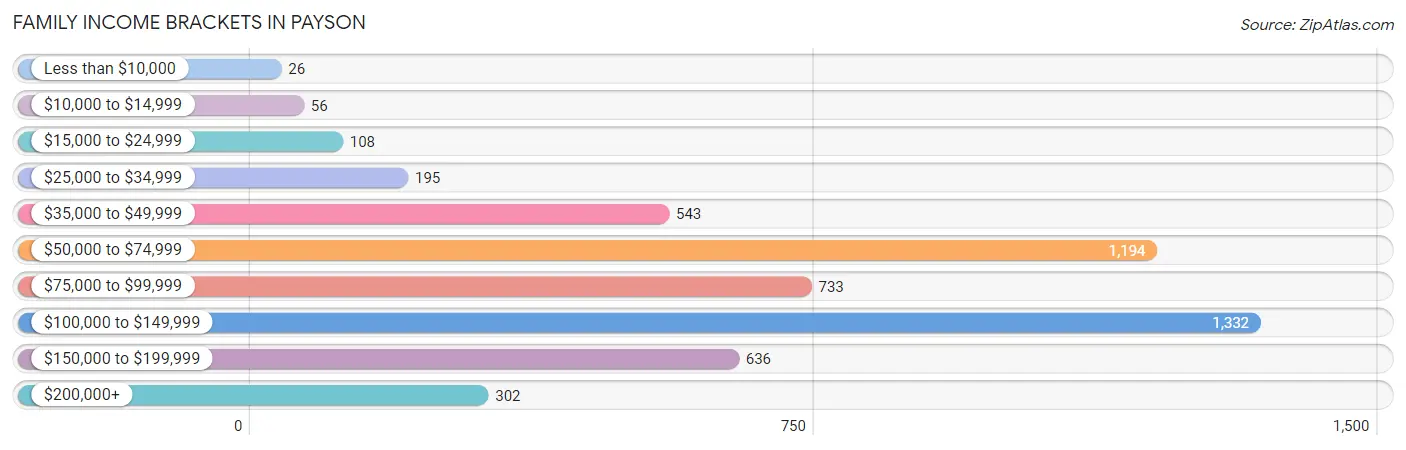
| Income Bracket | # Families | % Families |
| Less than $10,000 | 26 | 0.5% |
| $10,000 to $14,999 | 56 | 1.1% |
| $15,000 to $24,999 | 108 | 2.1% |
| $25,000 to $34,999 | 195 | 3.8% |
| $35,000 to $49,999 | 543 | 10.6% |
| $50,000 to $74,999 | 1,194 | 23.3% |
| $75,000 to $99,999 | 733 | 14.3% |
| $100,000 to $149,999 | 1,332 | 26.0% |
| $150,000 to $199,999 | 636 | 12.4% |
| $200,000+ | 302 | 5.9% |
Family Income by Famaliy Size in Payson
7+ person families (550 | 10.7%) account for the highest median family income in Payson with $142,143 per family, while 2-person families (1,968 | 38.4%) have the highest median income of $31,712 per family member.
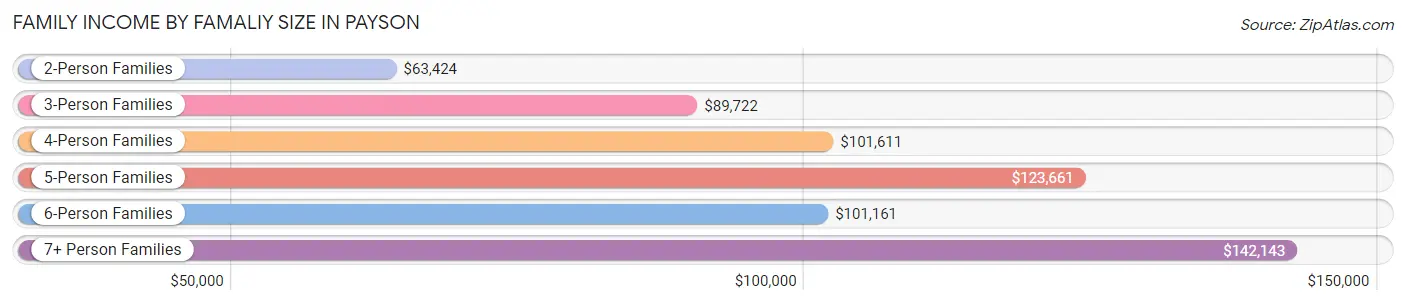
| Income Bracket | # Families | Median Income |
| 2-Person Families | 1,968 (38.4%) | $63,424 |
| 3-Person Families | 800 (15.6%) | $89,722 |
| 4-Person Families | 910 (17.8%) | $101,611 |
| 5-Person Families | 493 (9.6%) | $123,661 |
| 6-Person Families | 404 (7.9%) | $101,161 |
| 7+ Person Families | 550 (10.7%) | $142,143 |
| Total | 5,125 (100.0%) | $89,524 |
Family Income by Number of Earners in Payson
The median family income in Payson is $89,524, with families comprising 3+ earners (1,391) having the highest median family income of $141,205, while families with no earners (508) have the lowest median family income of $55,865, accounting for 27.1% and 9.9% of families, respectively.
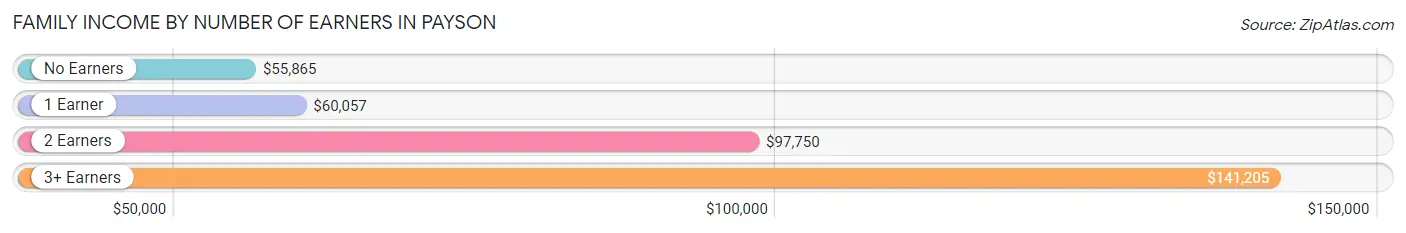
| Number of Earners | # Families | Median Income |
| No Earners | 508 (9.9%) | $55,865 |
| 1 Earner | 1,329 (25.9%) | $60,057 |
| 2 Earners | 1,897 (37.0%) | $97,750 |
| 3+ Earners | 1,391 (27.1%) | $141,205 |
| Total | 5,125 (100.0%) | $89,524 |
Household Income in Payson
Household Income Brackets in Payson
With 1,433 households falling in the category, the $100,000 to $149,999 income range is the most frequent in Payson, accounting for 23.3% of all households. In contrast, only 92 households (1.5%) fall into the less than $10,000 income bracket, making it the least populous group.
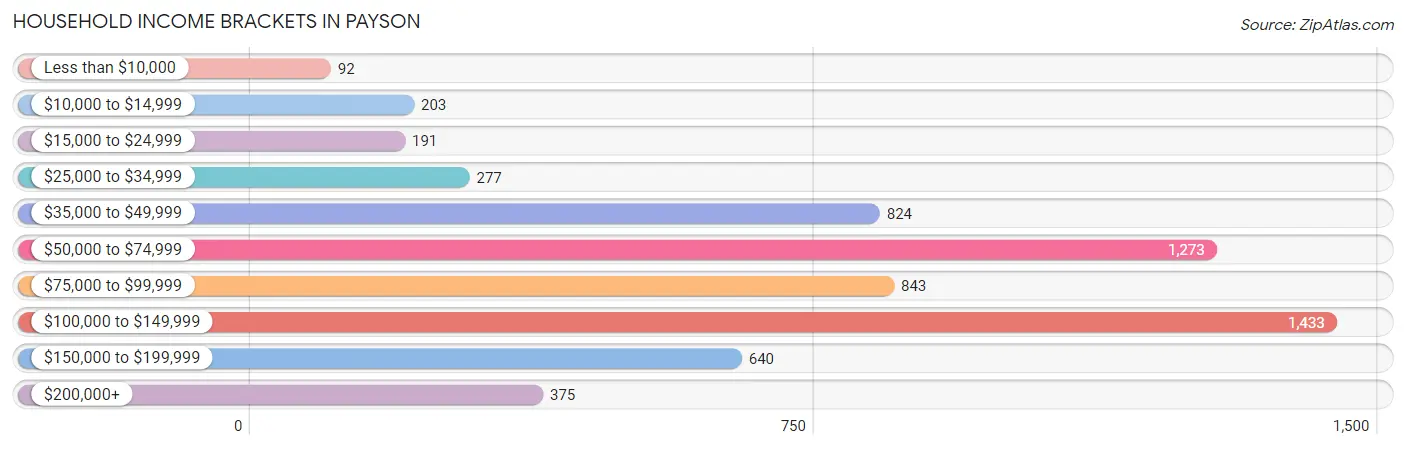
| Income Bracket | # Households | % Households |
| Less than $10,000 | 92 | 1.5% |
| $10,000 to $14,999 | 203 | 3.3% |
| $15,000 to $24,999 | 191 | 3.1% |
| $25,000 to $34,999 | 277 | 4.5% |
| $35,000 to $49,999 | 824 | 13.4% |
| $50,000 to $74,999 | 1,273 | 20.7% |
| $75,000 to $99,999 | 843 | 13.7% |
| $100,000 to $149,999 | 1,433 | 23.3% |
| $150,000 to $199,999 | 640 | 10.4% |
| $200,000+ | 375 | 6.1% |
Household Income by Householder Age in Payson
The median household income in Payson is $81,387, with the highest median household income of $105,699 found in the 45 to 64 years age bracket for the primary householder. A total of 1,903 households (30.9%) fall into this category. Meanwhile, the 65+ years age bracket for the primary householder has the lowest median household income of $58,529, with 1,438 households (23.4%) in this group.
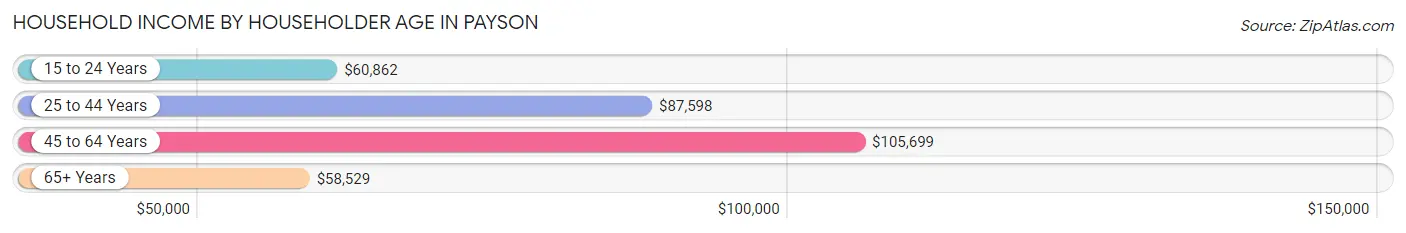
| Income Bracket | # Households | Median Income |
| 15 to 24 Years | 370 (6.0%) | $60,862 |
| 25 to 44 Years | 2,439 (39.7%) | $87,598 |
| 45 to 64 Years | 1,903 (30.9%) | $105,699 |
| 65+ Years | 1,438 (23.4%) | $58,529 |
| Total | 6,150 (100.0%) | $81,387 |
Poverty in Payson
Income Below Poverty by Sex and Age in Payson
With 4.3% poverty level for males and 7.1% for females among the residents of Payson, 55 to 64 year old males and under 5 year old females are the most vulnerable to poverty, with 66 males (8.2%) and 114 females (13.4%) in their respective age groups living below the poverty level.
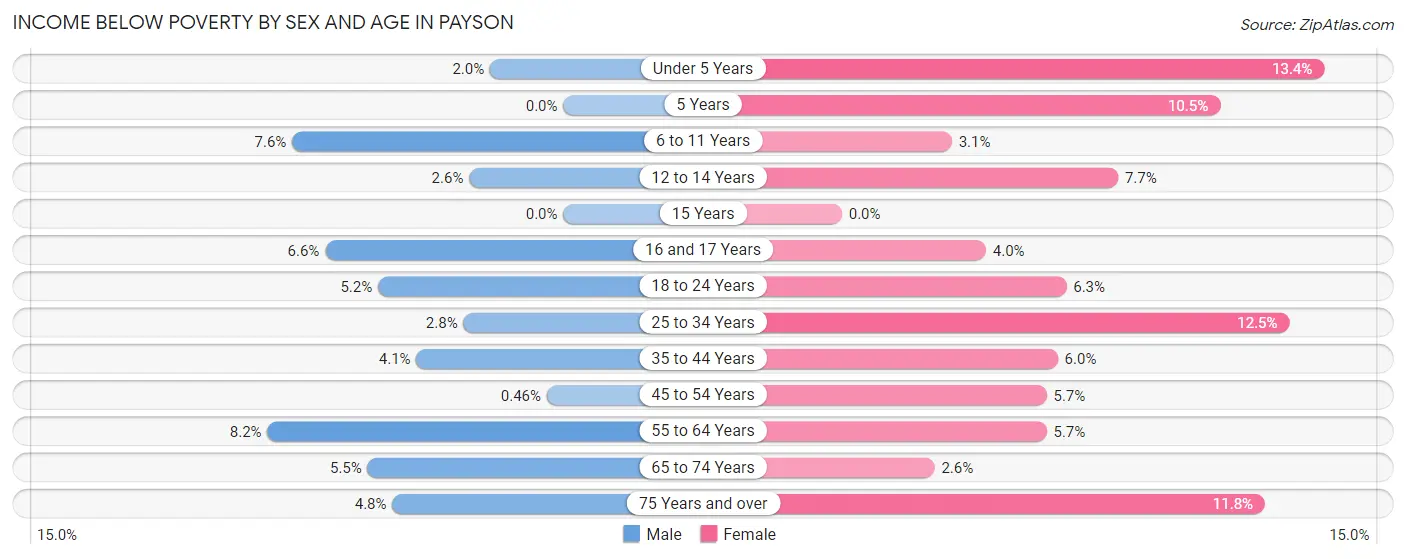
| Age Bracket | Male | Female |
| Under 5 Years | 10 (2.0%) | 114 (13.4%) |
| 5 Years | 0 (0.0%) | 22 (10.5%) |
| 6 to 11 Years | 92 (7.5%) | 27 (3.1%) |
| 12 to 14 Years | 25 (2.6%) | 37 (7.7%) |
| 15 Years | 0 (0.0%) | 0 (0.0%) |
| 16 and 17 Years | 32 (6.6%) | 20 (4.0%) |
| 18 to 24 Years | 91 (5.2%) | 85 (6.2%) |
| 25 to 34 Years | 40 (2.8%) | 161 (12.5%) |
| 35 to 44 Years | 63 (4.1%) | 80 (6.0%) |
| 45 to 54 Years | 4 (0.5%) | 70 (5.7%) |
| 55 to 64 Years | 66 (8.2%) | 38 (5.7%) |
| 65 to 74 Years | 37 (5.4%) | 23 (2.6%) |
| 75 Years and over | 22 (4.8%) | 43 (11.8%) |
| Total | 482 (4.3%) | 720 (7.1%) |
Income Above Poverty by Sex and Age in Payson
According to the poverty statistics in Payson, males aged 5 years and females aged 15 years are the age groups that are most secure financially, with 100.0% of males and 100.0% of females in these age groups living above the poverty line.
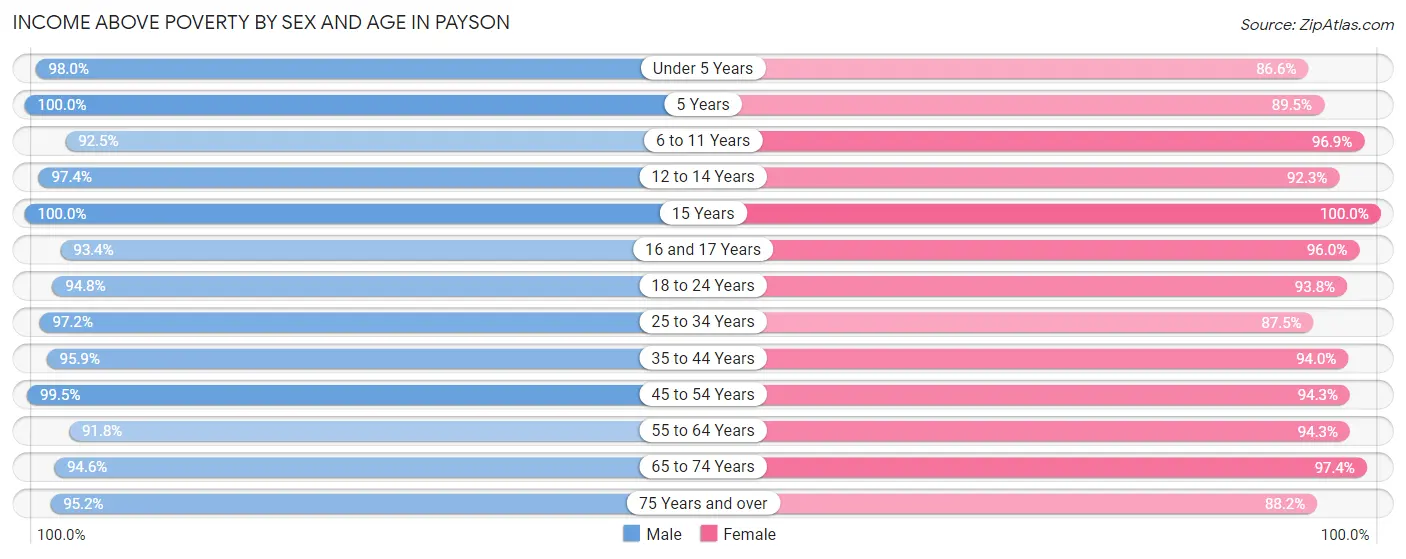
| Age Bracket | Male | Female |
| Under 5 Years | 479 (98.0%) | 735 (86.6%) |
| 5 Years | 146 (100.0%) | 187 (89.5%) |
| 6 to 11 Years | 1,126 (92.4%) | 856 (96.9%) |
| 12 to 14 Years | 928 (97.4%) | 444 (92.3%) |
| 15 Years | 365 (100.0%) | 105 (100.0%) |
| 16 and 17 Years | 451 (93.4%) | 479 (96.0%) |
| 18 to 24 Years | 1,674 (94.8%) | 1,274 (93.8%) |
| 25 to 34 Years | 1,400 (97.2%) | 1,131 (87.5%) |
| 35 to 44 Years | 1,476 (95.9%) | 1,252 (94.0%) |
| 45 to 54 Years | 873 (99.5%) | 1,158 (94.3%) |
| 55 to 64 Years | 735 (91.8%) | 629 (94.3%) |
| 65 to 74 Years | 642 (94.6%) | 869 (97.4%) |
| 75 Years and over | 440 (95.2%) | 322 (88.2%) |
| Total | 10,735 (95.7%) | 9,441 (92.9%) |
Income Below Poverty Among Married-Couple Families in Payson
The poverty statistics for married-couple families in Payson show that 0.7% or 28 of the total 4,041 families live below the poverty line. Families with 3 or 4 children have the highest poverty rate of 1.7%, comprising of 12 families. On the other hand, families with 1 or 2 children have the lowest poverty rate of 0.0%, which includes 0 families.
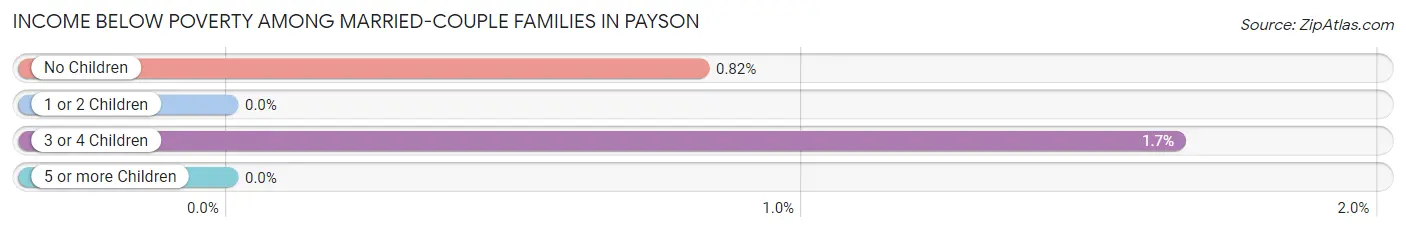
| Children | Above Poverty | Below Poverty |
| No Children | 1,946 (99.2%) | 16 (0.8%) |
| 1 or 2 Children | 1,091 (100.0%) | 0 (0.0%) |
| 3 or 4 Children | 716 (98.4%) | 12 (1.7%) |
| 5 or more Children | 260 (100.0%) | 0 (0.0%) |
| Total | 4,013 (99.3%) | 28 (0.7%) |
Income Below Poverty Among Single-Parent Households in Payson
According to the poverty data in Payson, 3.0% or 13 single-father households and 18.7% or 122 single-mother households are living below the poverty line. Among single-father households, those with 3 or 4 children have the highest poverty rate, with 10 households (32.3%) experiencing poverty. Likewise, among single-mother households, those with 3 or 4 children have the highest poverty rate, with 40 households (53.3%) falling below the poverty line.
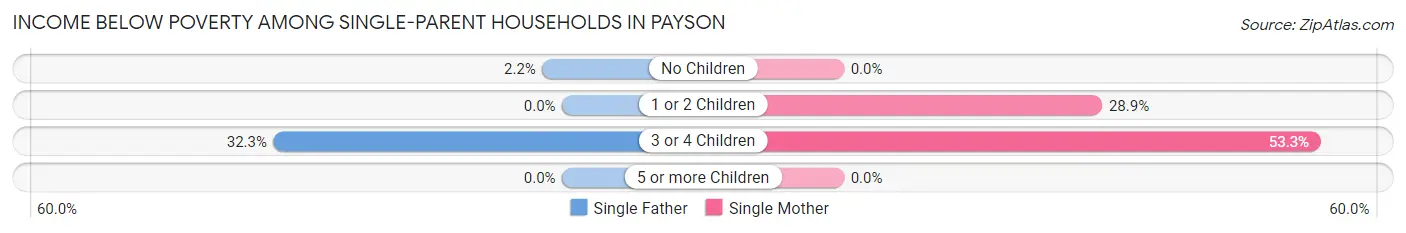
| Children | Single Father | Single Mother |
| No Children | 3 (2.2%) | 0 (0.0%) |
| 1 or 2 Children | 0 (0.0%) | 82 (28.9%) |
| 3 or 4 Children | 10 (32.3%) | 40 (53.3%) |
| 5 or more Children | 0 (0.0%) | 0 (0.0%) |
| Total | 13 (3.0%) | 122 (18.7%) |
Income Below Poverty Among Married-Couple vs Single-Parent Households in Payson
The poverty data for Payson shows that 28 of the married-couple family households (0.7%) and 135 of the single-parent households (12.4%) are living below the poverty level. Within the married-couple family households, those with 3 or 4 children have the highest poverty rate, with 12 households (1.7%) falling below the poverty line. Among the single-parent households, those with 3 or 4 children have the highest poverty rate, with 50 household (47.2%) living below poverty.
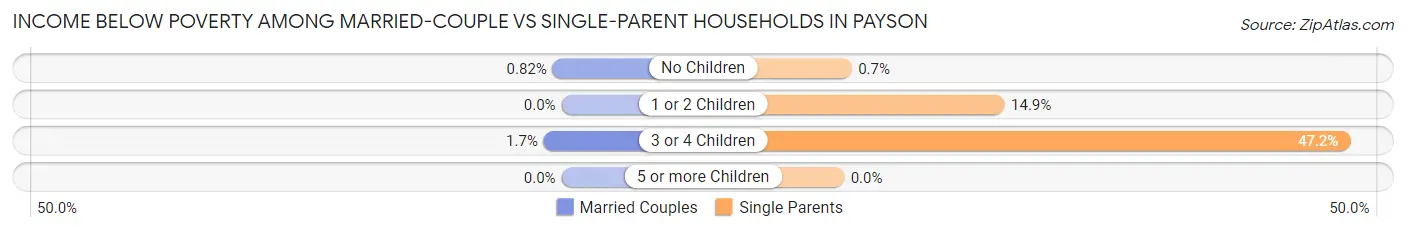
| Children | Married-Couple Families | Single-Parent Households |
| No Children | 16 (0.8%) | 3 (0.7%) |
| 1 or 2 Children | 0 (0.0%) | 82 (14.9%) |
| 3 or 4 Children | 12 (1.7%) | 50 (47.2%) |
| 5 or more Children | 0 (0.0%) | 0 (0.0%) |
| Total | 28 (0.7%) | 135 (12.4%) |
Race in Payson
The most populous races in Payson are White / Caucasian (18,609 | 86.4%), Hispanic or Latino (3,103 | 14.4%), and Two or more Races (1,252 | 5.8%).
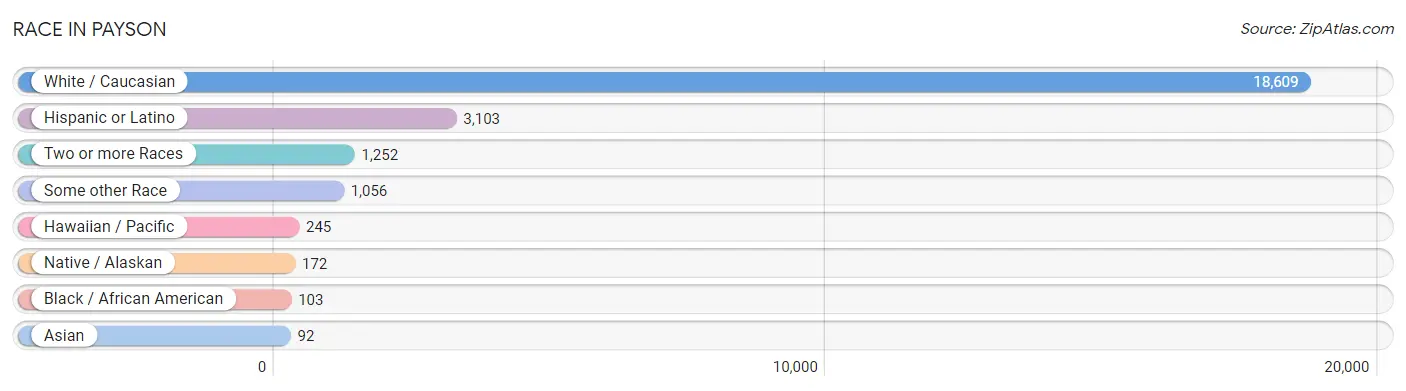
| Race | # Population | % Population |
| Asian | 92 | 0.4% |
| Black / African American | 103 | 0.5% |
| Hawaiian / Pacific | 245 | 1.1% |
| Hispanic or Latino | 3,103 | 14.4% |
| Native / Alaskan | 172 | 0.8% |
| White / Caucasian | 18,609 | 86.4% |
| Two or more Races | 1,252 | 5.8% |
| Some other Race | 1,056 | 4.9% |
| Total | 21,529 | 100.0% |
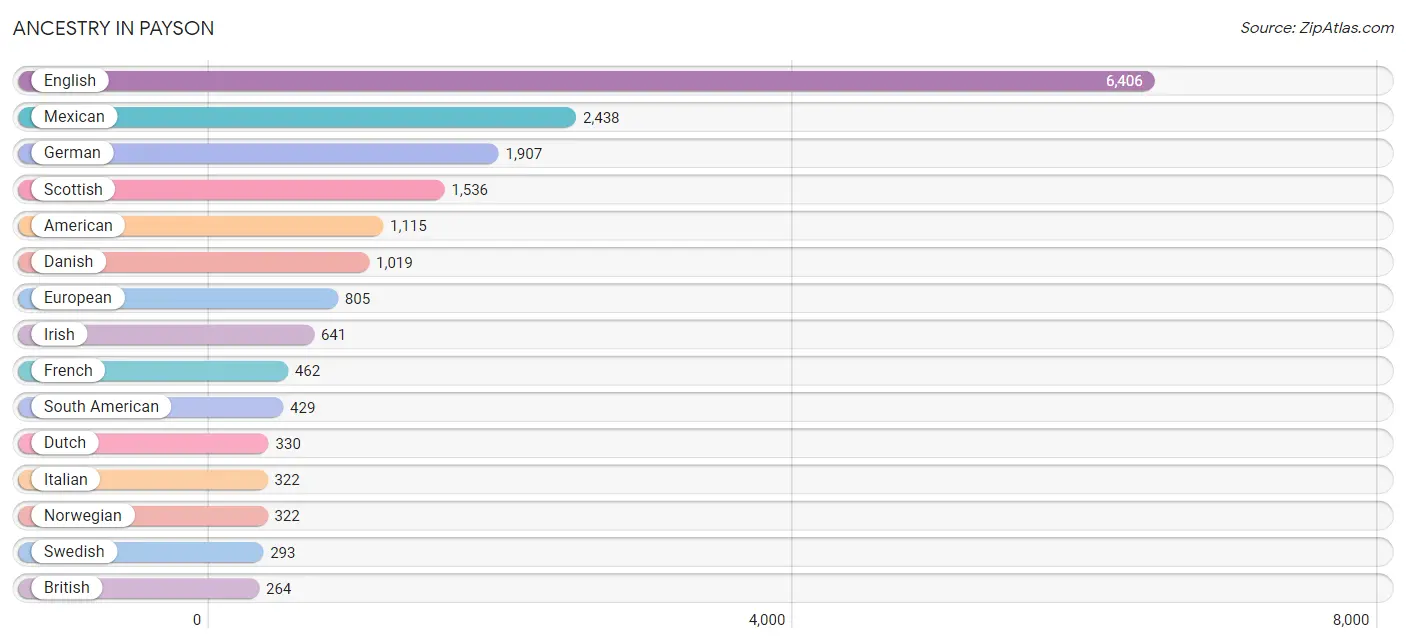
Ancestry in Payson
The most populous ancestries reported in Payson are English (6,406 | 29.8%), Mexican (2,438 | 11.3%), German (1,907 | 8.9%), Scottish (1,536 | 7.1%), and American (1,115 | 5.2%), together accounting for 62.2% of all Payson residents.
| Ancestry | # Population | % Population |
| American | 1,115 | 5.2% |
| Arab | 9 | 0.0% |
| Argentinean | 42 | 0.2% |
| Austrian | 29 | 0.1% |
| Basque | 7 | 0.0% |
| Belgian | 14 | 0.1% |
| Bhutanese | 54 | 0.3% |
| British | 264 | 1.2% |
| Canadian | 16 | 0.1% |
| Central American | 97 | 0.4% |
| Central American Indian | 50 | 0.2% |
| Cherokee | 10 | 0.1% |
| Cheyenne | 24 | 0.1% |
| Chilean | 164 | 0.8% |
| Colombian | 18 | 0.1% |
| Croatian | 6 | 0.0% |
| Cuban | 23 | 0.1% |
| Czechoslovakian | 59 | 0.3% |
| Danish | 1,019 | 4.7% |
| Dutch | 330 | 1.5% |
| Eastern European | 25 | 0.1% |
| Ecuadorian | 11 | 0.1% |
| English | 6,406 | 29.8% |
| European | 805 | 3.7% |
| French | 462 | 2.1% |
| French Canadian | 32 | 0.2% |
| German | 1,907 | 8.9% |
| Greek | 22 | 0.1% |
| Guatemalan | 78 | 0.4% |
| Honduran | 8 | 0.0% |
| Hopi | 15 | 0.1% |
| Hungarian | 43 | 0.2% |
| Icelander | 50 | 0.2% |
| Indian (Asian) | 26 | 0.1% |
| Irish | 641 | 3.0% |
| Italian | 322 | 1.5% |
| Korean | 45 | 0.2% |
| Mexican | 2,438 | 11.3% |
| Native Hawaiian | 131 | 0.6% |
| Navajo | 74 | 0.3% |
| Northern European | 54 | 0.3% |
| Norwegian | 322 | 1.5% |
| Panamanian | 5 | 0.0% |
| Pennsylvania German | 3 | 0.0% |
| Peruvian | 188 | 0.9% |
| Polish | 38 | 0.2% |
| Portuguese | 40 | 0.2% |
| Puerto Rican | 42 | 0.2% |
| Russian | 26 | 0.1% |
| Salvadoran | 6 | 0.0% |
| Samoan | 155 | 0.7% |
| Scandinavian | 136 | 0.6% |
| Scotch-Irish | 87 | 0.4% |
| Scottish | 1,536 | 7.1% |
| Sioux | 10 | 0.1% |
| South American | 429 | 2.0% |
| Spanish | 41 | 0.2% |
| Sri Lankan | 23 | 0.1% |
| Swedish | 293 | 1.4% |
| Swiss | 218 | 1.0% |
| Syrian | 9 | 0.0% |
| Thai | 50 | 0.2% |
| Tongan | 148 | 0.7% |
| Venezuelan | 6 | 0.0% |
| Welsh | 220 | 1.0% | View All 65 Rows |
Immigrants in Payson
The most numerous immigrant groups reported in Payson came from Latin America (1,107 | 5.1%), Central America (915 | 4.3%), Mexico (773 | 3.6%), South America (192 | 0.9%), and Asia (98 | 0.5%), together accounting for 14.3% of all Payson residents.
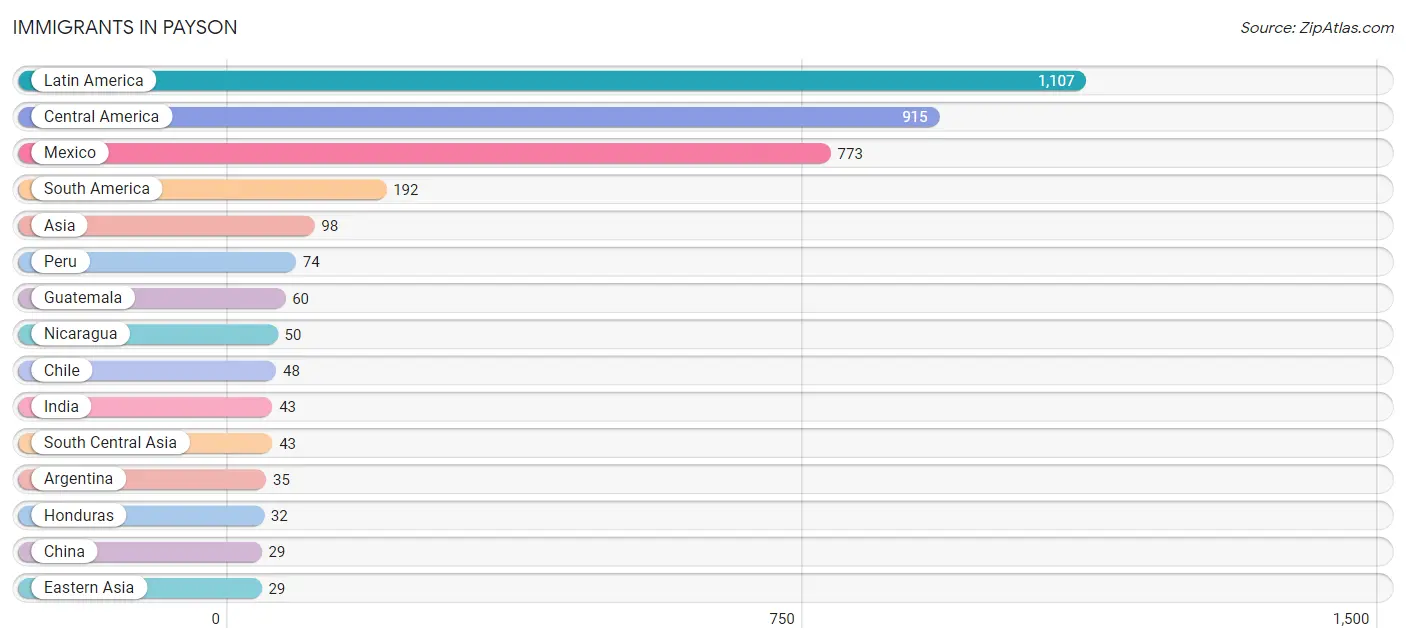
| Immigration Origin | # Population | % Population |
| Africa | 10 | 0.1% |
| Argentina | 35 | 0.2% |
| Asia | 98 | 0.5% |
| Canada | 27 | 0.1% |
| Central America | 915 | 4.3% |
| Chile | 48 | 0.2% |
| China | 29 | 0.1% |
| Colombia | 18 | 0.1% |
| Eastern Africa | 10 | 0.1% |
| Eastern Asia | 29 | 0.1% |
| Ecuador | 11 | 0.1% |
| England | 12 | 0.1% |
| Europe | 22 | 0.1% |
| Guatemala | 60 | 0.3% |
| Honduras | 32 | 0.2% |
| India | 43 | 0.2% |
| Latin America | 1,107 | 5.1% |
| Mexico | 773 | 3.6% |
| Micronesia | 9 | 0.0% |
| Nicaragua | 50 | 0.2% |
| Northern Europe | 22 | 0.1% |
| Oceania | 9 | 0.0% |
| Peru | 74 | 0.3% |
| Philippines | 21 | 0.1% |
| South America | 192 | 0.9% |
| South Central Asia | 43 | 0.2% |
| South Eastern Asia | 26 | 0.1% |
| Taiwan | 29 | 0.1% |
| Venezuela | 6 | 0.0% |
| Vietnam | 5 | 0.0% | View All 30 Rows |
Sex and Age in Payson
Sex and Age in Payson
The most populous age groups in Payson are 15 to 19 Years (1,629 | 14.4%) for men and 15 to 19 Years (1,071 | 10.5%) for women.
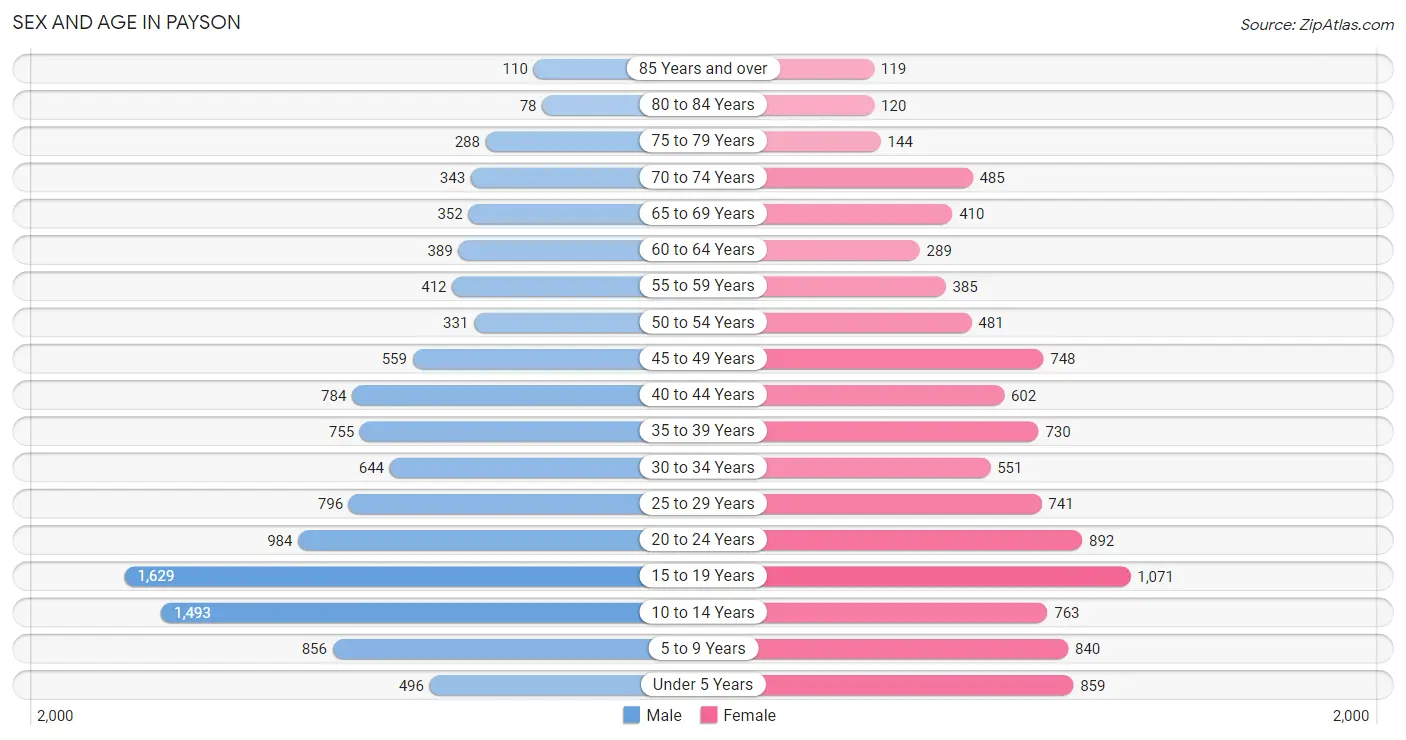
| Age Bracket | Male | Female |
| Under 5 Years | 496 (4.4%) | 859 (8.4%) |
| 5 to 9 Years | 856 (7.6%) | 840 (8.2%) |
| 10 to 14 Years | 1,493 (13.2%) | 763 (7.5%) |
| 15 to 19 Years | 1,629 (14.4%) | 1,071 (10.5%) |
| 20 to 24 Years | 984 (8.7%) | 892 (8.7%) |
| 25 to 29 Years | 796 (7.0%) | 741 (7.2%) |
| 30 to 34 Years | 644 (5.7%) | 551 (5.4%) |
| 35 to 39 Years | 755 (6.7%) | 730 (7.1%) |
| 40 to 44 Years | 784 (6.9%) | 602 (5.9%) |
| 45 to 49 Years | 559 (5.0%) | 748 (7.3%) |
| 50 to 54 Years | 331 (2.9%) | 481 (4.7%) |
| 55 to 59 Years | 412 (3.6%) | 385 (3.8%) |
| 60 to 64 Years | 389 (3.4%) | 289 (2.8%) |
| 65 to 69 Years | 352 (3.1%) | 410 (4.0%) |
| 70 to 74 Years | 343 (3.0%) | 485 (4.7%) |
| 75 to 79 Years | 288 (2.5%) | 144 (1.4%) |
| 80 to 84 Years | 78 (0.7%) | 120 (1.2%) |
| 85 Years and over | 110 (1.0%) | 119 (1.2%) |
| Total | 11,299 (100.0%) | 10,230 (100.0%) |
Families and Households in Payson
Median Family Size in Payson
The median family size in Payson is 3.80 persons per family, with married-couple families (4,041 | 78.8%) accounting for the largest median family size of 3.95 persons per family. On the other hand, single male/father families (432 | 8.4%) represent the smallest median family size with 3.01 persons per family.
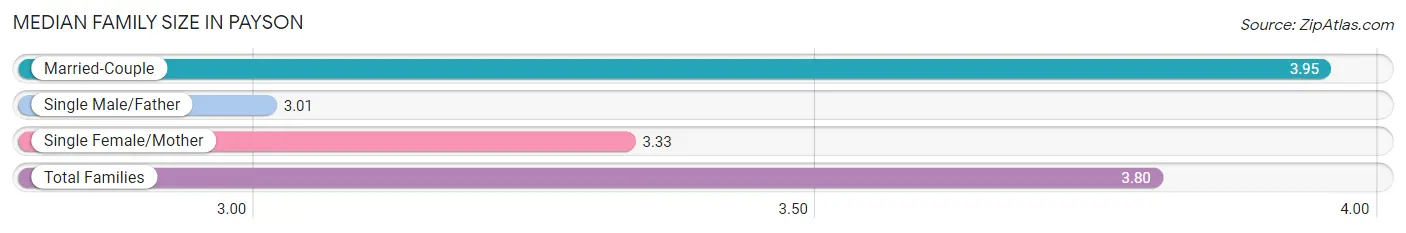
| Family Type | # Families | Family Size |
| Married-Couple | 4,041 (78.8%) | 3.95 |
| Single Male/Father | 432 (8.4%) | 3.01 |
| Single Female/Mother | 652 (12.7%) | 3.33 |
| Total Families | 5,125 (100.0%) | 3.80 |
Median Household Size in Payson
The median household size in Payson is 3.47 persons per household, with married-couple households (4,041 | 65.7%) accounting for the largest median household size of 3.99 persons per household. non-family households (1,025 | 16.7%) represent the smallest median household size with 1.26 persons per household.
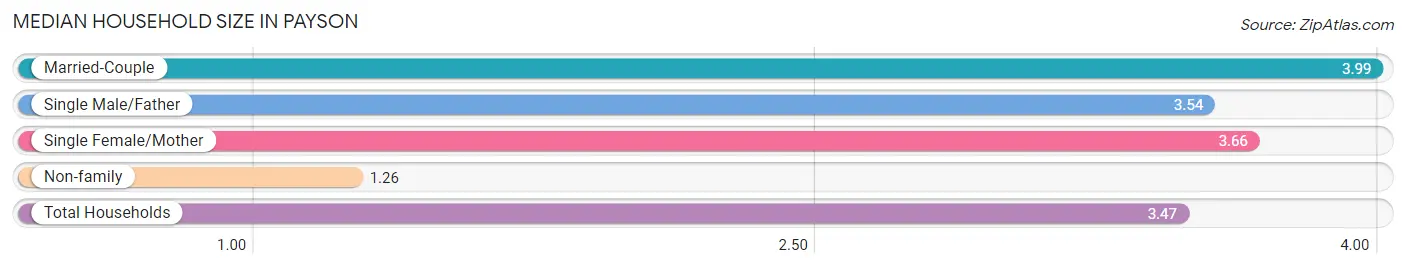
| Household Type | # Households | Household Size |
| Married-Couple | 4,041 (65.7%) | 3.99 |
| Single Male/Father | 432 (7.0%) | 3.54 |
| Single Female/Mother | 652 (10.6%) | 3.66 |
| Non-family | 1,025 (16.7%) | 1.26 |
| Total Households | 6,150 (100.0%) | 3.47 |
Household Size by Marriage Status in Payson
Out of a total of 6,150 households in Payson, 5,125 (83.3%) are family households, while 1,025 (16.7%) are nonfamily households. The most numerous type of family households are 2-person households, comprising 1,675, and the most common type of nonfamily households are 1-person households, comprising 780.
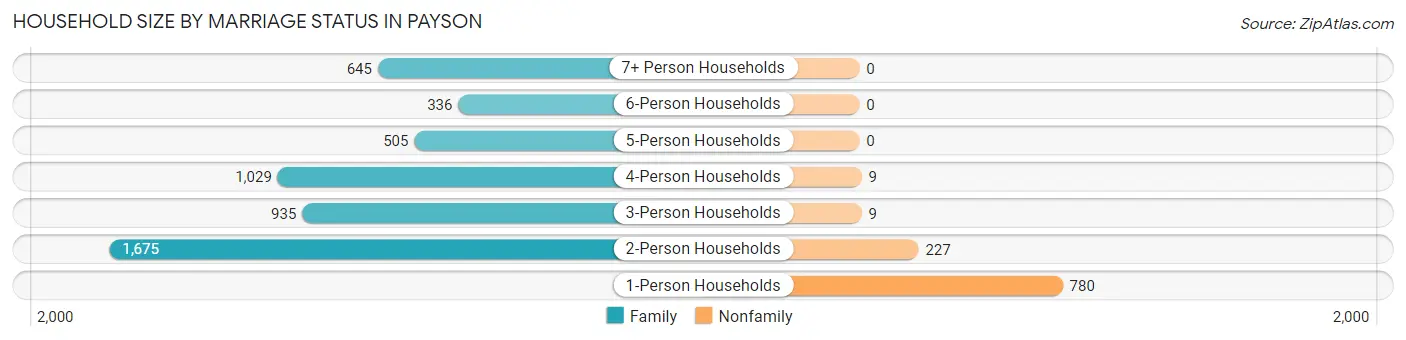
| Household Size | Family Households | Nonfamily Households |
| 1-Person Households | - | 780 (12.7%) |
| 2-Person Households | 1,675 (27.2%) | 227 (3.7%) |
| 3-Person Households | 935 (15.2%) | 9 (0.2%) |
| 4-Person Households | 1,029 (16.7%) | 9 (0.2%) |
| 5-Person Households | 505 (8.2%) | 0 (0.0%) |
| 6-Person Households | 336 (5.5%) | 0 (0.0%) |
| 7+ Person Households | 645 (10.5%) | 0 (0.0%) |
| Total | 5,125 (83.3%) | 1,025 (16.7%) |
Female Fertility in Payson
Fertility by Age in Payson
Average fertility rate in Payson is 54.0 births per 1,000 women. Women in the age bracket of 20 to 34 years have the highest fertility rate with 96.0 births per 1,000 women. Women in the age bracket of 20 to 34 years acount for 70.7% of all women with births.
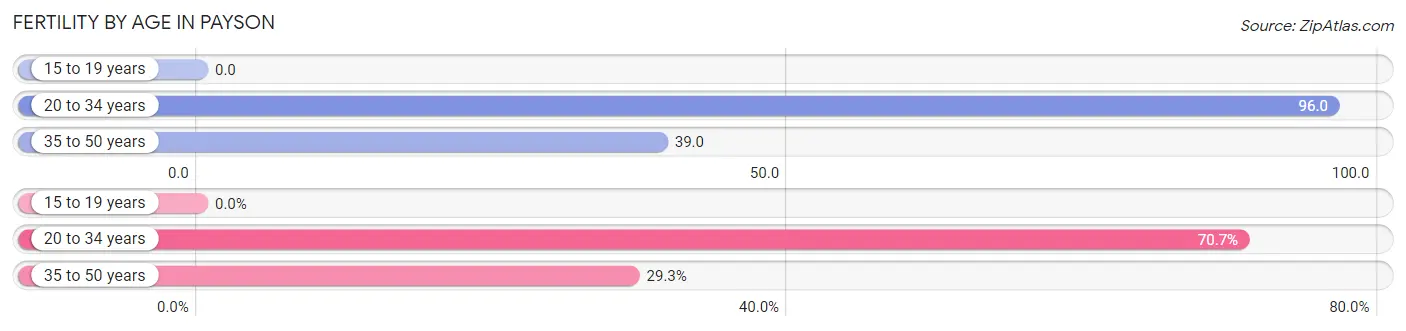
| Age Bracket | Women with Births | Births / 1,000 Women |
| 15 to 19 years | 0 (0.0%) | 0.0 |
| 20 to 34 years | 210 (70.7%) | 96.0 |
| 35 to 50 years | 87 (29.3%) | 39.0 |
| Total | 297 (100.0%) | 54.0 |
Fertility by Age by Marriage Status in Payson
90.2% of women with births (297) in Payson are married. The highest percentage of unmarried women with births falls into 35 to 50 years age bracket with 16.1% of them unmarried at the time of birth, while the lowest percentage of unmarried women with births belong to 20 to 34 years age bracket with 7.1% of them unmarried.
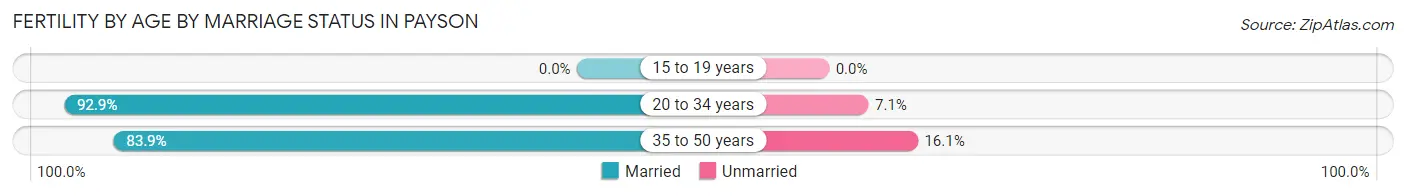
| Age Bracket | Married | Unmarried |
| 15 to 19 years | 0 (0.0%) | 0 (0.0%) |
| 20 to 34 years | 195 (92.9%) | 15 (7.1%) |
| 35 to 50 years | 73 (83.9%) | 14 (16.1%) |
| Total | 268 (90.2%) | 29 (9.8%) |
Fertility by Education in Payson
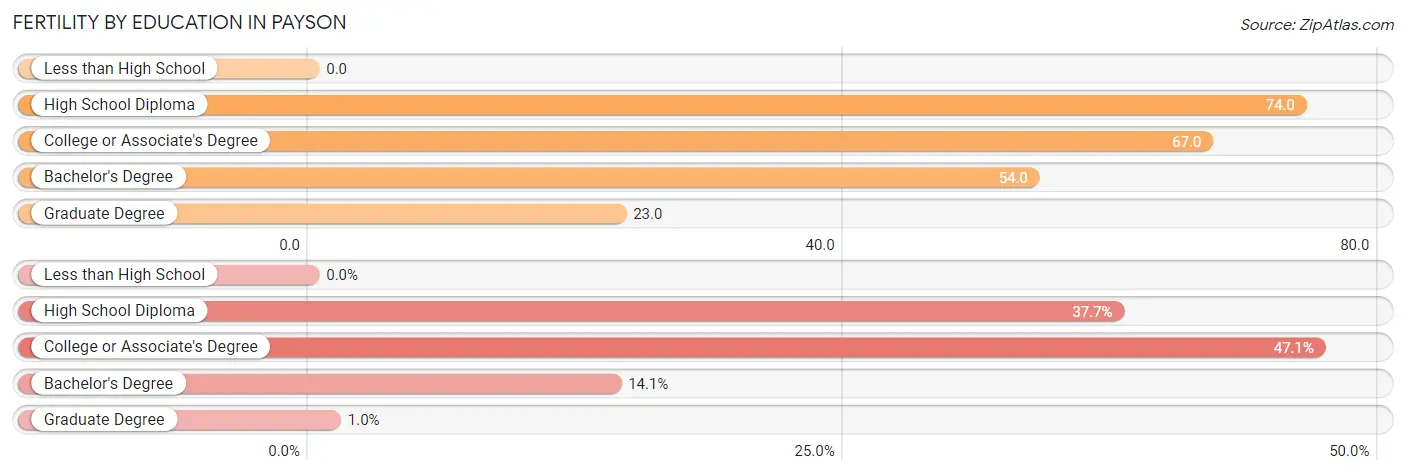
| Educational Attainment | Women with Births | Births / 1,000 Women |
| Less than High School | 0 (0.0%) | 0.0 |
| High School Diploma | 112 (37.7%) | 74.0 |
| College or Associate's Degree | 140 (47.1%) | 67.0 |
| Bachelor's Degree | 42 (14.1%) | 54.0 |
| Graduate Degree | 3 (1.0%) | 23.0 |
| Total | 297 (100.0%) | 54.0 |
Fertility by Education by Marriage Status in Payson
9.8% of women with births in Payson are unmarried. Women with the educational attainment of high school diploma are most likely to be married with 100.0% of them married at childbirth, while women with the educational attainment of college or associate's degree are least likely to be married with 20.7% of them unmarried at childbirth.
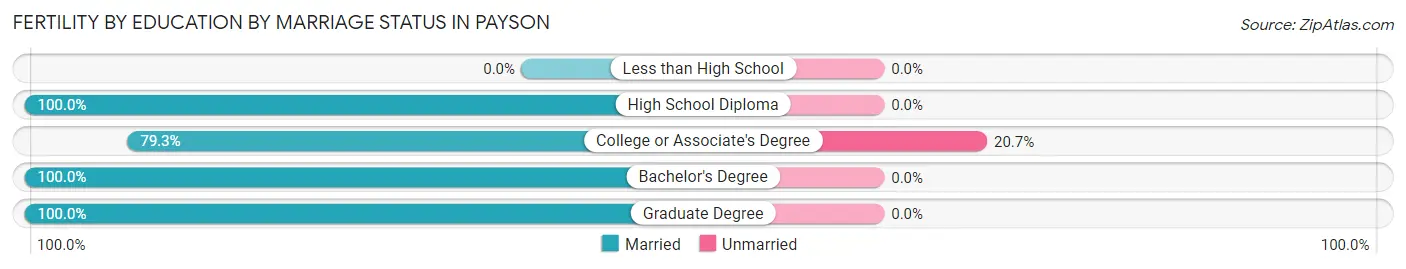
| Educational Attainment | Married | Unmarried |
| Less than High School | 0 (0.0%) | 0 (0.0%) |
| High School Diploma | 112 (100.0%) | 0 (0.0%) |
| College or Associate's Degree | 111 (79.3%) | 29 (20.7%) |
| Bachelor's Degree | 42 (100.0%) | 0 (0.0%) |
| Graduate Degree | 3 (100.0%) | 0 (0.0%) |
| Total | 268 (90.2%) | 29 (9.8%) |
Employment Characteristics in Payson
Employment by Class of Employer in Payson
Among the 10,333 employed individuals in Payson, private company employees (7,844 | 75.9%), local government employees (774 | 7.5%), and self-employed (not incorporated) (449 | 4.3%) make up the most common classes of employment.
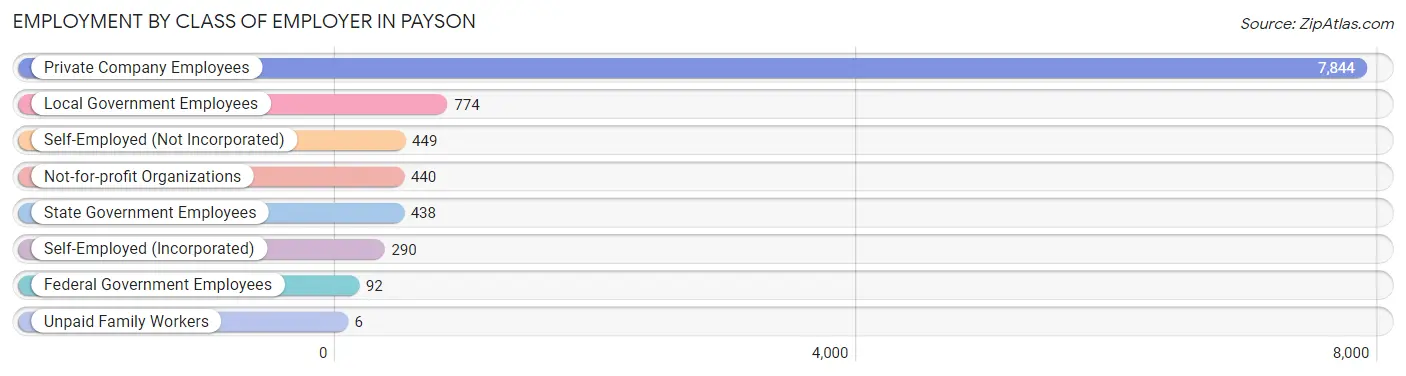
| Employer Class | # Employees | % Employees |
| Private Company Employees | 7,844 | 75.9% |
| Self-Employed (Incorporated) | 290 | 2.8% |
| Self-Employed (Not Incorporated) | 449 | 4.3% |
| Not-for-profit Organizations | 440 | 4.3% |
| Local Government Employees | 774 | 7.5% |
| State Government Employees | 438 | 4.2% |
| Federal Government Employees | 92 | 0.9% |
| Unpaid Family Workers | 6 | 0.1% |
| Total | 10,333 | 100.0% |
Employment Status by Age in Payson
According to the labor force statistics for Payson, out of the total population over 16 years of age (15,752), 69.6% or 10,963 individuals are in the labor force, with 4.9% or 537 of them unemployed. The age group with the highest labor force participation rate is 20 to 24 years, with 88.4% or 1,658 individuals in the labor force. Within the labor force, the 16 to 19 years age range has the highest percentage of unemployed individuals, with 18.7% or 260 of them being unemployed.
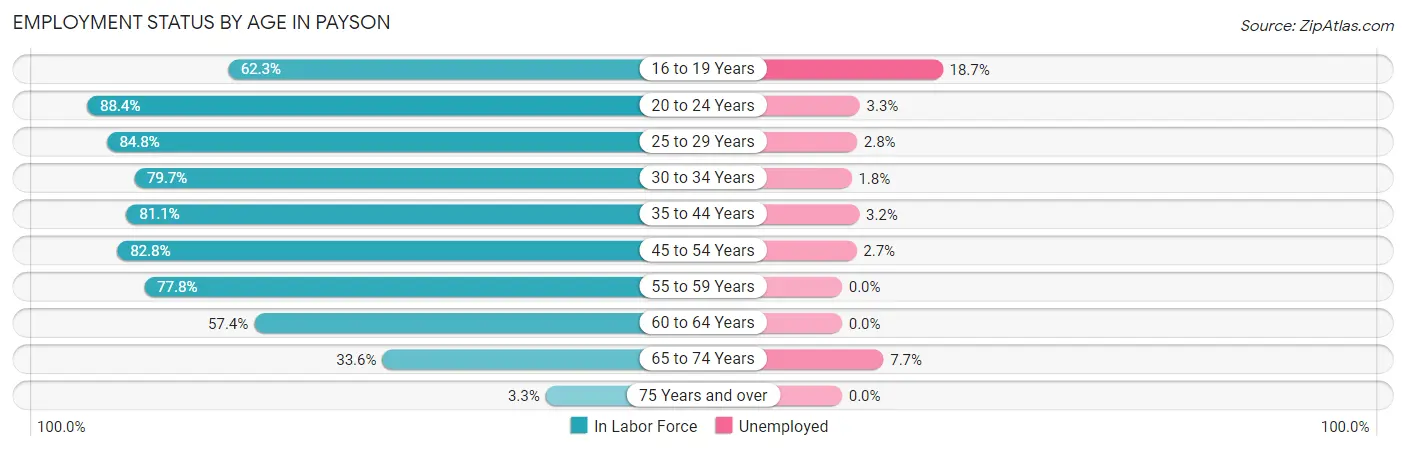
| Age Bracket | In Labor Force | Unemployed |
| 16 to 19 Years | 1,389 (62.3%) | 260 (18.7%) |
| 20 to 24 Years | 1,658 (88.4%) | 55 (3.3%) |
| 25 to 29 Years | 1,303 (84.8%) | 36 (2.8%) |
| 30 to 34 Years | 952 (79.7%) | 17 (1.8%) |
| 35 to 44 Years | 2,328 (81.1%) | 74 (3.2%) |
| 45 to 54 Years | 1,755 (82.8%) | 47 (2.7%) |
| 55 to 59 Years | 620 (77.8%) | 0 (0.0%) |
| 60 to 64 Years | 389 (57.4%) | 0 (0.0%) |
| 65 to 74 Years | 534 (33.6%) | 41 (7.7%) |
| 75 Years and over | 28 (3.3%) | 0 (0.0%) |
| Total | 10,963 (69.6%) | 537 (4.9%) |
Employment Status by Educational Attainment in Payson
According to labor force statistics for Payson, 79.9% of individuals (7,348) out of the total population between 25 and 64 years of age (9,197) are in the labor force, with 2.4% or 176 of them being unemployed. The group with the highest labor force participation rate are those with the educational attainment of bachelor's degree or higher, with 84.4% or 2,126 individuals in the labor force. Within the labor force, individuals with less than high school education have the highest percentage of unemployment, with 9.3% or 42 of them being unemployed.
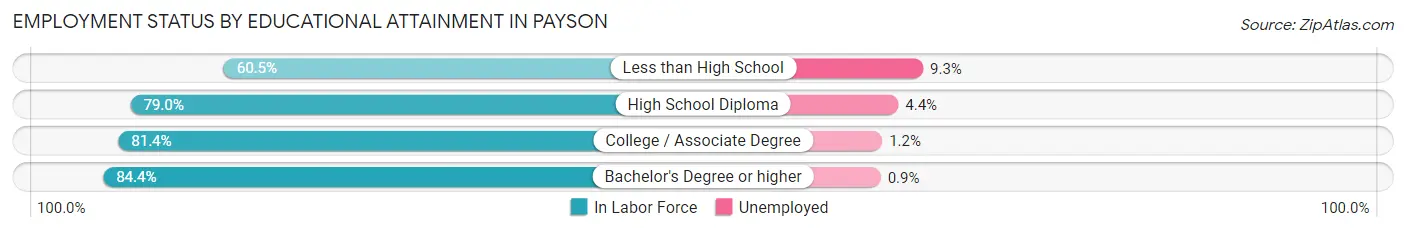
| Educational Attainment | In Labor Force | Unemployed |
| Less than High School | 454 (60.5%) | 70 (9.3%) |
| High School Diploma | 1,856 (79.0%) | 103 (4.4%) |
| College / Associate Degree | 2,913 (81.4%) | 43 (1.2%) |
| Bachelor's Degree or higher | 2,126 (84.4%) | 23 (0.9%) |
| Total | 7,348 (79.9%) | 221 (2.4%) |
Employment Occupations by Sex in Payson
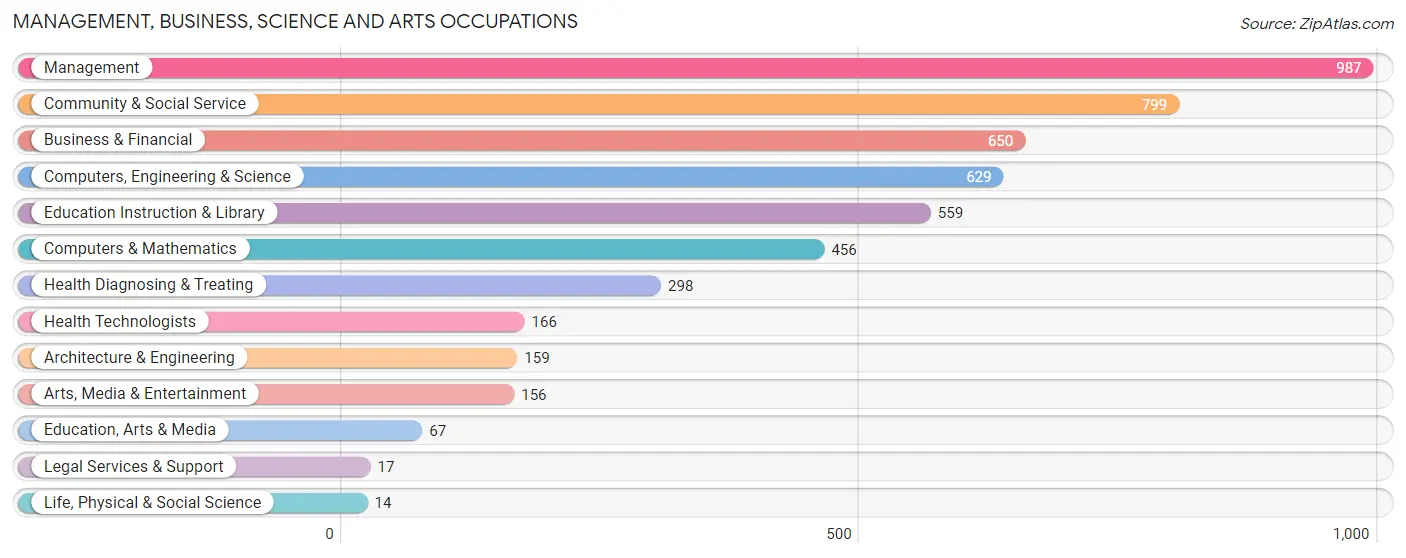
Management, Business, Science and Arts Occupations
The most common Management, Business, Science and Arts occupations in Payson are Management (987 | 9.5%), Community & Social Service (799 | 7.7%), Business & Financial (650 | 6.2%), Computers, Engineering & Science (629 | 6.0%), and Education Instruction & Library (559 | 5.4%).
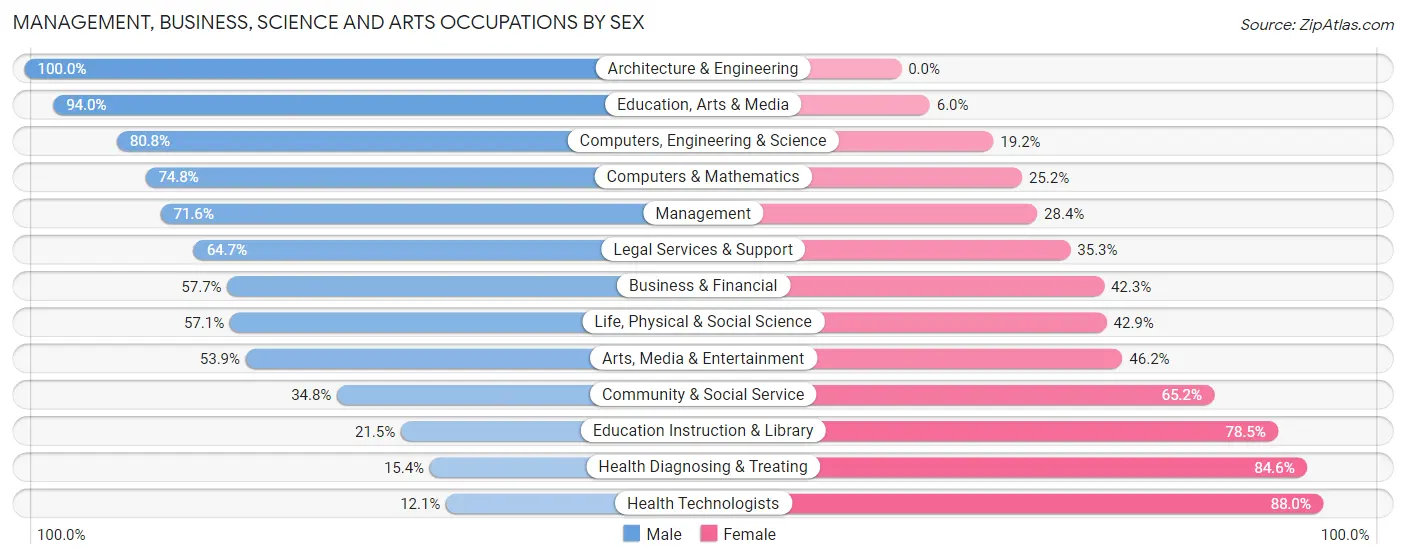
Management, Business, Science and Arts Occupations by Sex
Within the Management, Business, Science and Arts occupations in Payson, the most male-oriented occupations are Architecture & Engineering (100.0%), Education, Arts & Media (94.0%), and Computers, Engineering & Science (80.8%), while the most female-oriented occupations are Health Technologists (87.9%), Health Diagnosing & Treating (84.6%), and Education Instruction & Library (78.5%).
| Occupation | Male | Female |
| Management | 707 (71.6%) | 280 (28.4%) |
| Business & Financial | 375 (57.7%) | 275 (42.3%) |
| Computers, Engineering & Science | 508 (80.8%) | 121 (19.2%) |
| Computers & Mathematics | 341 (74.8%) | 115 (25.2%) |
| Architecture & Engineering | 159 (100.0%) | 0 (0.0%) |
| Life, Physical & Social Science | 8 (57.1%) | 6 (42.9%) |
| Community & Social Service | 278 (34.8%) | 521 (65.2%) |
| Education, Arts & Media | 63 (94.0%) | 4 (6.0%) |
| Legal Services & Support | 11 (64.7%) | 6 (35.3%) |
| Education Instruction & Library | 120 (21.5%) | 439 (78.5%) |
| Arts, Media & Entertainment | 84 (53.8%) | 72 (46.2%) |
| Health Diagnosing & Treating | 46 (15.4%) | 252 (84.6%) |
| Health Technologists | 20 (12.0%) | 146 (87.9%) |
| Total (Category) | 1,914 (56.9%) | 1,449 (43.1%) |
| Total (Overall) | 5,686 (54.6%) | 4,725 (45.4%) |
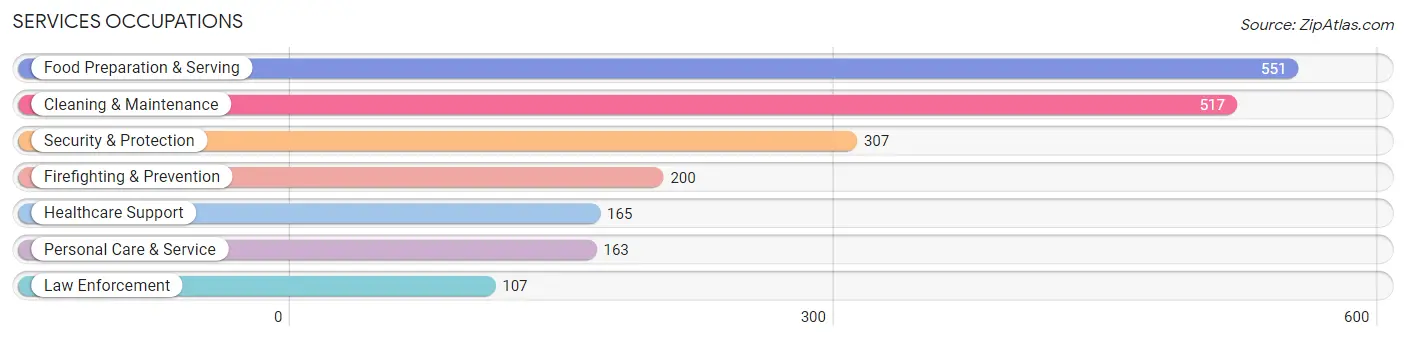
Services Occupations
The most common Services occupations in Payson are Food Preparation & Serving (551 | 5.3%), Cleaning & Maintenance (517 | 5.0%), Security & Protection (307 | 2.9%), Firefighting & Prevention (200 | 1.9%), and Healthcare Support (165 | 1.6%).
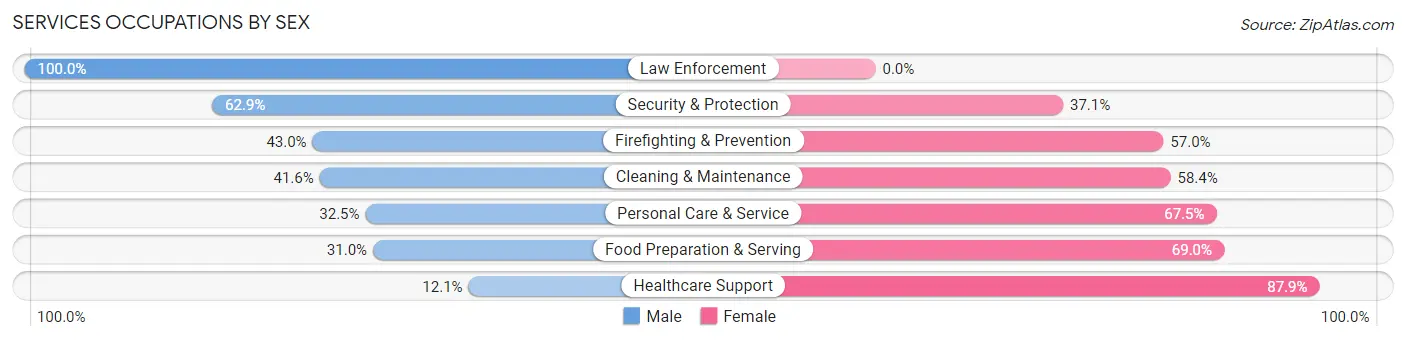
Services Occupations by Sex
Within the Services occupations in Payson, the most male-oriented occupations are Law Enforcement (100.0%), Security & Protection (62.9%), and Firefighting & Prevention (43.0%), while the most female-oriented occupations are Healthcare Support (87.9%), Food Preparation & Serving (69.0%), and Personal Care & Service (67.5%).
| Occupation | Male | Female |
| Healthcare Support | 20 (12.1%) | 145 (87.9%) |
| Security & Protection | 193 (62.9%) | 114 (37.1%) |
| Firefighting & Prevention | 86 (43.0%) | 114 (57.0%) |
| Law Enforcement | 107 (100.0%) | 0 (0.0%) |
| Food Preparation & Serving | 171 (31.0%) | 380 (69.0%) |
| Cleaning & Maintenance | 215 (41.6%) | 302 (58.4%) |
| Personal Care & Service | 53 (32.5%) | 110 (67.5%) |
| Total (Category) | 652 (38.3%) | 1,051 (61.7%) |
| Total (Overall) | 5,686 (54.6%) | 4,725 (45.4%) |
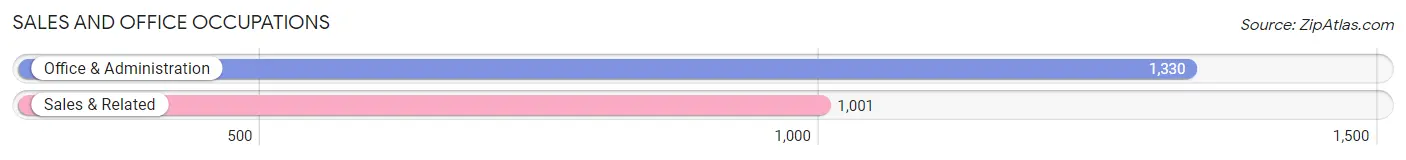
Sales and Office Occupations
The most common Sales and Office occupations in Payson are Office & Administration (1,330 | 12.8%), and Sales & Related (1,001 | 9.6%).
Sales and Office Occupations by Sex
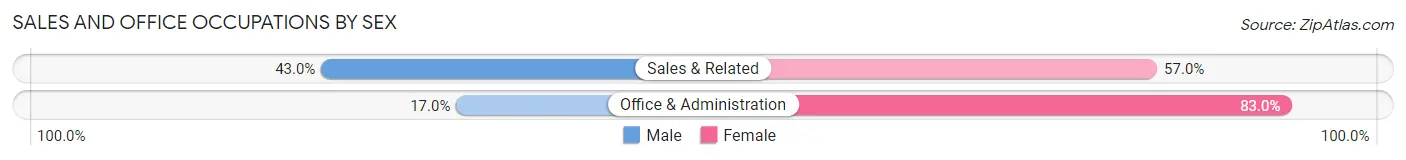
| Occupation | Male | Female |
| Sales & Related | 430 (43.0%) | 571 (57.0%) |
| Office & Administration | 226 (17.0%) | 1,104 (83.0%) |
| Total (Category) | 656 (28.1%) | 1,675 (71.9%) |
| Total (Overall) | 5,686 (54.6%) | 4,725 (45.4%) |
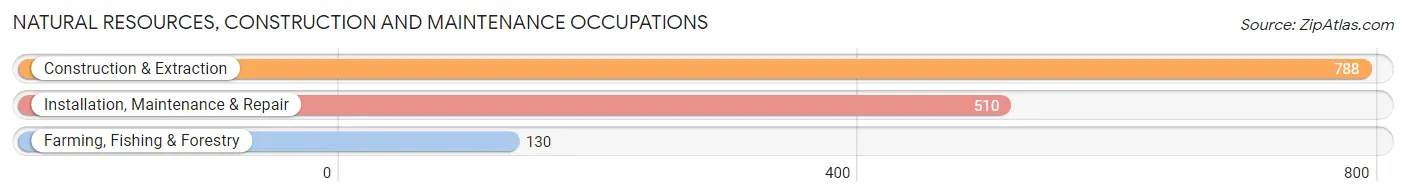
Natural Resources, Construction and Maintenance Occupations
The most common Natural Resources, Construction and Maintenance occupations in Payson are Construction & Extraction (788 | 7.6%), Installation, Maintenance & Repair (510 | 4.9%), and Farming, Fishing & Forestry (130 | 1.3%).
Natural Resources, Construction and Maintenance Occupations by Sex
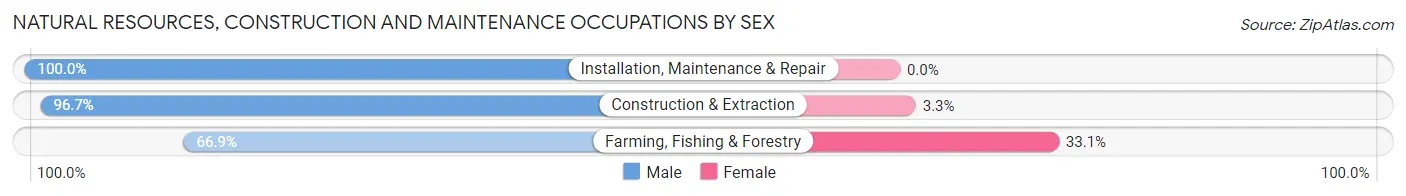
| Occupation | Male | Female |
| Farming, Fishing & Forestry | 87 (66.9%) | 43 (33.1%) |
| Construction & Extraction | 762 (96.7%) | 26 (3.3%) |
| Installation, Maintenance & Repair | 510 (100.0%) | 0 (0.0%) |
| Total (Category) | 1,359 (95.2%) | 69 (4.8%) |
| Total (Overall) | 5,686 (54.6%) | 4,725 (45.4%) |
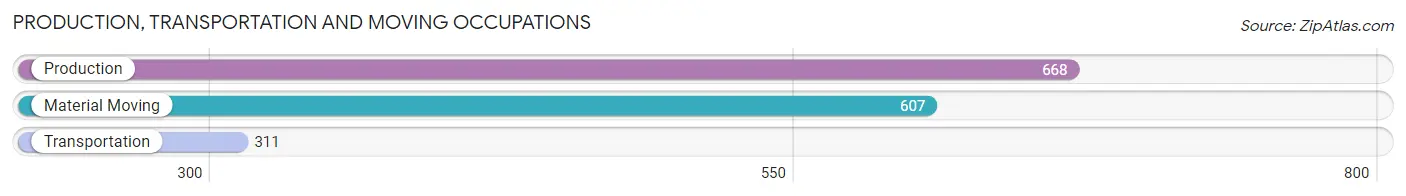
Production, Transportation and Moving Occupations
The most common Production, Transportation and Moving occupations in Payson are Production (668 | 6.4%), Material Moving (607 | 5.8%), and Transportation (311 | 3.0%).
Production, Transportation and Moving Occupations by Sex
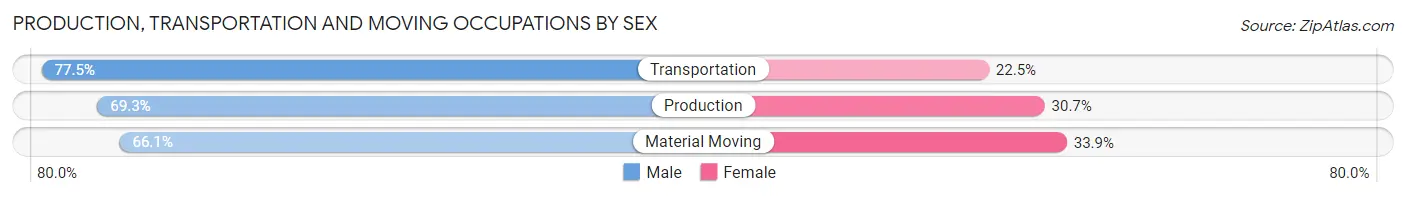
| Occupation | Male | Female |
| Production | 463 (69.3%) | 205 (30.7%) |
| Transportation | 241 (77.5%) | 70 (22.5%) |
| Material Moving | 401 (66.1%) | 206 (33.9%) |
| Total (Category) | 1,105 (69.7%) | 481 (30.3%) |
| Total (Overall) | 5,686 (54.6%) | 4,725 (45.4%) |
Employment Industries by Sex in Payson
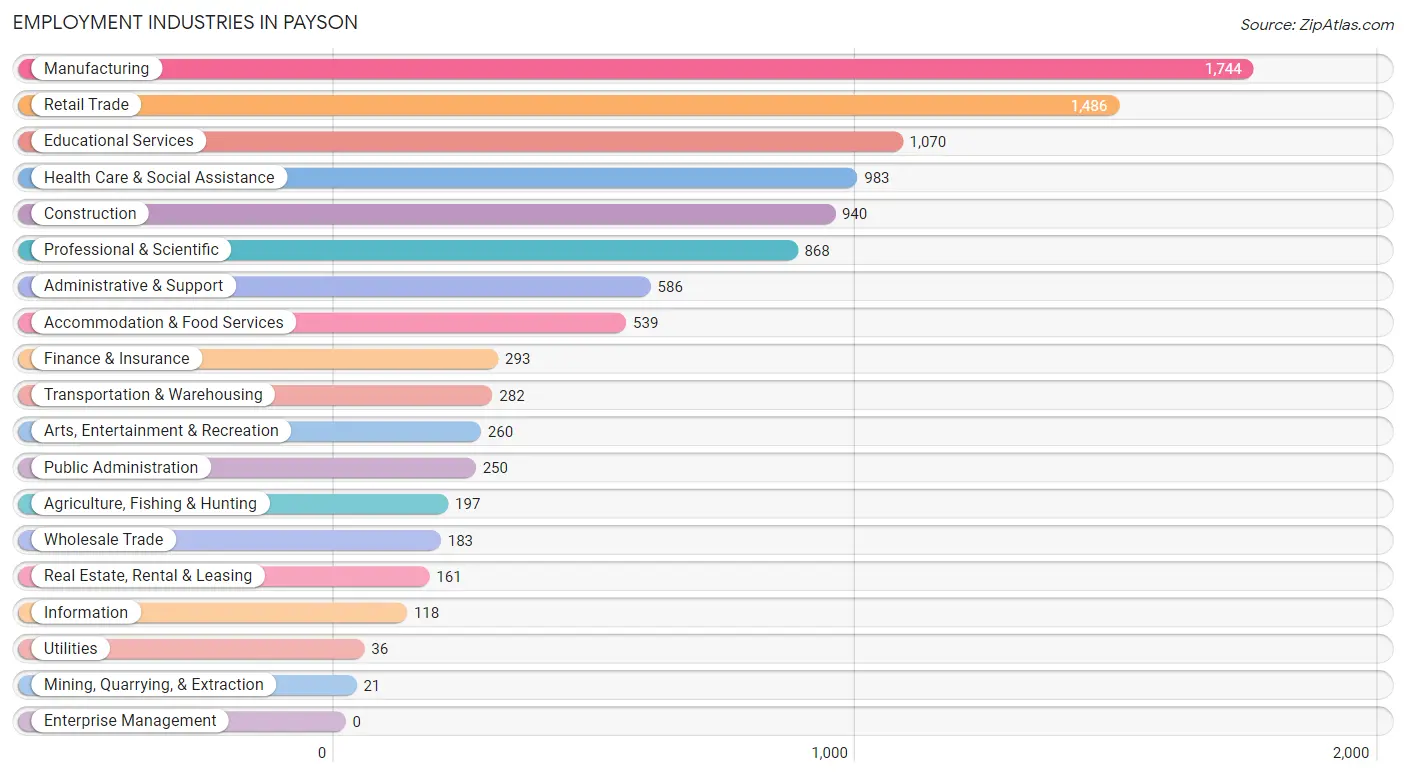
Employment Industries in Payson
The major employment industries in Payson include Manufacturing (1,744 | 16.8%), Retail Trade (1,486 | 14.3%), Educational Services (1,070 | 10.3%), Health Care & Social Assistance (983 | 9.4%), and Construction (940 | 9.0%).
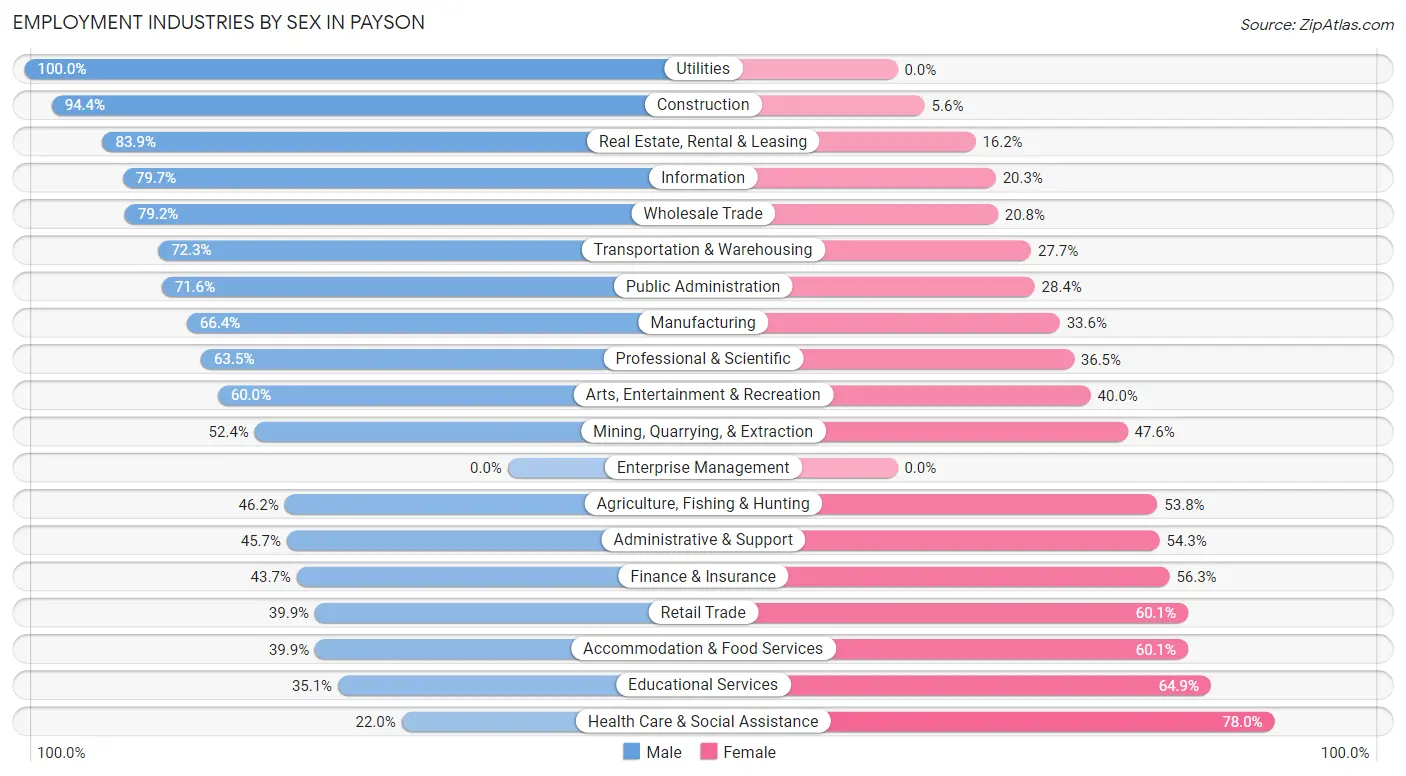
Employment Industries by Sex in Payson
The Payson industries that see more men than women are Utilities (100.0%), Construction (94.4%), and Real Estate, Rental & Leasing (83.9%), whereas the industries that tend to have a higher number of women are Health Care & Social Assistance (78.0%), Educational Services (64.9%), and Accommodation & Food Services (60.1%).
| Industry | Male | Female |
| Agriculture, Fishing & Hunting | 91 (46.2%) | 106 (53.8%) |
| Mining, Quarrying, & Extraction | 11 (52.4%) | 10 (47.6%) |
| Construction | 887 (94.4%) | 53 (5.6%) |
| Manufacturing | 1,158 (66.4%) | 586 (33.6%) |
| Wholesale Trade | 145 (79.2%) | 38 (20.8%) |
| Retail Trade | 593 (39.9%) | 893 (60.1%) |
| Transportation & Warehousing | 204 (72.3%) | 78 (27.7%) |
| Utilities | 36 (100.0%) | 0 (0.0%) |
| Information | 94 (79.7%) | 24 (20.3%) |
| Finance & Insurance | 128 (43.7%) | 165 (56.3%) |
| Real Estate, Rental & Leasing | 135 (83.9%) | 26 (16.2%) |
| Professional & Scientific | 551 (63.5%) | 317 (36.5%) |
| Enterprise Management | 0 (0.0%) | 0 (0.0%) |
| Administrative & Support | 268 (45.7%) | 318 (54.3%) |
| Educational Services | 376 (35.1%) | 694 (64.9%) |
| Health Care & Social Assistance | 216 (22.0%) | 767 (78.0%) |
| Arts, Entertainment & Recreation | 156 (60.0%) | 104 (40.0%) |
| Accommodation & Food Services | 215 (39.9%) | 324 (60.1%) |
| Public Administration | 179 (71.6%) | 71 (28.4%) |
| Total | 5,686 (54.6%) | 4,725 (45.4%) |
Education in Payson
School Enrollment in Payson
The most common levels of schooling among the 7,106 students in Payson are high school (2,205 | 31.0%), middle school (1,778 | 25.0%), and elementary school (1,307 | 18.4%).
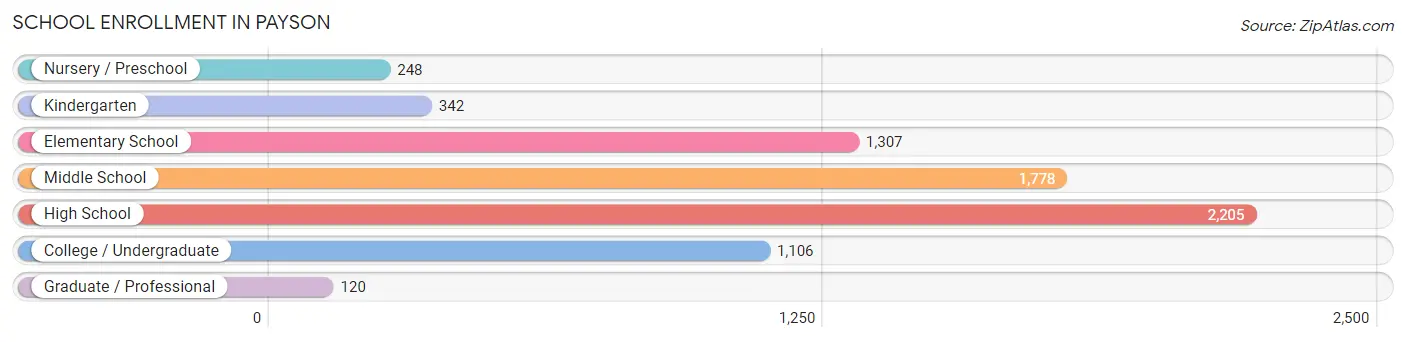
| School Level | # Students | % Students |
| Nursery / Preschool | 248 | 3.5% |
| Kindergarten | 342 | 4.8% |
| Elementary School | 1,307 | 18.4% |
| Middle School | 1,778 | 25.0% |
| High School | 2,205 | 31.0% |
| College / Undergraduate | 1,106 | 15.6% |
| Graduate / Professional | 120 | 1.7% |
| Total | 7,106 | 100.0% |
School Enrollment by Age by Funding Source in Payson
Out of a total of 7,106 students who are enrolled in schools in Payson, 902 (12.7%) attend a private institution, while the remaining 6,204 (87.3%) are enrolled in public schools. The age group of 3 to 4 year olds has the highest likelihood of being enrolled in private schools, with 86 (55.8% in the age bracket) enrolled. Conversely, the age group of 10 to 14 year olds has the lowest likelihood of being enrolled in a private school, with 2,117 (94.7% in the age bracket) attending a public institution.
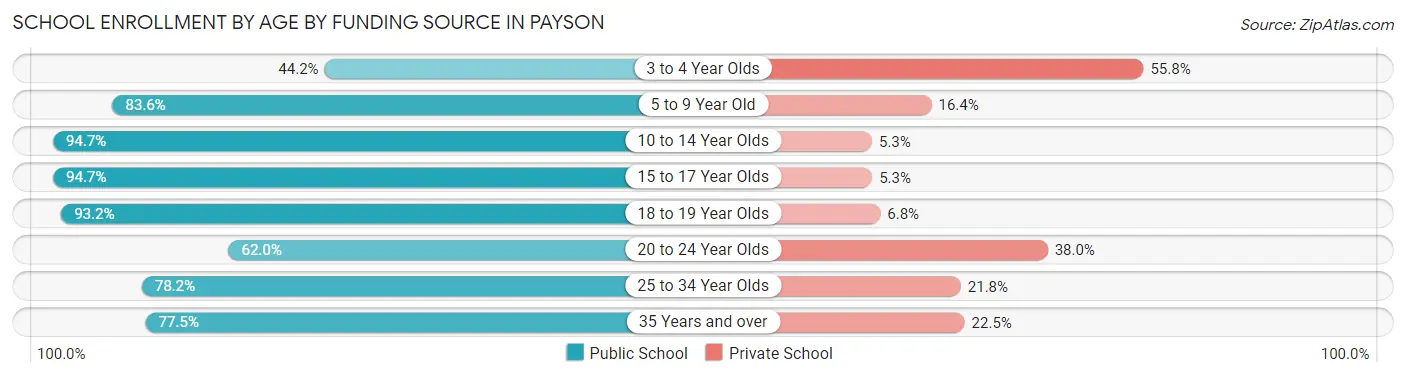
| Age Bracket | Public School | Private School |
| 3 to 4 Year Olds | 68 (44.2%) | 86 (55.8%) |
| 5 to 9 Year Old | 1,304 (83.6%) | 255 (16.4%) |
| 10 to 14 Year Olds | 2,117 (94.7%) | 118 (5.3%) |
| 15 to 17 Year Olds | 1,334 (94.7%) | 75 (5.3%) |
| 18 to 19 Year Olds | 655 (93.2%) | 48 (6.8%) |
| 20 to 24 Year Olds | 341 (62.0%) | 209 (38.0%) |
| 25 to 34 Year Olds | 197 (78.2%) | 55 (21.8%) |
| 35 Years and over | 189 (77.5%) | 55 (22.5%) |
| Total | 6,204 (87.3%) | 902 (12.7%) |
Educational Attainment by Field of Study in Payson
Business (773 | 24.2%), education (693 | 21.7%), science & technology (374 | 11.7%), arts & humanities (211 | 6.6%), and computers & mathematics (207 | 6.5%) are the most common fields of study among 3,196 individuals in Payson who have obtained a bachelor's degree or higher.
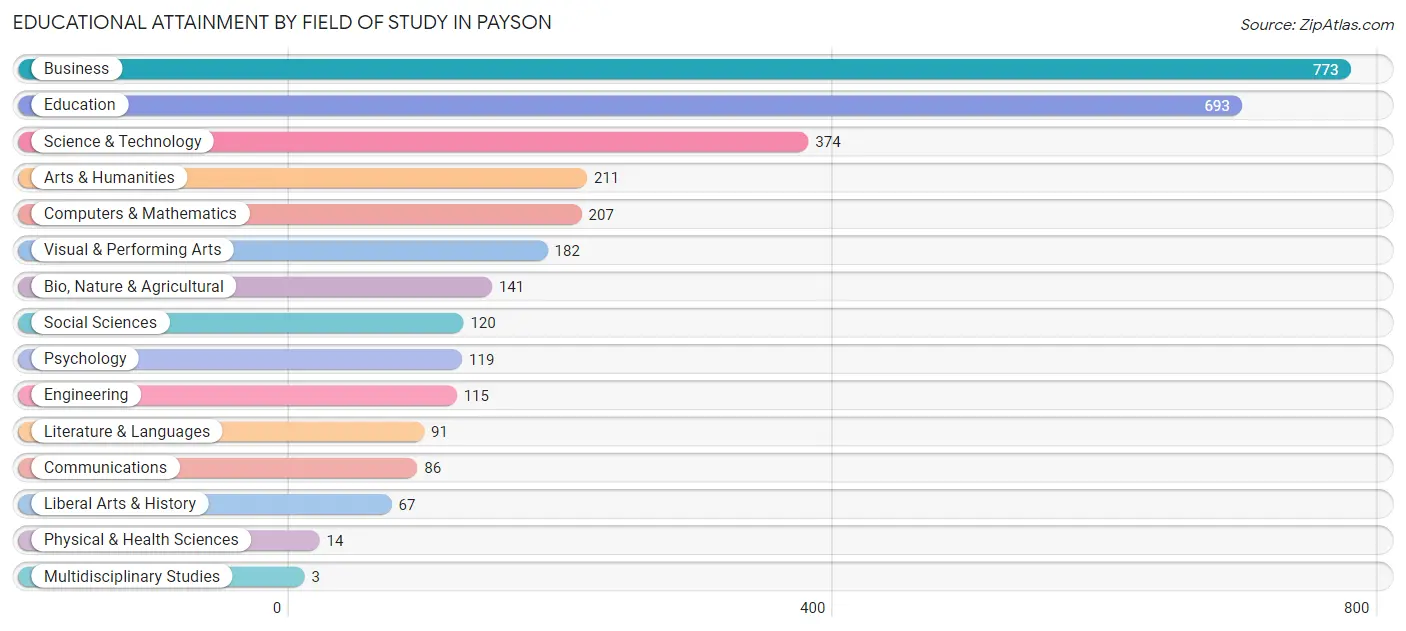
| Field of Study | # Graduates | % Graduates |
| Computers & Mathematics | 207 | 6.5% |
| Bio, Nature & Agricultural | 141 | 4.4% |
| Physical & Health Sciences | 14 | 0.4% |
| Psychology | 119 | 3.7% |
| Social Sciences | 120 | 3.7% |
| Engineering | 115 | 3.6% |
| Multidisciplinary Studies | 3 | 0.1% |
| Science & Technology | 374 | 11.7% |
| Business | 773 | 24.2% |
| Education | 693 | 21.7% |
| Literature & Languages | 91 | 2.9% |
| Liberal Arts & History | 67 | 2.1% |
| Visual & Performing Arts | 182 | 5.7% |
| Communications | 86 | 2.7% |
| Arts & Humanities | 211 | 6.6% |
| Total | 3,196 | 100.0% |
Transportation & Commute in Payson
Vehicle Availability by Sex in Payson
The most prevalent vehicle ownership categories in Payson are males with 2 vehicles (1,927, accounting for 34.2%) and females with 2 vehicles (1,506, making up 41.3%).
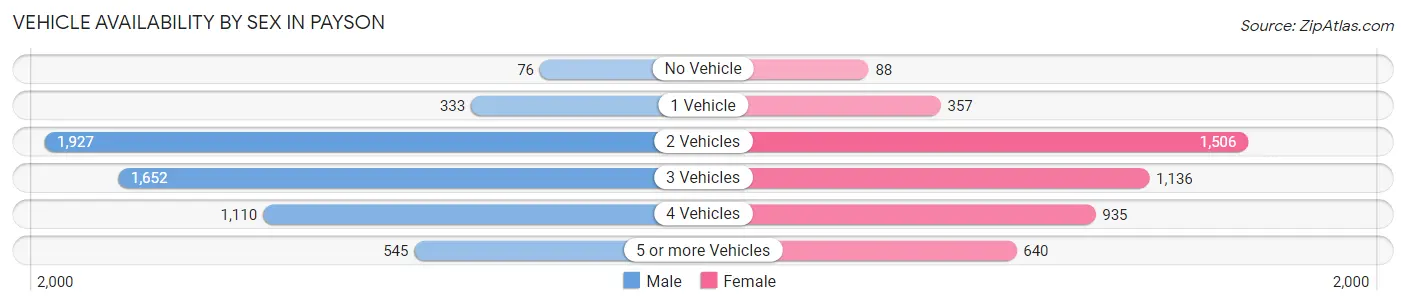
| Vehicles Available | Male | Female |
| No Vehicle | 76 (1.3%) | 88 (1.9%) |
| 1 Vehicle | 333 (5.9%) | 357 (7.7%) |
| 2 Vehicles | 1,927 (34.2%) | 1,506 (32.3%) |
| 3 Vehicles | 1,652 (29.3%) | 1,136 (24.4%) |
| 4 Vehicles | 1,110 (19.7%) | 935 (20.1%) |
| 5 or more Vehicles | 545 (9.7%) | 640 (13.7%) |
| Total | 5,643 (100.0%) | 4,662 (100.0%) |
Commute Time in Payson
The most frequently occuring commute durations in Payson are 15 to 19 minutes (1,919 commuters, 20.8%), 20 to 24 minutes (1,539 commuters, 16.7%), and 5 to 9 minutes (1,383 commuters, 15.0%).
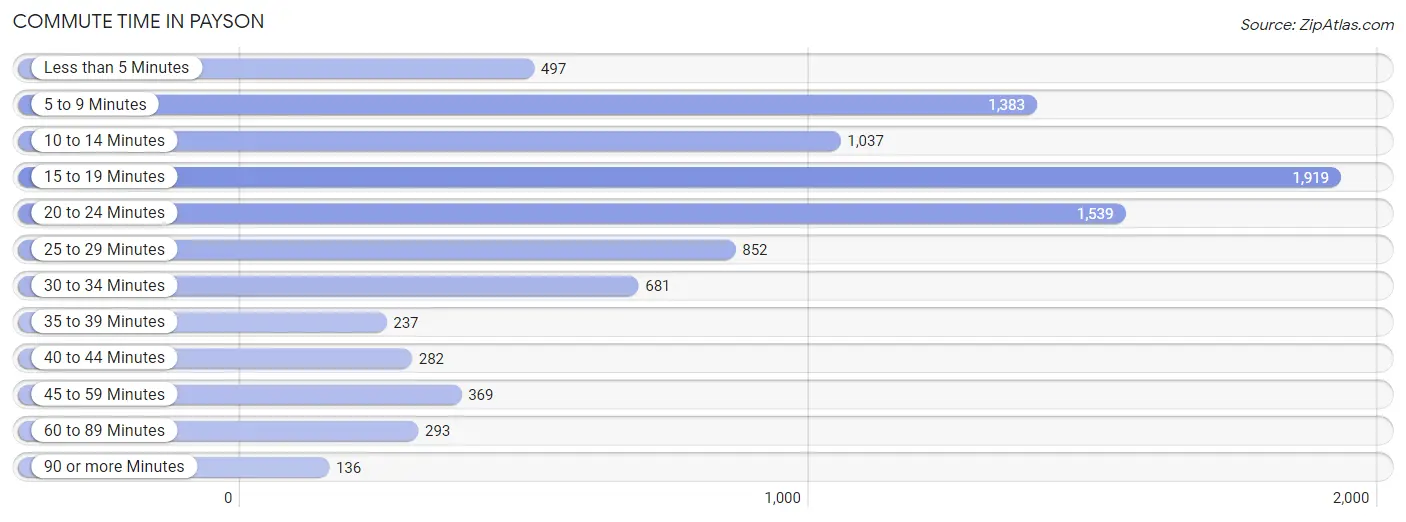
| Commute Time | # Commuters | % Commuters |
| Less than 5 Minutes | 497 | 5.4% |
| 5 to 9 Minutes | 1,383 | 15.0% |
| 10 to 14 Minutes | 1,037 | 11.2% |
| 15 to 19 Minutes | 1,919 | 20.8% |
| 20 to 24 Minutes | 1,539 | 16.7% |
| 25 to 29 Minutes | 852 | 9.2% |
| 30 to 34 Minutes | 681 | 7.4% |
| 35 to 39 Minutes | 237 | 2.6% |
| 40 to 44 Minutes | 282 | 3.1% |
| 45 to 59 Minutes | 369 | 4.0% |
| 60 to 89 Minutes | 293 | 3.2% |
| 90 or more Minutes | 136 | 1.5% |
Commute Time by Sex in Payson
The most common commute times in Payson are 15 to 19 minutes (1,164 commuters, 22.7%) for males and 5 to 9 minutes (862 commuters, 21.0%) for females.
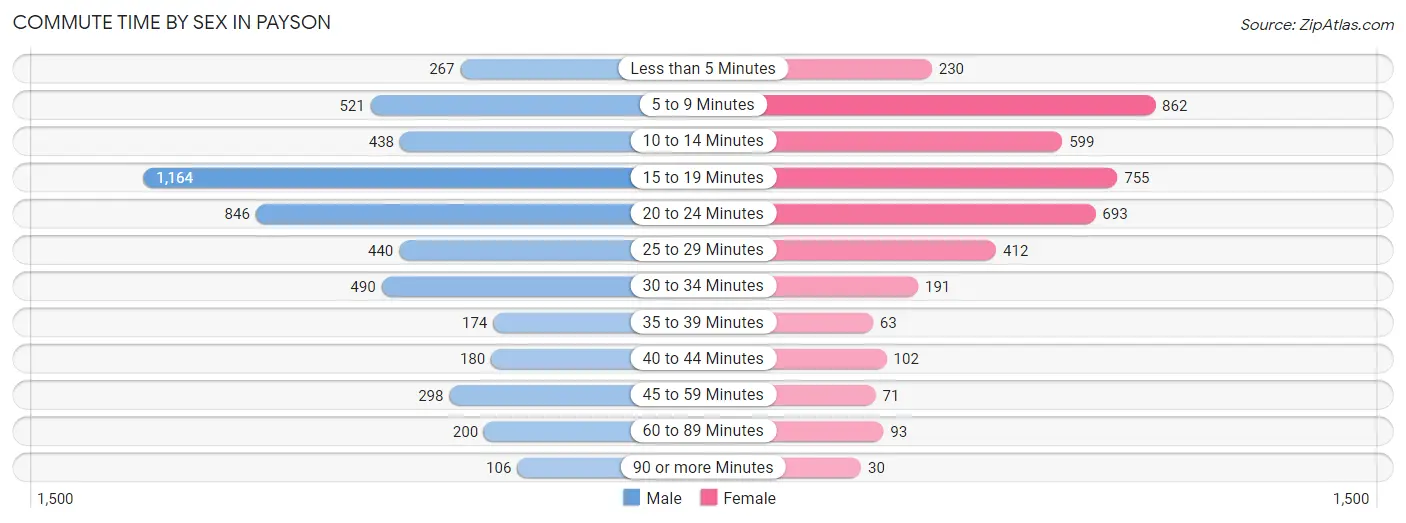
| Commute Time | Male | Female |
| Less than 5 Minutes | 267 (5.2%) | 230 (5.6%) |
| 5 to 9 Minutes | 521 (10.2%) | 862 (21.0%) |
| 10 to 14 Minutes | 438 (8.6%) | 599 (14.6%) |
| 15 to 19 Minutes | 1,164 (22.7%) | 755 (18.4%) |
| 20 to 24 Minutes | 846 (16.5%) | 693 (16.9%) |
| 25 to 29 Minutes | 440 (8.6%) | 412 (10.1%) |
| 30 to 34 Minutes | 490 (9.6%) | 191 (4.7%) |
| 35 to 39 Minutes | 174 (3.4%) | 63 (1.5%) |
| 40 to 44 Minutes | 180 (3.5%) | 102 (2.5%) |
| 45 to 59 Minutes | 298 (5.8%) | 71 (1.7%) |
| 60 to 89 Minutes | 200 (3.9%) | 93 (2.3%) |
| 90 or more Minutes | 106 (2.1%) | 30 (0.7%) |
Time of Departure to Work by Sex in Payson
The most frequent times of departure to work in Payson are 8:00 AM to 8:29 AM (767, 15.0%) for males and 12:00 PM to 3:59 PM (668, 16.3%) for females.
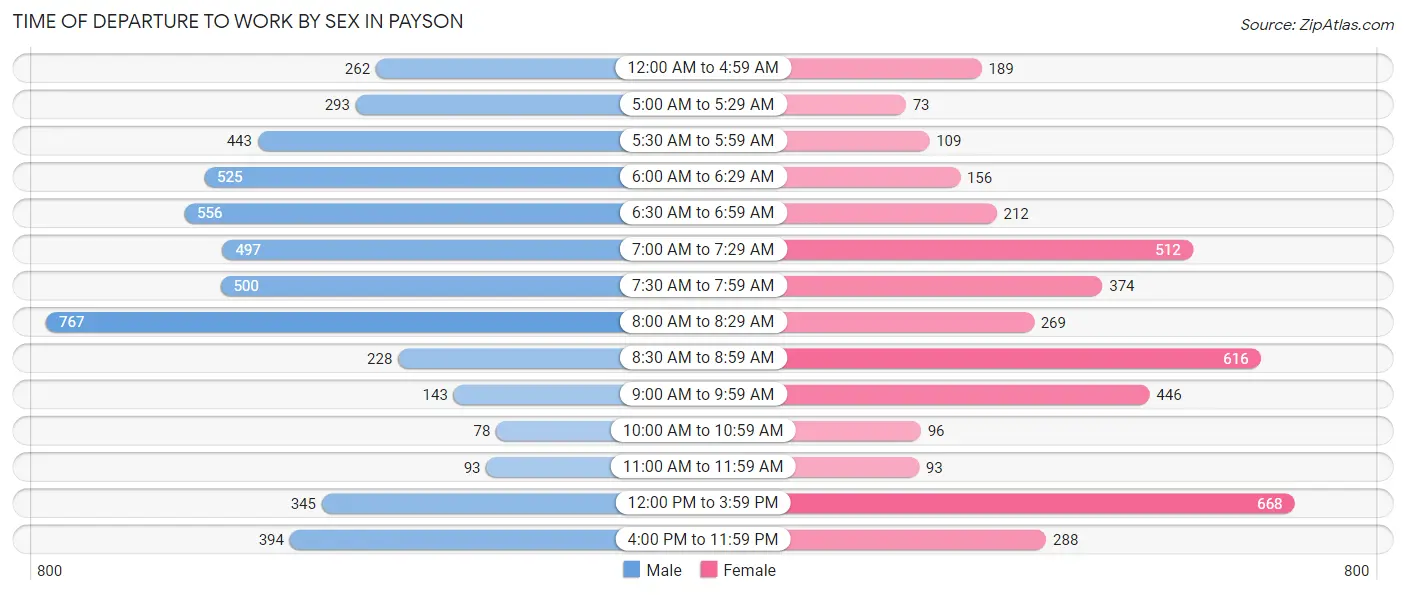
| Time of Departure | Male | Female |
| 12:00 AM to 4:59 AM | 262 (5.1%) | 189 (4.6%) |
| 5:00 AM to 5:29 AM | 293 (5.7%) | 73 (1.8%) |
| 5:30 AM to 5:59 AM | 443 (8.6%) | 109 (2.7%) |
| 6:00 AM to 6:29 AM | 525 (10.2%) | 156 (3.8%) |
| 6:30 AM to 6:59 AM | 556 (10.8%) | 212 (5.2%) |
| 7:00 AM to 7:29 AM | 497 (9.7%) | 512 (12.5%) |
| 7:30 AM to 7:59 AM | 500 (9.8%) | 374 (9.1%) |
| 8:00 AM to 8:29 AM | 767 (15.0%) | 269 (6.6%) |
| 8:30 AM to 8:59 AM | 228 (4.4%) | 616 (15.0%) |
| 9:00 AM to 9:59 AM | 143 (2.8%) | 446 (10.9%) |
| 10:00 AM to 10:59 AM | 78 (1.5%) | 96 (2.3%) |
| 11:00 AM to 11:59 AM | 93 (1.8%) | 93 (2.3%) |
| 12:00 PM to 3:59 PM | 345 (6.7%) | 668 (16.3%) |
| 4:00 PM to 11:59 PM | 394 (7.7%) | 288 (7.0%) |
| Total | 5,124 (100.0%) | 4,101 (100.0%) |
Housing Occupancy in Payson
Occupancy by Ownership in Payson
Of the total 6,150 dwellings in Payson, owner-occupied units account for 4,999 (81.3%), while renter-occupied units make up 1,151 (18.7%).
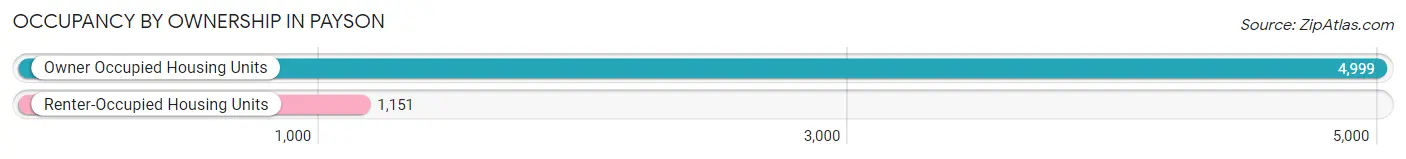
| Occupancy | # Housing Units | % Housing Units |
| Owner Occupied Housing Units | 4,999 | 81.3% |
| Renter-Occupied Housing Units | 1,151 | 18.7% |
| Total Occupied Housing Units | 6,150 | 100.0% |
Occupancy by Household Size in Payson
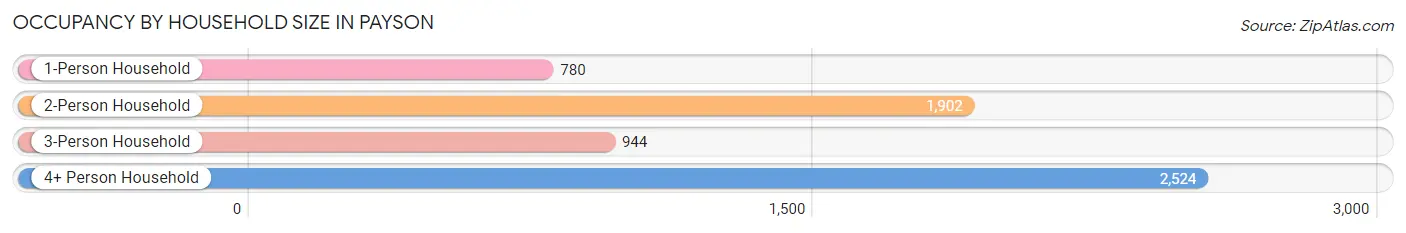
| Household Size | # Housing Units | % Housing Units |
| 1-Person Household | 780 | 12.7% |
| 2-Person Household | 1,902 | 30.9% |
| 3-Person Household | 944 | 15.3% |
| 4+ Person Household | 2,524 | 41.0% |
| Total Housing Units | 6,150 | 100.0% |
Occupancy by Ownership by Household Size in Payson
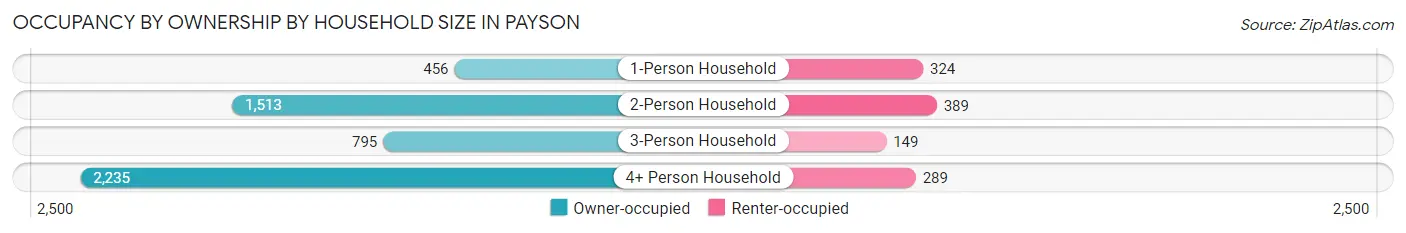
| Household Size | Owner-occupied | Renter-occupied |
| 1-Person Household | 456 (58.5%) | 324 (41.5%) |
| 2-Person Household | 1,513 (79.5%) | 389 (20.4%) |
| 3-Person Household | 795 (84.2%) | 149 (15.8%) |
| 4+ Person Household | 2,235 (88.5%) | 289 (11.5%) |
| Total Housing Units | 4,999 (81.3%) | 1,151 (18.7%) |
Occupancy by Educational Attainment in Payson
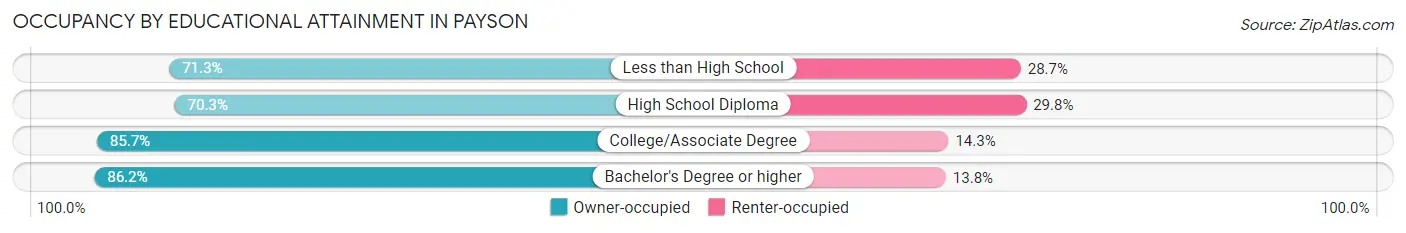
| Household Size | Owner-occupied | Renter-occupied |
| Less than High School | 281 (71.3%) | 113 (28.7%) |
| High School Diploma | 1,006 (70.3%) | 426 (29.7%) |
| College/Associate Degree | 2,347 (85.7%) | 393 (14.3%) |
| Bachelor's Degree or higher | 1,365 (86.2%) | 219 (13.8%) |
Occupancy by Age of Householder in Payson
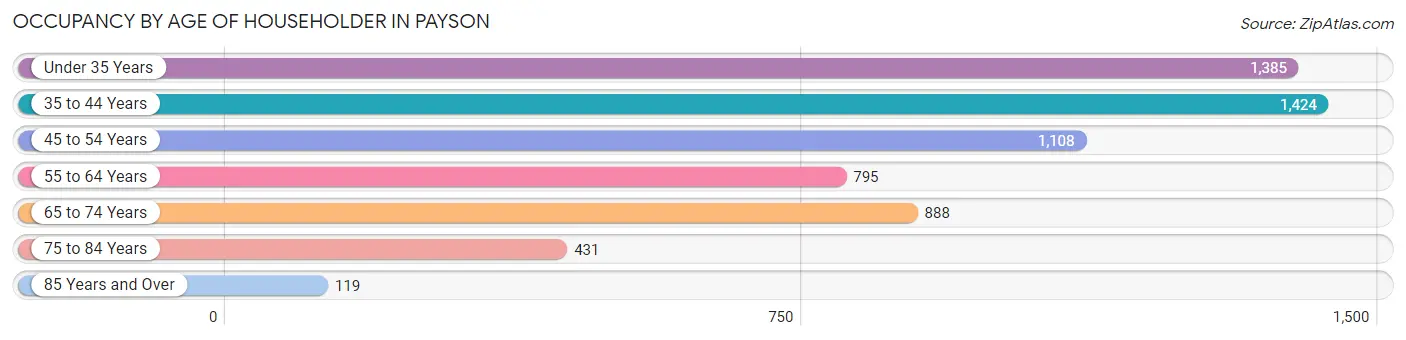
| Age Bracket | # Households | % Households |
| Under 35 Years | 1,385 | 22.5% |
| 35 to 44 Years | 1,424 | 23.2% |
| 45 to 54 Years | 1,108 | 18.0% |
| 55 to 64 Years | 795 | 12.9% |
| 65 to 74 Years | 888 | 14.4% |
| 75 to 84 Years | 431 | 7.0% |
| 85 Years and Over | 119 | 1.9% |
| Total | 6,150 | 100.0% |
Housing Finances in Payson
Median Income by Occupancy in Payson
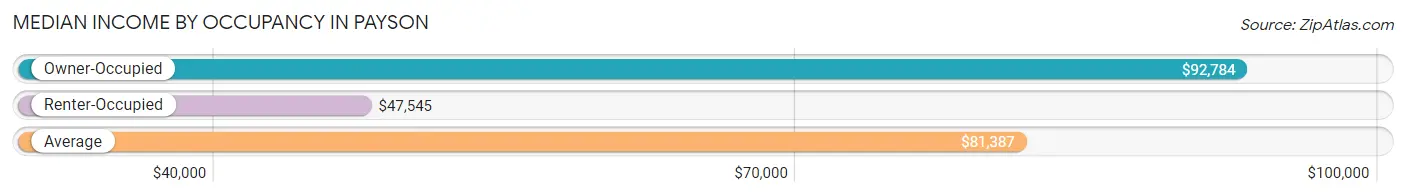
| Occupancy Type | # Households | Median Income |
| Owner-Occupied | 4,999 (81.3%) | $92,784 |
| Renter-Occupied | 1,151 (18.7%) | $47,545 |
| Average | 6,150 (100.0%) | $81,387 |
Occupancy by Householder Income Bracket in Payson
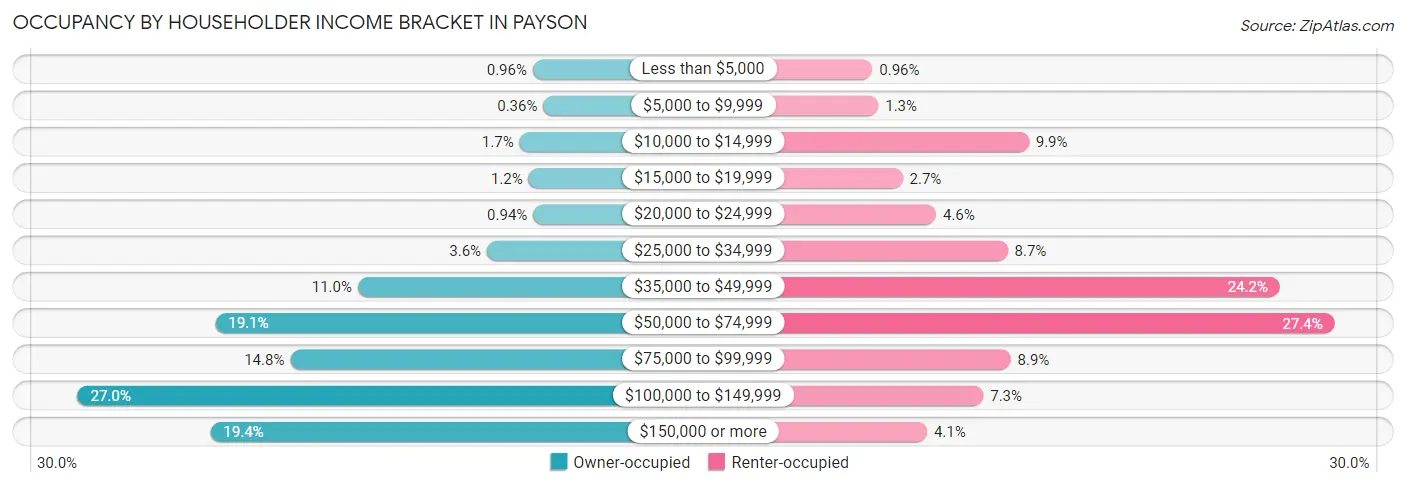
| Income Bracket | Owner-occupied | Renter-occupied |
| Less than $5,000 | 48 (1.0%) | 11 (1.0%) |
| $5,000 to $9,999 | 18 (0.4%) | 15 (1.3%) |
| $10,000 to $14,999 | 86 (1.7%) | 114 (9.9%) |
| $15,000 to $19,999 | 60 (1.2%) | 31 (2.7%) |
| $20,000 to $24,999 | 47 (0.9%) | 53 (4.6%) |
| $25,000 to $34,999 | 179 (3.6%) | 100 (8.7%) |
| $35,000 to $49,999 | 548 (11.0%) | 279 (24.2%) |
| $50,000 to $74,999 | 955 (19.1%) | 315 (27.4%) |
| $75,000 to $99,999 | 741 (14.8%) | 102 (8.9%) |
| $100,000 to $149,999 | 1,348 (27.0%) | 84 (7.3%) |
| $150,000 or more | 969 (19.4%) | 47 (4.1%) |
| Total | 4,999 (100.0%) | 1,151 (100.0%) |
Monthly Housing Cost Tiers in Payson
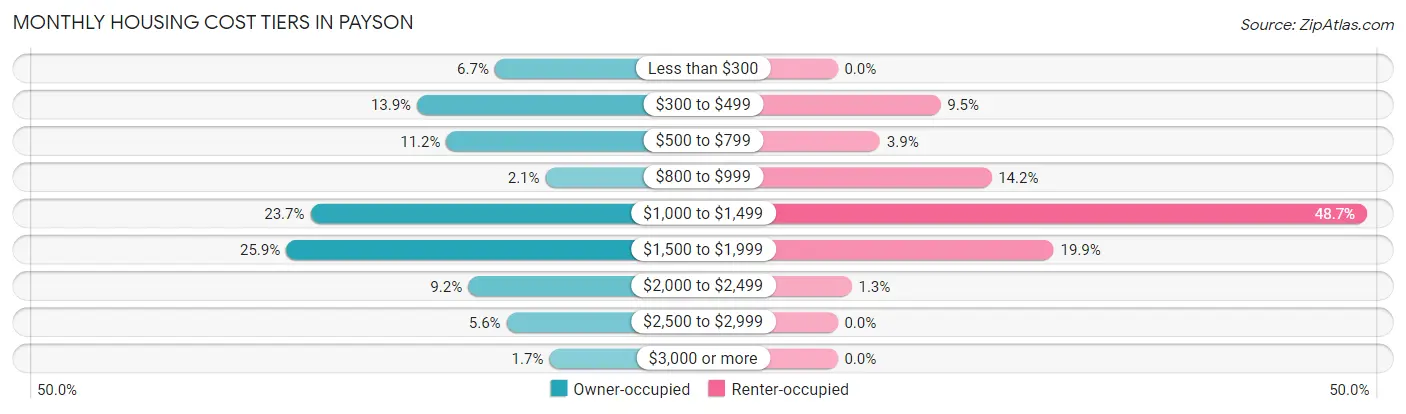
| Monthly Cost | Owner-occupied | Renter-occupied |
| Less than $300 | 336 (6.7%) | 0 (0.0%) |
| $300 to $499 | 694 (13.9%) | 109 (9.5%) |
| $500 to $799 | 559 (11.2%) | 45 (3.9%) |
| $800 to $999 | 103 (2.1%) | 163 (14.2%) |
| $1,000 to $1,499 | 1,185 (23.7%) | 561 (48.7%) |
| $1,500 to $1,999 | 1,296 (25.9%) | 229 (19.9%) |
| $2,000 to $2,499 | 459 (9.2%) | 15 (1.3%) |
| $2,500 to $2,999 | 282 (5.6%) | 0 (0.0%) |
| $3,000 or more | 85 (1.7%) | 0 (0.0%) |
| Total | 4,999 (100.0%) | 1,151 (100.0%) |
Physical Housing Characteristics in Payson
Housing Structures in Payson
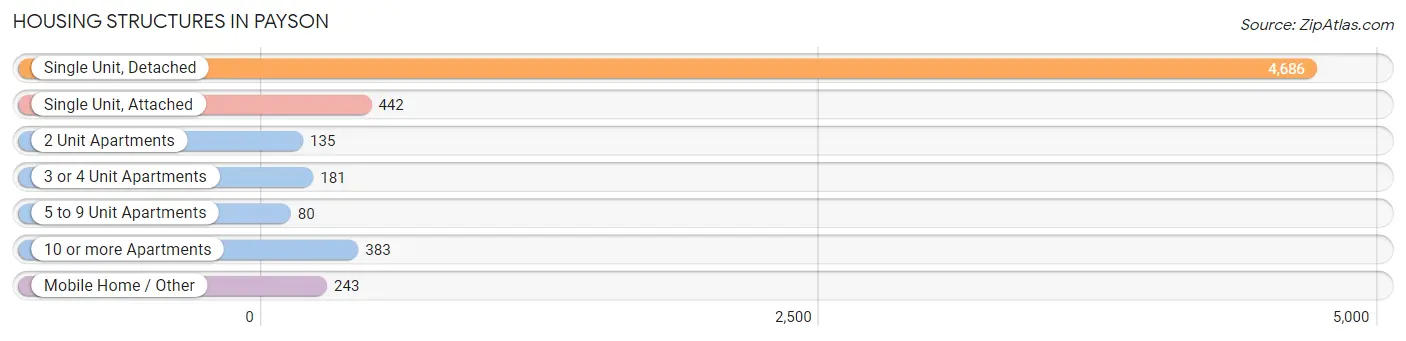
| Structure Type | # Housing Units | % Housing Units |
| Single Unit, Detached | 4,686 | 76.2% |
| Single Unit, Attached | 442 | 7.2% |
| 2 Unit Apartments | 135 | 2.2% |
| 3 or 4 Unit Apartments | 181 | 2.9% |
| 5 to 9 Unit Apartments | 80 | 1.3% |
| 10 or more Apartments | 383 | 6.2% |
| Mobile Home / Other | 243 | 4.0% |
| Total | 6,150 | 100.0% |
Housing Structures by Occupancy in Payson
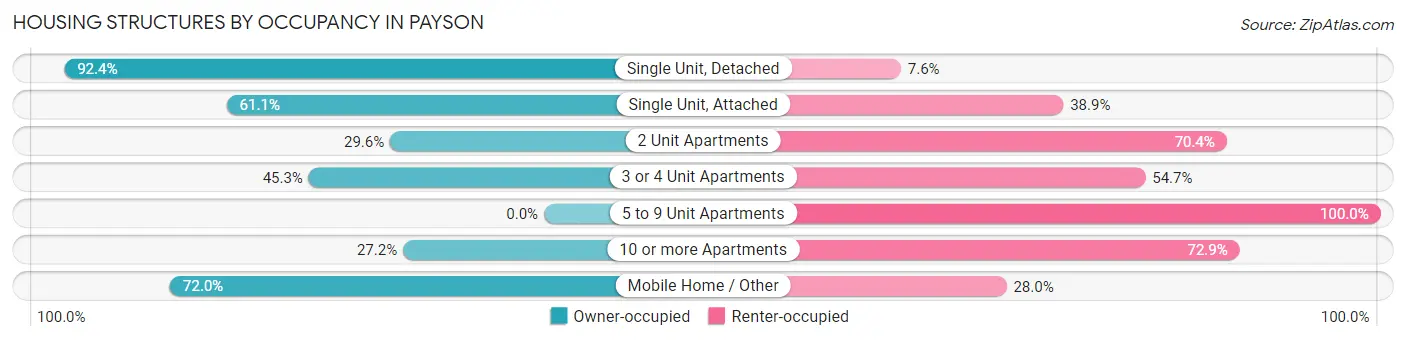
| Structure Type | Owner-occupied | Renter-occupied |
| Single Unit, Detached | 4,328 (92.4%) | 358 (7.6%) |
| Single Unit, Attached | 270 (61.1%) | 172 (38.9%) |
| 2 Unit Apartments | 40 (29.6%) | 95 (70.4%) |
| 3 or 4 Unit Apartments | 82 (45.3%) | 99 (54.7%) |
| 5 to 9 Unit Apartments | 0 (0.0%) | 80 (100.0%) |
| 10 or more Apartments | 104 (27.2%) | 279 (72.9%) |
| Mobile Home / Other | 175 (72.0%) | 68 (28.0%) |
| Total | 4,999 (81.3%) | 1,151 (18.7%) |
Housing Structures by Number of Rooms in Payson
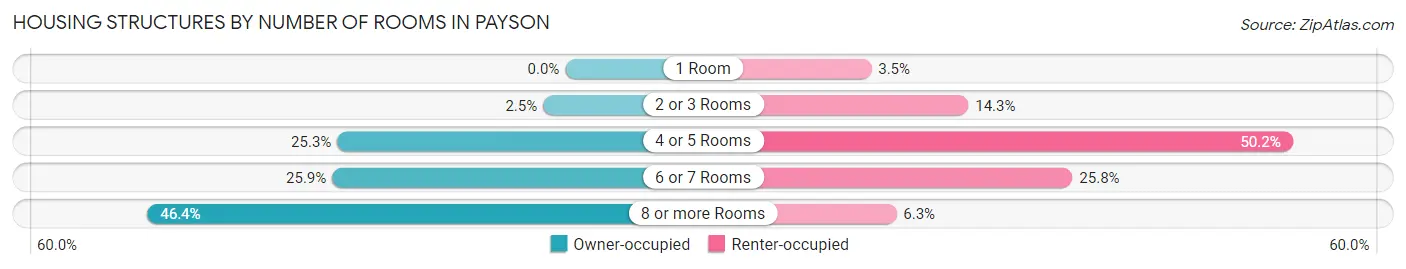
| Number of Rooms | Owner-occupied | Renter-occupied |
| 1 Room | 0 (0.0%) | 40 (3.5%) |
| 2 or 3 Rooms | 123 (2.5%) | 164 (14.2%) |
| 4 or 5 Rooms | 1,265 (25.3%) | 578 (50.2%) |
| 6 or 7 Rooms | 1,293 (25.9%) | 297 (25.8%) |
| 8 or more Rooms | 2,318 (46.4%) | 72 (6.3%) |
| Total | 4,999 (100.0%) | 1,151 (100.0%) |
Housing Structure by Heating Type in Payson
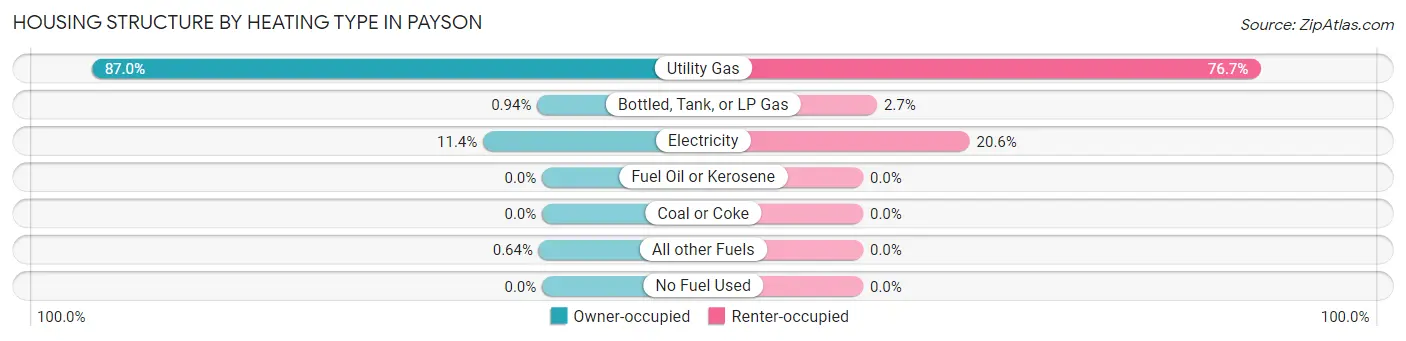
| Heating Type | Owner-occupied | Renter-occupied |
| Utility Gas | 4,350 (87.0%) | 883 (76.7%) |
| Bottled, Tank, or LP Gas | 47 (0.9%) | 31 (2.7%) |
| Electricity | 570 (11.4%) | 237 (20.6%) |
| Fuel Oil or Kerosene | 0 (0.0%) | 0 (0.0%) |
| Coal or Coke | 0 (0.0%) | 0 (0.0%) |
| All other Fuels | 32 (0.6%) | 0 (0.0%) |
| No Fuel Used | 0 (0.0%) | 0 (0.0%) |
| Total | 4,999 (100.0%) | 1,151 (100.0%) |
Household Vehicle Usage in Payson
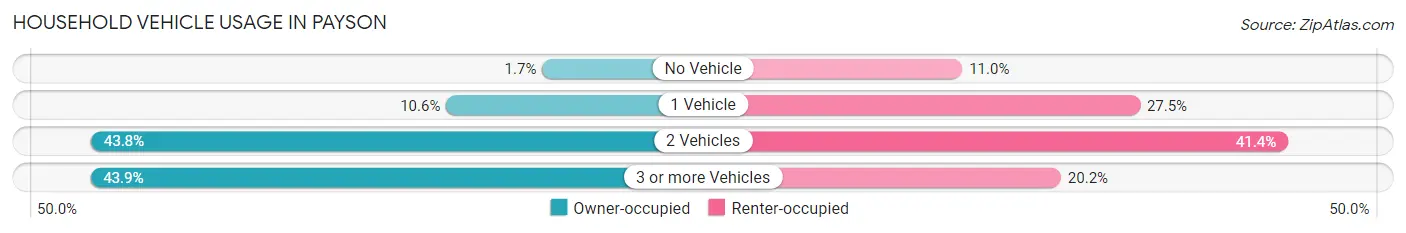
| Vehicles per Household | Owner-occupied | Renter-occupied |
| No Vehicle | 84 (1.7%) | 126 (11.0%) |
| 1 Vehicle | 532 (10.6%) | 317 (27.5%) |
| 2 Vehicles | 2,190 (43.8%) | 476 (41.4%) |
| 3 or more Vehicles | 2,193 (43.9%) | 232 (20.2%) |
| Total | 4,999 (100.0%) | 1,151 (100.0%) |
Real Estate & Mortgages in Payson
Real Estate and Mortgage Overview in Payson
| Characteristic | Without Mortgage | With Mortgage |
| Housing Units | 1,570 | 3,429 |
| Median Property Value | $304,400 | $353,500 |
| Median Household Income | $65,729 | $761 |
| Monthly Housing Costs | $443 | $85 |
| Real Estate Taxes | $1,560 | $131 |
Property Value by Mortgage Status in Payson
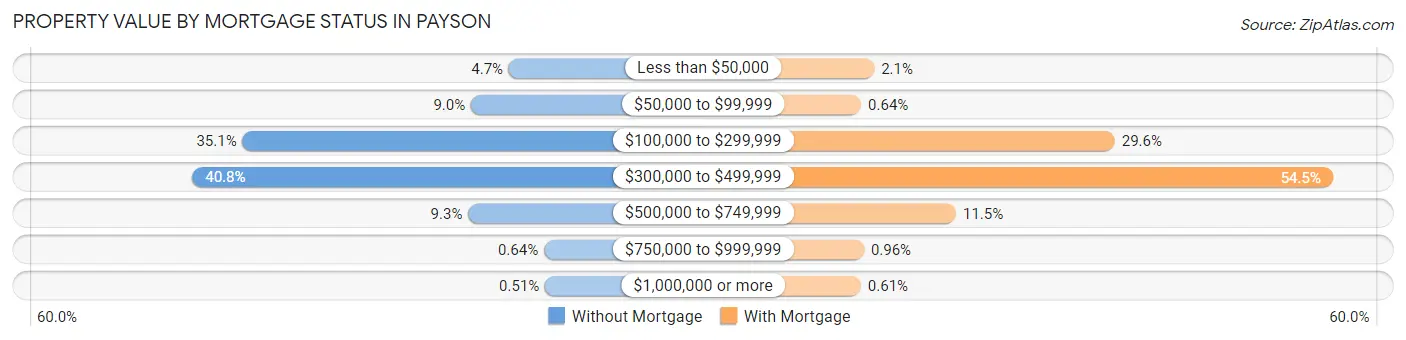
| Property Value | Without Mortgage | With Mortgage |
| Less than $50,000 | 73 (4.6%) | 73 (2.1%) |
| $50,000 to $99,999 | 141 (9.0%) | 22 (0.6%) |
| $100,000 to $299,999 | 551 (35.1%) | 1,016 (29.6%) |
| $300,000 to $499,999 | 641 (40.8%) | 1,870 (54.5%) |
| $500,000 to $749,999 | 146 (9.3%) | 394 (11.5%) |
| $750,000 to $999,999 | 10 (0.6%) | 33 (1.0%) |
| $1,000,000 or more | 8 (0.5%) | 21 (0.6%) |
| Total | 1,570 (100.0%) | 3,429 (100.0%) |
Household Income by Mortgage Status in Payson
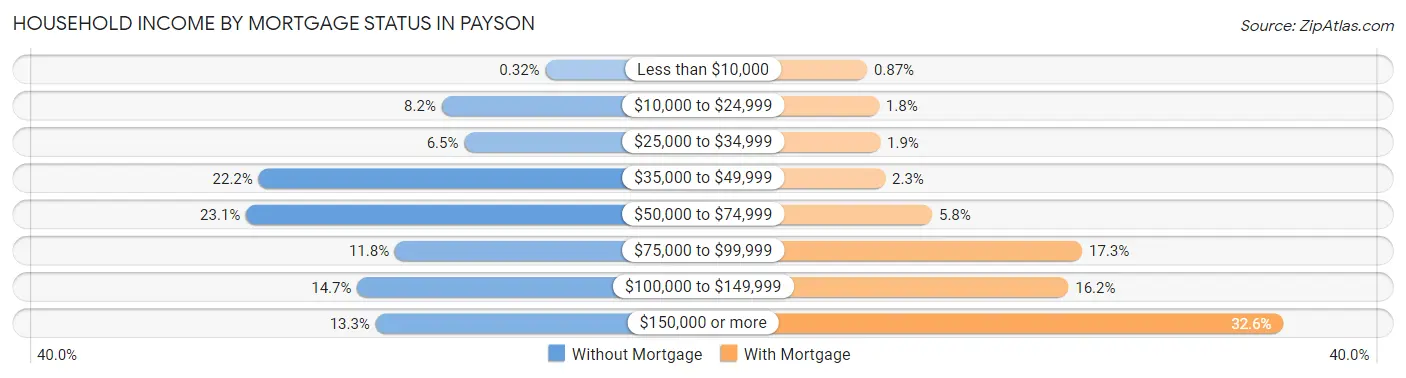
| Household Income | Without Mortgage | With Mortgage |
| Less than $10,000 | 5 (0.3%) | 30 (0.9%) |
| $10,000 to $24,999 | 129 (8.2%) | 61 (1.8%) |
| $25,000 to $34,999 | 102 (6.5%) | 64 (1.9%) |
| $35,000 to $49,999 | 348 (22.2%) | 77 (2.2%) |
| $50,000 to $74,999 | 363 (23.1%) | 200 (5.8%) |
| $75,000 to $99,999 | 185 (11.8%) | 592 (17.3%) |
| $100,000 to $149,999 | 230 (14.6%) | 556 (16.2%) |
| $150,000 or more | 208 (13.3%) | 1,118 (32.6%) |
| Total | 1,570 (100.0%) | 3,429 (100.0%) |
Property Value to Household Income Ratio in Payson
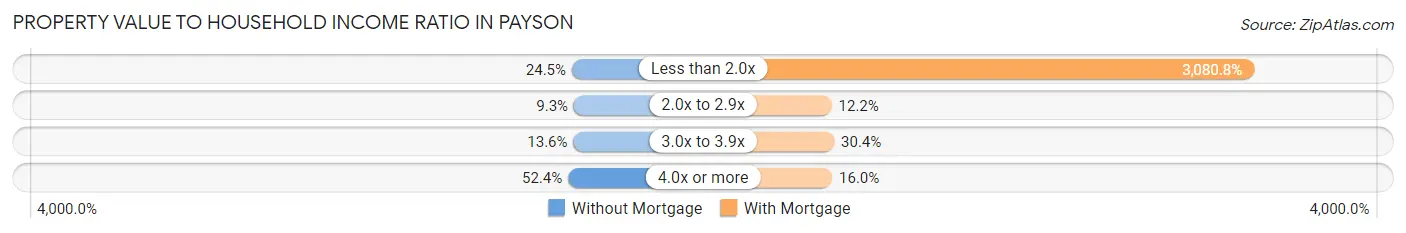
| Value-to-Income Ratio | Without Mortgage | With Mortgage |
| Less than 2.0x | 384 (24.5%) | 105,642 (3,080.8%) |
| 2.0x to 2.9x | 146 (9.3%) | 417 (12.2%) |
| 3.0x to 3.9x | 213 (13.6%) | 1,041 (30.4%) |
| 4.0x or more | 822 (52.4%) | 549 (16.0%) |
| Total | 1,570 (100.0%) | 3,429 (100.0%) |
Real Estate Taxes by Mortgage Status in Payson
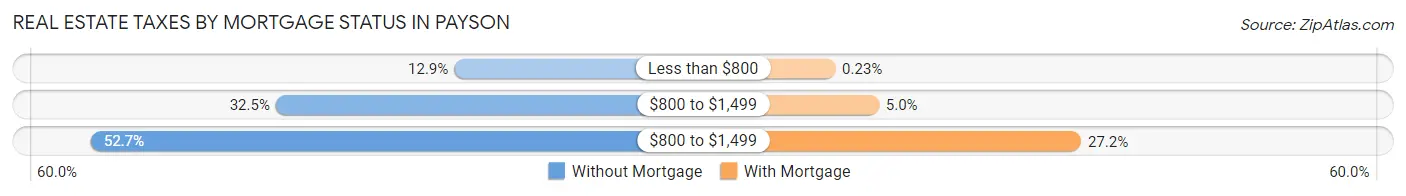
| Property Taxes | Without Mortgage | With Mortgage |
| Less than $800 | 203 (12.9%) | 8 (0.2%) |
| $800 to $1,499 | 510 (32.5%) | 172 (5.0%) |
| $800 to $1,499 | 828 (52.7%) | 932 (27.2%) |
| Total | 1,570 (100.0%) | 3,429 (100.0%) |
Health & Disability in Payson
Health Insurance Coverage by Age in Payson
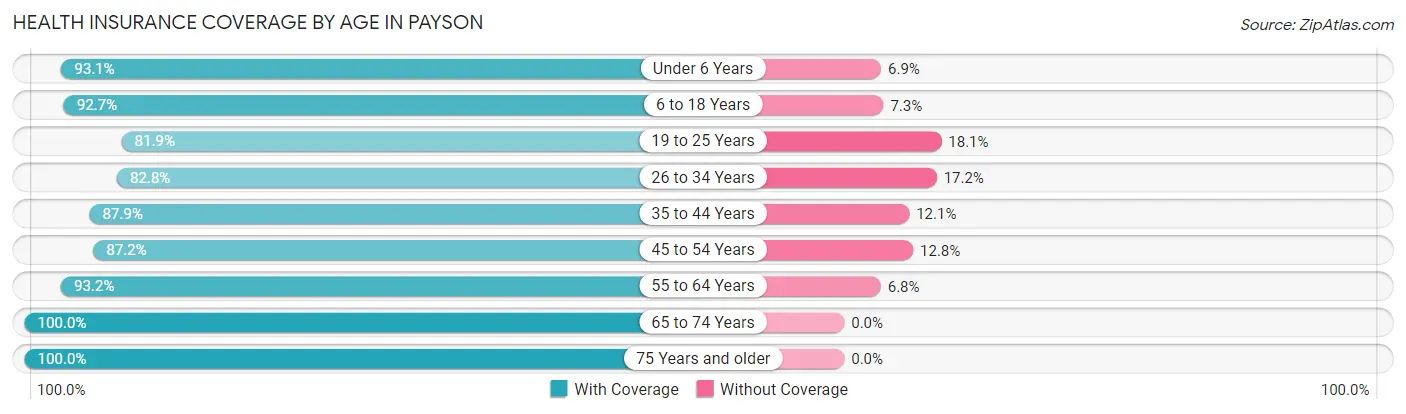
| Age Bracket | With Coverage | Without Coverage |
| Under 6 Years | 1,602 (93.1%) | 118 (6.9%) |
| 6 to 18 Years | 5,415 (92.7%) | 427 (7.3%) |
| 19 to 25 Years | 2,113 (81.9%) | 467 (18.1%) |
| 26 to 34 Years | 2,047 (82.8%) | 426 (17.2%) |
| 35 to 44 Years | 2,511 (87.9%) | 346 (12.1%) |
| 45 to 54 Years | 1,835 (87.2%) | 270 (12.8%) |
| 55 to 64 Years | 1,368 (93.2%) | 100 (6.8%) |
| 65 to 74 Years | 1,571 (100.0%) | 0 (0.0%) |
| 75 Years and older | 827 (100.0%) | 0 (0.0%) |
| Total | 19,289 (89.9%) | 2,154 (10.1%) |
Health Insurance Coverage by Citizenship Status in Payson
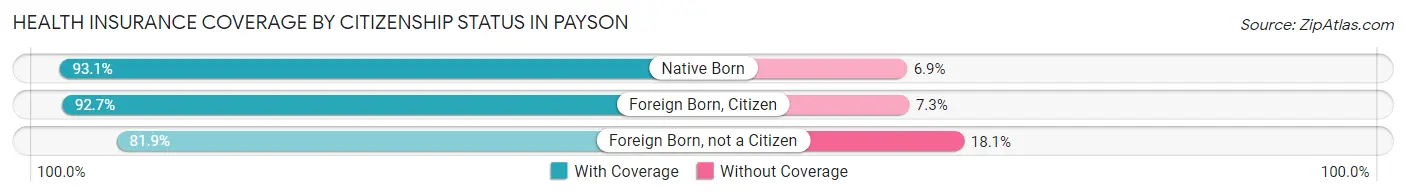
| Citizenship Status | With Coverage | Without Coverage |
| Native Born | 1,602 (93.1%) | 118 (6.9%) |
| Foreign Born, Citizen | 5,415 (92.7%) | 427 (7.3%) |
| Foreign Born, not a Citizen | 2,113 (81.9%) | 467 (18.1%) |
Health Insurance Coverage by Household Income in Payson
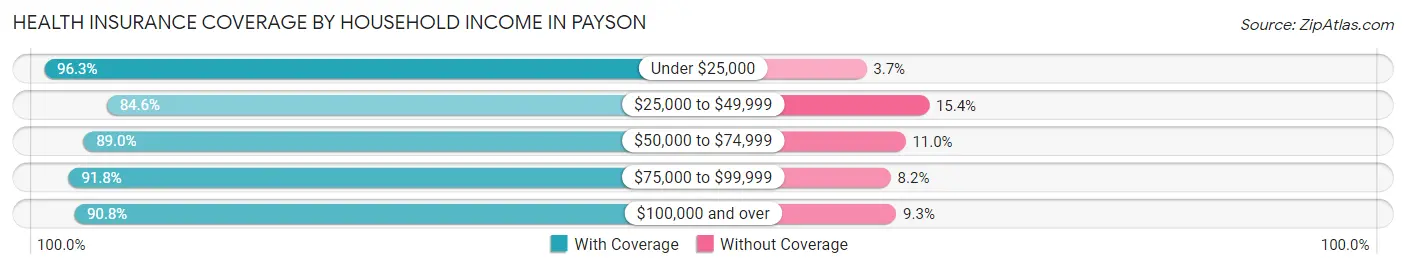
| Household Income | With Coverage | Without Coverage |
| Under $25,000 | 843 (96.3%) | 32 (3.7%) |
| $25,000 to $49,999 | 2,166 (84.6%) | 394 (15.4%) |
| $50,000 to $74,999 | 3,298 (89.0%) | 407 (11.0%) |
| $75,000 to $99,999 | 2,557 (91.8%) | 229 (8.2%) |
| $100,000 and over | 10,338 (90.7%) | 1,054 (9.2%) |
Public vs Private Health Insurance Coverage by Age in Payson
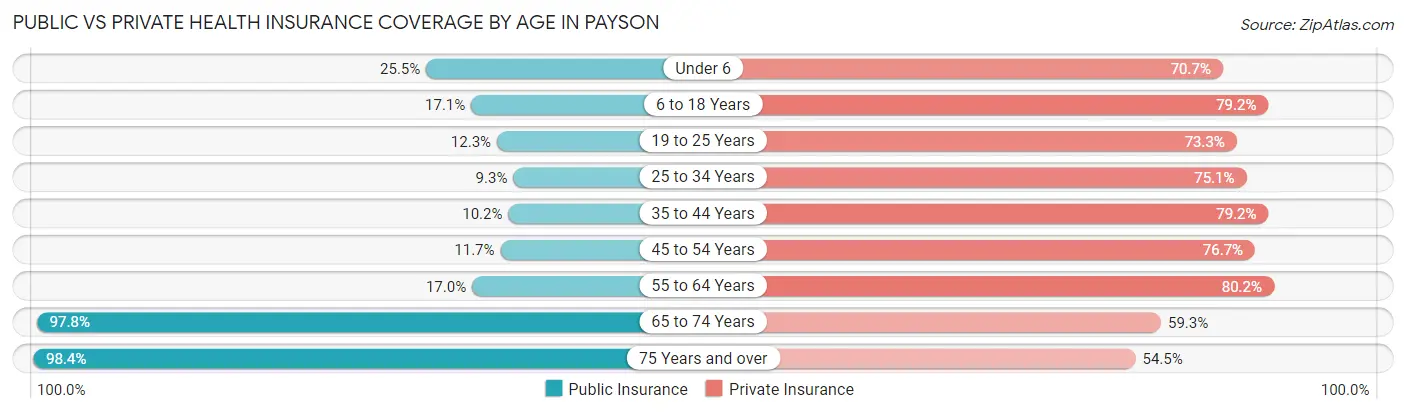
| Age Bracket | Public Insurance | Private Insurance |
| Under 6 | 438 (25.5%) | 1,216 (70.7%) |
| 6 to 18 Years | 1,000 (17.1%) | 4,624 (79.1%) |
| 19 to 25 Years | 318 (12.3%) | 1,891 (73.3%) |
| 25 to 34 Years | 230 (9.3%) | 1,857 (75.1%) |
| 35 to 44 Years | 292 (10.2%) | 2,262 (79.2%) |
| 45 to 54 Years | 246 (11.7%) | 1,614 (76.7%) |
| 55 to 64 Years | 249 (17.0%) | 1,177 (80.2%) |
| 65 to 74 Years | 1,536 (97.8%) | 931 (59.3%) |
| 75 Years and over | 814 (98.4%) | 451 (54.5%) |
| Total | 5,123 (23.9%) | 16,023 (74.7%) |
Disability Status by Sex by Age in Payson
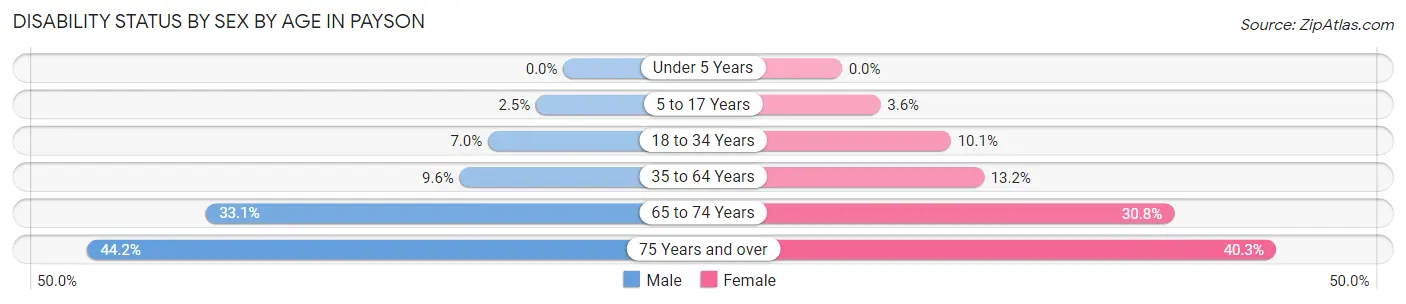
| Age Bracket | Male | Female |
| Under 5 Years | 0 (0.0%) | 0 (0.0%) |
| 5 to 17 Years | 81 (2.5%) | 79 (3.6%) |
| 18 to 34 Years | 224 (7.0%) | 268 (10.1%) |
| 35 to 64 Years | 308 (9.6%) | 425 (13.2%) |
| 65 to 74 Years | 225 (33.1%) | 275 (30.8%) |
| 75 Years and over | 204 (44.2%) | 147 (40.3%) |
Disability Class by Sex by Age in Payson
Disability Class: Hearing Difficulty
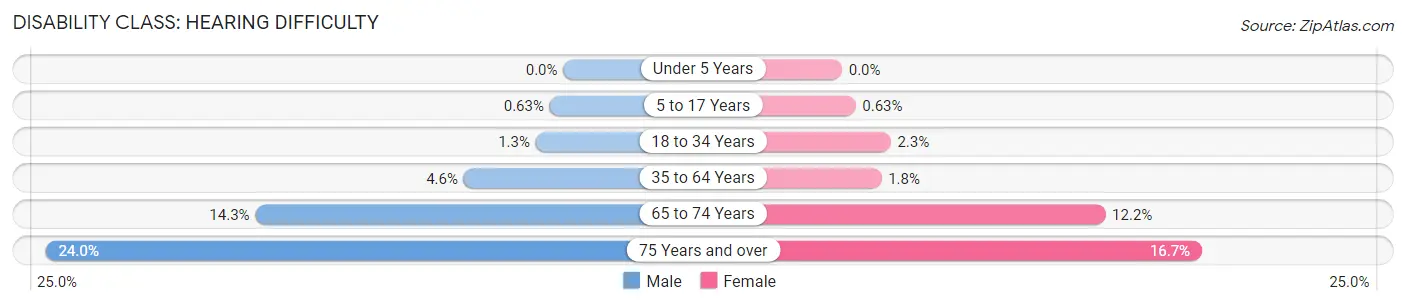
| Age Bracket | Male | Female |
| Under 5 Years | 0 (0.0%) | 0 (0.0%) |
| 5 to 17 Years | 20 (0.6%) | 14 (0.6%) |
| 18 to 34 Years | 41 (1.3%) | 60 (2.3%) |
| 35 to 64 Years | 148 (4.6%) | 59 (1.8%) |
| 65 to 74 Years | 97 (14.3%) | 109 (12.2%) |
| 75 Years and over | 111 (24.0%) | 61 (16.7%) |
Disability Class: Vision Difficulty
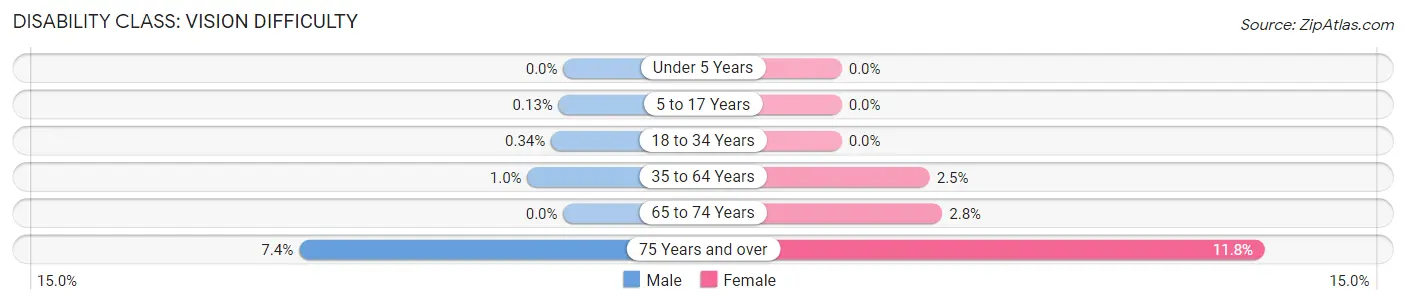
| Age Bracket | Male | Female |
| Under 5 Years | 0 (0.0%) | 0 (0.0%) |
| 5 to 17 Years | 4 (0.1%) | 0 (0.0%) |
| 18 to 34 Years | 11 (0.3%) | 0 (0.0%) |
| 35 to 64 Years | 32 (1.0%) | 79 (2.5%) |
| 65 to 74 Years | 0 (0.0%) | 25 (2.8%) |
| 75 Years and over | 34 (7.4%) | 43 (11.8%) |
Disability Class: Cognitive Difficulty
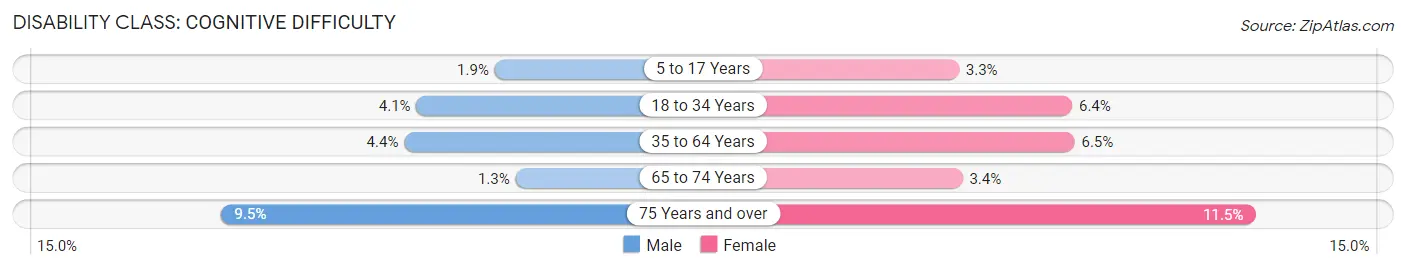
| Age Bracket | Male | Female |
| 5 to 17 Years | 61 (1.9%) | 72 (3.3%) |
| 18 to 34 Years | 131 (4.1%) | 170 (6.4%) |
| 35 to 64 Years | 142 (4.4%) | 209 (6.5%) |
| 65 to 74 Years | 9 (1.3%) | 30 (3.4%) |
| 75 Years and over | 44 (9.5%) | 42 (11.5%) |
Disability Class: Ambulatory Difficulty
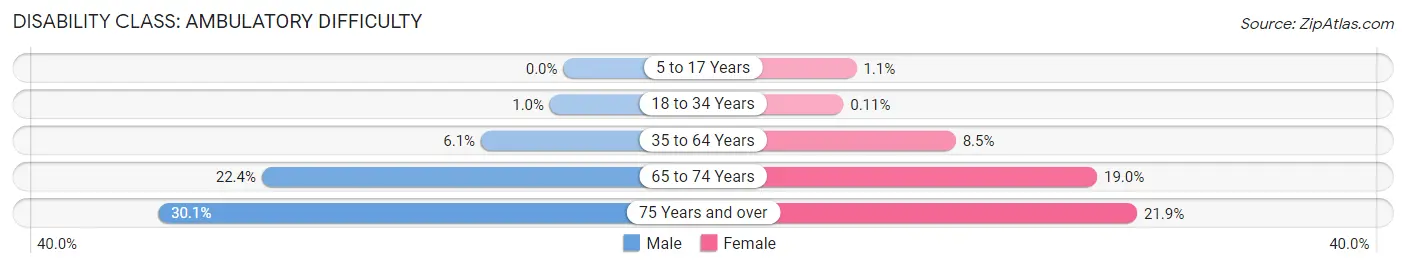
| Age Bracket | Male | Female |
| 5 to 17 Years | 0 (0.0%) | 24 (1.1%) |
| 18 to 34 Years | 32 (1.0%) | 3 (0.1%) |
| 35 to 64 Years | 196 (6.1%) | 273 (8.5%) |
| 65 to 74 Years | 152 (22.4%) | 169 (19.0%) |
| 75 Years and over | 139 (30.1%) | 80 (21.9%) |
Disability Class: Self-Care Difficulty
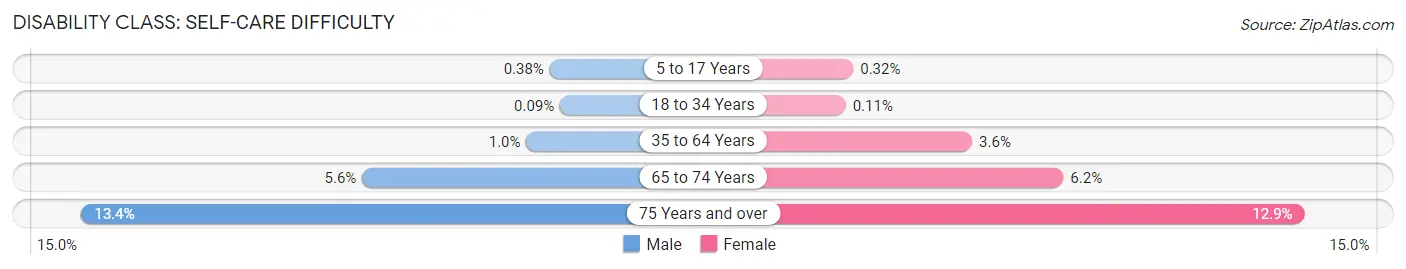
| Age Bracket | Male | Female |
| 5 to 17 Years | 12 (0.4%) | 7 (0.3%) |
| 18 to 34 Years | 3 (0.1%) | 3 (0.1%) |
| 35 to 64 Years | 33 (1.0%) | 117 (3.6%) |
| 65 to 74 Years | 38 (5.6%) | 55 (6.2%) |
| 75 Years and over | 62 (13.4%) | 47 (12.9%) |
Technology Access in Payson
Computing Device Access in Payson
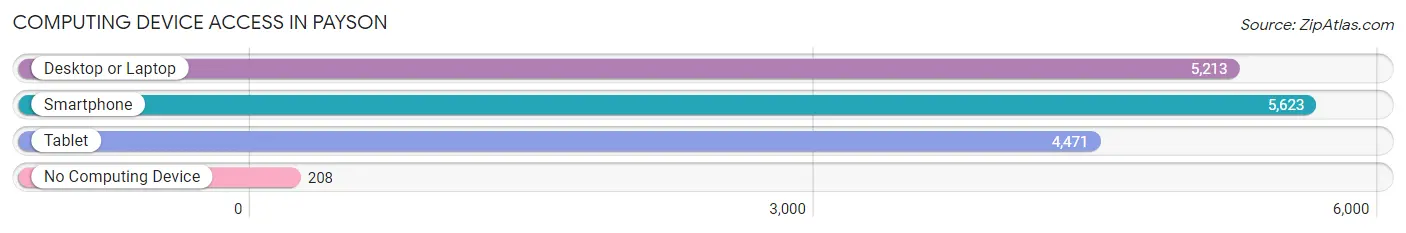
| Device Type | # Households | % Households |
| Desktop or Laptop | 5,213 | 84.8% |
| Smartphone | 5,623 | 91.4% |
| Tablet | 4,471 | 72.7% |
| No Computing Device | 208 | 3.4% |
| Total | 6,150 | 100.0% |
Internet Access in Payson
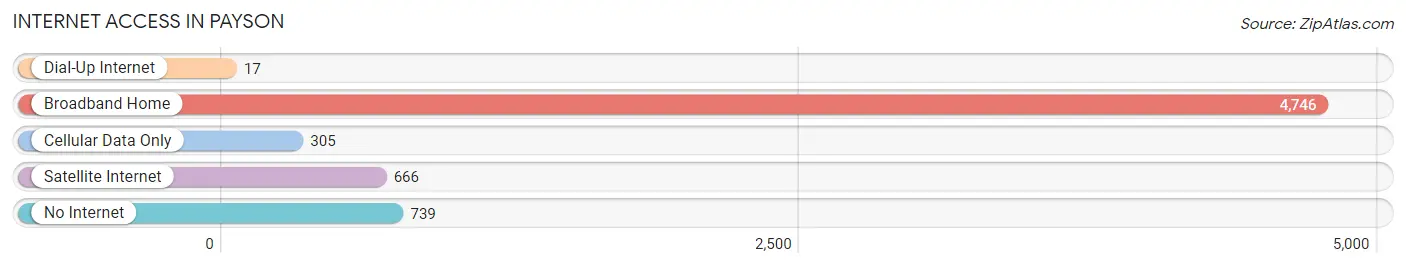
| Internet Type | # Households | % Households |
| Dial-Up Internet | 17 | 0.3% |
| Broadband Home | 4,746 | 77.2% |
| Cellular Data Only | 305 | 5.0% |
| Satellite Internet | 666 | 10.8% |
| No Internet | 739 | 12.0% |
| Total | 6,150 | 100.0% |
Payson Summary
Payson, Utah is a small city located in Utah County, Utah, United States. It is situated in the foothills of the Wasatch Mountains, about 40 miles south of Salt Lake City. The city has a population of approximately 20,000 people and is the county seat of Utah County.
History
Payson was first settled in 1851 by a group of Mormon pioneers led by John S. Higbee. The settlers named the area after William Payson, a prominent early settler in the area. The city was incorporated in 1853 and has since grown to become the largest city in Utah County.
Geography
Payson is located in the foothills of the Wasatch Mountains, about 40 miles south of Salt Lake City. The city is situated at an elevation of 4,400 feet and is surrounded by mountains on all sides. The city is located in a valley, with the Provo River running through it. The city is also home to several lakes, including Utah Lake, which is the largest freshwater lake in the state.
Economy
Payson’s economy is largely based on agriculture and tourism. The city is home to several large farms, which produce a variety of crops, including corn, wheat, hay, and alfalfa. The city is also home to several tourist attractions, including the Payson Utah Temple, the Payson Utah Tabernacle, and the Payson Utah Zoo.
Demographics
As of the 2010 census, Payson had a population of 20,000 people. The racial makeup of the city was 91.3% White, 0.7% African American, 0.7% Native American, 0.7% Asian, 0.2% Pacific Islander, 4.2% from other races, and 2.1% from two or more races. Hispanic or Latino of any race were 8.2% of the population.
The median income for a household in the city was $45,000, and the median income for a family was $50,000. The per capita income for the city was $20,000. About 8.2% of families and 10.2% of the population were below the poverty line, including 13.2% of those under age 18 and 8.2% of those age 65 or over.
Payson is a small city with a rich history and a diverse population. The city is home to several tourist attractions, and its economy is largely based on agriculture and tourism. The city is also home to several lakes, making it a popular destination for outdoor recreation.
Common Questions
What is Per Capita Income in Payson?
Per Capita income in Payson is $28,022.
What is the Median Family Income in Payson?
Median Family Income in Payson is $89,524.
What is the Median Household income in Payson?
Median Household Income in Payson is $81,387.
What is Income or Wage Gap in Payson?
Income or Wage Gap in Payson is 45.0%.
Women in Payson earn 55.0 cents for every dollar earned by a man.
What is Family Income Deficit in Payson?
Family Income Deficit in Payson is $9,503.
Families that are below poverty line in Payson earn $9,503 less on average than the poverty threshold level.
What is Inequality or Gini Index in Payson?
Inequality or Gini Index in Payson is 0.36.
What is the Total Population of Payson?
Total Population of Payson is 21,529.
What is the Total Male Population of Payson?
Total Male Population of Payson is 11,299.
What is the Total Female Population of Payson?
Total Female Population of Payson is 10,230.
What is the Ratio of Males per 100 Females in Payson?
There are 110.45 Males per 100 Females in Payson.
What is the Ratio of Females per 100 Males in Payson?
There are 90.54 Females per 100 Males in Payson.
What is the Median Population Age in Payson?
Median Population Age in Payson is 27.8 Years.
What is the Average Family Size in Payson
Average Family Size in Payson is 3.8 People.
What is the Average Household Size in Payson
Average Household Size in Payson is 3.5 People.
How Large is the Labor Force in Payson?
There are 10,963 People in the Labor Forcein in Payson.
What is the Percentage of People in the Labor Force in Payson?
69.6% of People are in the Labor Force in Payson.
What is the Unemployment Rate in Payson?
Unemployment Rate in Payson is 4.9%.