Orderville, UT Map & Demographics
Orderville Map
Orderville Overview
$30,089
PER CAPITA INCOME
$92,614
AVG FAMILY INCOME
$87,361
AVG HOUSEHOLD INCOME
54.2%
WAGE / INCOME GAP [ % ]
45.8¢/ $1
WAGE / INCOME GAP [ $ ]
0.30
INEQUALITY / GINI INDEX
636
TOTAL POPULATION
340
MALE POPULATION
296
FEMALE POPULATION
114.86
MALES / 100 FEMALES
87.06
FEMALES / 100 MALES
37.6
MEDIAN AGE
3.1
AVG FAMILY SIZE
2.9
AVG HOUSEHOLD SIZE
266
LABOR FORCE [ PEOPLE ]
60.6%
PERCENT IN LABOR FORCE
0.8%
UNEMPLOYMENT RATE
Orderville Zip Codes
Orderville Area Codes
Income in Orderville
Income Overview in Orderville
Per Capita Income in Orderville is $30,089, while median incomes of families and households are $92,614 and $87,361 respectively.
| Characteristic | Number | Measure |
| Per Capita Income | 636 | $30,089 |
| Median Family Income | 197 | $92,614 |
| Mean Family Income | 197 | $99,297 |
| Median Household Income | 218 | $87,361 |
| Mean Household Income | 218 | $96,616 |
| Income Deficit | 197 | $0 |
| Wage / Income Gap (%) | 636 | 54.24% |
| Wage / Income Gap ($) | 636 | 45.76¢ per $1 |
| Gini / Inequality Index | 636 | 0.30 |
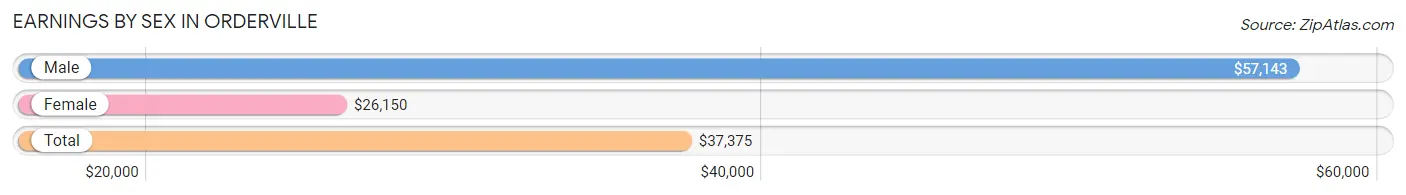
Earnings by Sex in Orderville
Average Earnings in Orderville are $37,375, $57,143 for men and $26,150 for women, a difference of 54.2%.
| Sex | Number | Average Earnings |
| Male | 152 (54.9%) | $57,143 |
| Female | 125 (45.1%) | $26,150 |
| Total | 277 (100.0%) | $37,375 |
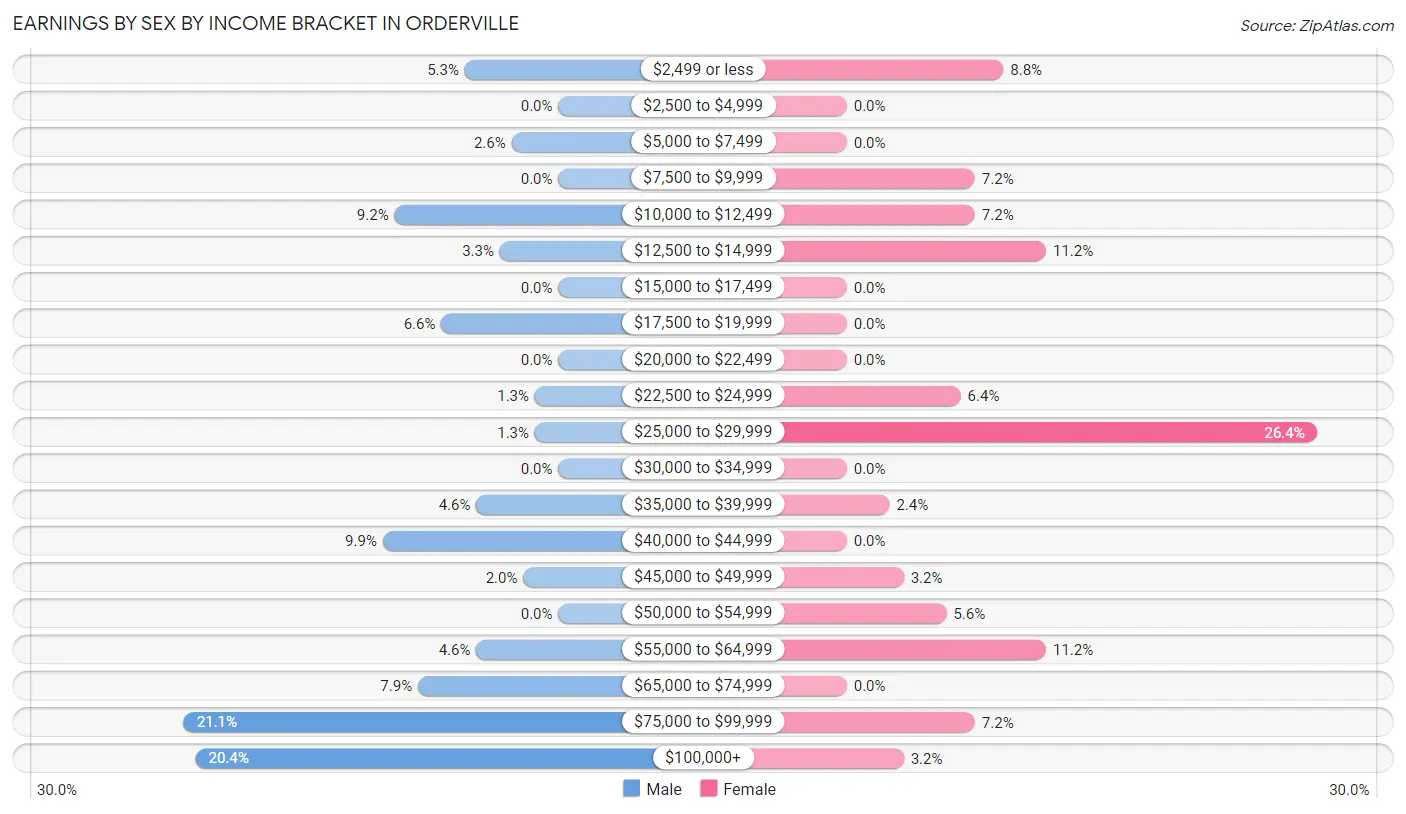
Earnings by Sex by Income Bracket in Orderville
The most common earnings brackets in Orderville are $75,000 to $99,999 for men (32 | 21.0%) and $25,000 to $29,999 for women (33 | 26.4%).
| Income | Male | Female |
| $2,499 or less | 8 (5.3%) | 11 (8.8%) |
| $2,500 to $4,999 | 0 (0.0%) | 0 (0.0%) |
| $5,000 to $7,499 | 4 (2.6%) | 0 (0.0%) |
| $7,500 to $9,999 | 0 (0.0%) | 9 (7.2%) |
| $10,000 to $12,499 | 14 (9.2%) | 9 (7.2%) |
| $12,500 to $14,999 | 5 (3.3%) | 14 (11.2%) |
| $15,000 to $17,499 | 0 (0.0%) | 0 (0.0%) |
| $17,500 to $19,999 | 10 (6.6%) | 0 (0.0%) |
| $20,000 to $22,499 | 0 (0.0%) | 0 (0.0%) |
| $22,500 to $24,999 | 2 (1.3%) | 8 (6.4%) |
| $25,000 to $29,999 | 2 (1.3%) | 33 (26.4%) |
| $30,000 to $34,999 | 0 (0.0%) | 0 (0.0%) |
| $35,000 to $39,999 | 7 (4.6%) | 3 (2.4%) |
| $40,000 to $44,999 | 15 (9.9%) | 0 (0.0%) |
| $45,000 to $49,999 | 3 (2.0%) | 4 (3.2%) |
| $50,000 to $54,999 | 0 (0.0%) | 7 (5.6%) |
| $55,000 to $64,999 | 7 (4.6%) | 14 (11.2%) |
| $65,000 to $74,999 | 12 (7.9%) | 0 (0.0%) |
| $75,000 to $99,999 | 32 (21.0%) | 9 (7.2%) |
| $100,000+ | 31 (20.4%) | 4 (3.2%) |
| Total | 152 (100.0%) | 125 (100.0%) |
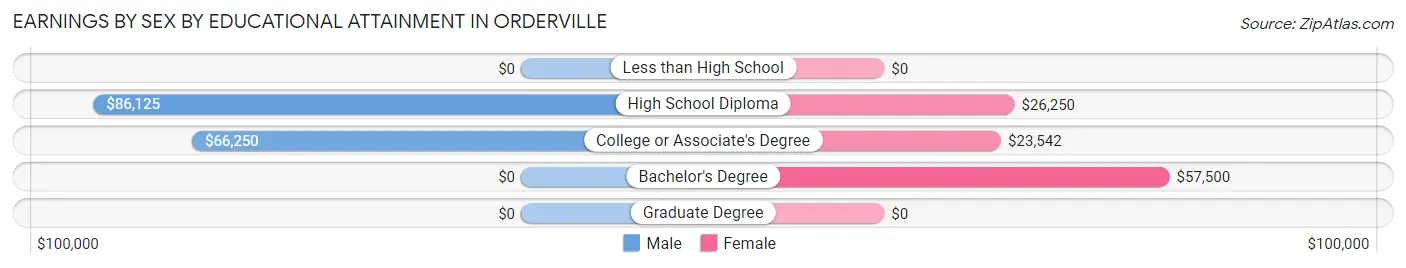
Earnings by Sex by Educational Attainment in Orderville
Average earnings in Orderville are $69,063 for men and $26,100 for women, a difference of 62.2%. Men with an educational attainment of high school diploma enjoy the highest average annual earnings of $86,125, while those with college or associate's degree education earn the least with $66,250. Women with an educational attainment of bachelor's degree earn the most with the average annual earnings of $57,500, while those with college or associate's degree education have the smallest earnings of $23,542.
| Educational Attainment | Male Income | Female Income |
| Less than High School | - | - |
| High School Diploma | $86,125 | $26,250 |
| College or Associate's Degree | $66,250 | $23,542 |
| Bachelor's Degree | - | - |
| Graduate Degree | - | - |
| Total | $69,063 | $26,100 |
Family Income in Orderville
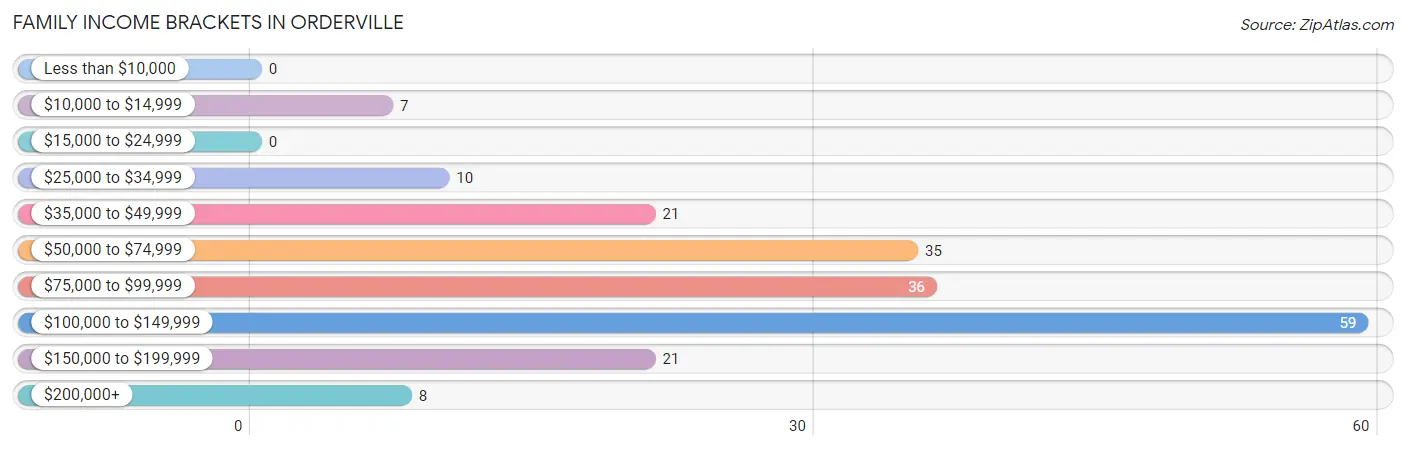
Family Income Brackets in Orderville
According to the Orderville family income data, there are 59 families falling into the $100,000 to $149,999 income range, which is the most common income bracket and makes up 29.9% of all families.
| Income Bracket | # Families | % Families |
| Less than $10,000 | 0 | 0.0% |
| $10,000 to $14,999 | 7 | 3.6% |
| $15,000 to $24,999 | 0 | 0.0% |
| $25,000 to $34,999 | 10 | 5.1% |
| $35,000 to $49,999 | 21 | 10.7% |
| $50,000 to $74,999 | 35 | 17.8% |
| $75,000 to $99,999 | 36 | 18.3% |
| $100,000 to $149,999 | 59 | 29.9% |
| $150,000 to $199,999 | 21 | 10.7% |
| $200,000+ | 8 | 4.1% |
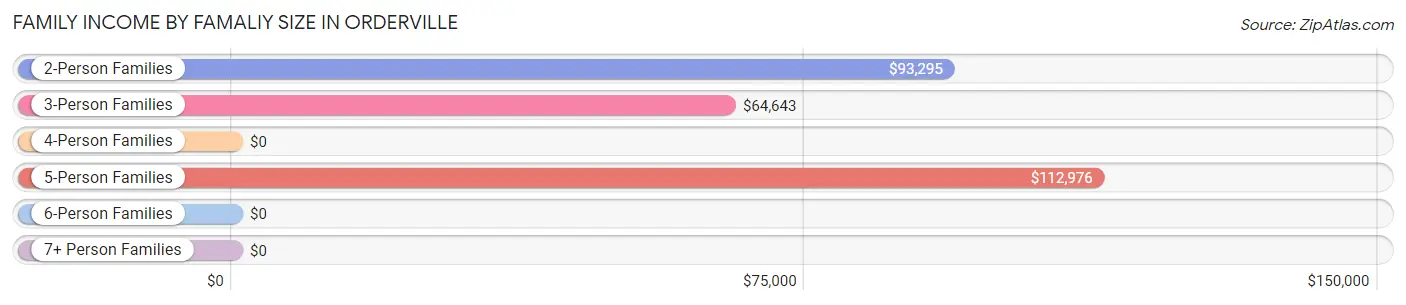
Family Income by Famaliy Size in Orderville
5-person families (36 | 18.3%) account for the highest median family income in Orderville with $112,976 per family, while 2-person families (97 | 49.2%) have the highest median income of $46,648 per family member.
| Income Bracket | # Families | Median Income |
| 2-Person Families | 97 (49.2%) | $93,295 |
| 3-Person Families | 18 (9.1%) | $64,643 |
| 4-Person Families | 31 (15.7%) | $0 |
| 5-Person Families | 36 (18.3%) | $112,976 |
| 6-Person Families | 13 (6.6%) | $0 |
| 7+ Person Families | 2 (1.0%) | $0 |
| Total | 197 (100.0%) | $92,614 |
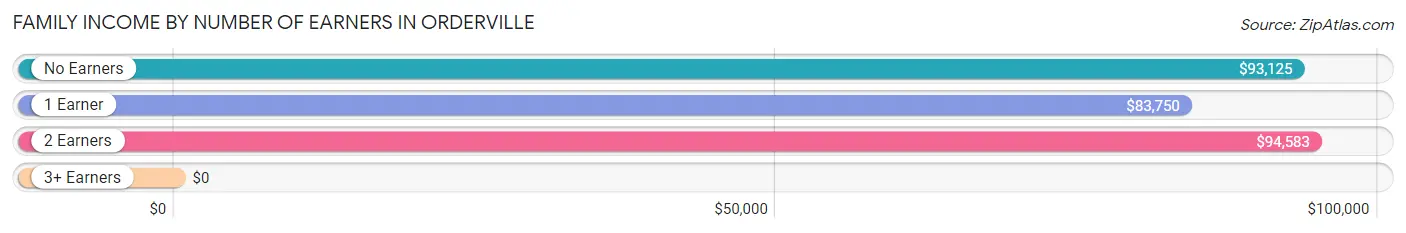
Family Income by Number of Earners in Orderville
| Number of Earners | # Families | Median Income |
| No Earners | 30 (15.2%) | $93,125 |
| 1 Earner | 72 (36.5%) | $83,750 |
| 2 Earners | 73 (37.1%) | $94,583 |
| 3+ Earners | 22 (11.2%) | $0 |
| Total | 197 (100.0%) | $92,614 |
Household Income in Orderville
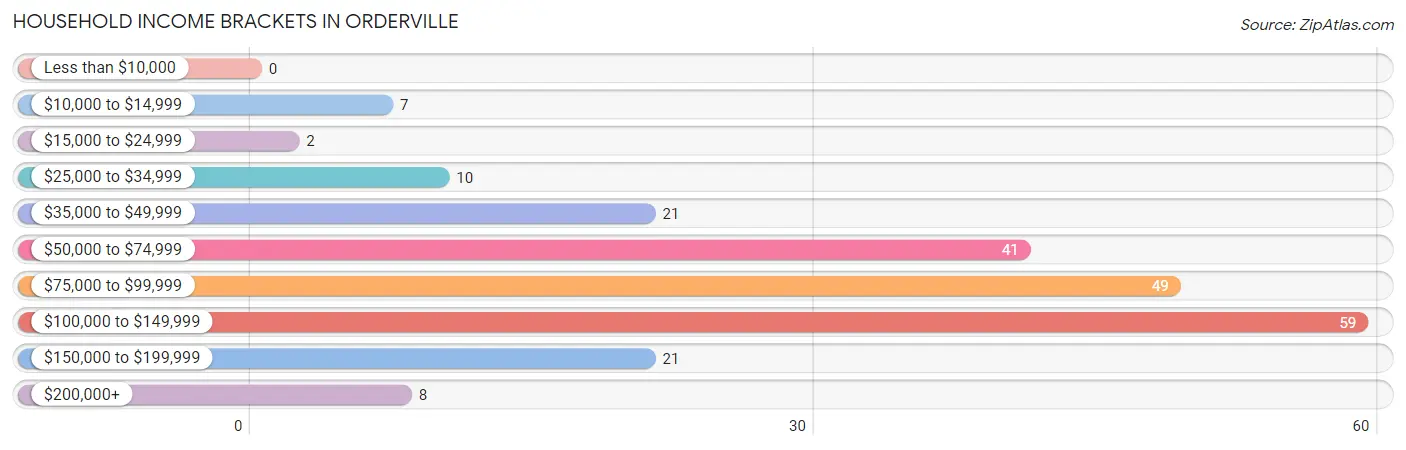
Household Income Brackets in Orderville
With 59 households falling in the category, the $100,000 to $149,999 income range is the most frequent in Orderville, accounting for 27.1% of all households.
| Income Bracket | # Households | % Households |
| Less than $10,000 | 0 | 0.0% |
| $10,000 to $14,999 | 7 | 3.2% |
| $15,000 to $24,999 | 2 | 0.9% |
| $25,000 to $34,999 | 10 | 4.6% |
| $35,000 to $49,999 | 21 | 9.6% |
| $50,000 to $74,999 | 41 | 18.8% |
| $75,000 to $99,999 | 49 | 22.5% |
| $100,000 to $149,999 | 59 | 27.1% |
| $150,000 to $199,999 | 21 | 9.6% |
| $200,000+ | 8 | 3.7% |
Household Income by Householder Age in Orderville
The median household income in Orderville is $87,361, with the highest median household income of $88,333 found in the 65+ years age bracket for the primary householder. A total of 64 households (29.4%) fall into this category.
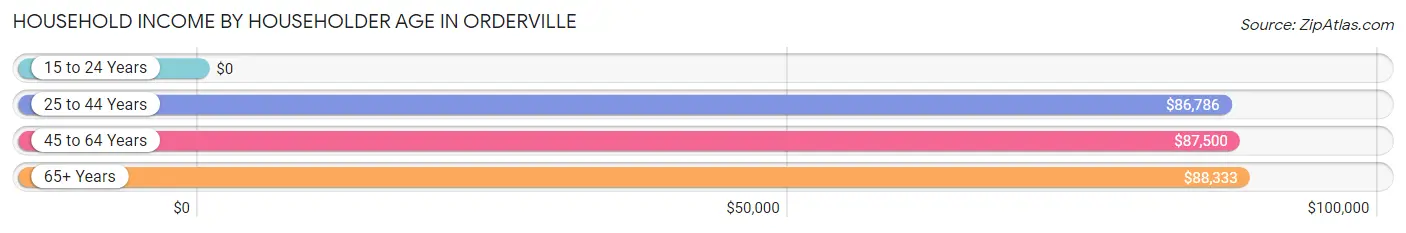
| Income Bracket | # Households | Median Income |
| 15 to 24 Years | 0 (0.0%) | $0 |
| 25 to 44 Years | 70 (32.1%) | $86,786 |
| 45 to 64 Years | 84 (38.5%) | $87,500 |
| 65+ Years | 64 (29.4%) | $88,333 |
| Total | 218 (100.0%) | $87,361 |
Poverty in Orderville
Income Below Poverty by Sex and Age in Orderville
With 3.8% poverty level for males and 3.0% for females among the residents of Orderville, 55 to 64 year old males and 55 to 64 year old females are the most vulnerable to poverty, with 6 males (26.1%) and 9 females (31.0%) in their respective age groups living below the poverty level.
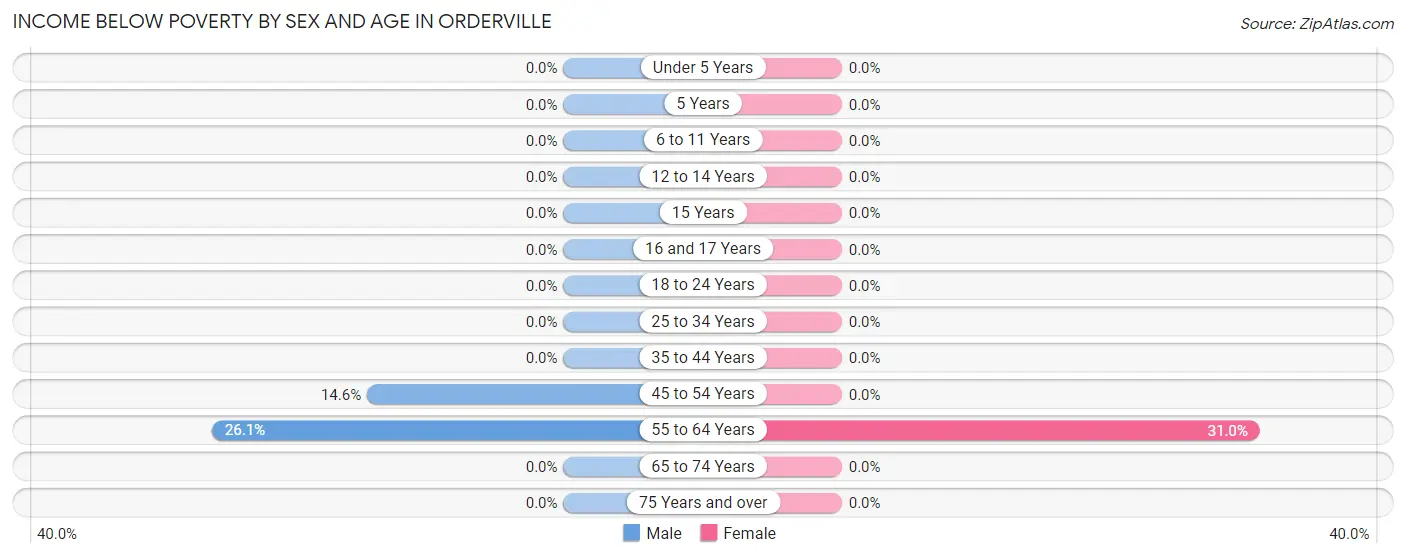
| Age Bracket | Male | Female |
| Under 5 Years | 0 (0.0%) | 0 (0.0%) |
| 5 Years | 0 (0.0%) | 0 (0.0%) |
| 6 to 11 Years | 0 (0.0%) | 0 (0.0%) |
| 12 to 14 Years | 0 (0.0%) | 0 (0.0%) |
| 15 Years | 0 (0.0%) | 0 (0.0%) |
| 16 and 17 Years | 0 (0.0%) | 0 (0.0%) |
| 18 to 24 Years | 0 (0.0%) | 0 (0.0%) |
| 25 to 34 Years | 0 (0.0%) | 0 (0.0%) |
| 35 to 44 Years | 0 (0.0%) | 0 (0.0%) |
| 45 to 54 Years | 7 (14.6%) | 0 (0.0%) |
| 55 to 64 Years | 6 (26.1%) | 9 (31.0%) |
| 65 to 74 Years | 0 (0.0%) | 0 (0.0%) |
| 75 Years and over | 0 (0.0%) | 0 (0.0%) |
| Total | 13 (3.8%) | 9 (3.0%) |
Income Above Poverty by Sex and Age in Orderville
According to the poverty statistics in Orderville, males aged under 5 years and females aged under 5 years are the age groups that are most secure financially, with 100.0% of males and 100.0% of females in these age groups living above the poverty line.
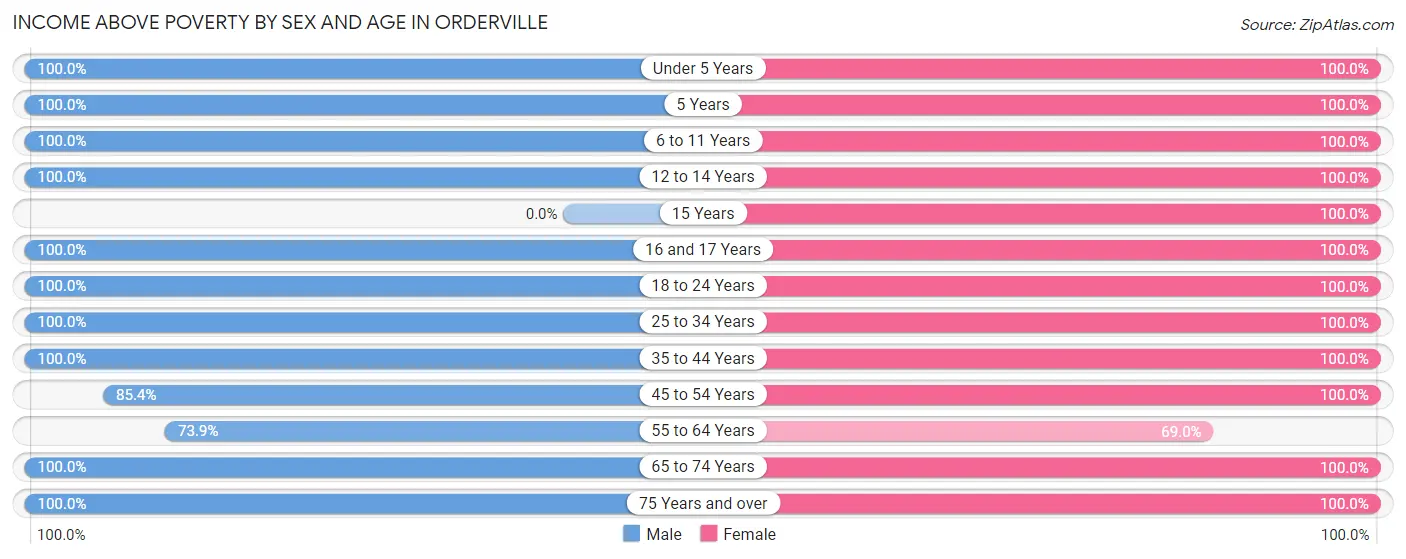
| Age Bracket | Male | Female |
| Under 5 Years | 41 (100.0%) | 31 (100.0%) |
| 5 Years | 34 (100.0%) | 2 (100.0%) |
| 6 to 11 Years | 24 (100.0%) | 12 (100.0%) |
| 12 to 14 Years | 27 (100.0%) | 24 (100.0%) |
| 15 Years | 0 (0.0%) | 2 (100.0%) |
| 16 and 17 Years | 5 (100.0%) | 9 (100.0%) |
| 18 to 24 Years | 12 (100.0%) | 13 (100.0%) |
| 25 to 34 Years | 22 (100.0%) | 39 (100.0%) |
| 35 to 44 Years | 45 (100.0%) | 30 (100.0%) |
| 45 to 54 Years | 41 (85.4%) | 41 (100.0%) |
| 55 to 64 Years | 17 (73.9%) | 20 (69.0%) |
| 65 to 74 Years | 37 (100.0%) | 43 (100.0%) |
| 75 Years and over | 22 (100.0%) | 21 (100.0%) |
| Total | 327 (96.2%) | 287 (97.0%) |
Income Below Poverty Among Married-Couple Families in Orderville
The poverty statistics for married-couple families in Orderville show that 3.8% or 7 of the total 186 families live below the poverty line. Families with no children have the highest poverty rate of 6.6%, comprising of 7 families. On the other hand, families with 1 or 2 children have the lowest poverty rate of 0.0%, which includes 0 families.
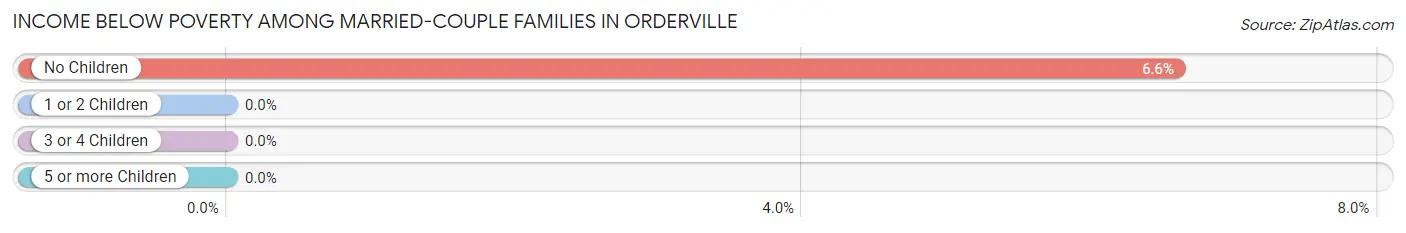
| Children | Above Poverty | Below Poverty |
| No Children | 99 (93.4%) | 7 (6.6%) |
| 1 or 2 Children | 29 (100.0%) | 0 (0.0%) |
| 3 or 4 Children | 49 (100.0%) | 0 (0.0%) |
| 5 or more Children | 2 (100.0%) | 0 (0.0%) |
| Total | 179 (96.2%) | 7 (3.8%) |
Income Below Poverty Among Single-Parent Households in Orderville
| Children | Single Father | Single Mother |
| No Children | 0 (0.0%) | 0 (0.0%) |
| 1 or 2 Children | 0 (0.0%) | 0 (0.0%) |
| 3 or 4 Children | 0 (0.0%) | 0 (0.0%) |
| 5 or more Children | 0 (0.0%) | 0 (0.0%) |
| Total | 0 (0.0%) | 0 (0.0%) |
Income Below Poverty Among Married-Couple vs Single-Parent Households in Orderville
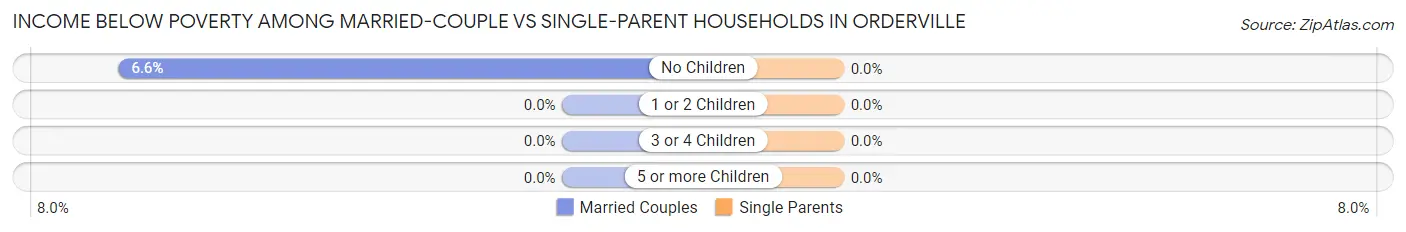
| Children | Married-Couple Families | Single-Parent Households |
| No Children | 7 (6.6%) | 0 (0.0%) |
| 1 or 2 Children | 0 (0.0%) | 0 (0.0%) |
| 3 or 4 Children | 0 (0.0%) | 0 (0.0%) |
| 5 or more Children | 0 (0.0%) | 0 (0.0%) |
| Total | 7 (3.8%) | 0 (0.0%) |
Race in Orderville
The most populous races in Orderville are White / Caucasian (620 | 97.5%), Two or more Races (10 | 1.6%), and Hispanic or Latino (6 | 0.9%).
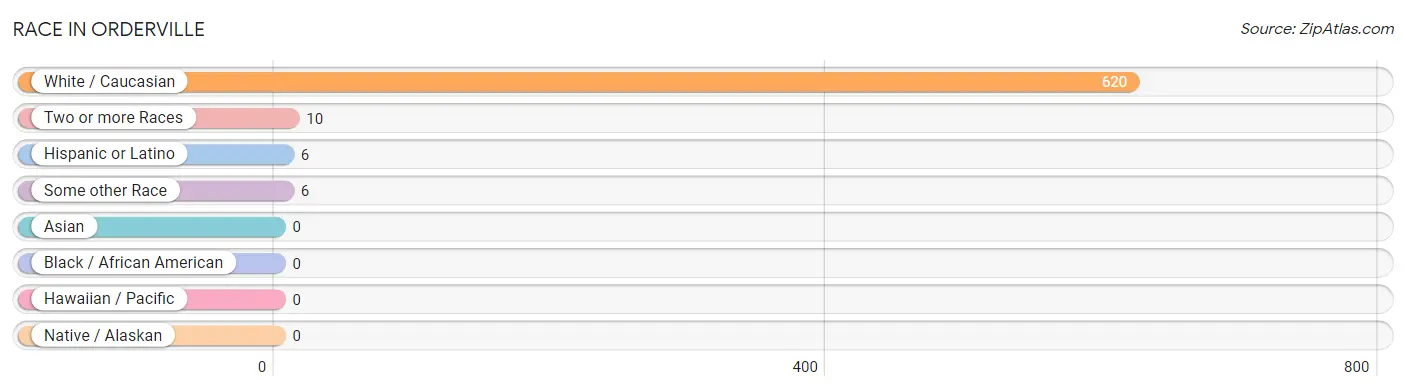
| Race | # Population | % Population |
| Asian | 0 | 0.0% |
| Black / African American | 0 | 0.0% |
| Hawaiian / Pacific | 0 | 0.0% |
| Hispanic or Latino | 6 | 0.9% |
| Native / Alaskan | 0 | 0.0% |
| White / Caucasian | 620 | 97.5% |
| Two or more Races | 10 | 1.6% |
| Some other Race | 6 | 0.9% |
| Total | 636 | 100.0% |
Ancestry in Orderville
The most populous ancestries reported in Orderville are English (258 | 40.6%), German (80 | 12.6%), Dutch (79 | 12.4%), Scottish (48 | 7.5%), and Irish (47 | 7.4%), together accounting for 80.5% of all Orderville residents.
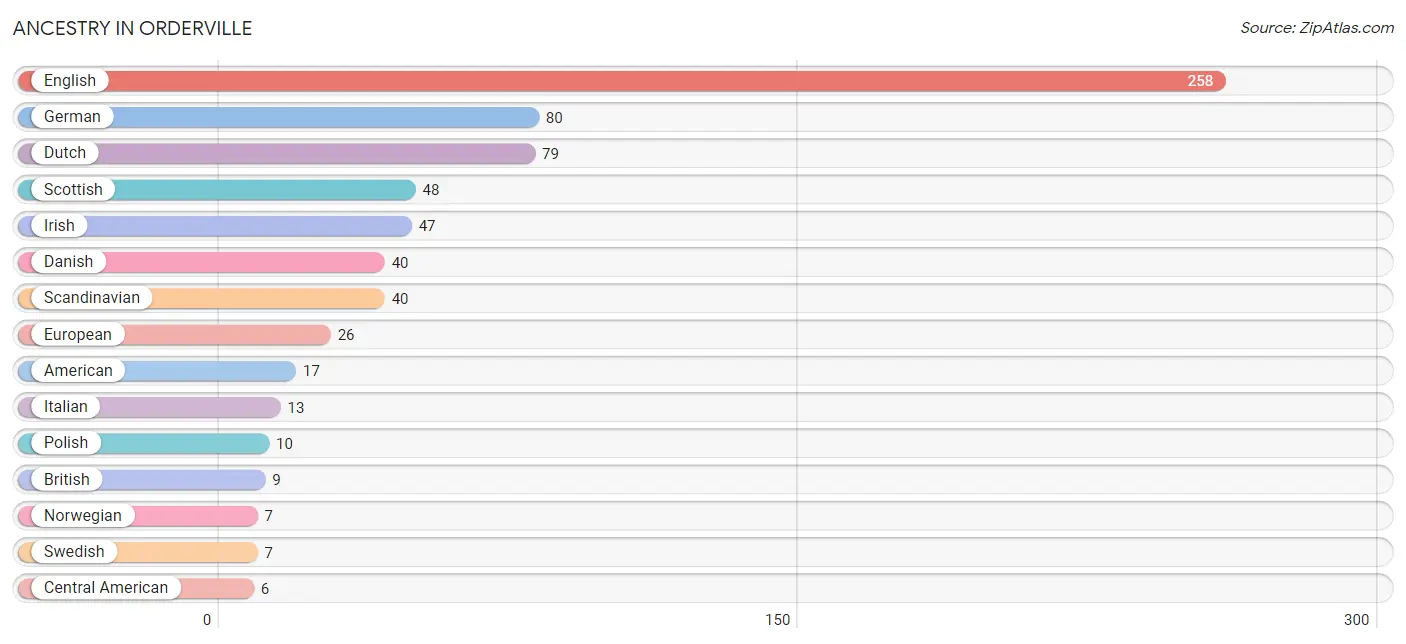
| Ancestry | # Population | % Population |
| American | 17 | 2.7% |
| British | 9 | 1.4% |
| Central American | 6 | 0.9% |
| Danish | 40 | 6.3% |
| Dutch | 79 | 12.4% |
| English | 258 | 40.6% |
| European | 26 | 4.1% |
| German | 80 | 12.6% |
| Guatemalan | 6 | 0.9% |
| Irish | 47 | 7.4% |
| Italian | 13 | 2.0% |
| Norwegian | 7 | 1.1% |
| Polish | 10 | 1.6% |
| Romanian | 5 | 0.8% |
| Scandinavian | 40 | 6.3% |
| Scottish | 48 | 7.5% |
| Swedish | 7 | 1.1% | View All 17 Rows |
Immigrants in Orderville
The most numerous immigrant groups reported in Orderville came from Central America (6 | 0.9%), Guatemala (6 | 0.9%), and Latin America (6 | 0.9%), together accounting for 2.8% of all Orderville residents.
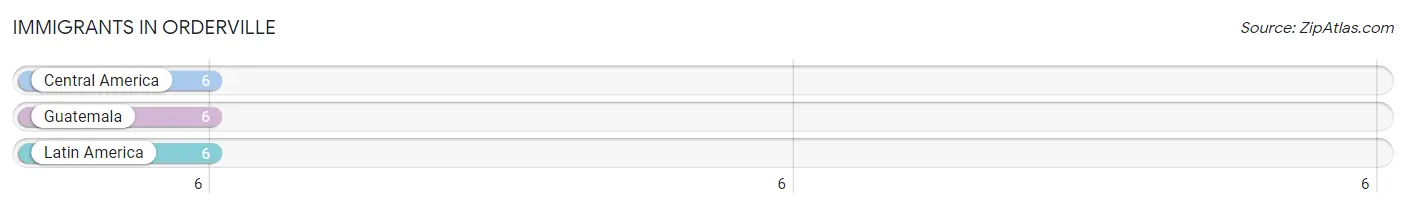
| Immigration Origin | # Population | % Population |
| Central America | 6 | 0.9% |
| Guatemala | 6 | 0.9% |
| Latin America | 6 | 0.9% | View All 3 Rows |
Sex and Age in Orderville
Sex and Age in Orderville
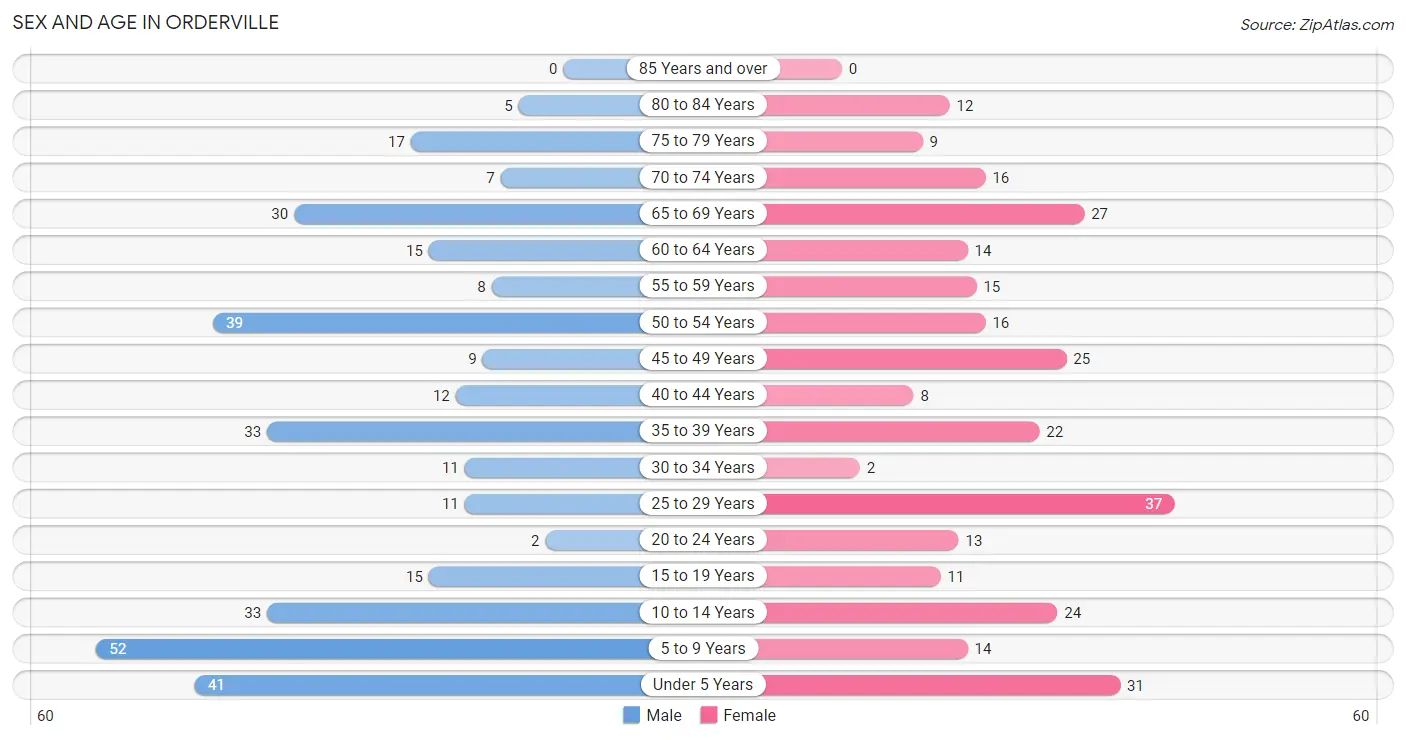
The most populous age groups in Orderville are 5 to 9 Years (52 | 15.3%) for men and 25 to 29 Years (37 | 12.5%) for women.
| Age Bracket | Male | Female |
| Under 5 Years | 41 (12.1%) | 31 (10.5%) |
| 5 to 9 Years | 52 (15.3%) | 14 (4.7%) |
| 10 to 14 Years | 33 (9.7%) | 24 (8.1%) |
| 15 to 19 Years | 15 (4.4%) | 11 (3.7%) |
| 20 to 24 Years | 2 (0.6%) | 13 (4.4%) |
| 25 to 29 Years | 11 (3.2%) | 37 (12.5%) |
| 30 to 34 Years | 11 (3.2%) | 2 (0.7%) |
| 35 to 39 Years | 33 (9.7%) | 22 (7.4%) |
| 40 to 44 Years | 12 (3.5%) | 8 (2.7%) |
| 45 to 49 Years | 9 (2.6%) | 25 (8.5%) |
| 50 to 54 Years | 39 (11.5%) | 16 (5.4%) |
| 55 to 59 Years | 8 (2.4%) | 15 (5.1%) |
| 60 to 64 Years | 15 (4.4%) | 14 (4.7%) |
| 65 to 69 Years | 30 (8.8%) | 27 (9.1%) |
| 70 to 74 Years | 7 (2.1%) | 16 (5.4%) |
| 75 to 79 Years | 17 (5.0%) | 9 (3.0%) |
| 80 to 84 Years | 5 (1.5%) | 12 (4.1%) |
| 85 Years and over | 0 (0.0%) | 0 (0.0%) |
| Total | 340 (100.0%) | 296 (100.0%) |
Families and Households in Orderville
Median Family Size in Orderville
The median family size in Orderville is 3.07 persons per family, with married-couple families (186 | 94.4%) accounting for the largest median family size of 3.14 persons per family. On the other hand, single male/father families (7 | 3.5%) represent the smallest median family size with 1.57 persons per family.
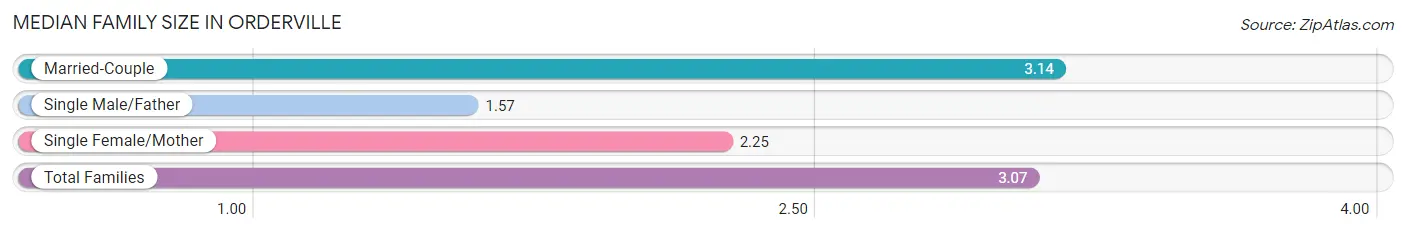
| Family Type | # Families | Family Size |
| Married-Couple | 186 (94.4%) | 3.14 |
| Single Male/Father | 7 (3.5%) | 1.57 |
| Single Female/Mother | 4 (2.0%) | 2.25 |
| Total Families | 197 (100.0%) | 3.07 |
Median Household Size in Orderville
The median household size in Orderville is 2.92 persons per household, with married-couple households (186 | 85.3%) accounting for the largest median household size of 3.14 persons per household. non-family households (21 | 9.6%) represent the smallest median household size with 1.52 persons per household.
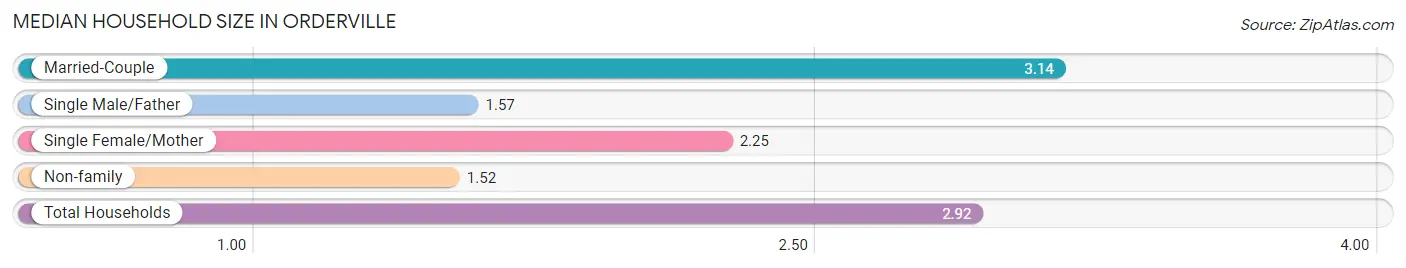
| Household Type | # Households | Household Size |
| Married-Couple | 186 (85.3%) | 3.14 |
| Single Male/Father | 7 (3.2%) | 1.57 |
| Single Female/Mother | 4 (1.8%) | 2.25 |
| Non-family | 21 (9.6%) | 1.52 |
| Total Households | 218 (100.0%) | 2.92 |
Household Size by Marriage Status in Orderville
Out of a total of 218 households in Orderville, 197 (90.4%) are family households, while 21 (9.6%) are nonfamily households. The most numerous type of family households are 2-person households, comprising 97, and the most common type of nonfamily households are 2-person households, comprising 10.
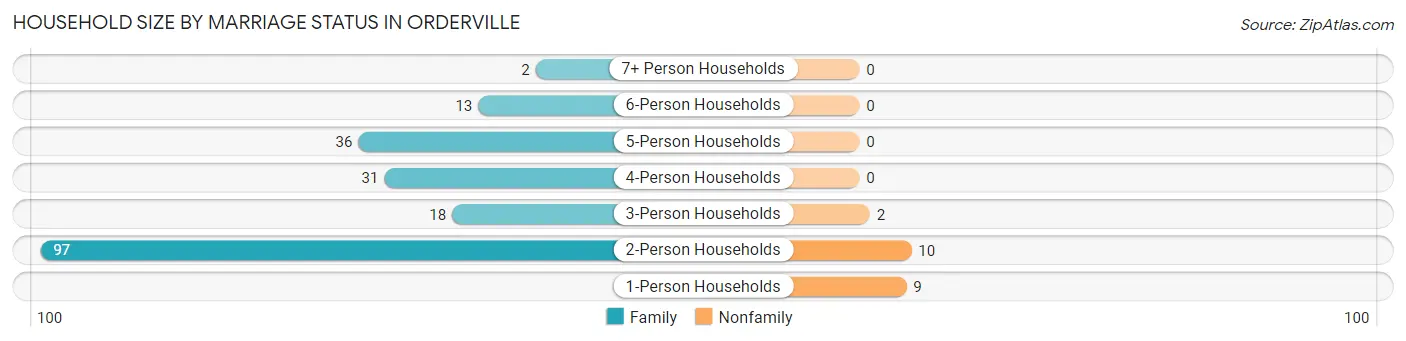
| Household Size | Family Households | Nonfamily Households |
| 1-Person Households | - | 9 (4.1%) |
| 2-Person Households | 97 (44.5%) | 10 (4.6%) |
| 3-Person Households | 18 (8.3%) | 2 (0.9%) |
| 4-Person Households | 31 (14.2%) | 0 (0.0%) |
| 5-Person Households | 36 (16.5%) | 0 (0.0%) |
| 6-Person Households | 13 (6.0%) | 0 (0.0%) |
| 7+ Person Households | 2 (0.9%) | 0 (0.0%) |
| Total | 197 (90.4%) | 21 (9.6%) |
Female Fertility in Orderville
Fertility by Age in Orderville
Average fertility rate in Orderville is 127.0 births per 1,000 women. Women in the age bracket of 20 to 34 years have the highest fertility rate with 308.0 births per 1,000 women. Women in the age bracket of 20 to 34 years acount for 100.0% of all women with births.
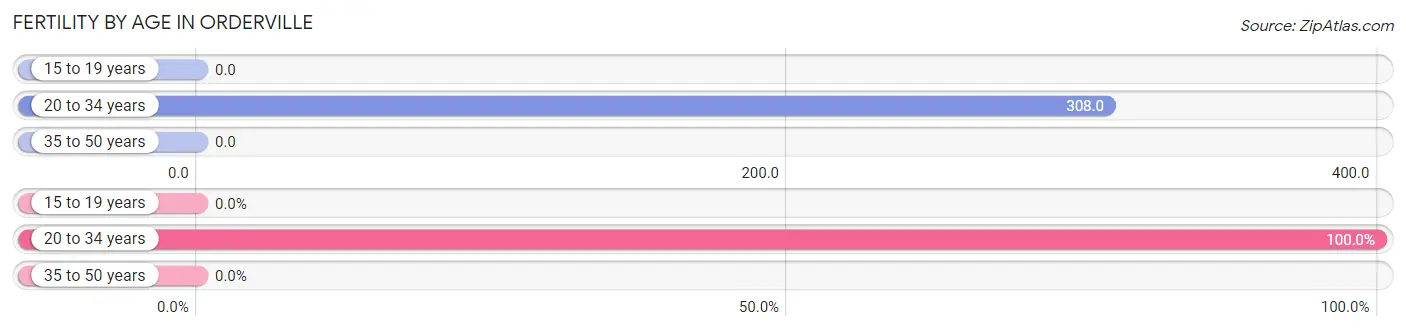
| Age Bracket | Women with Births | Births / 1,000 Women |
| 15 to 19 years | 0 (0.0%) | 0.0 |
| 20 to 34 years | 16 (100.0%) | 308.0 |
| 35 to 50 years | 0 (0.0%) | 0.0 |
| Total | 16 (100.0%) | 127.0 |
Fertility by Age by Marriage Status in Orderville
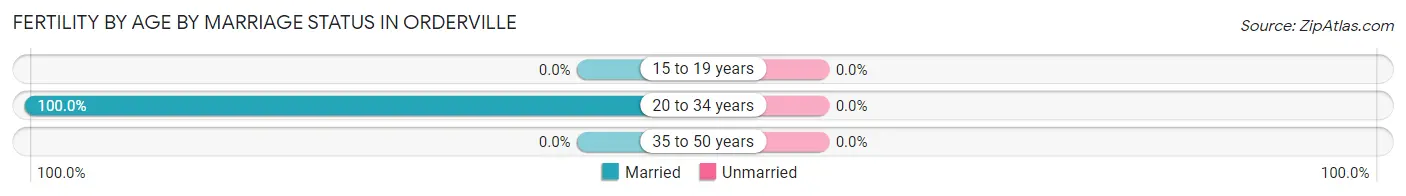
| Age Bracket | Married | Unmarried |
| 15 to 19 years | 0 (0.0%) | 0 (0.0%) |
| 20 to 34 years | 16 (100.0%) | 0 (0.0%) |
| 35 to 50 years | 0 (0.0%) | 0 (0.0%) |
| Total | 16 (100.0%) | 0 (0.0%) |
Fertility by Education in Orderville
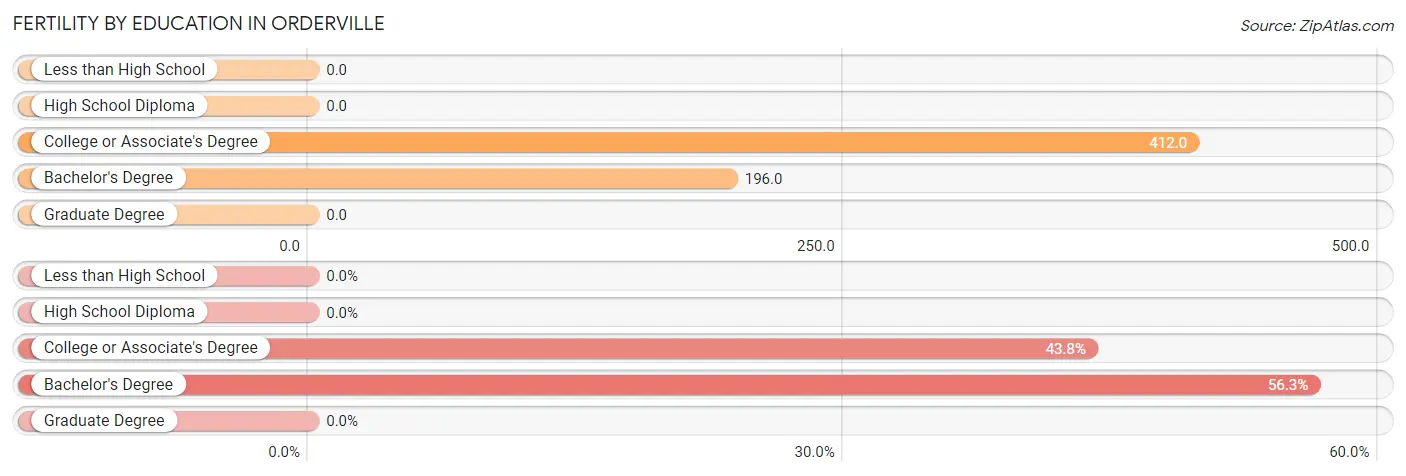
| Educational Attainment | Women with Births | Births / 1,000 Women |
| Less than High School | 0 (0.0%) | 0.0 |
| High School Diploma | 0 (0.0%) | 0.0 |
| College or Associate's Degree | 7 (43.8%) | 412.0 |
| Bachelor's Degree | 9 (56.2%) | 196.0 |
| Graduate Degree | 0 (0.0%) | 0.0 |
| Total | 16 (100.0%) | 127.0 |
Fertility by Education by Marriage Status in Orderville
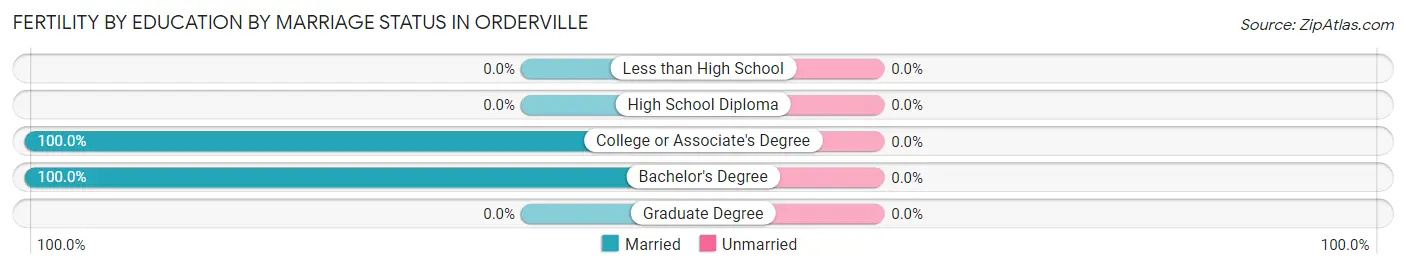
| Educational Attainment | Married | Unmarried |
| Less than High School | 0 (0.0%) | 0 (0.0%) |
| High School Diploma | 0 (0.0%) | 0 (0.0%) |
| College or Associate's Degree | 7 (100.0%) | 0 (0.0%) |
| Bachelor's Degree | 9 (100.0%) | 0 (0.0%) |
| Graduate Degree | 0 (0.0%) | 0 (0.0%) |
| Total | 16 (100.0%) | 0 (0.0%) |
Employment Characteristics in Orderville
Employment by Class of Employer in Orderville
Among the 264 employed individuals in Orderville, private company employees (126 | 47.7%), local government employees (48 | 18.2%), and not-for-profit organizations (39 | 14.8%) make up the most common classes of employment.
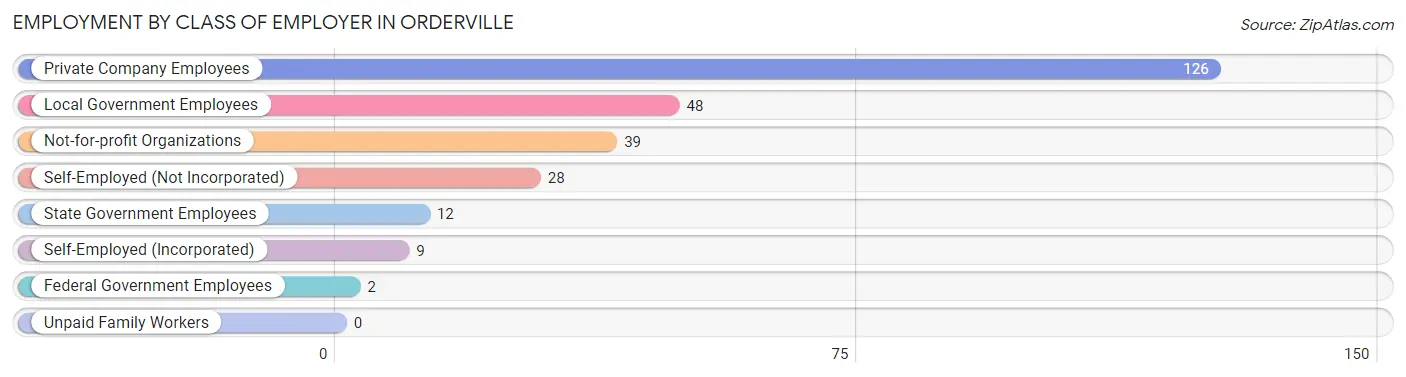
| Employer Class | # Employees | % Employees |
| Private Company Employees | 126 | 47.7% |
| Self-Employed (Incorporated) | 9 | 3.4% |
| Self-Employed (Not Incorporated) | 28 | 10.6% |
| Not-for-profit Organizations | 39 | 14.8% |
| Local Government Employees | 48 | 18.2% |
| State Government Employees | 12 | 4.5% |
| Federal Government Employees | 2 | 0.8% |
| Unpaid Family Workers | 0 | 0.0% |
| Total | 264 | 100.0% |
Employment Status by Age in Orderville
According to the labor force statistics for Orderville, out of the total population over 16 years of age (439), 60.6% or 266 individuals are in the labor force, with 0.8% or 2 of them unemployed. The age group with the highest labor force participation rate is 20 to 24 years, with 100.0% or 15 individuals in the labor force. Within the labor force, the 20 to 24 years age range has the highest percentage of unemployed individuals, with 13.3% or 2 of them being unemployed.
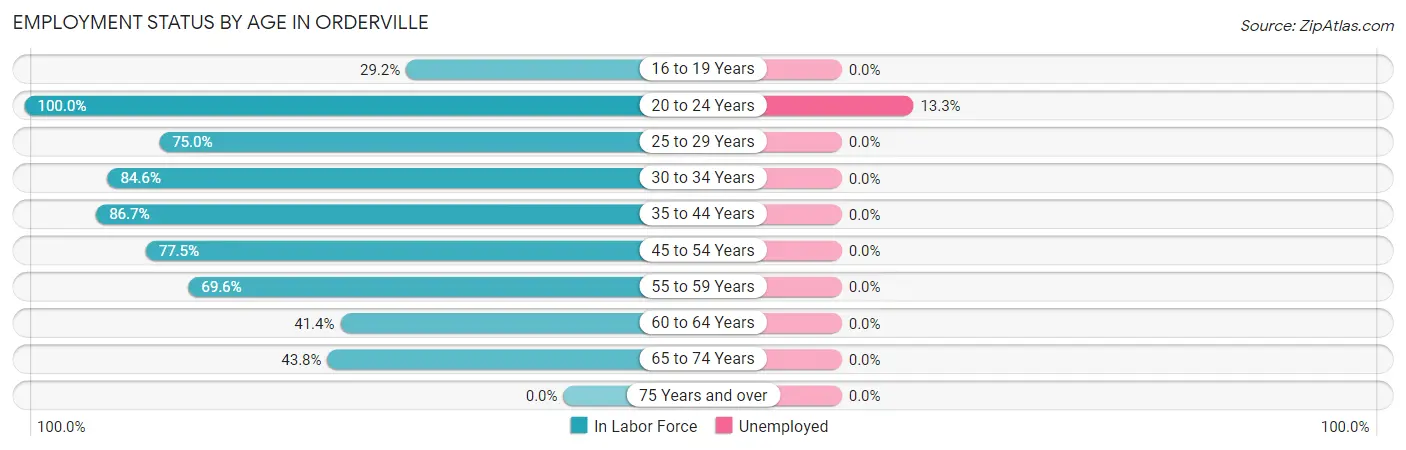
| Age Bracket | In Labor Force | Unemployed |
| 16 to 19 Years | 7 (29.2%) | 0 (0.0%) |
| 20 to 24 Years | 15 (100.0%) | 2 (13.3%) |
| 25 to 29 Years | 36 (75.0%) | 0 (0.0%) |
| 30 to 34 Years | 11 (84.6%) | 0 (0.0%) |
| 35 to 44 Years | 65 (86.7%) | 0 (0.0%) |
| 45 to 54 Years | 69 (77.5%) | 0 (0.0%) |
| 55 to 59 Years | 16 (69.6%) | 0 (0.0%) |
| 60 to 64 Years | 12 (41.4%) | 0 (0.0%) |
| 65 to 74 Years | 35 (43.8%) | 0 (0.0%) |
| 75 Years and over | 0 (0.0%) | 0 (0.0%) |
| Total | 266 (60.6%) | 2 (0.8%) |
Employment Status by Educational Attainment in Orderville
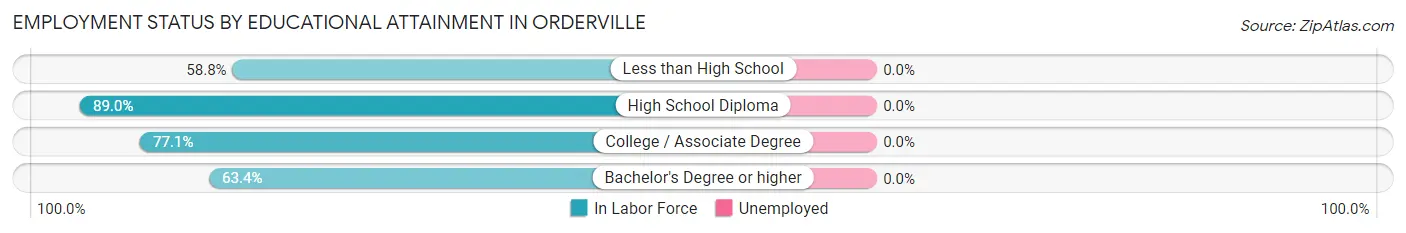
| Educational Attainment | In Labor Force | Unemployed |
| Less than High School | 10 (58.8%) | 0 (0.0%) |
| High School Diploma | 73 (89.0%) | 0 (0.0%) |
| College / Associate Degree | 74 (77.1%) | 0 (0.0%) |
| Bachelor's Degree or higher | 52 (63.4%) | 0 (0.0%) |
| Total | 209 (75.5%) | 0 (0.0%) |
Employment Occupations by Sex in Orderville
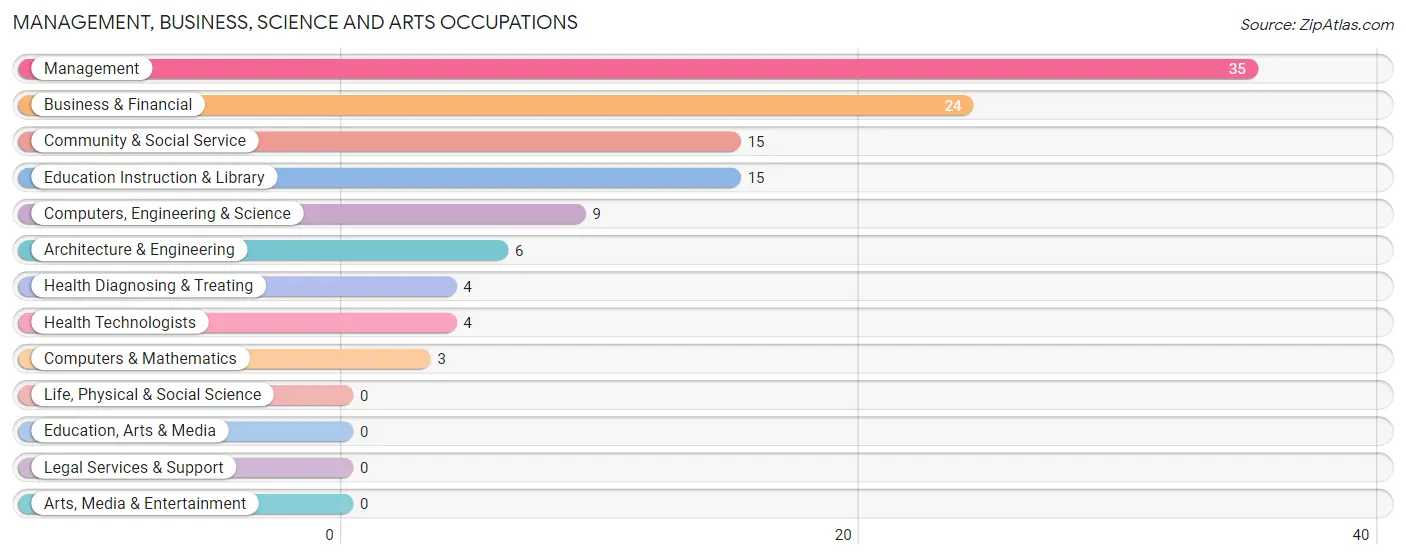
Management, Business, Science and Arts Occupations
The most common Management, Business, Science and Arts occupations in Orderville are Management (35 | 13.3%), Business & Financial (24 | 9.1%), Community & Social Service (15 | 5.7%), Education Instruction & Library (15 | 5.7%), and Computers, Engineering & Science (9 | 3.4%).
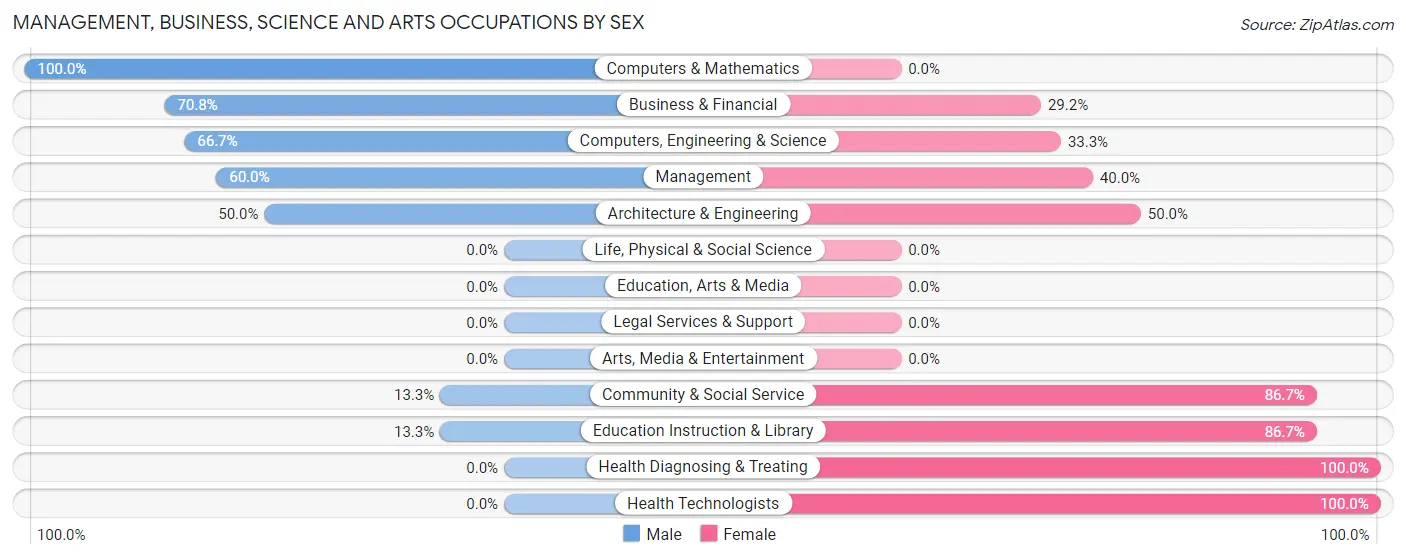
Management, Business, Science and Arts Occupations by Sex
Within the Management, Business, Science and Arts occupations in Orderville, the most male-oriented occupations are Computers & Mathematics (100.0%), Business & Financial (70.8%), and Computers, Engineering & Science (66.7%), while the most female-oriented occupations are Health Diagnosing & Treating (100.0%), Health Technologists (100.0%), and Community & Social Service (86.7%).
| Occupation | Male | Female |
| Management | 21 (60.0%) | 14 (40.0%) |
| Business & Financial | 17 (70.8%) | 7 (29.2%) |
| Computers, Engineering & Science | 6 (66.7%) | 3 (33.3%) |
| Computers & Mathematics | 3 (100.0%) | 0 (0.0%) |
| Architecture & Engineering | 3 (50.0%) | 3 (50.0%) |
| Life, Physical & Social Science | 0 (0.0%) | 0 (0.0%) |
| Community & Social Service | 2 (13.3%) | 13 (86.7%) |
| Education, Arts & Media | 0 (0.0%) | 0 (0.0%) |
| Legal Services & Support | 0 (0.0%) | 0 (0.0%) |
| Education Instruction & Library | 2 (13.3%) | 13 (86.7%) |
| Arts, Media & Entertainment | 0 (0.0%) | 0 (0.0%) |
| Health Diagnosing & Treating | 0 (0.0%) | 4 (100.0%) |
| Health Technologists | 0 (0.0%) | 4 (100.0%) |
| Total (Category) | 46 (52.9%) | 41 (47.1%) |
| Total (Overall) | 144 (54.5%) | 120 (45.5%) |
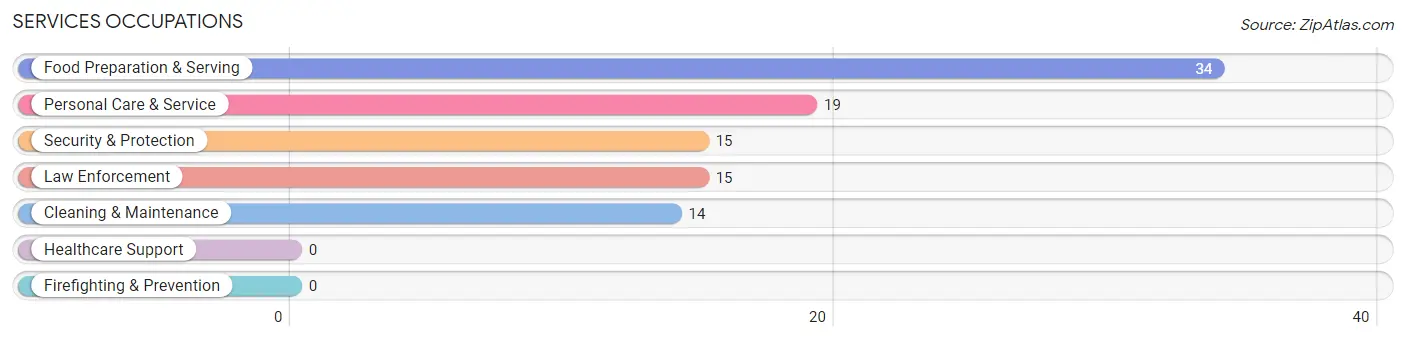
Services Occupations
The most common Services occupations in Orderville are Food Preparation & Serving (34 | 12.9%), Personal Care & Service (19 | 7.2%), Security & Protection (15 | 5.7%), Law Enforcement (15 | 5.7%), and Cleaning & Maintenance (14 | 5.3%).
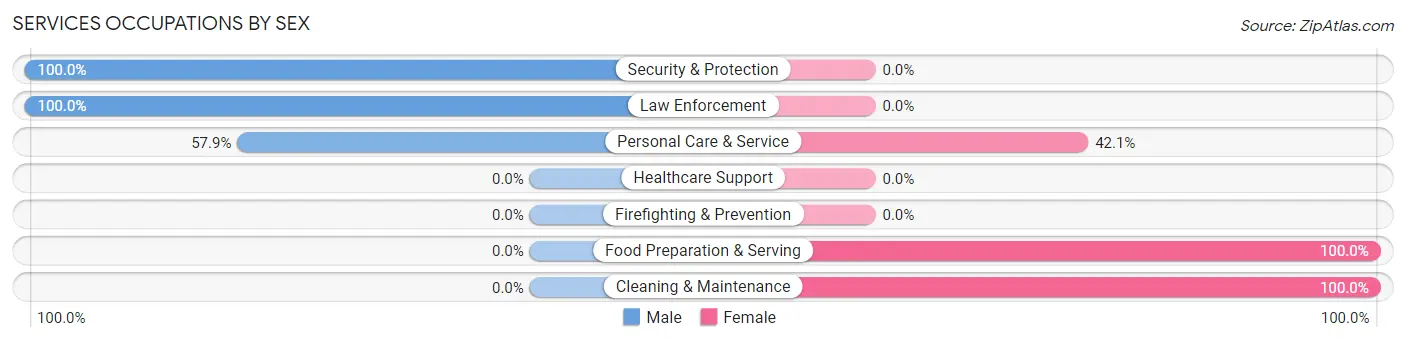
Services Occupations by Sex
Within the Services occupations in Orderville, the most male-oriented occupations are Security & Protection (100.0%), Law Enforcement (100.0%), and Personal Care & Service (57.9%), while the most female-oriented occupations are Food Preparation & Serving (100.0%), Cleaning & Maintenance (100.0%), and Personal Care & Service (42.1%).
| Occupation | Male | Female |
| Healthcare Support | 0 (0.0%) | 0 (0.0%) |
| Security & Protection | 15 (100.0%) | 0 (0.0%) |
| Firefighting & Prevention | 0 (0.0%) | 0 (0.0%) |
| Law Enforcement | 15 (100.0%) | 0 (0.0%) |
| Food Preparation & Serving | 0 (0.0%) | 34 (100.0%) |
| Cleaning & Maintenance | 0 (0.0%) | 14 (100.0%) |
| Personal Care & Service | 11 (57.9%) | 8 (42.1%) |
| Total (Category) | 26 (31.7%) | 56 (68.3%) |
| Total (Overall) | 144 (54.5%) | 120 (45.5%) |
Sales and Office Occupations
The most common Sales and Office occupations in Orderville are Office & Administration (9 | 3.4%), and Sales & Related (7 | 2.6%).
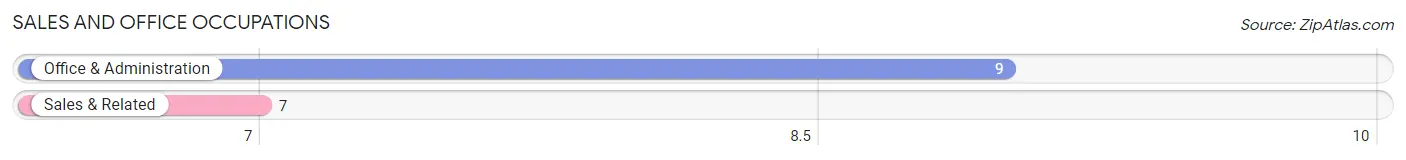
Sales and Office Occupations by Sex
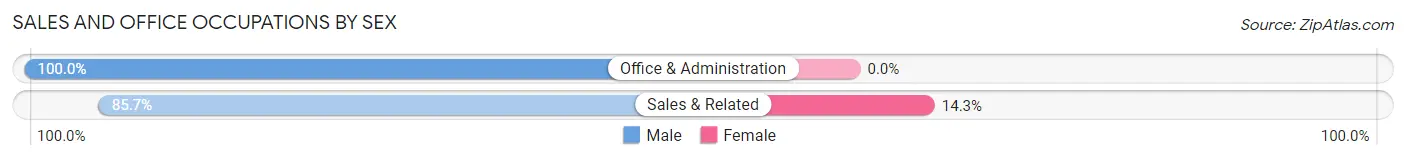
| Occupation | Male | Female |
| Sales & Related | 6 (85.7%) | 1 (14.3%) |
| Office & Administration | 9 (100.0%) | 0 (0.0%) |
| Total (Category) | 15 (93.8%) | 1 (6.2%) |
| Total (Overall) | 144 (54.5%) | 120 (45.5%) |
Natural Resources, Construction and Maintenance Occupations
The most common Natural Resources, Construction and Maintenance occupations in Orderville are Installation, Maintenance & Repair (22 | 8.3%), and Construction & Extraction (2 | 0.8%).
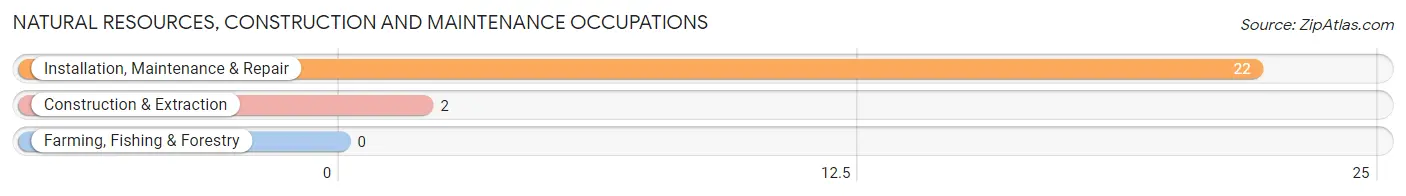
Natural Resources, Construction and Maintenance Occupations by Sex
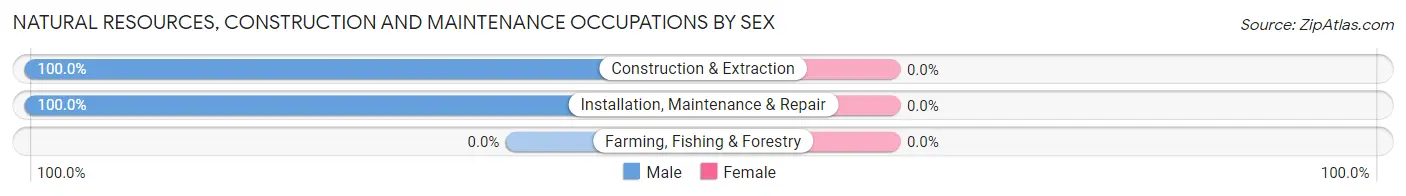
| Occupation | Male | Female |
| Farming, Fishing & Forestry | 0 (0.0%) | 0 (0.0%) |
| Construction & Extraction | 2 (100.0%) | 0 (0.0%) |
| Installation, Maintenance & Repair | 22 (100.0%) | 0 (0.0%) |
| Total (Category) | 24 (100.0%) | 0 (0.0%) |
| Total (Overall) | 144 (54.5%) | 120 (45.5%) |
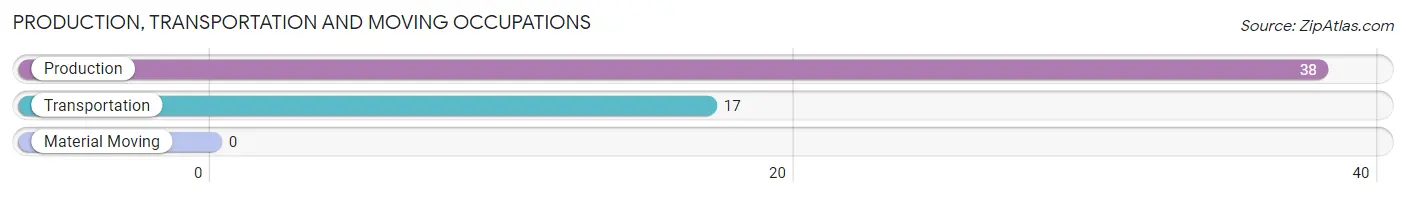
Production, Transportation and Moving Occupations
The most common Production, Transportation and Moving occupations in Orderville are Production (38 | 14.4%), and Transportation (17 | 6.4%).
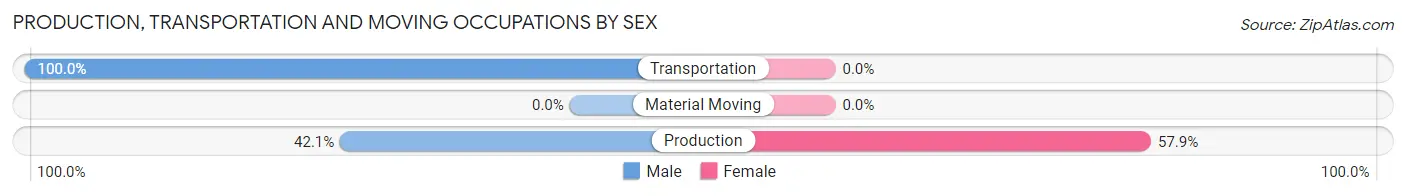
Production, Transportation and Moving Occupations by Sex
| Occupation | Male | Female |
| Production | 16 (42.1%) | 22 (57.9%) |
| Transportation | 17 (100.0%) | 0 (0.0%) |
| Material Moving | 0 (0.0%) | 0 (0.0%) |
| Total (Category) | 33 (60.0%) | 22 (40.0%) |
| Total (Overall) | 144 (54.5%) | 120 (45.5%) |
Employment Industries by Sex in Orderville
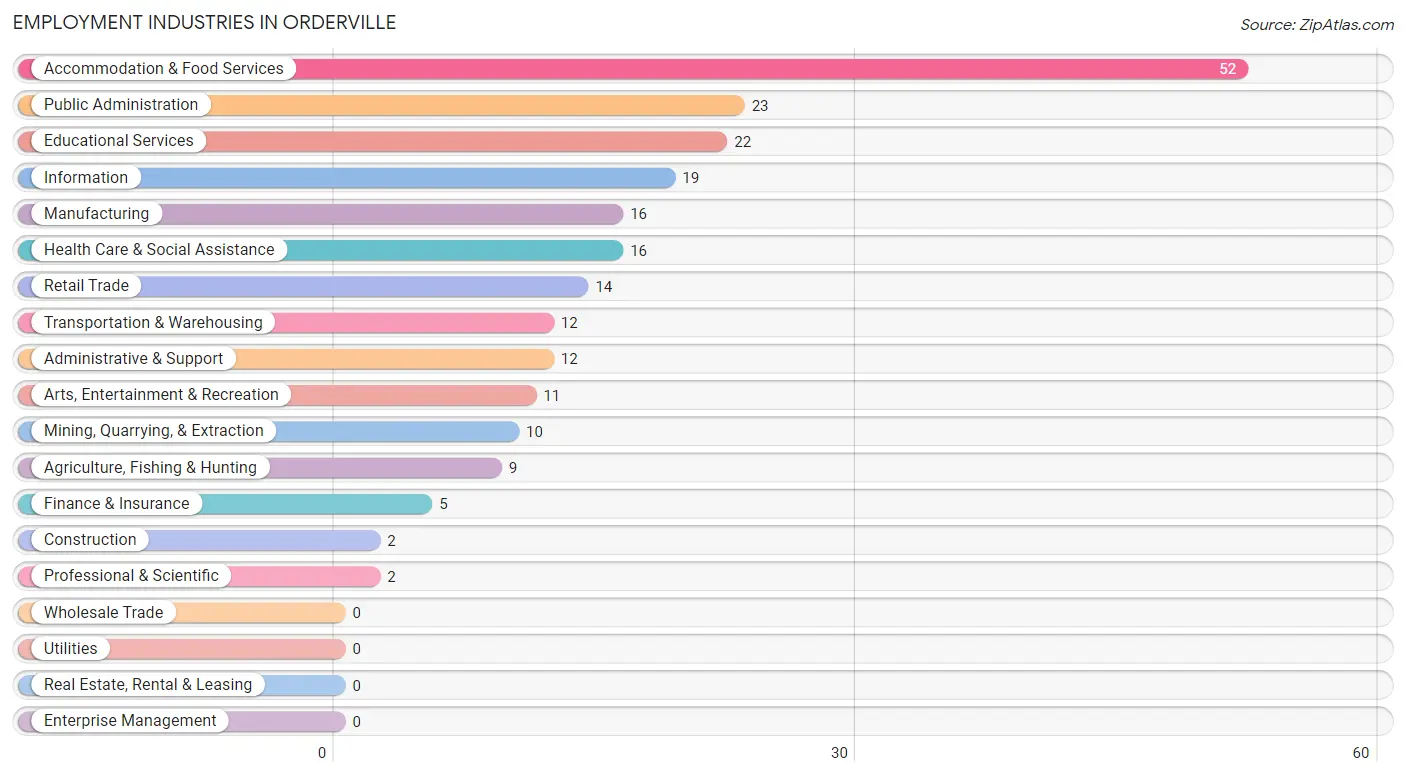
Employment Industries in Orderville
The major employment industries in Orderville include Accommodation & Food Services (52 | 19.7%), Public Administration (23 | 8.7%), Educational Services (22 | 8.3%), Information (19 | 7.2%), and Manufacturing (16 | 6.1%).
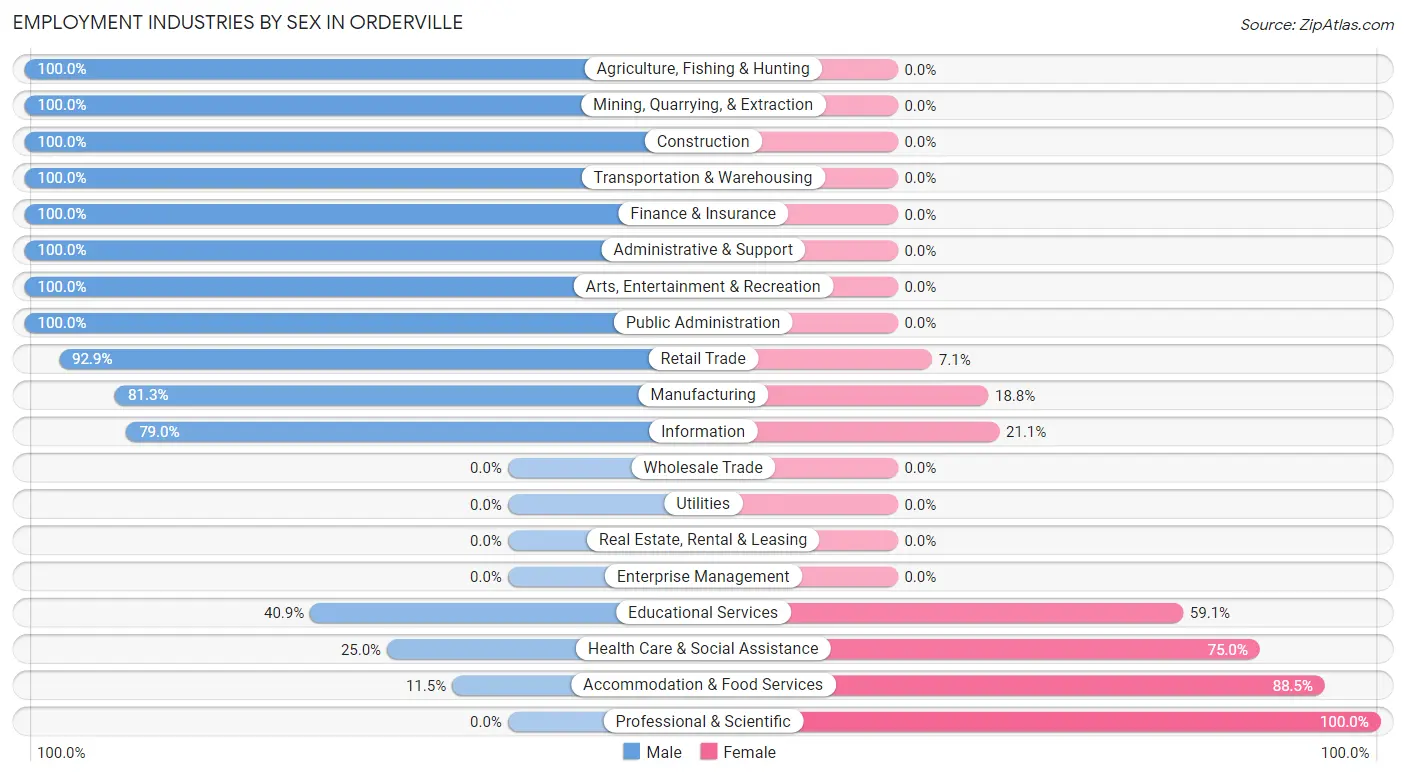
Employment Industries by Sex in Orderville
The Orderville industries that see more men than women are Agriculture, Fishing & Hunting (100.0%), Mining, Quarrying, & Extraction (100.0%), and Construction (100.0%), whereas the industries that tend to have a higher number of women are Professional & Scientific (100.0%), Accommodation & Food Services (88.5%), and Health Care & Social Assistance (75.0%).
| Industry | Male | Female |
| Agriculture, Fishing & Hunting | 9 (100.0%) | 0 (0.0%) |
| Mining, Quarrying, & Extraction | 10 (100.0%) | 0 (0.0%) |
| Construction | 2 (100.0%) | 0 (0.0%) |
| Manufacturing | 13 (81.2%) | 3 (18.8%) |
| Wholesale Trade | 0 (0.0%) | 0 (0.0%) |
| Retail Trade | 13 (92.9%) | 1 (7.1%) |
| Transportation & Warehousing | 12 (100.0%) | 0 (0.0%) |
| Utilities | 0 (0.0%) | 0 (0.0%) |
| Information | 15 (78.9%) | 4 (21.0%) |
| Finance & Insurance | 5 (100.0%) | 0 (0.0%) |
| Real Estate, Rental & Leasing | 0 (0.0%) | 0 (0.0%) |
| Professional & Scientific | 0 (0.0%) | 2 (100.0%) |
| Enterprise Management | 0 (0.0%) | 0 (0.0%) |
| Administrative & Support | 12 (100.0%) | 0 (0.0%) |
| Educational Services | 9 (40.9%) | 13 (59.1%) |
| Health Care & Social Assistance | 4 (25.0%) | 12 (75.0%) |
| Arts, Entertainment & Recreation | 11 (100.0%) | 0 (0.0%) |
| Accommodation & Food Services | 6 (11.5%) | 46 (88.5%) |
| Public Administration | 23 (100.0%) | 0 (0.0%) |
| Total | 144 (54.5%) | 120 (45.5%) |
Education in Orderville
School Enrollment in Orderville
The most common levels of schooling among the 171 students in Orderville are nursery / preschool (47 | 27.5%), middle school (41 | 24.0%), and high school (40 | 23.4%).
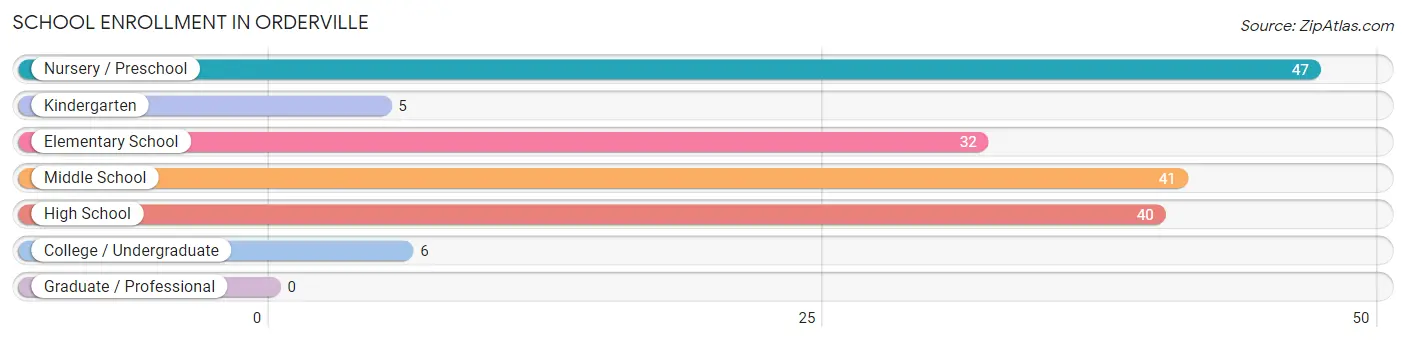
| School Level | # Students | % Students |
| Nursery / Preschool | 47 | 27.5% |
| Kindergarten | 5 | 2.9% |
| Elementary School | 32 | 18.7% |
| Middle School | 41 | 24.0% |
| High School | 40 | 23.4% |
| College / Undergraduate | 6 | 3.5% |
| Graduate / Professional | 0 | 0.0% |
| Total | 171 | 100.0% |
School Enrollment by Age by Funding Source in Orderville
Out of a total of 171 students who are enrolled in schools in Orderville, 10 (5.8%) attend a private institution, while the remaining 161 (94.2%) are enrolled in public schools. The age group of 35 years and over has the highest likelihood of being enrolled in private schools, with 6 (100.0% in the age bracket) enrolled. Conversely, the age group of 3 to 4 year olds has the lowest likelihood of being enrolled in a private school, with 16 (100.0% in the age bracket) attending a public institution.
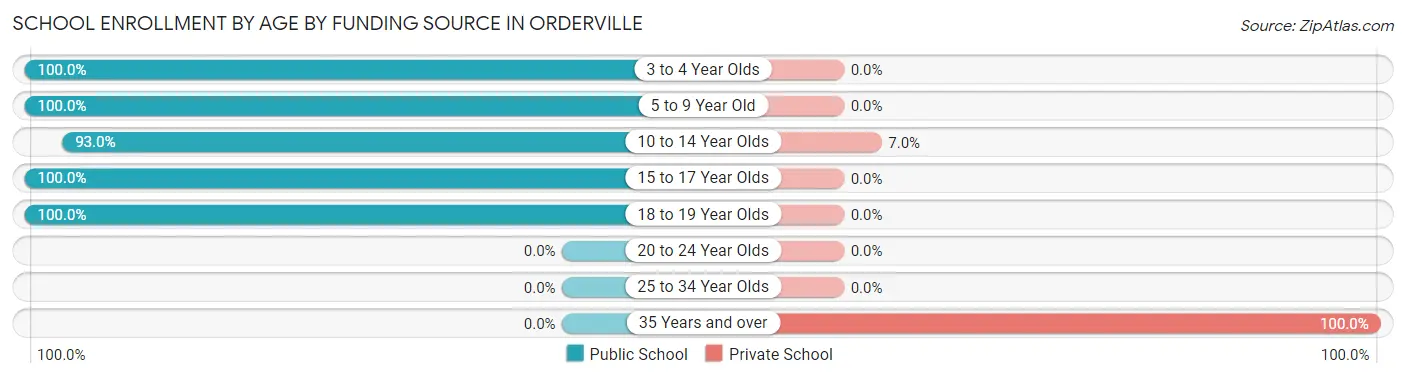
| Age Bracket | Public School | Private School |
| 3 to 4 Year Olds | 16 (100.0%) | 0 (0.0%) |
| 5 to 9 Year Old | 66 (100.0%) | 0 (0.0%) |
| 10 to 14 Year Olds | 53 (93.0%) | 4 (7.0%) |
| 15 to 17 Year Olds | 16 (100.0%) | 0 (0.0%) |
| 18 to 19 Year Olds | 10 (100.0%) | 0 (0.0%) |
| 20 to 24 Year Olds | 0 (0.0%) | 0 (0.0%) |
| 25 to 34 Year Olds | 0 (0.0%) | 0 (0.0%) |
| 35 Years and over | 0 (0.0%) | 6 (100.0%) |
| Total | 161 (94.2%) | 10 (5.8%) |
Educational Attainment by Field of Study in Orderville
Education (46 | 29.3%), business (37 | 23.6%), arts & humanities (33 | 21.0%), psychology (17 | 10.8%), and bio, nature & agricultural (12 | 7.6%) are the most common fields of study among 157 individuals in Orderville who have obtained a bachelor's degree or higher.
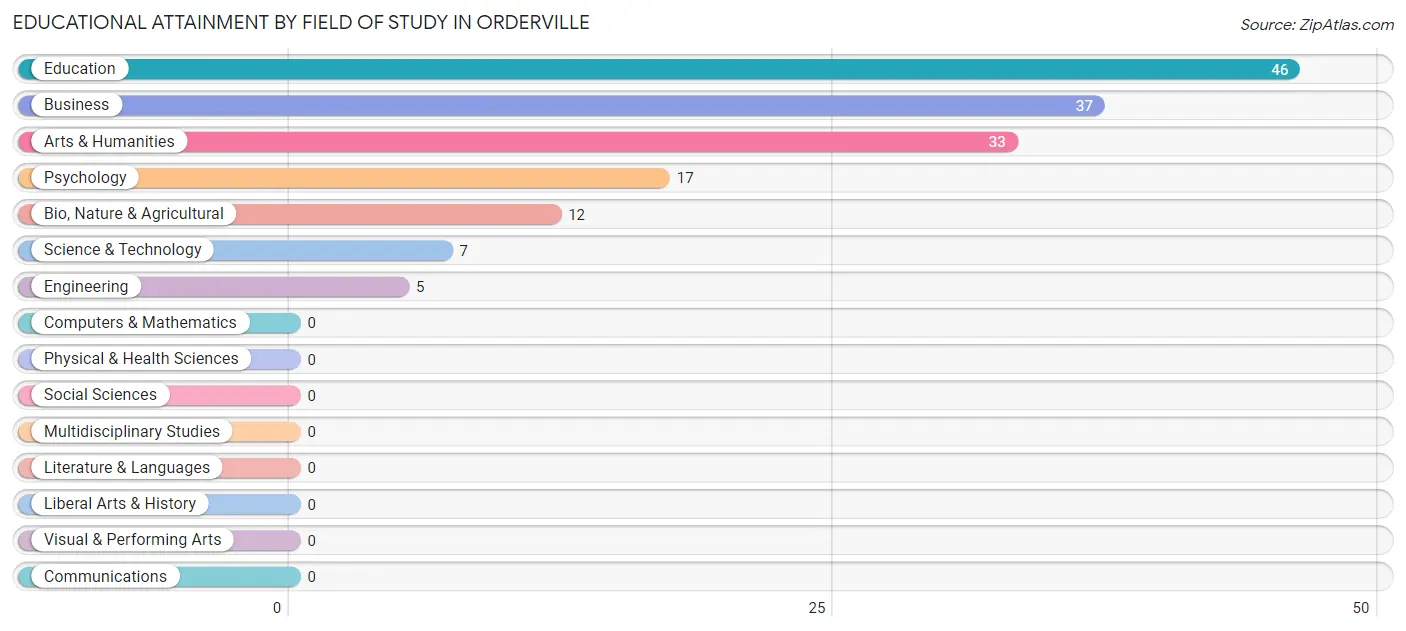
| Field of Study | # Graduates | % Graduates |
| Computers & Mathematics | 0 | 0.0% |
| Bio, Nature & Agricultural | 12 | 7.6% |
| Physical & Health Sciences | 0 | 0.0% |
| Psychology | 17 | 10.8% |
| Social Sciences | 0 | 0.0% |
| Engineering | 5 | 3.2% |
| Multidisciplinary Studies | 0 | 0.0% |
| Science & Technology | 7 | 4.5% |
| Business | 37 | 23.6% |
| Education | 46 | 29.3% |
| Literature & Languages | 0 | 0.0% |
| Liberal Arts & History | 0 | 0.0% |
| Visual & Performing Arts | 0 | 0.0% |
| Communications | 0 | 0.0% |
| Arts & Humanities | 33 | 21.0% |
| Total | 157 | 100.0% |
Transportation & Commute in Orderville
Vehicle Availability by Sex in Orderville
The most prevalent vehicle ownership categories in Orderville are males with 2 vehicles (54, accounting for 37.5%) and females with 2 vehicles (54, making up 45.0%).
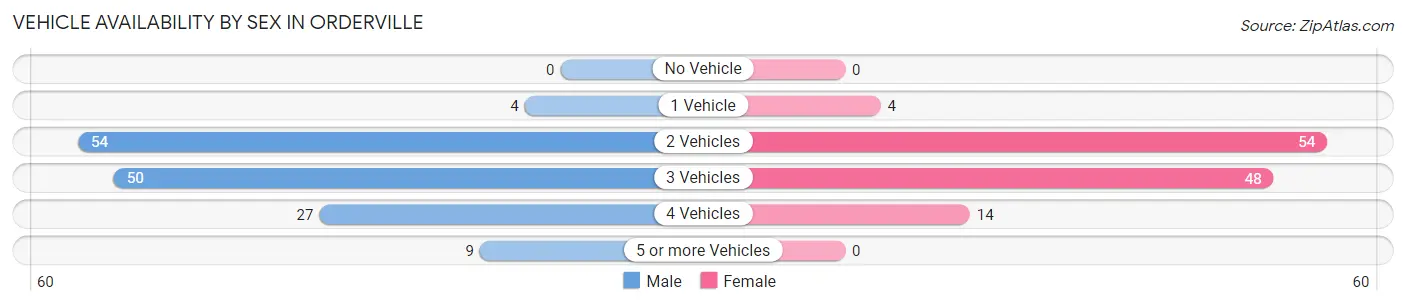
| Vehicles Available | Male | Female |
| No Vehicle | 0 (0.0%) | 0 (0.0%) |
| 1 Vehicle | 4 (2.8%) | 4 (3.3%) |
| 2 Vehicles | 54 (37.5%) | 54 (45.0%) |
| 3 Vehicles | 50 (34.7%) | 48 (40.0%) |
| 4 Vehicles | 27 (18.8%) | 14 (11.7%) |
| 5 or more Vehicles | 9 (6.2%) | 0 (0.0%) |
| Total | 144 (100.0%) | 120 (100.0%) |
Commute Time in Orderville
The most frequently occuring commute durations in Orderville are less than 5 minutes (83 commuters, 32.3%), 5 to 9 minutes (53 commuters, 20.6%), and 25 to 29 minutes (30 commuters, 11.7%).
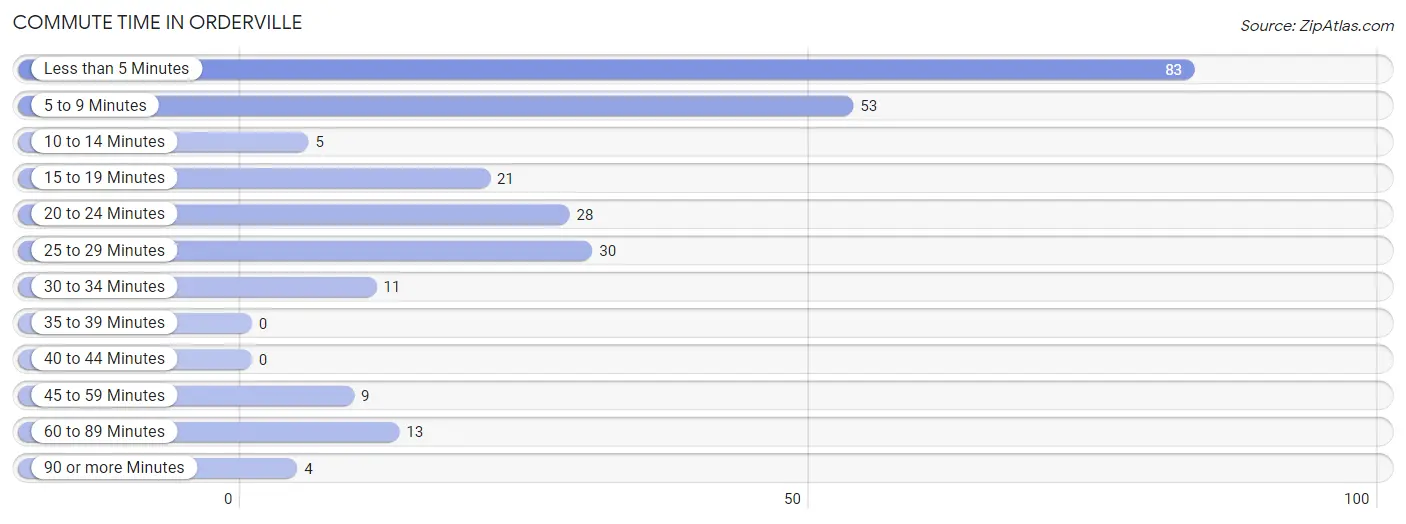
| Commute Time | # Commuters | % Commuters |
| Less than 5 Minutes | 83 | 32.3% |
| 5 to 9 Minutes | 53 | 20.6% |
| 10 to 14 Minutes | 5 | 1.9% |
| 15 to 19 Minutes | 21 | 8.2% |
| 20 to 24 Minutes | 28 | 10.9% |
| 25 to 29 Minutes | 30 | 11.7% |
| 30 to 34 Minutes | 11 | 4.3% |
| 35 to 39 Minutes | 0 | 0.0% |
| 40 to 44 Minutes | 0 | 0.0% |
| 45 to 59 Minutes | 9 | 3.5% |
| 60 to 89 Minutes | 13 | 5.1% |
| 90 or more Minutes | 4 | 1.6% |
Commute Time by Sex in Orderville
The most common commute times in Orderville are less than 5 minutes (62 commuters, 43.1%) for males and 5 to 9 minutes (36 commuters, 31.9%) for females.
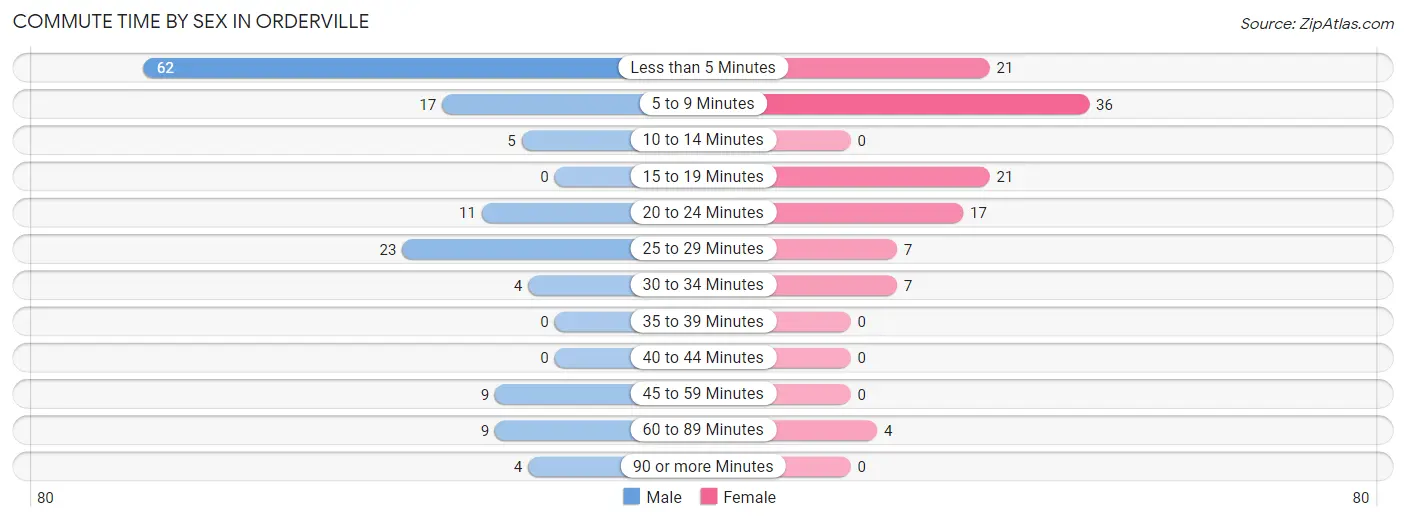
| Commute Time | Male | Female |
| Less than 5 Minutes | 62 (43.1%) | 21 (18.6%) |
| 5 to 9 Minutes | 17 (11.8%) | 36 (31.9%) |
| 10 to 14 Minutes | 5 (3.5%) | 0 (0.0%) |
| 15 to 19 Minutes | 0 (0.0%) | 21 (18.6%) |
| 20 to 24 Minutes | 11 (7.6%) | 17 (15.0%) |
| 25 to 29 Minutes | 23 (16.0%) | 7 (6.2%) |
| 30 to 34 Minutes | 4 (2.8%) | 7 (6.2%) |
| 35 to 39 Minutes | 0 (0.0%) | 0 (0.0%) |
| 40 to 44 Minutes | 0 (0.0%) | 0 (0.0%) |
| 45 to 59 Minutes | 9 (6.2%) | 0 (0.0%) |
| 60 to 89 Minutes | 9 (6.2%) | 4 (3.5%) |
| 90 or more Minutes | 4 (2.8%) | 0 (0.0%) |
Time of Departure to Work by Sex in Orderville
The most frequent times of departure to work in Orderville are 7:30 AM to 7:59 AM (29, 20.1%) for males and 7:30 AM to 7:59 AM (28, 24.8%) for females.
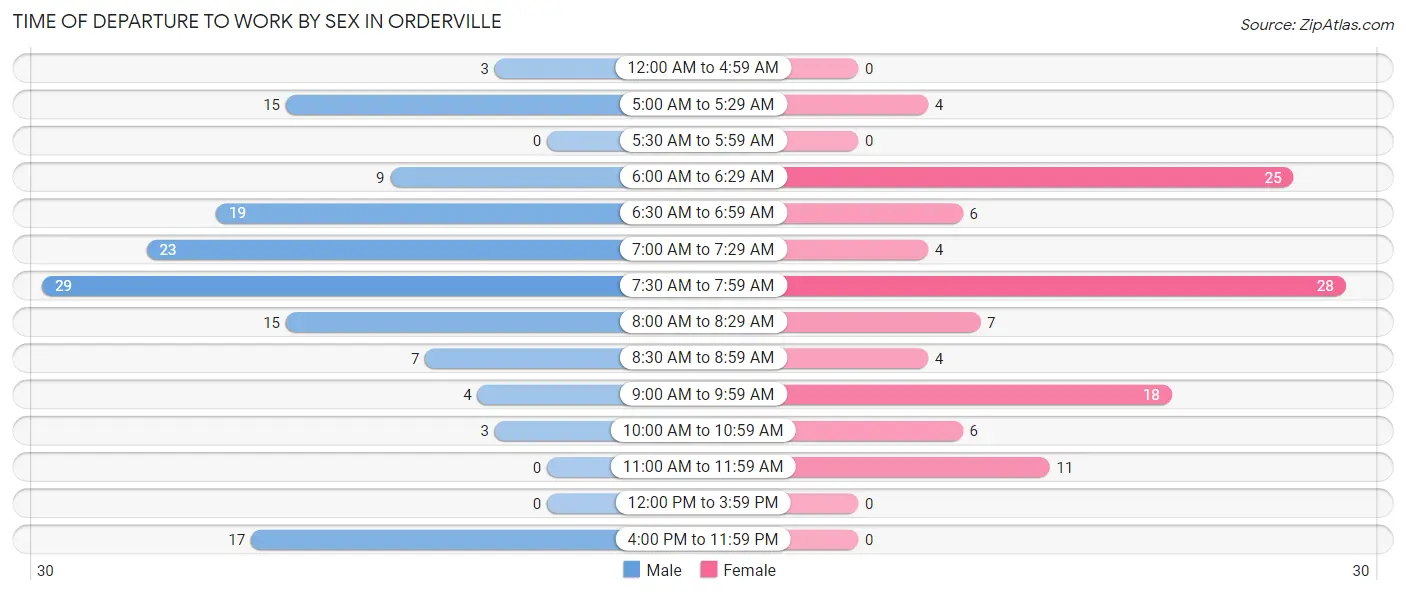
| Time of Departure | Male | Female |
| 12:00 AM to 4:59 AM | 3 (2.1%) | 0 (0.0%) |
| 5:00 AM to 5:29 AM | 15 (10.4%) | 4 (3.5%) |
| 5:30 AM to 5:59 AM | 0 (0.0%) | 0 (0.0%) |
| 6:00 AM to 6:29 AM | 9 (6.2%) | 25 (22.1%) |
| 6:30 AM to 6:59 AM | 19 (13.2%) | 6 (5.3%) |
| 7:00 AM to 7:29 AM | 23 (16.0%) | 4 (3.5%) |
| 7:30 AM to 7:59 AM | 29 (20.1%) | 28 (24.8%) |
| 8:00 AM to 8:29 AM | 15 (10.4%) | 7 (6.2%) |
| 8:30 AM to 8:59 AM | 7 (4.9%) | 4 (3.5%) |
| 9:00 AM to 9:59 AM | 4 (2.8%) | 18 (15.9%) |
| 10:00 AM to 10:59 AM | 3 (2.1%) | 6 (5.3%) |
| 11:00 AM to 11:59 AM | 0 (0.0%) | 11 (9.7%) |
| 12:00 PM to 3:59 PM | 0 (0.0%) | 0 (0.0%) |
| 4:00 PM to 11:59 PM | 17 (11.8%) | 0 (0.0%) |
| Total | 144 (100.0%) | 113 (100.0%) |
Housing Occupancy in Orderville
Occupancy by Ownership in Orderville
Of the total 218 dwellings in Orderville, owner-occupied units account for 203 (93.1%), while renter-occupied units make up 15 (6.9%).
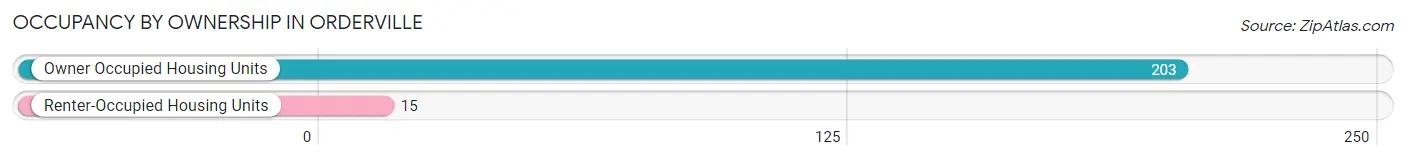
| Occupancy | # Housing Units | % Housing Units |
| Owner Occupied Housing Units | 203 | 93.1% |
| Renter-Occupied Housing Units | 15 | 6.9% |
| Total Occupied Housing Units | 218 | 100.0% |
Occupancy by Household Size in Orderville
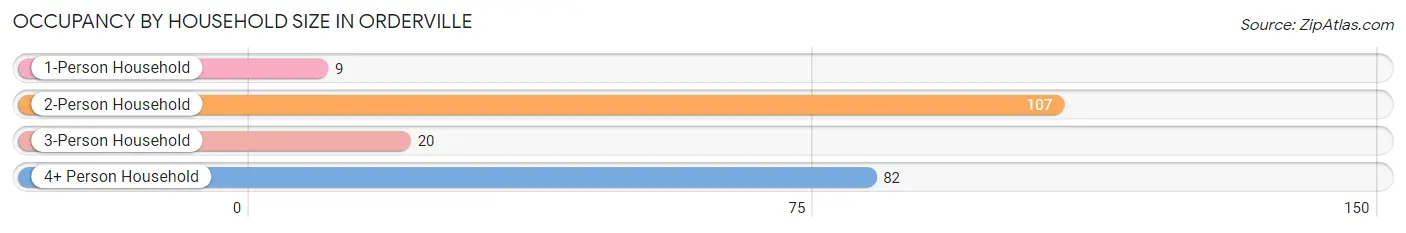
| Household Size | # Housing Units | % Housing Units |
| 1-Person Household | 9 | 4.1% |
| 2-Person Household | 107 | 49.1% |
| 3-Person Household | 20 | 9.2% |
| 4+ Person Household | 82 | 37.6% |
| Total Housing Units | 218 | 100.0% |
Occupancy by Ownership by Household Size in Orderville
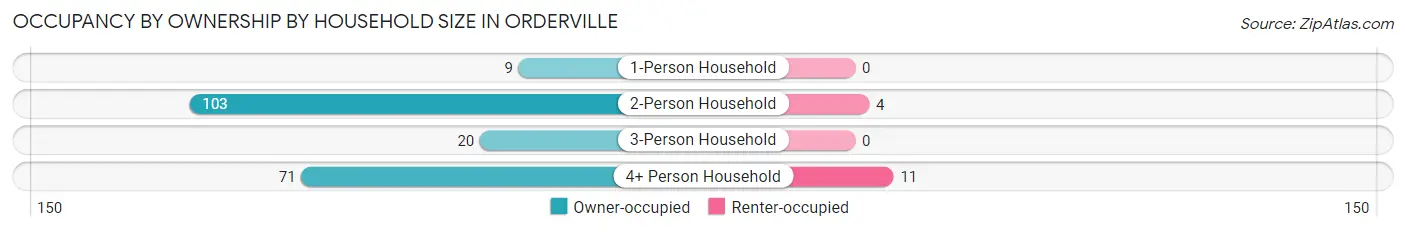
| Household Size | Owner-occupied | Renter-occupied |
| 1-Person Household | 9 (100.0%) | 0 (0.0%) |
| 2-Person Household | 103 (96.3%) | 4 (3.7%) |
| 3-Person Household | 20 (100.0%) | 0 (0.0%) |
| 4+ Person Household | 71 (86.6%) | 11 (13.4%) |
| Total Housing Units | 203 (93.1%) | 15 (6.9%) |
Occupancy by Educational Attainment in Orderville
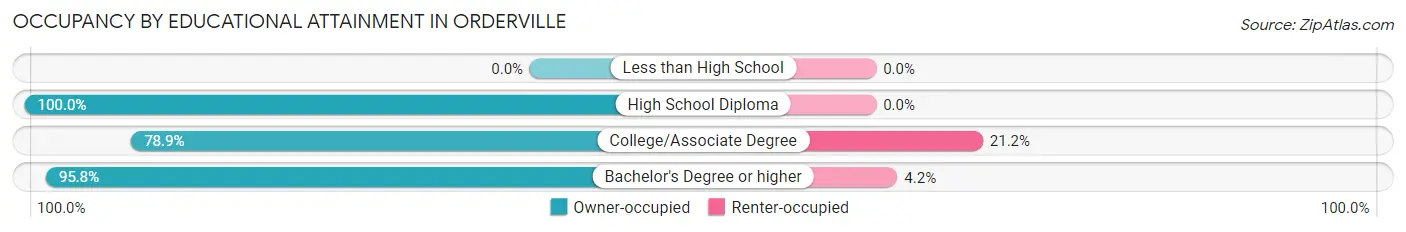
| Household Size | Owner-occupied | Renter-occupied |
| Less than High School | 0 (0.0%) | 0 (0.0%) |
| High School Diploma | 71 (100.0%) | 0 (0.0%) |
| College/Associate Degree | 41 (78.8%) | 11 (21.1%) |
| Bachelor's Degree or higher | 91 (95.8%) | 4 (4.2%) |
Occupancy by Age of Householder in Orderville
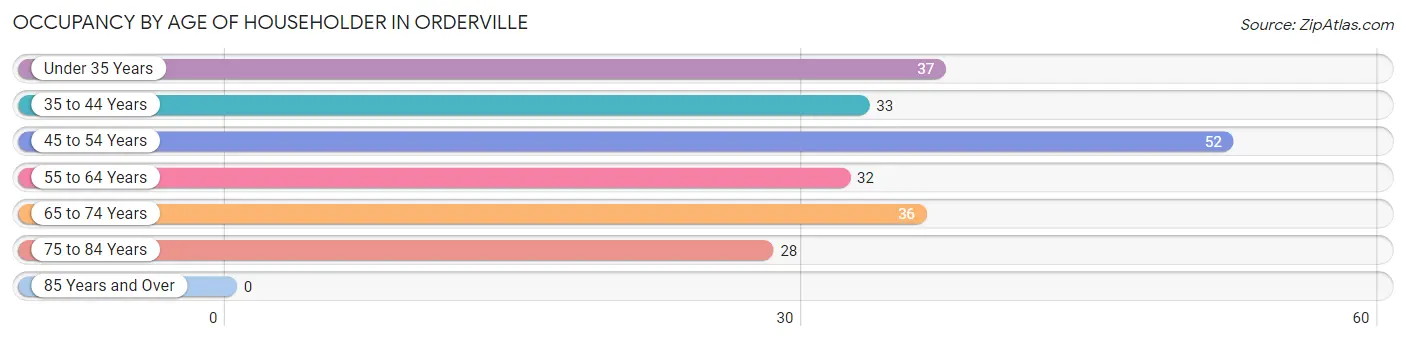
| Age Bracket | # Households | % Households |
| Under 35 Years | 37 | 17.0% |
| 35 to 44 Years | 33 | 15.1% |
| 45 to 54 Years | 52 | 23.8% |
| 55 to 64 Years | 32 | 14.7% |
| 65 to 74 Years | 36 | 16.5% |
| 75 to 84 Years | 28 | 12.8% |
| 85 Years and Over | 0 | 0.0% |
| Total | 218 | 100.0% |
Housing Finances in Orderville
Median Income by Occupancy in Orderville
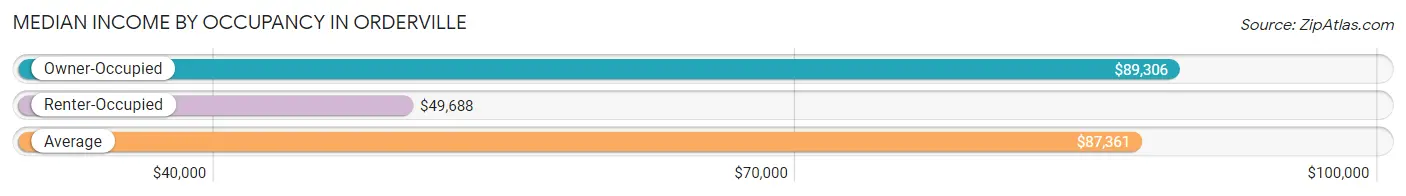
| Occupancy Type | # Households | Median Income |
| Owner-Occupied | 203 (93.1%) | $89,306 |
| Renter-Occupied | 15 (6.9%) | $49,688 |
| Average | 218 (100.0%) | $87,361 |
Occupancy by Householder Income Bracket in Orderville
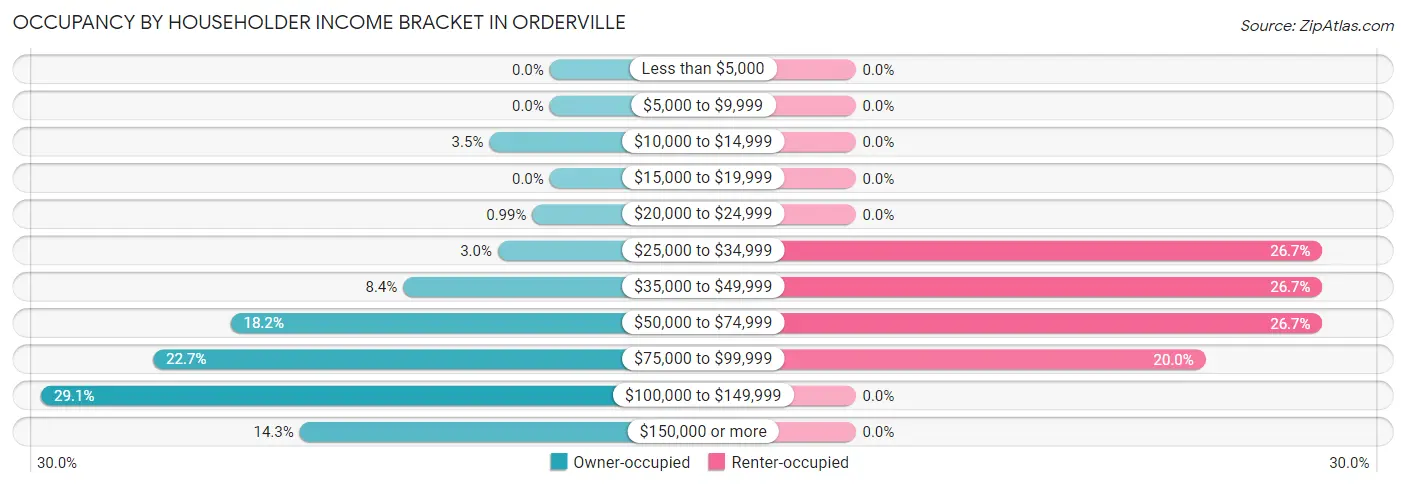
| Income Bracket | Owner-occupied | Renter-occupied |
| Less than $5,000 | 0 (0.0%) | 0 (0.0%) |
| $5,000 to $9,999 | 0 (0.0%) | 0 (0.0%) |
| $10,000 to $14,999 | 7 (3.5%) | 0 (0.0%) |
| $15,000 to $19,999 | 0 (0.0%) | 0 (0.0%) |
| $20,000 to $24,999 | 2 (1.0%) | 0 (0.0%) |
| $25,000 to $34,999 | 6 (3.0%) | 4 (26.7%) |
| $35,000 to $49,999 | 17 (8.4%) | 4 (26.7%) |
| $50,000 to $74,999 | 37 (18.2%) | 4 (26.7%) |
| $75,000 to $99,999 | 46 (22.7%) | 3 (20.0%) |
| $100,000 to $149,999 | 59 (29.1%) | 0 (0.0%) |
| $150,000 or more | 29 (14.3%) | 0 (0.0%) |
| Total | 203 (100.0%) | 15 (100.0%) |
Monthly Housing Cost Tiers in Orderville
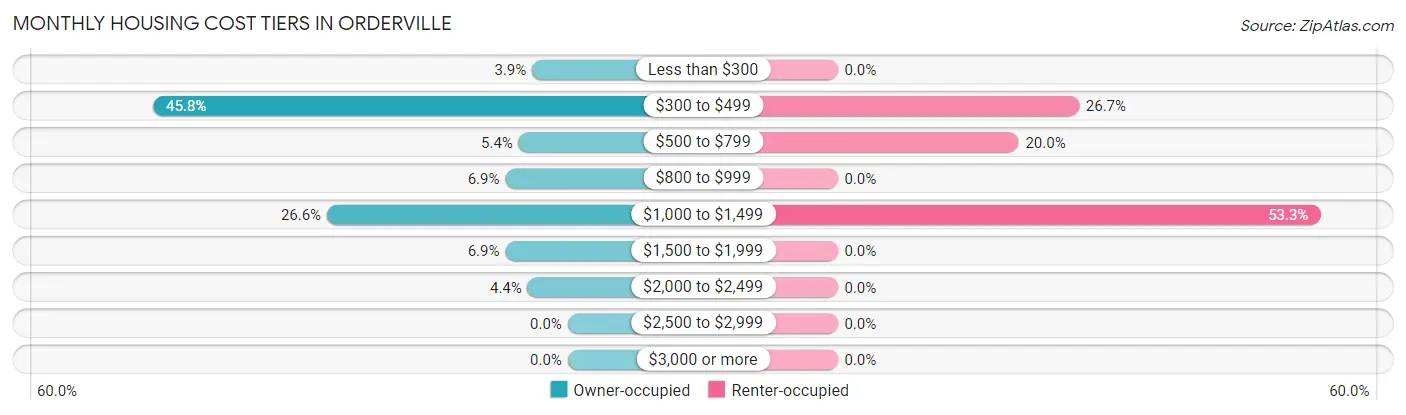
| Monthly Cost | Owner-occupied | Renter-occupied |
| Less than $300 | 8 (3.9%) | 0 (0.0%) |
| $300 to $499 | 93 (45.8%) | 4 (26.7%) |
| $500 to $799 | 11 (5.4%) | 3 (20.0%) |
| $800 to $999 | 14 (6.9%) | 0 (0.0%) |
| $1,000 to $1,499 | 54 (26.6%) | 8 (53.3%) |
| $1,500 to $1,999 | 14 (6.9%) | 0 (0.0%) |
| $2,000 to $2,499 | 9 (4.4%) | 0 (0.0%) |
| $2,500 to $2,999 | 0 (0.0%) | 0 (0.0%) |
| $3,000 or more | 0 (0.0%) | 0 (0.0%) |
| Total | 203 (100.0%) | 15 (100.0%) |
Physical Housing Characteristics in Orderville
Housing Structures in Orderville
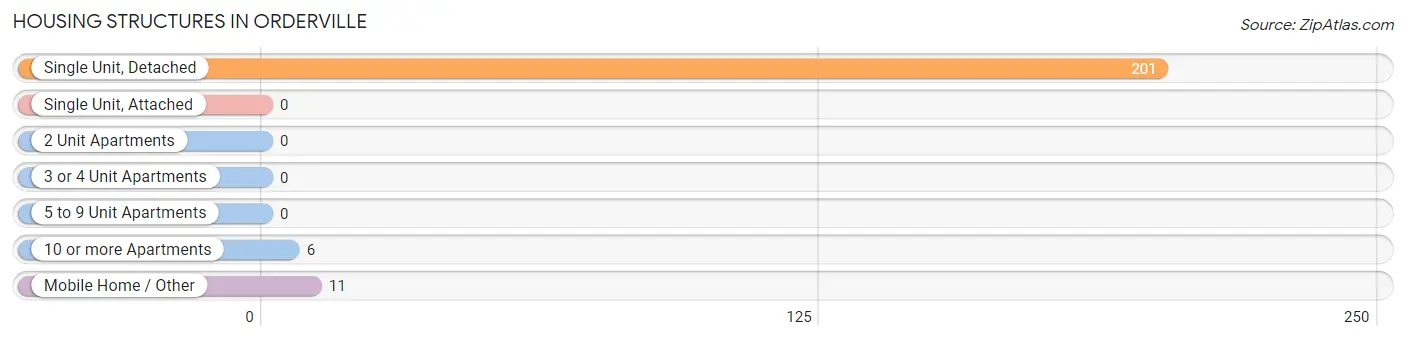
| Structure Type | # Housing Units | % Housing Units |
| Single Unit, Detached | 201 | 92.2% |
| Single Unit, Attached | 0 | 0.0% |
| 2 Unit Apartments | 0 | 0.0% |
| 3 or 4 Unit Apartments | 0 | 0.0% |
| 5 to 9 Unit Apartments | 0 | 0.0% |
| 10 or more Apartments | 6 | 2.8% |
| Mobile Home / Other | 11 | 5.1% |
| Total | 218 | 100.0% |
Housing Structures by Occupancy in Orderville
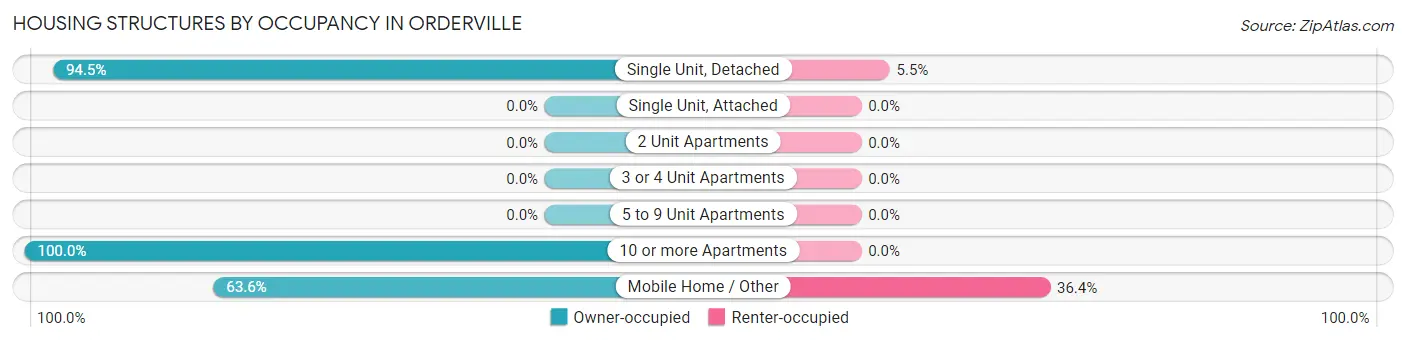
| Structure Type | Owner-occupied | Renter-occupied |
| Single Unit, Detached | 190 (94.5%) | 11 (5.5%) |
| Single Unit, Attached | 0 (0.0%) | 0 (0.0%) |
| 2 Unit Apartments | 0 (0.0%) | 0 (0.0%) |
| 3 or 4 Unit Apartments | 0 (0.0%) | 0 (0.0%) |
| 5 to 9 Unit Apartments | 0 (0.0%) | 0 (0.0%) |
| 10 or more Apartments | 6 (100.0%) | 0 (0.0%) |
| Mobile Home / Other | 7 (63.6%) | 4 (36.4%) |
| Total | 203 (93.1%) | 15 (6.9%) |
Housing Structures by Number of Rooms in Orderville
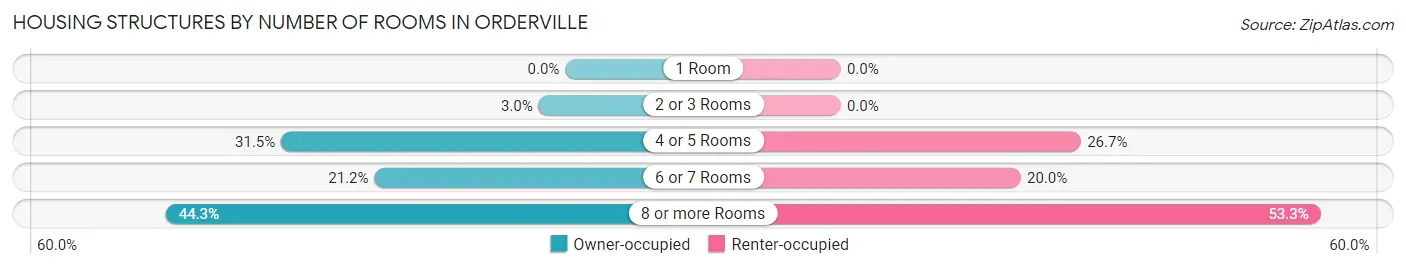
| Number of Rooms | Owner-occupied | Renter-occupied |
| 1 Room | 0 (0.0%) | 0 (0.0%) |
| 2 or 3 Rooms | 6 (3.0%) | 0 (0.0%) |
| 4 or 5 Rooms | 64 (31.5%) | 4 (26.7%) |
| 6 or 7 Rooms | 43 (21.2%) | 3 (20.0%) |
| 8 or more Rooms | 90 (44.3%) | 8 (53.3%) |
| Total | 203 (100.0%) | 15 (100.0%) |
Housing Structure by Heating Type in Orderville
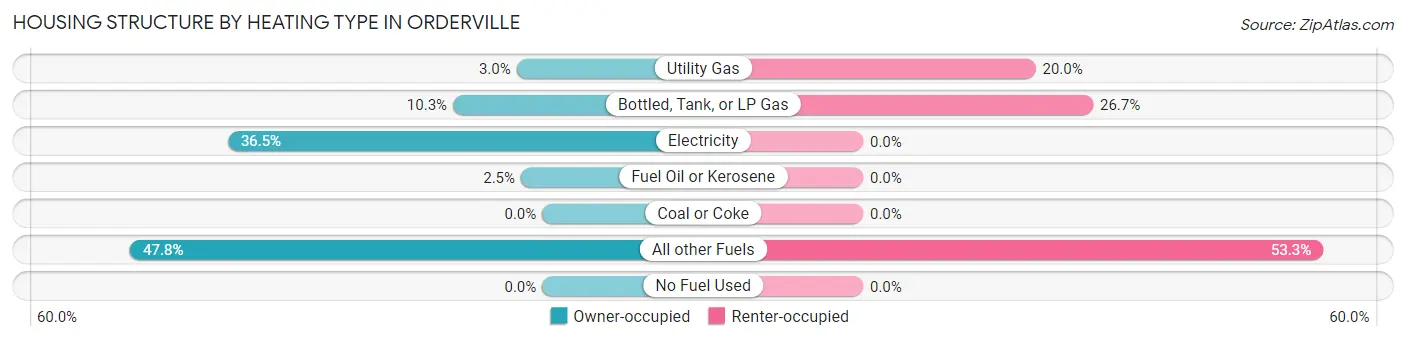
| Heating Type | Owner-occupied | Renter-occupied |
| Utility Gas | 6 (3.0%) | 3 (20.0%) |
| Bottled, Tank, or LP Gas | 21 (10.3%) | 4 (26.7%) |
| Electricity | 74 (36.4%) | 0 (0.0%) |
| Fuel Oil or Kerosene | 5 (2.5%) | 0 (0.0%) |
| Coal or Coke | 0 (0.0%) | 0 (0.0%) |
| All other Fuels | 97 (47.8%) | 8 (53.3%) |
| No Fuel Used | 0 (0.0%) | 0 (0.0%) |
| Total | 203 (100.0%) | 15 (100.0%) |
Household Vehicle Usage in Orderville
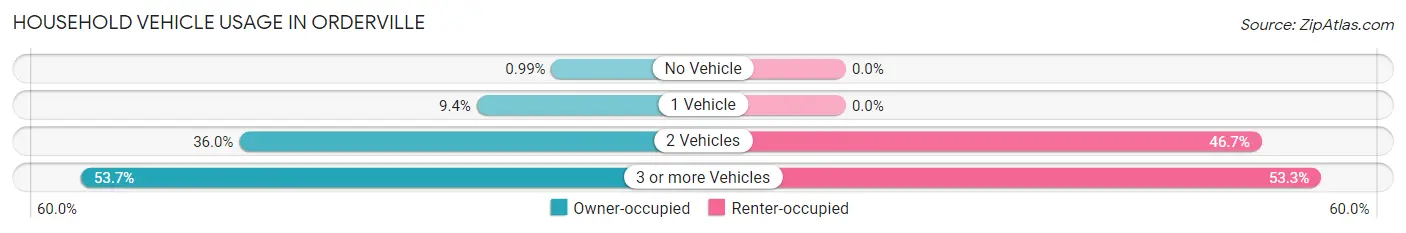
| Vehicles per Household | Owner-occupied | Renter-occupied |
| No Vehicle | 2 (1.0%) | 0 (0.0%) |
| 1 Vehicle | 19 (9.4%) | 0 (0.0%) |
| 2 Vehicles | 73 (36.0%) | 7 (46.7%) |
| 3 or more Vehicles | 109 (53.7%) | 8 (53.3%) |
| Total | 203 (100.0%) | 15 (100.0%) |
Real Estate & Mortgages in Orderville
Real Estate and Mortgage Overview in Orderville
| Characteristic | Without Mortgage | With Mortgage |
| Housing Units | 114 | 89 |
| Median Property Value | $307,700 | $238,300 |
| Median Household Income | $73,750 | $27 |
| Monthly Housing Costs | $347 | $0 |
| Real Estate Taxes | $1,205 | $0 |
Property Value by Mortgage Status in Orderville
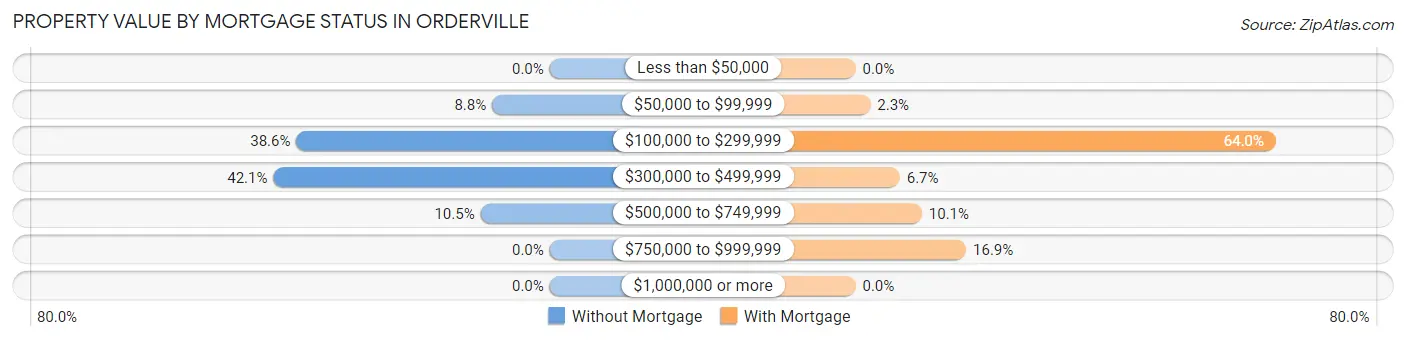
| Property Value | Without Mortgage | With Mortgage |
| Less than $50,000 | 0 (0.0%) | 0 (0.0%) |
| $50,000 to $99,999 | 10 (8.8%) | 2 (2.2%) |
| $100,000 to $299,999 | 44 (38.6%) | 57 (64.0%) |
| $300,000 to $499,999 | 48 (42.1%) | 6 (6.7%) |
| $500,000 to $749,999 | 12 (10.5%) | 9 (10.1%) |
| $750,000 to $999,999 | 0 (0.0%) | 15 (16.9%) |
| $1,000,000 or more | 0 (0.0%) | 0 (0.0%) |
| Total | 114 (100.0%) | 89 (100.0%) |
Household Income by Mortgage Status in Orderville
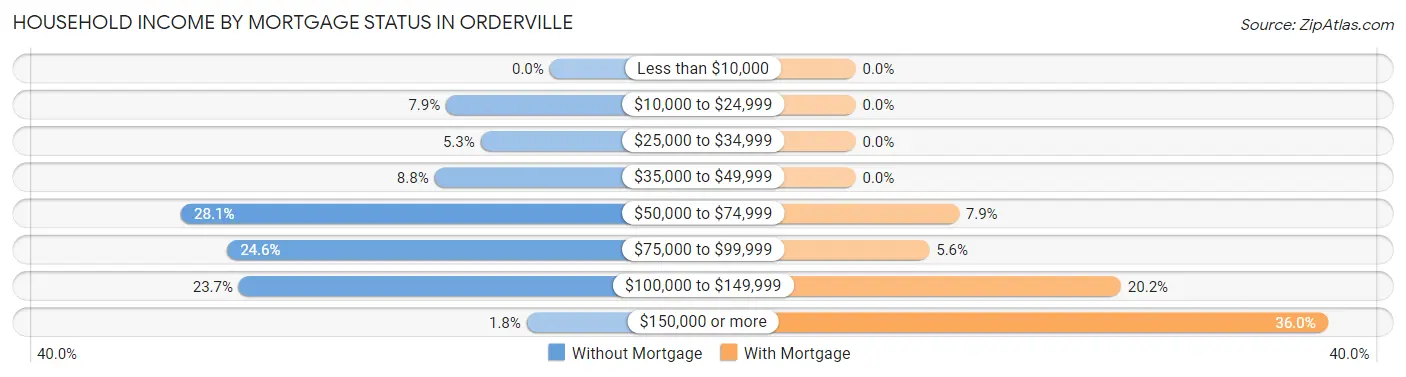
| Household Income | Without Mortgage | With Mortgage |
| Less than $10,000 | 0 (0.0%) | 0 (0.0%) |
| $10,000 to $24,999 | 9 (7.9%) | 0 (0.0%) |
| $25,000 to $34,999 | 6 (5.3%) | 0 (0.0%) |
| $35,000 to $49,999 | 10 (8.8%) | 0 (0.0%) |
| $50,000 to $74,999 | 32 (28.1%) | 7 (7.9%) |
| $75,000 to $99,999 | 28 (24.6%) | 5 (5.6%) |
| $100,000 to $149,999 | 27 (23.7%) | 18 (20.2%) |
| $150,000 or more | 2 (1.8%) | 32 (36.0%) |
| Total | 114 (100.0%) | 89 (100.0%) |
Property Value to Household Income Ratio in Orderville
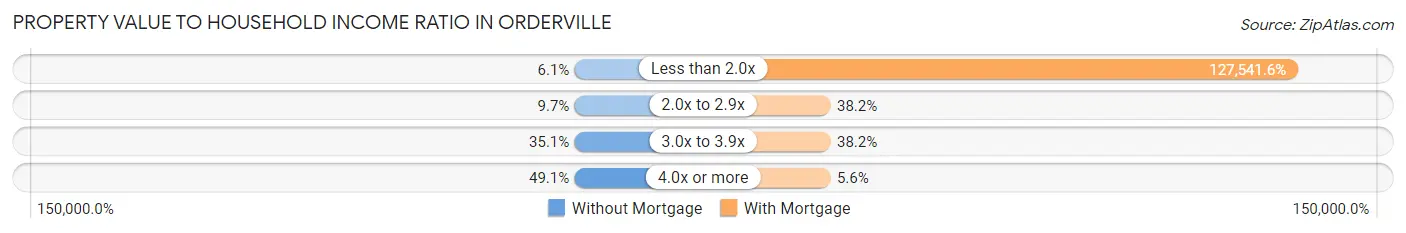
| Value-to-Income Ratio | Without Mortgage | With Mortgage |
| Less than 2.0x | 7 (6.1%) | 113,512 (127,541.6%) |
| 2.0x to 2.9x | 11 (9.7%) | 34 (38.2%) |
| 3.0x to 3.9x | 40 (35.1%) | 34 (38.2%) |
| 4.0x or more | 56 (49.1%) | 5 (5.6%) |
| Total | 114 (100.0%) | 89 (100.0%) |
Real Estate Taxes by Mortgage Status in Orderville
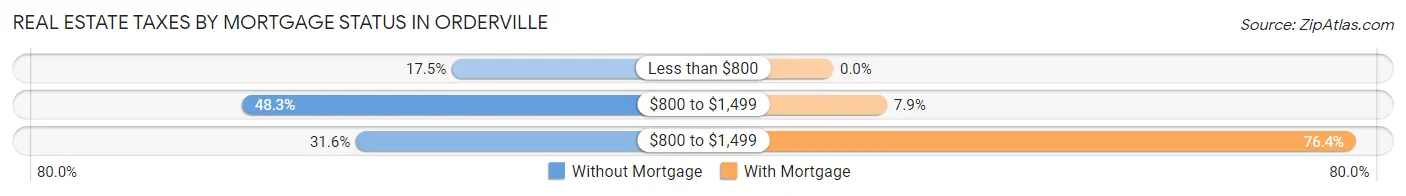
| Property Taxes | Without Mortgage | With Mortgage |
| Less than $800 | 20 (17.5%) | 0 (0.0%) |
| $800 to $1,499 | 55 (48.2%) | 7 (7.9%) |
| $800 to $1,499 | 36 (31.6%) | 68 (76.4%) |
| Total | 114 (100.0%) | 89 (100.0%) |
Health & Disability in Orderville
Health Insurance Coverage by Age in Orderville
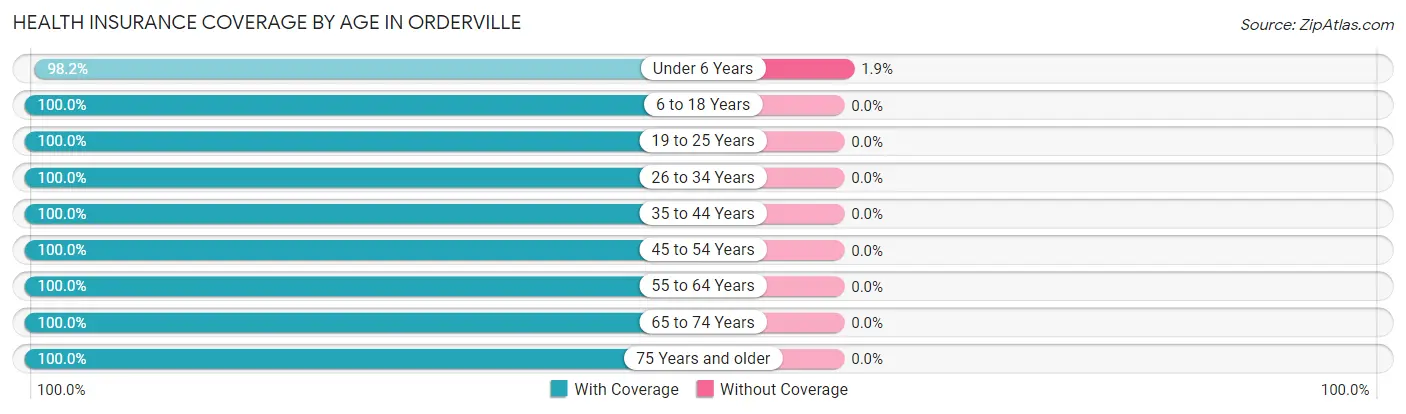
| Age Bracket | With Coverage | Without Coverage |
| Under 6 Years | 106 (98.2%) | 2 (1.8%) |
| 6 to 18 Years | 113 (100.0%) | 0 (0.0%) |
| 19 to 25 Years | 15 (100.0%) | 0 (0.0%) |
| 26 to 34 Years | 61 (100.0%) | 0 (0.0%) |
| 35 to 44 Years | 75 (100.0%) | 0 (0.0%) |
| 45 to 54 Years | 89 (100.0%) | 0 (0.0%) |
| 55 to 64 Years | 52 (100.0%) | 0 (0.0%) |
| 65 to 74 Years | 80 (100.0%) | 0 (0.0%) |
| 75 Years and older | 43 (100.0%) | 0 (0.0%) |
| Total | 634 (99.7%) | 2 (0.3%) |
Health Insurance Coverage by Citizenship Status in Orderville
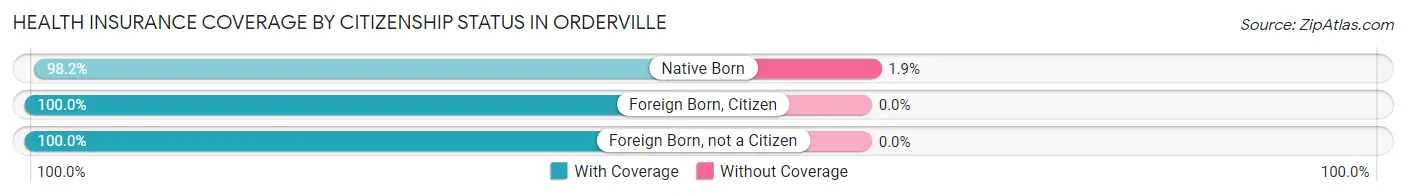
| Citizenship Status | With Coverage | Without Coverage |
| Native Born | 106 (98.2%) | 2 (1.8%) |
| Foreign Born, Citizen | 113 (100.0%) | 0 (0.0%) |
| Foreign Born, not a Citizen | 15 (100.0%) | 0 (0.0%) |
Health Insurance Coverage by Household Income in Orderville
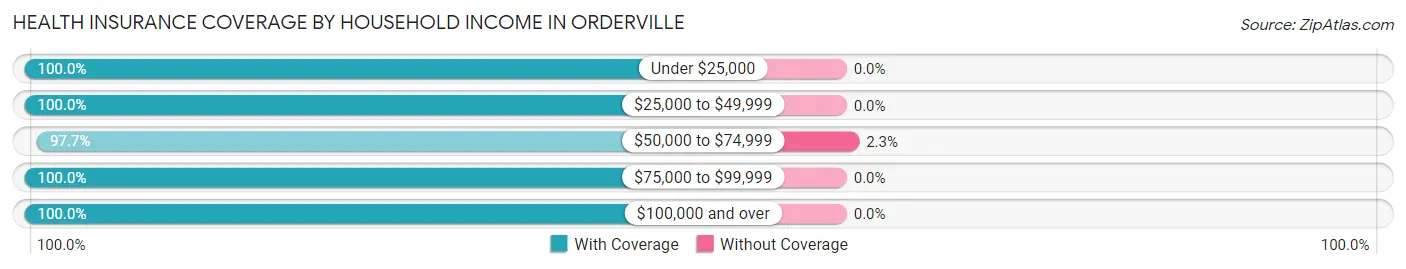
| Household Income | With Coverage | Without Coverage |
| Under $25,000 | 13 (100.0%) | 0 (0.0%) |
| $25,000 to $49,999 | 112 (100.0%) | 0 (0.0%) |
| $50,000 to $74,999 | 84 (97.7%) | 2 (2.3%) |
| $75,000 to $99,999 | 147 (100.0%) | 0 (0.0%) |
| $100,000 and over | 278 (100.0%) | 0 (0.0%) |
Public vs Private Health Insurance Coverage by Age in Orderville
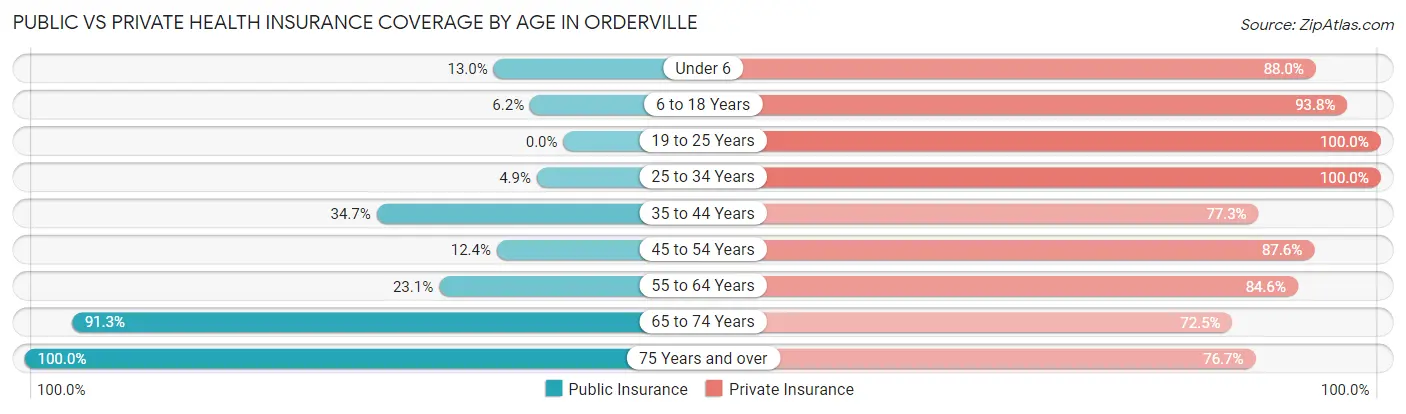
| Age Bracket | Public Insurance | Private Insurance |
| Under 6 | 14 (13.0%) | 95 (88.0%) |
| 6 to 18 Years | 7 (6.2%) | 106 (93.8%) |
| 19 to 25 Years | 0 (0.0%) | 15 (100.0%) |
| 25 to 34 Years | 3 (4.9%) | 61 (100.0%) |
| 35 to 44 Years | 26 (34.7%) | 58 (77.3%) |
| 45 to 54 Years | 11 (12.4%) | 78 (87.6%) |
| 55 to 64 Years | 12 (23.1%) | 44 (84.6%) |
| 65 to 74 Years | 73 (91.2%) | 58 (72.5%) |
| 75 Years and over | 43 (100.0%) | 33 (76.7%) |
| Total | 189 (29.7%) | 548 (86.2%) |
Disability Status by Sex by Age in Orderville
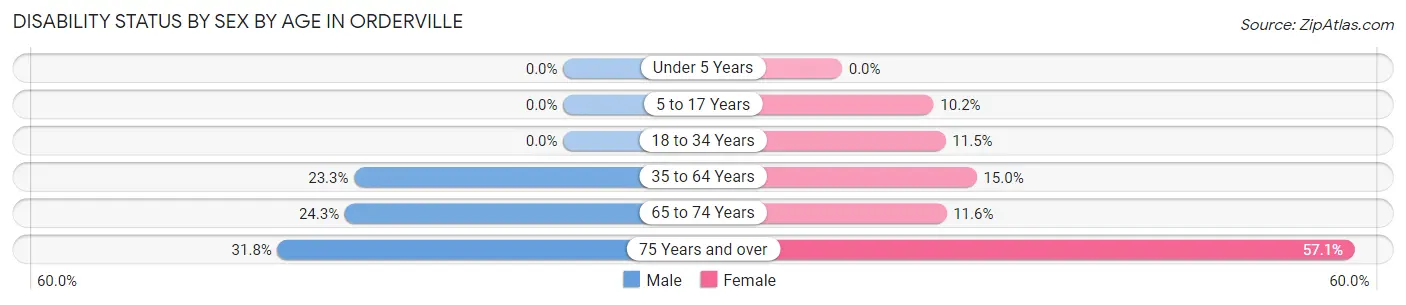
| Age Bracket | Male | Female |
| Under 5 Years | 0 (0.0%) | 0 (0.0%) |
| 5 to 17 Years | 0 (0.0%) | 5 (10.2%) |
| 18 to 34 Years | 0 (0.0%) | 6 (11.5%) |
| 35 to 64 Years | 27 (23.3%) | 15 (15.0%) |
| 65 to 74 Years | 9 (24.3%) | 5 (11.6%) |
| 75 Years and over | 7 (31.8%) | 12 (57.1%) |
Disability Class by Sex by Age in Orderville
Disability Class: Hearing Difficulty
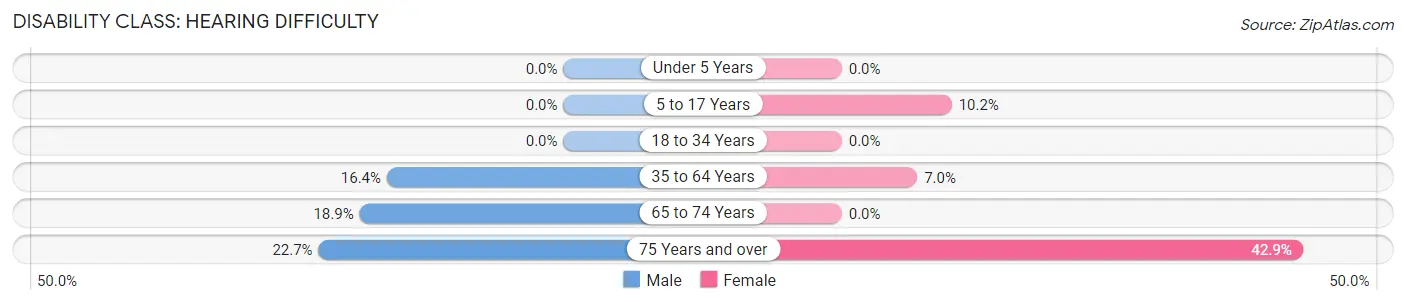
| Age Bracket | Male | Female |
| Under 5 Years | 0 (0.0%) | 0 (0.0%) |
| 5 to 17 Years | 0 (0.0%) | 5 (10.2%) |
| 18 to 34 Years | 0 (0.0%) | 0 (0.0%) |
| 35 to 64 Years | 19 (16.4%) | 7 (7.0%) |
| 65 to 74 Years | 7 (18.9%) | 0 (0.0%) |
| 75 Years and over | 5 (22.7%) | 9 (42.9%) |
Disability Class: Vision Difficulty
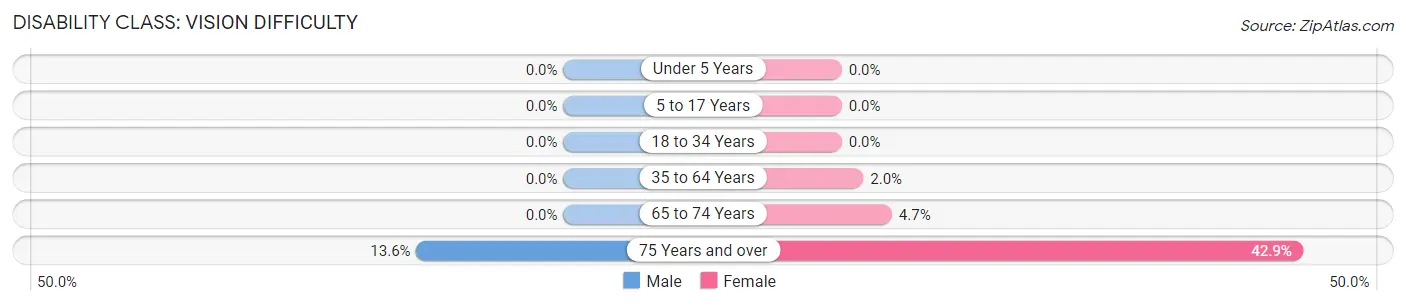
| Age Bracket | Male | Female |
| Under 5 Years | 0 (0.0%) | 0 (0.0%) |
| 5 to 17 Years | 0 (0.0%) | 0 (0.0%) |
| 18 to 34 Years | 0 (0.0%) | 0 (0.0%) |
| 35 to 64 Years | 0 (0.0%) | 2 (2.0%) |
| 65 to 74 Years | 0 (0.0%) | 2 (4.6%) |
| 75 Years and over | 3 (13.6%) | 9 (42.9%) |
Disability Class: Cognitive Difficulty
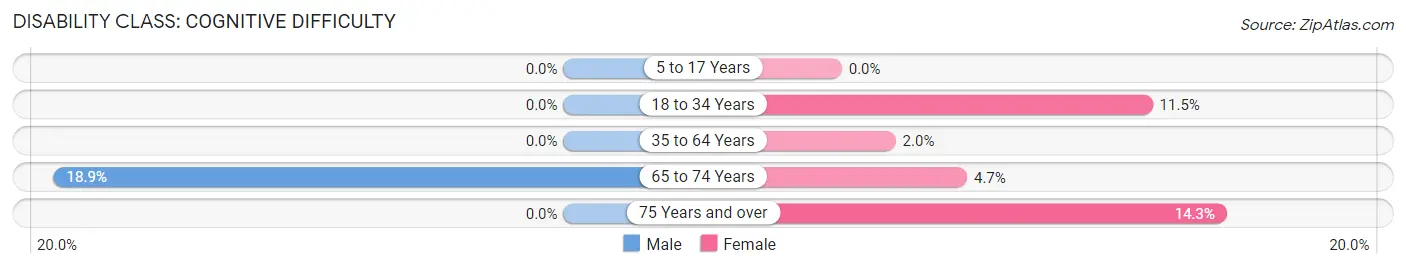
| Age Bracket | Male | Female |
| 5 to 17 Years | 0 (0.0%) | 0 (0.0%) |
| 18 to 34 Years | 0 (0.0%) | 6 (11.5%) |
| 35 to 64 Years | 0 (0.0%) | 2 (2.0%) |
| 65 to 74 Years | 7 (18.9%) | 2 (4.6%) |
| 75 Years and over | 0 (0.0%) | 3 (14.3%) |
Disability Class: Ambulatory Difficulty
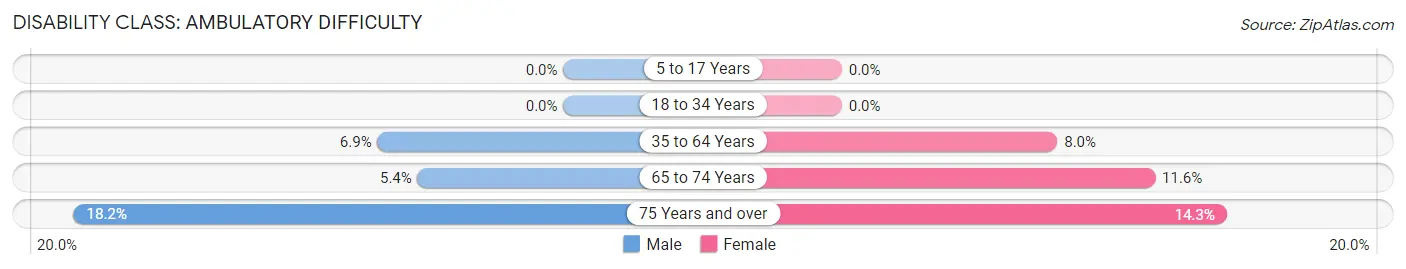
| Age Bracket | Male | Female |
| 5 to 17 Years | 0 (0.0%) | 0 (0.0%) |
| 18 to 34 Years | 0 (0.0%) | 0 (0.0%) |
| 35 to 64 Years | 8 (6.9%) | 8 (8.0%) |
| 65 to 74 Years | 2 (5.4%) | 5 (11.6%) |
| 75 Years and over | 4 (18.2%) | 3 (14.3%) |
Disability Class: Self-Care Difficulty
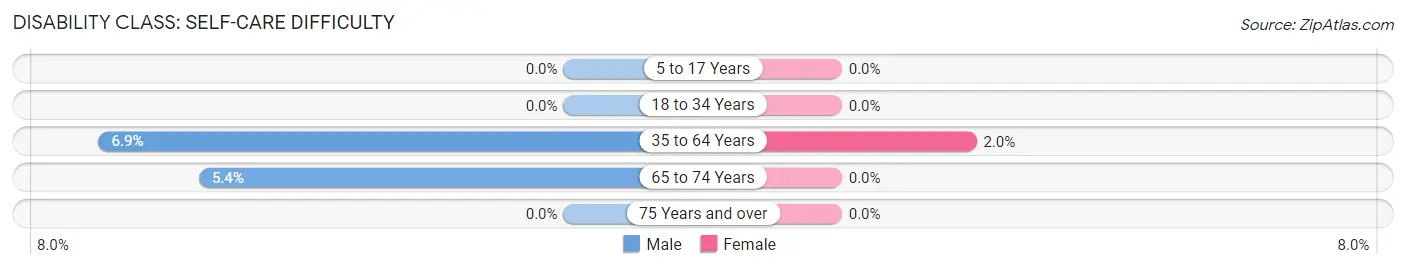
| Age Bracket | Male | Female |
| 5 to 17 Years | 0 (0.0%) | 0 (0.0%) |
| 18 to 34 Years | 0 (0.0%) | 0 (0.0%) |
| 35 to 64 Years | 8 (6.9%) | 2 (2.0%) |
| 65 to 74 Years | 2 (5.4%) | 0 (0.0%) |
| 75 Years and over | 0 (0.0%) | 0 (0.0%) |
Technology Access in Orderville
Computing Device Access in Orderville
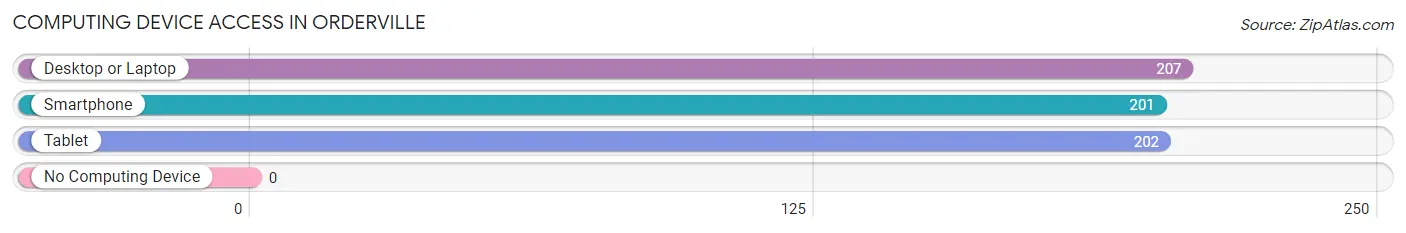
| Device Type | # Households | % Households |
| Desktop or Laptop | 207 | 95.0% |
| Smartphone | 201 | 92.2% |
| Tablet | 202 | 92.7% |
| No Computing Device | 0 | 0.0% |
| Total | 218 | 100.0% |
Internet Access in Orderville
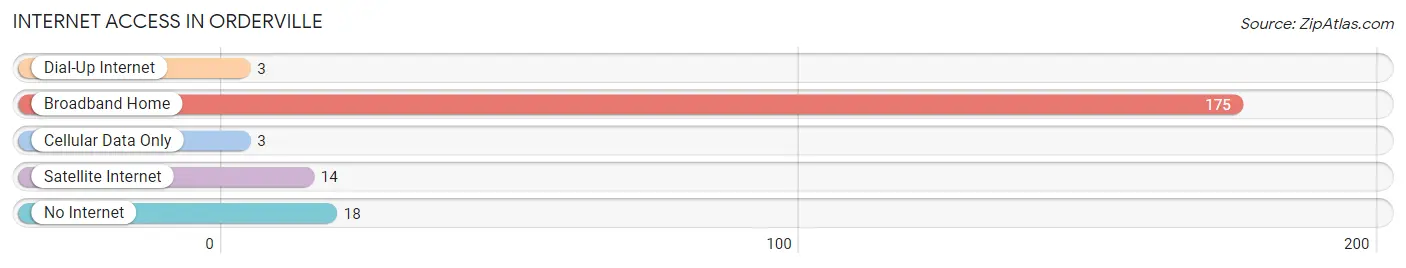
| Internet Type | # Households | % Households |
| Dial-Up Internet | 3 | 1.4% |
| Broadband Home | 175 | 80.3% |
| Cellular Data Only | 3 | 1.4% |
| Satellite Internet | 14 | 6.4% |
| No Internet | 18 | 8.3% |
| Total | 218 | 100.0% |
Orderville Summary
Orderville is a small town located in Kane County, Utah, United States. It is situated in the southwestern part of the state, near the Arizona border. The population was 590 at the 2010 census.
History
Orderville was founded in 1875 by members of The Church of Jesus Christ of Latter-day Saints (LDS Church). The town was named after Joseph Smith, Jr., the founder of the LDS Church. The town was established as a cooperative community, with all members contributing to the common good. This included sharing labor, resources, and profits. The town was successful for many years, and was known for its high quality of life.
In the early 1900s, the town began to decline. The population decreased, and the town was eventually abandoned in the 1940s. In the 1950s, the town was re-established by members of the LDS Church. The town has since grown and prospered, and is now home to a variety of businesses and services.
Geography
Orderville is located in southwestern Utah, near the Arizona border. It is situated in the Grand Staircase-Escalante National Monument, and is surrounded by red rock canyons and mesas. The town is located at an elevation of 4,890 feet (1,490 m).
The climate in Orderville is semi-arid, with hot summers and cold winters. The average annual precipitation is 8.5 inches (21.6 cm).
Economy
The economy of Orderville is largely based on tourism. The town is a popular destination for outdoor recreation, such as hiking, camping, and fishing. The town is also home to a variety of businesses, including restaurants, lodging, and retail stores.
Demographics
As of the 2010 census, the population of Orderville was 590. The racial makeup of the town was 95.3% White, 0.2% African American, 0.2% Native American, 0.2% Asian, 0.2% Pacific Islander, 0.2% from other races, and 3.9% from two or more races. Hispanic or Latino of any race were 2.7% of the population.
The median income for a household in Orderville was $37,500, and the median income for a family was $41,250. The per capita income for the town was $17,845. About 11.2% of families and 13.2% of the population were below the poverty line, including 16.7% of those under age 18 and 8.3% of those age 65 or over.
Common Questions
What is Per Capita Income in Orderville?
Per Capita income in Orderville is $30,089.
What is the Median Family Income in Orderville?
Median Family Income in Orderville is $92,614.
What is the Median Household income in Orderville?
Median Household Income in Orderville is $87,361.
What is Income or Wage Gap in Orderville?
Income or Wage Gap in Orderville is 54.2%.
Women in Orderville earn 45.8 cents for every dollar earned by a man.
What is Inequality or Gini Index in Orderville?
Inequality or Gini Index in Orderville is 0.30.
What is the Total Population of Orderville?
Total Population of Orderville is 636.
What is the Total Male Population of Orderville?
Total Male Population of Orderville is 340.
What is the Total Female Population of Orderville?
Total Female Population of Orderville is 296.
What is the Ratio of Males per 100 Females in Orderville?
There are 114.86 Males per 100 Females in Orderville.
What is the Ratio of Females per 100 Males in Orderville?
There are 87.06 Females per 100 Males in Orderville.
What is the Median Population Age in Orderville?
Median Population Age in Orderville is 37.6 Years.
What is the Average Family Size in Orderville
Average Family Size in Orderville is 3.1 People.
What is the Average Household Size in Orderville
Average Household Size in Orderville is 2.9 People.
How Large is the Labor Force in Orderville?
There are 266 People in the Labor Forcein in Orderville.
What is the Percentage of People in the Labor Force in Orderville?
60.6% of People are in the Labor Force in Orderville.
What is the Unemployment Rate in Orderville?
Unemployment Rate in Orderville is 0.8%.