Aneth, UT Map & Demographics
Aneth Map
Aneth Overview
$13,248
PER CAPITA INCOME
$44,583
AVG FAMILY INCOME
$39,583
AVG HOUSEHOLD INCOME
$15,623
FAMILY INCOME DEFICIT
0.44
INEQUALITY / GINI INDEX
342
TOTAL POPULATION
155
MALE POPULATION
187
FEMALE POPULATION
82.89
MALES / 100 FEMALES
120.65
FEMALES / 100 MALES
30.5
MEDIAN AGE
3.9
AVG FAMILY SIZE
3.5
AVG HOUSEHOLD SIZE
111
LABOR FORCE [ PEOPLE ]
46.6%
PERCENT IN LABOR FORCE
23.4%
UNEMPLOYMENT RATE
Aneth Area Codes
Income in Aneth
Income Overview in Aneth
Per Capita Income in Aneth is $13,248, while median incomes of families and households are $44,583 and $39,583 respectively.
| Characteristic | Number | Measure |
| Per Capita Income | 342 | $13,248 |
| Median Family Income | 81 | $44,583 |
| Mean Family Income | 81 | $45,135 |
| Median Household Income | 97 | $39,583 |
| Mean Household Income | 97 | $45,336 |
| Income Deficit | 81 | $15,623 |
| Wage / Income Gap (%) | 342 | 0.00% |
| Wage / Income Gap ($) | 342 | 100.00¢ per $1 |
| Gini / Inequality Index | 342 | 0.44 |
Earnings by Sex in Aneth
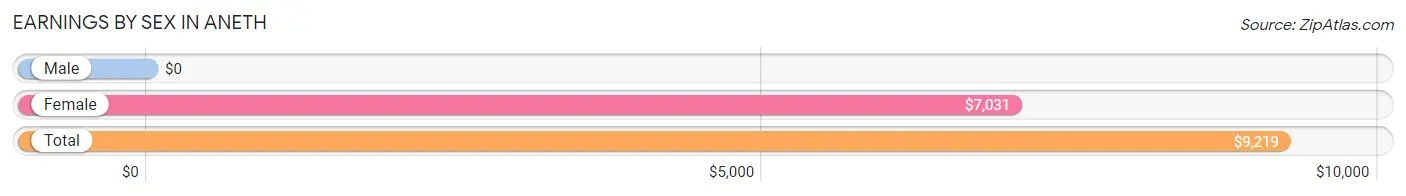
| Sex | Number | Average Earnings |
| Male | 62 (54.9%) | $0 |
| Female | 51 (45.1%) | $7,031 |
| Total | 113 (100.0%) | $9,219 |
Earnings by Sex by Income Bracket in Aneth
The most common earnings brackets in Aneth are $5,000 to $7,499 for men (12 | 19.4%) and $5,000 to $7,499 for women (24 | 47.1%).
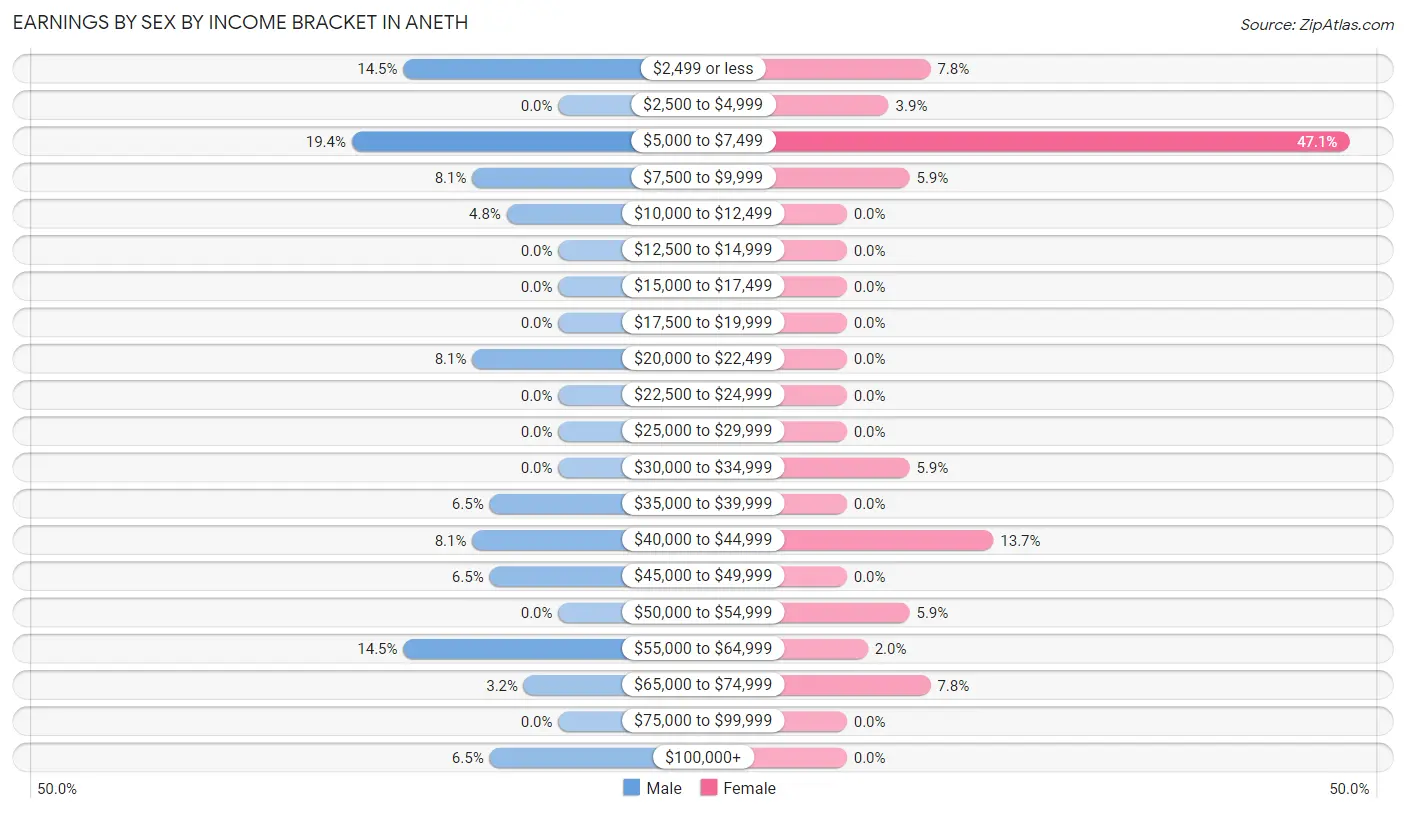
| Income | Male | Female |
| $2,499 or less | 9 (14.5%) | 4 (7.8%) |
| $2,500 to $4,999 | 0 (0.0%) | 2 (3.9%) |
| $5,000 to $7,499 | 12 (19.4%) | 24 (47.1%) |
| $7,500 to $9,999 | 5 (8.1%) | 3 (5.9%) |
| $10,000 to $12,499 | 3 (4.8%) | 0 (0.0%) |
| $12,500 to $14,999 | 0 (0.0%) | 0 (0.0%) |
| $15,000 to $17,499 | 0 (0.0%) | 0 (0.0%) |
| $17,500 to $19,999 | 0 (0.0%) | 0 (0.0%) |
| $20,000 to $22,499 | 5 (8.1%) | 0 (0.0%) |
| $22,500 to $24,999 | 0 (0.0%) | 0 (0.0%) |
| $25,000 to $29,999 | 0 (0.0%) | 0 (0.0%) |
| $30,000 to $34,999 | 0 (0.0%) | 3 (5.9%) |
| $35,000 to $39,999 | 4 (6.5%) | 0 (0.0%) |
| $40,000 to $44,999 | 5 (8.1%) | 7 (13.7%) |
| $45,000 to $49,999 | 4 (6.5%) | 0 (0.0%) |
| $50,000 to $54,999 | 0 (0.0%) | 3 (5.9%) |
| $55,000 to $64,999 | 9 (14.5%) | 1 (2.0%) |
| $65,000 to $74,999 | 2 (3.2%) | 4 (7.8%) |
| $75,000 to $99,999 | 0 (0.0%) | 0 (0.0%) |
| $100,000+ | 4 (6.5%) | 0 (0.0%) |
| Total | 62 (100.0%) | 51 (100.0%) |
Earnings by Sex by Educational Attainment in Aneth
Average earnings in Aneth are $40,750 for men and $7,031 for women, a difference of 82.8%. Men with an educational attainment of high school diploma enjoy the highest average annual earnings of $40,750, while those with high school diploma education earn the least with $40,750. Women with an educational attainment of high school diploma earn the most with the average annual earnings of $7,500, while those with high school diploma education have the smallest earnings of $7,500.
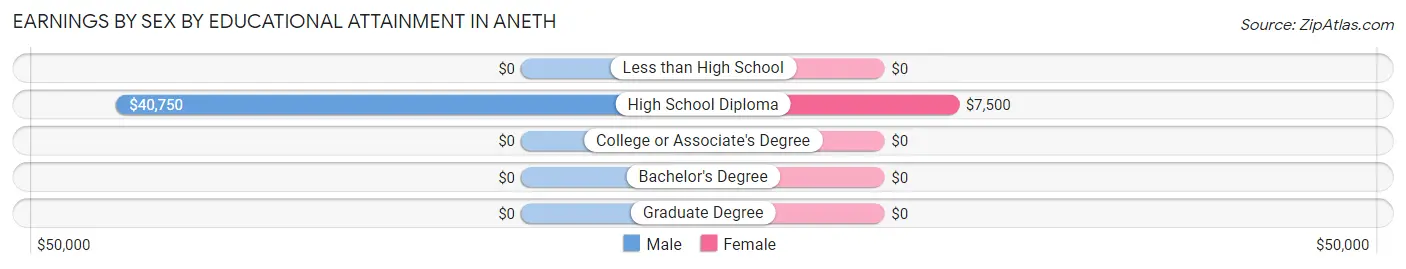
| Educational Attainment | Male Income | Female Income |
| Less than High School | - | - |
| High School Diploma | $40,750 | $7,500 |
| College or Associate's Degree | - | - |
| Bachelor's Degree | - | - |
| Graduate Degree | - | - |
| Total | $40,750 | $7,031 |
Family Income in Aneth
Family Income Brackets in Aneth
According to the Aneth family income data, there are 21 families falling into the $75,000 to $99,999 income range, which is the most common income bracket and makes up 25.9% of all families.
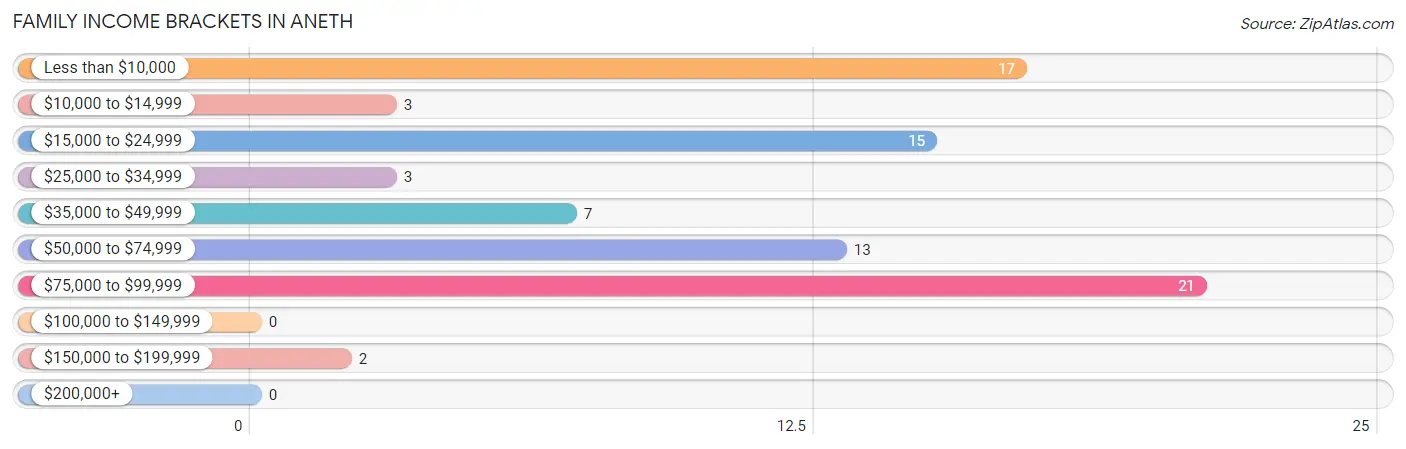
| Income Bracket | # Families | % Families |
| Less than $10,000 | 17 | 21.0% |
| $10,000 to $14,999 | 3 | 3.7% |
| $15,000 to $24,999 | 15 | 18.5% |
| $25,000 to $34,999 | 3 | 3.7% |
| $35,000 to $49,999 | 7 | 8.6% |
| $50,000 to $74,999 | 13 | 16.0% |
| $75,000 to $99,999 | 21 | 25.9% |
| $100,000 to $149,999 | 0 | 0.0% |
| $150,000 to $199,999 | 2 | 2.5% |
| $200,000+ | 0 | 0.0% |
Family Income by Famaliy Size in Aneth
7+ person families (10 | 12.3%) account for the highest median family income in Aneth with $63,500 per family, while 2-person families (29 | 35.8%) have the highest median income of $11,979 per family member.
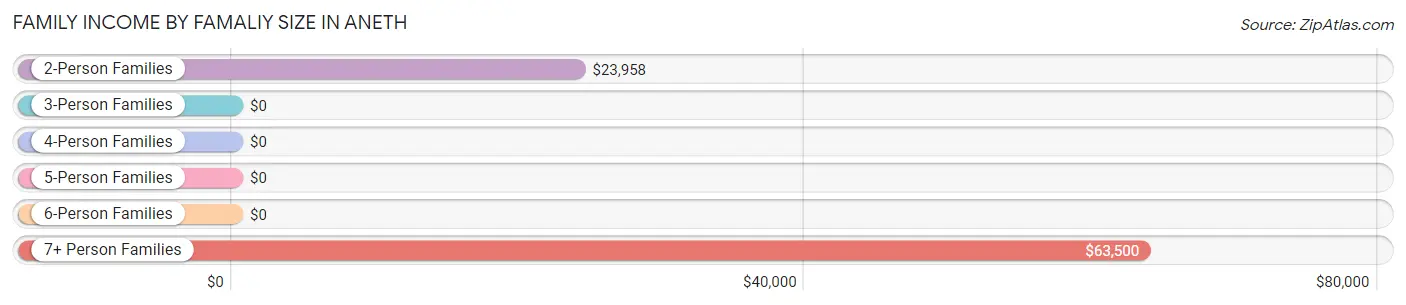
| Income Bracket | # Families | Median Income |
| 2-Person Families | 29 (35.8%) | $23,958 |
| 3-Person Families | 42 (51.8%) | $0 |
| 4-Person Families | 0 (0.0%) | $0 |
| 5-Person Families | 0 (0.0%) | $0 |
| 6-Person Families | 0 (0.0%) | $0 |
| 7+ Person Families | 10 (12.3%) | $63,500 |
| Total | 81 (100.0%) | $44,583 |
Family Income by Number of Earners in Aneth
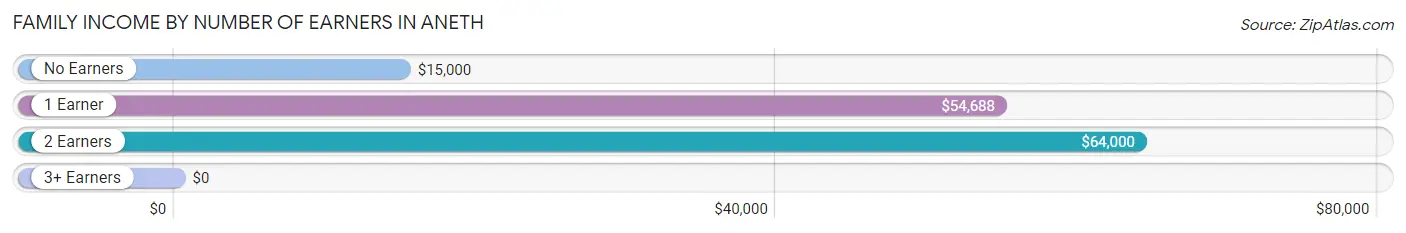
| Number of Earners | # Families | Median Income |
| No Earners | 24 (29.6%) | $15,000 |
| 1 Earner | 43 (53.1%) | $54,688 |
| 2 Earners | 12 (14.8%) | $64,000 |
| 3+ Earners | 2 (2.5%) | $0 |
| Total | 81 (100.0%) | $44,583 |
Household Income in Aneth
Household Income Brackets in Aneth
With 21 households falling in the category, the less than $10,000 income range is the most frequent in Aneth, accounting for 21.6% of all households.
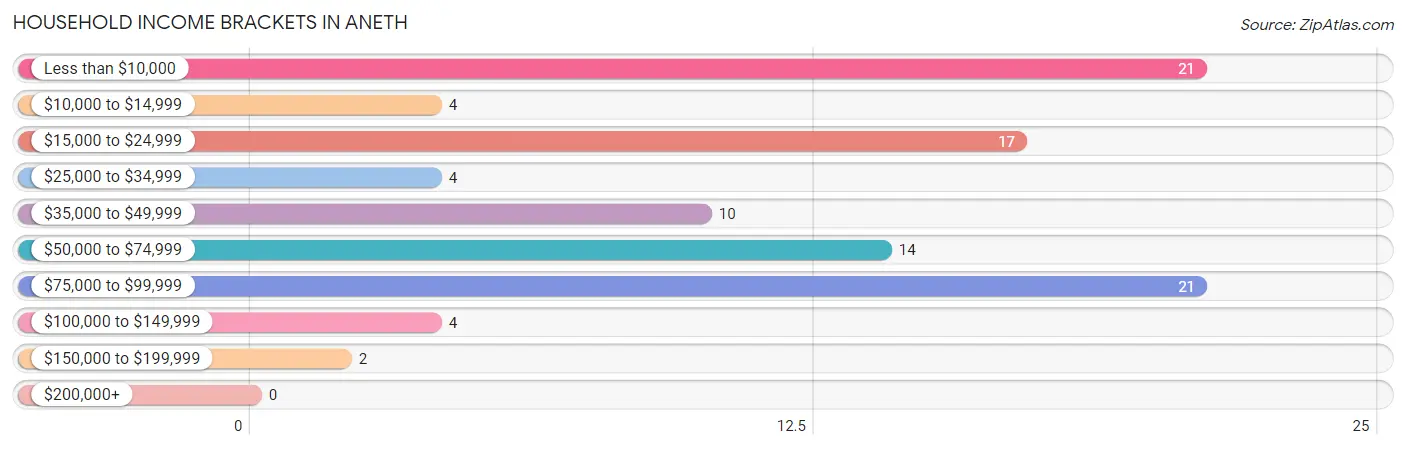
| Income Bracket | # Households | % Households |
| Less than $10,000 | 21 | 21.6% |
| $10,000 to $14,999 | 4 | 4.1% |
| $15,000 to $24,999 | 17 | 17.5% |
| $25,000 to $34,999 | 4 | 4.1% |
| $35,000 to $49,999 | 10 | 10.3% |
| $50,000 to $74,999 | 14 | 14.4% |
| $75,000 to $99,999 | 21 | 21.6% |
| $100,000 to $149,999 | 4 | 4.1% |
| $150,000 to $199,999 | 2 | 2.1% |
| $200,000+ | 0 | 0.0% |
Household Income by Householder Age in Aneth
The median household income in Aneth is $39,583, with the highest median household income of $46,563 found in the 45 to 64 years age bracket for the primary householder. A total of 65 households (67.0%) fall into this category.
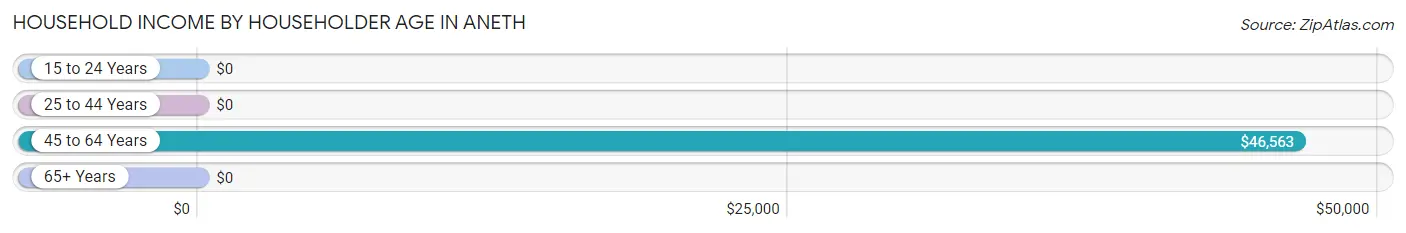
| Income Bracket | # Households | Median Income |
| 15 to 24 Years | 0 (0.0%) | $0 |
| 25 to 44 Years | 19 (19.6%) | $0 |
| 45 to 64 Years | 65 (67.0%) | $46,563 |
| 65+ Years | 13 (13.4%) | $0 |
| Total | 97 (100.0%) | $39,583 |
Poverty in Aneth
Income Below Poverty by Sex and Age in Aneth
With 26.5% poverty level for males and 40.6% for females among the residents of Aneth, 5 year old males and under 5 year old females are the most vulnerable to poverty, with 5 males (100.0%) and 8 females (100.0%) in their respective age groups living below the poverty level.
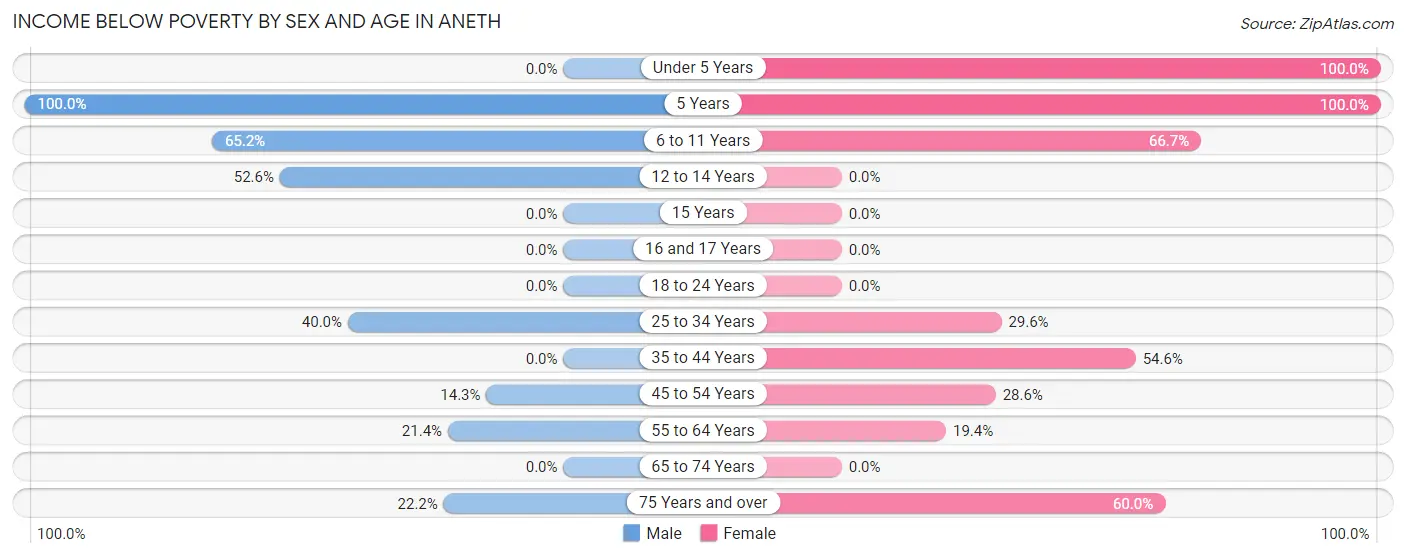
| Age Bracket | Male | Female |
| Under 5 Years | 0 (0.0%) | 8 (100.0%) |
| 5 Years | 5 (100.0%) | 7 (100.0%) |
| 6 to 11 Years | 15 (65.2%) | 28 (66.7%) |
| 12 to 14 Years | 10 (52.6%) | 0 (0.0%) |
| 15 Years | 0 (0.0%) | 0 (0.0%) |
| 16 and 17 Years | 0 (0.0%) | 0 (0.0%) |
| 18 to 24 Years | 0 (0.0%) | 0 (0.0%) |
| 25 to 34 Years | 4 (40.0%) | 8 (29.6%) |
| 35 to 44 Years | 0 (0.0%) | 6 (54.5%) |
| 45 to 54 Years | 2 (14.3%) | 4 (28.6%) |
| 55 to 64 Years | 3 (21.4%) | 12 (19.4%) |
| 65 to 74 Years | 0 (0.0%) | 0 (0.0%) |
| 75 Years and over | 2 (22.2%) | 3 (60.0%) |
| Total | 41 (26.5%) | 76 (40.6%) |
Income Above Poverty by Sex and Age in Aneth
According to the poverty statistics in Aneth, males aged 16 and 17 years and females aged 18 to 24 years are the age groups that are most secure financially, with 100.0% of males and 100.0% of females in these age groups living above the poverty line.
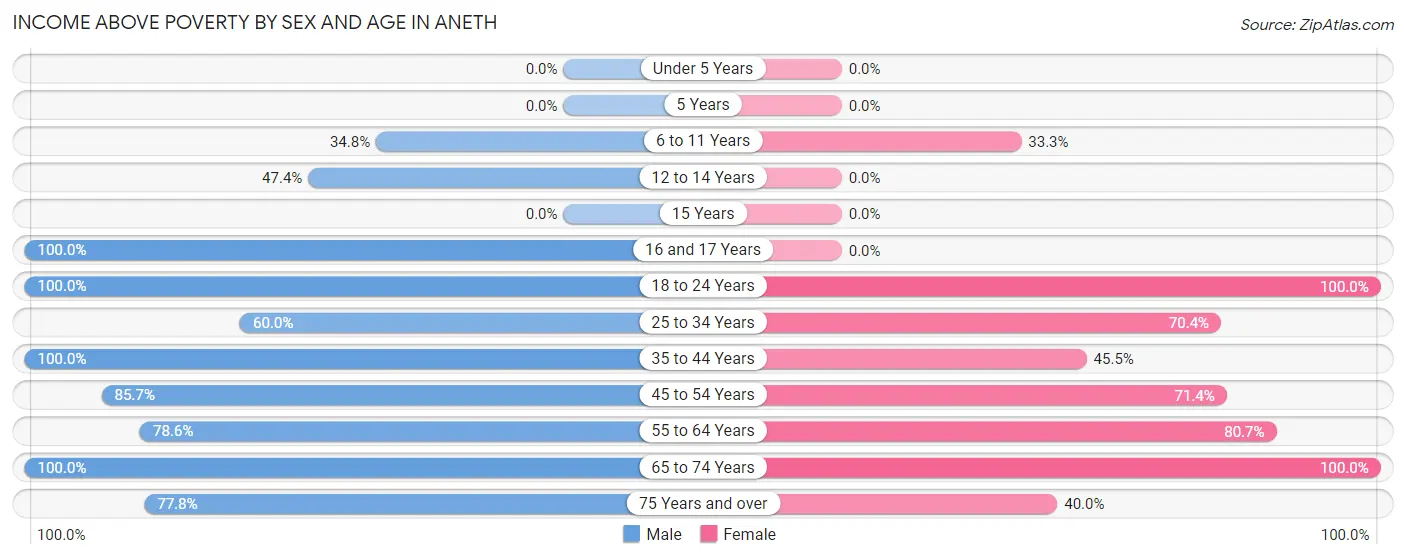
| Age Bracket | Male | Female |
| Under 5 Years | 0 (0.0%) | 0 (0.0%) |
| 5 Years | 0 (0.0%) | 0 (0.0%) |
| 6 to 11 Years | 8 (34.8%) | 14 (33.3%) |
| 12 to 14 Years | 9 (47.4%) | 0 (0.0%) |
| 15 Years | 0 (0.0%) | 0 (0.0%) |
| 16 and 17 Years | 22 (100.0%) | 0 (0.0%) |
| 18 to 24 Years | 14 (100.0%) | 6 (100.0%) |
| 25 to 34 Years | 6 (60.0%) | 19 (70.4%) |
| 35 to 44 Years | 15 (100.0%) | 5 (45.5%) |
| 45 to 54 Years | 12 (85.7%) | 10 (71.4%) |
| 55 to 64 Years | 11 (78.6%) | 50 (80.6%) |
| 65 to 74 Years | 10 (100.0%) | 5 (100.0%) |
| 75 Years and over | 7 (77.8%) | 2 (40.0%) |
| Total | 114 (73.6%) | 111 (59.4%) |
Income Below Poverty Among Married-Couple Families in Aneth
The poverty statistics for married-couple families in Aneth show that 25.0% or 8 of the total 32 families live below the poverty line. Families with 1 or 2 children have the highest poverty rate of 100.0%, comprising of 2 families. On the other hand, families with 5 or more children have the lowest poverty rate of 0.0%, which includes 0 families.
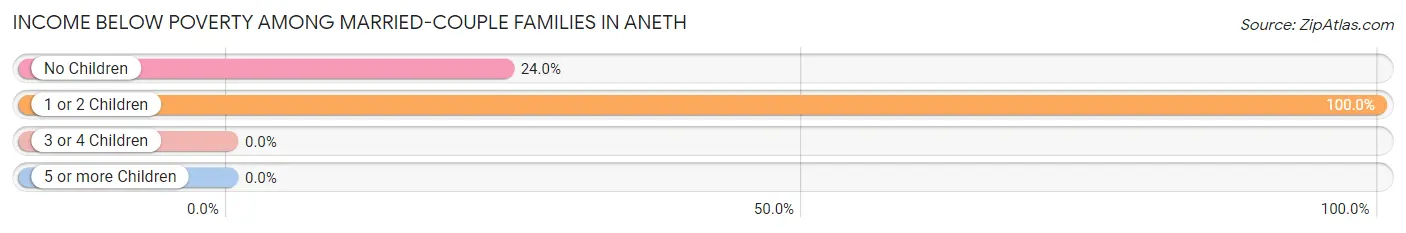
| Children | Above Poverty | Below Poverty |
| No Children | 19 (76.0%) | 6 (24.0%) |
| 1 or 2 Children | 0 (0.0%) | 2 (100.0%) |
| 3 or 4 Children | 0 (0.0%) | 0 (0.0%) |
| 5 or more Children | 5 (100.0%) | 0 (0.0%) |
| Total | 24 (75.0%) | 8 (25.0%) |
Income Below Poverty Among Single-Parent Households in Aneth
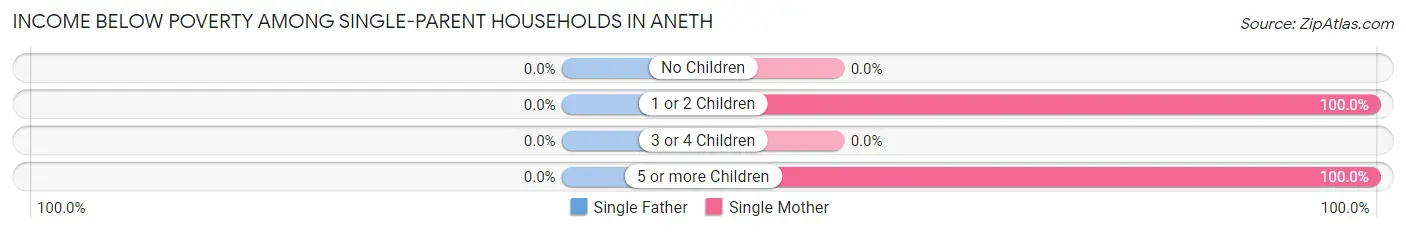
| Children | Single Father | Single Mother |
| No Children | 0 (0.0%) | 0 (0.0%) |
| 1 or 2 Children | 0 (0.0%) | 15 (100.0%) |
| 3 or 4 Children | 0 (0.0%) | 0 (0.0%) |
| 5 or more Children | 0 (0.0%) | 3 (100.0%) |
| Total | 0 (0.0%) | 18 (43.9%) |
Income Below Poverty Among Married-Couple vs Single-Parent Households in Aneth
The poverty data for Aneth shows that 8 of the married-couple family households (25.0%) and 18 of the single-parent households (36.7%) are living below the poverty level. Within the married-couple family households, those with 1 or 2 children have the highest poverty rate, with 2 households (100.0%) falling below the poverty line. Among the single-parent households, those with 5 or more children have the highest poverty rate, with 3 household (100.0%) living below poverty.
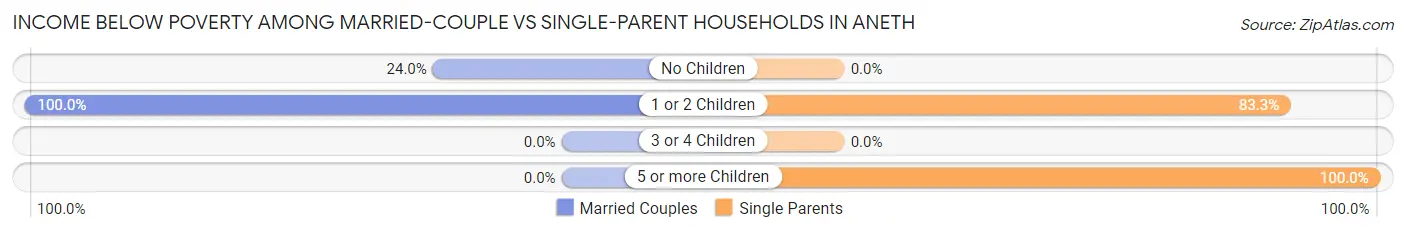
| Children | Married-Couple Families | Single-Parent Households |
| No Children | 6 (24.0%) | 0 (0.0%) |
| 1 or 2 Children | 2 (100.0%) | 15 (83.3%) |
| 3 or 4 Children | 0 (0.0%) | 0 (0.0%) |
| 5 or more Children | 0 (0.0%) | 3 (100.0%) |
| Total | 8 (25.0%) | 18 (36.7%) |
Race in Aneth
The most populous races in Aneth are Native / Alaskan (338 | 98.8%), and White / Caucasian (4 | 1.2%).
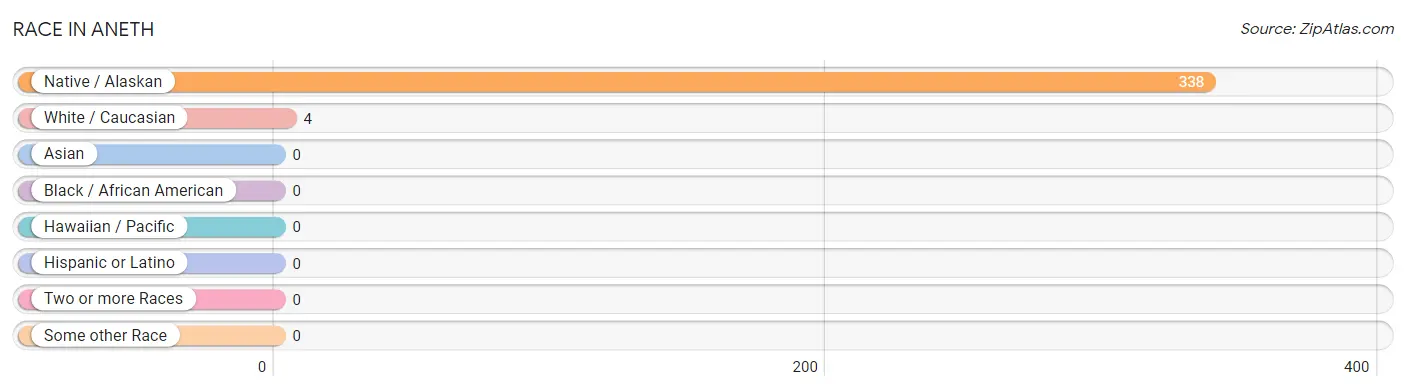
| Race | # Population | % Population |
| Asian | 0 | 0.0% |
| Black / African American | 0 | 0.0% |
| Hawaiian / Pacific | 0 | 0.0% |
| Hispanic or Latino | 0 | 0.0% |
| Native / Alaskan | 338 | 98.8% |
| White / Caucasian | 4 | 1.2% |
| Two or more Races | 0 | 0.0% |
| Some other Race | 0 | 0.0% |
| Total | 342 | 100.0% |
Ancestry in Aneth
The most populous ancestries reported in Aneth are Navajo (338 | 98.8%), and English (4 | 1.2%), together accounting for 100.0% of all Aneth residents.
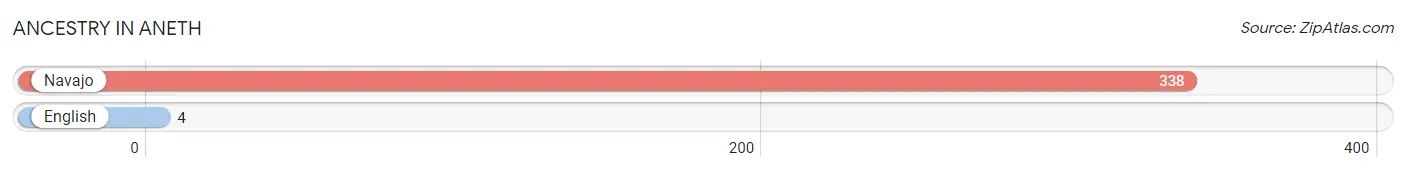
| Ancestry | # Population | % Population |
| English | 4 | 1.2% |
| Navajo | 338 | 98.8% | View All 2 Rows |
Immigrants in Aneth

| Immigration Origin | # Population | % Population | View All 0 Rows |
Sex and Age in Aneth
Sex and Age in Aneth
The most populous age groups in Aneth are 10 to 14 Years (27 | 17.4%) for men and 5 to 9 Years (35 | 18.7%) for women.
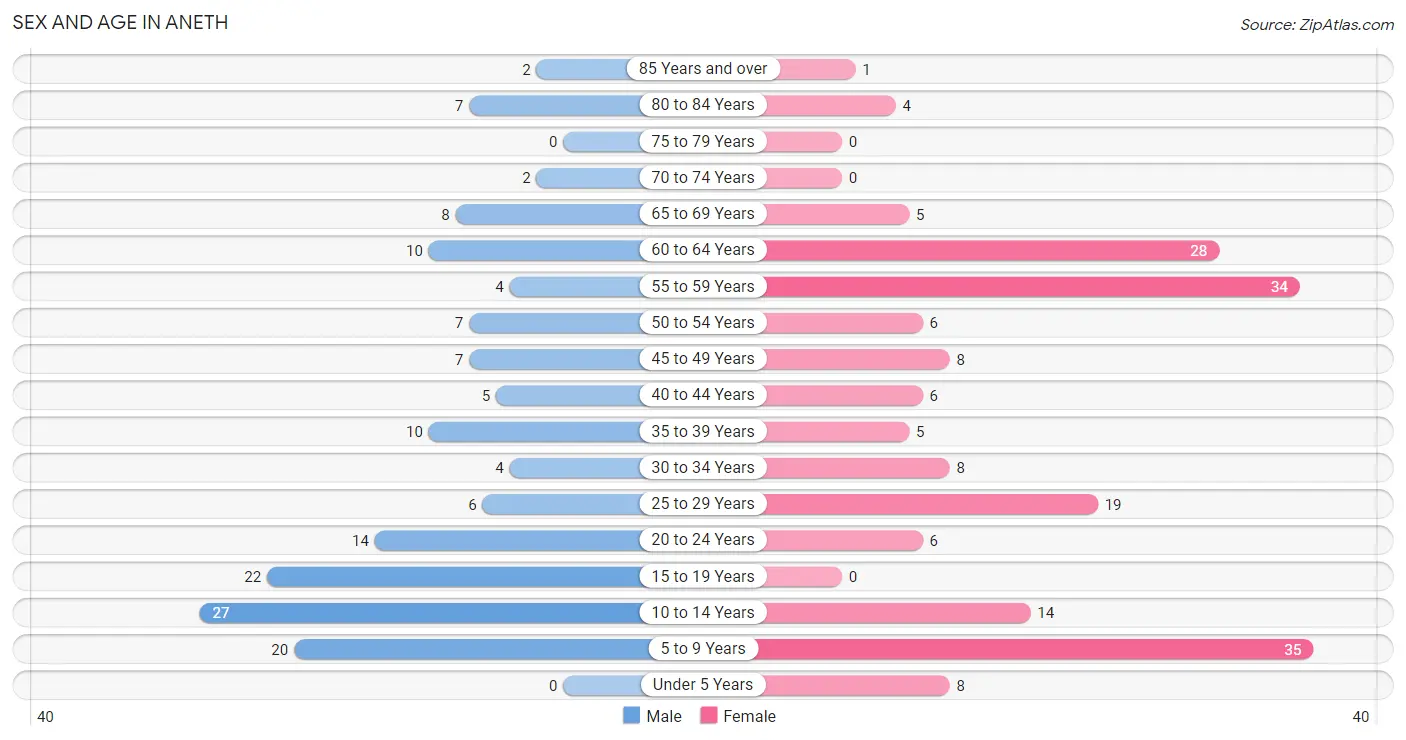
| Age Bracket | Male | Female |
| Under 5 Years | 0 (0.0%) | 8 (4.3%) |
| 5 to 9 Years | 20 (12.9%) | 35 (18.7%) |
| 10 to 14 Years | 27 (17.4%) | 14 (7.5%) |
| 15 to 19 Years | 22 (14.2%) | 0 (0.0%) |
| 20 to 24 Years | 14 (9.0%) | 6 (3.2%) |
| 25 to 29 Years | 6 (3.9%) | 19 (10.2%) |
| 30 to 34 Years | 4 (2.6%) | 8 (4.3%) |
| 35 to 39 Years | 10 (6.5%) | 5 (2.7%) |
| 40 to 44 Years | 5 (3.2%) | 6 (3.2%) |
| 45 to 49 Years | 7 (4.5%) | 8 (4.3%) |
| 50 to 54 Years | 7 (4.5%) | 6 (3.2%) |
| 55 to 59 Years | 4 (2.6%) | 34 (18.2%) |
| 60 to 64 Years | 10 (6.5%) | 28 (15.0%) |
| 65 to 69 Years | 8 (5.2%) | 5 (2.7%) |
| 70 to 74 Years | 2 (1.3%) | 0 (0.0%) |
| 75 to 79 Years | 0 (0.0%) | 0 (0.0%) |
| 80 to 84 Years | 7 (4.5%) | 4 (2.1%) |
| 85 Years and over | 2 (1.3%) | 1 (0.5%) |
| Total | 155 (100.0%) | 187 (100.0%) |
Families and Households in Aneth
Median Family Size in Aneth
The median family size in Aneth is 3.91 persons per family, with single male/father families (8 | 9.9%) accounting for the largest median family size of 8.38 persons per family. On the other hand, single female/mother families (41 | 50.6%) represent the smallest median family size with 3.41 persons per family.
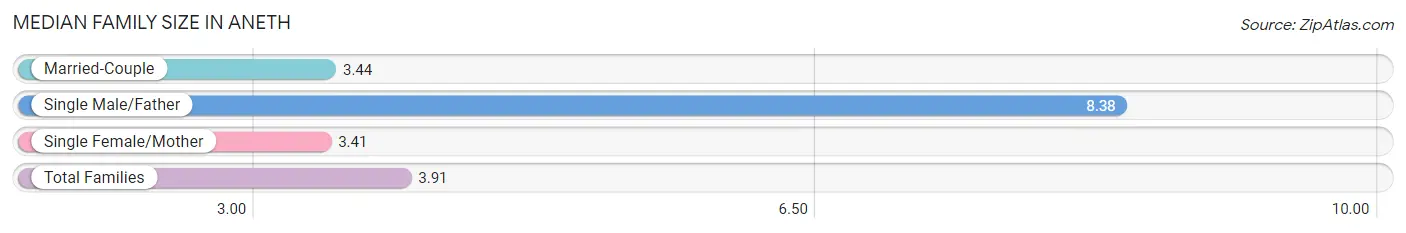
| Family Type | # Families | Family Size |
| Married-Couple | 32 (39.5%) | 3.44 |
| Single Male/Father | 8 (9.9%) | 8.38 |
| Single Female/Mother | 41 (50.6%) | 3.41 |
| Total Families | 81 (100.0%) | 3.91 |
Median Household Size in Aneth
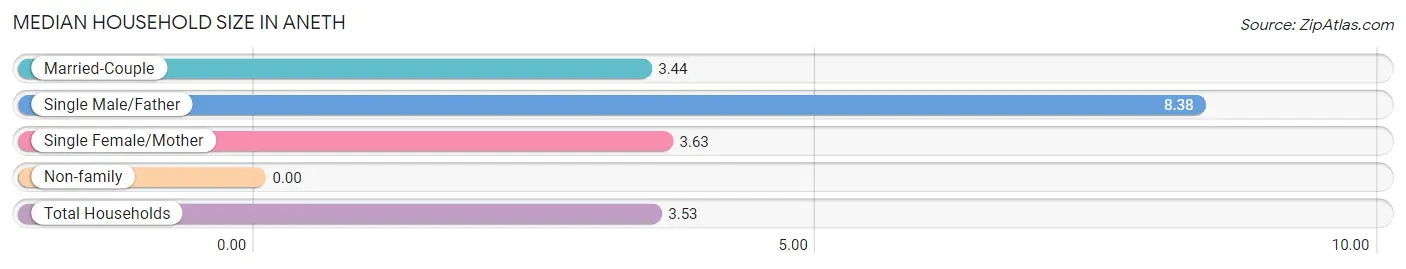
| Household Type | # Households | Household Size |
| Married-Couple | 32 (33.0%) | 3.44 |
| Single Male/Father | 8 (8.3%) | 8.38 |
| Single Female/Mother | 41 (42.3%) | 3.63 |
| Non-family | 16 (16.5%) | - |
| Total Households | 97 (100.0%) | 3.53 |
Household Size by Marriage Status in Aneth
Out of a total of 97 households in Aneth, 81 (83.5%) are family households, while 16 (16.5%) are nonfamily households. The most numerous type of family households are 3-person households, comprising 41, and the most common type of nonfamily households are 1-person households, comprising 16.
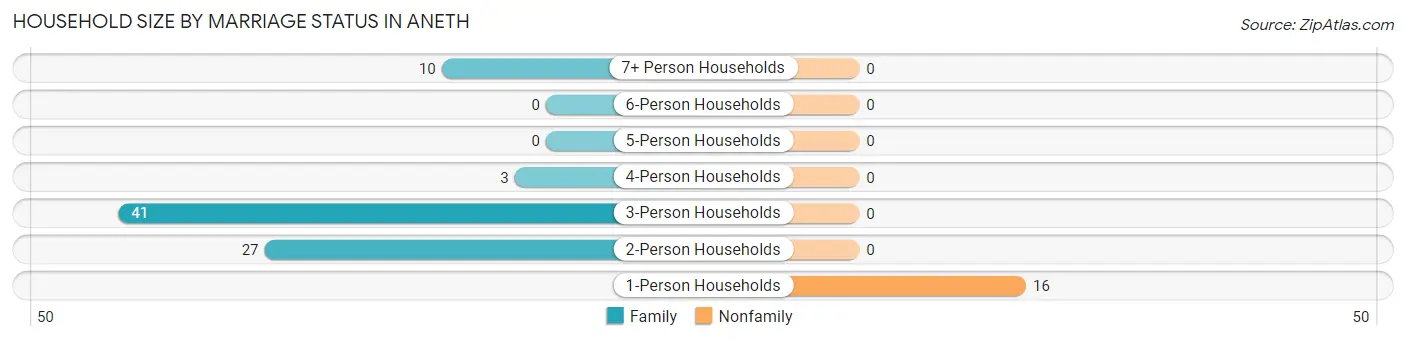
| Household Size | Family Households | Nonfamily Households |
| 1-Person Households | - | 16 (16.5%) |
| 2-Person Households | 27 (27.8%) | 0 (0.0%) |
| 3-Person Households | 41 (42.3%) | 0 (0.0%) |
| 4-Person Households | 3 (3.1%) | 0 (0.0%) |
| 5-Person Households | 0 (0.0%) | 0 (0.0%) |
| 6-Person Households | 0 (0.0%) | 0 (0.0%) |
| 7+ Person Households | 10 (10.3%) | 0 (0.0%) |
| Total | 81 (83.5%) | 16 (16.5%) |
Female Fertility in Aneth
Fertility by Age in Aneth
Average fertility rate in Aneth is 115.0 births per 1,000 women. Women in the age bracket of 20 to 34 years have the highest fertility rate with 182.0 births per 1,000 women. Women in the age bracket of 20 to 34 years acount for 100.0% of all women with births.
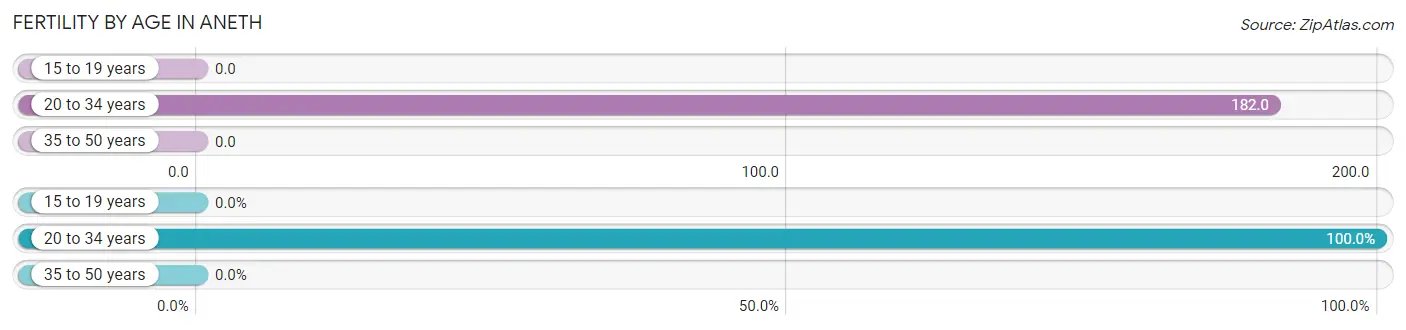
| Age Bracket | Women with Births | Births / 1,000 Women |
| 15 to 19 years | 0 (0.0%) | 0.0 |
| 20 to 34 years | 6 (100.0%) | 182.0 |
| 35 to 50 years | 0 (0.0%) | 0.0 |
| Total | 6 (100.0%) | 115.0 |
Fertility by Age by Marriage Status in Aneth
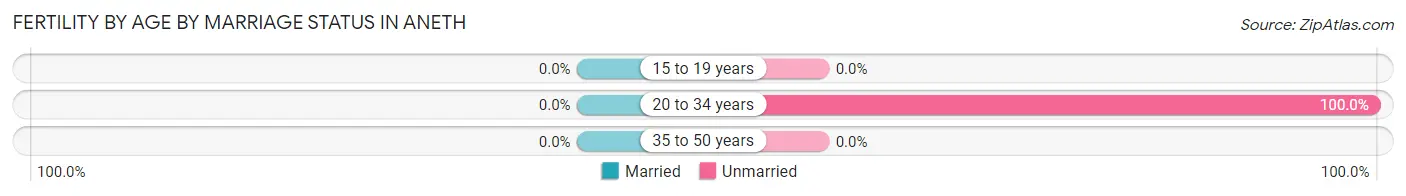
| Age Bracket | Married | Unmarried |
| 15 to 19 years | 0 (0.0%) | 0 (0.0%) |
| 20 to 34 years | 0 (0.0%) | 6 (100.0%) |
| 35 to 50 years | 0 (0.0%) | 0 (0.0%) |
| Total | 0 (0.0%) | 6 (100.0%) |
Fertility by Education in Aneth
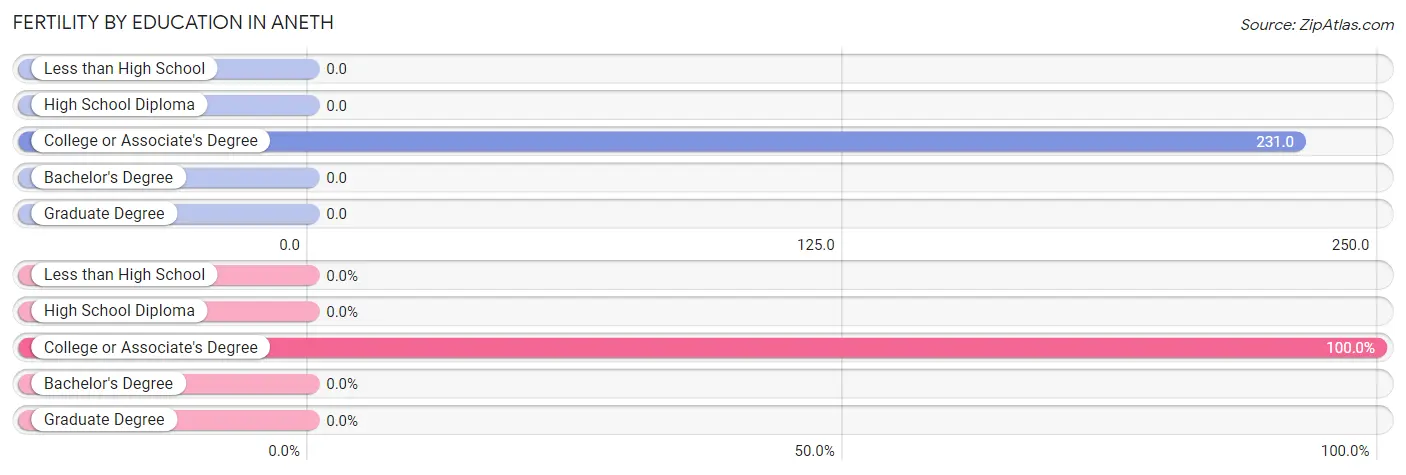
| Educational Attainment | Women with Births | Births / 1,000 Women |
| Less than High School | 0 (0.0%) | 0.0 |
| High School Diploma | 0 (0.0%) | 0.0 |
| College or Associate's Degree | 6 (100.0%) | 231.0 |
| Bachelor's Degree | 0 (0.0%) | 0.0 |
| Graduate Degree | 0 (0.0%) | 0.0 |
| Total | 6 (100.0%) | 115.0 |
Fertility by Education by Marriage Status in Aneth
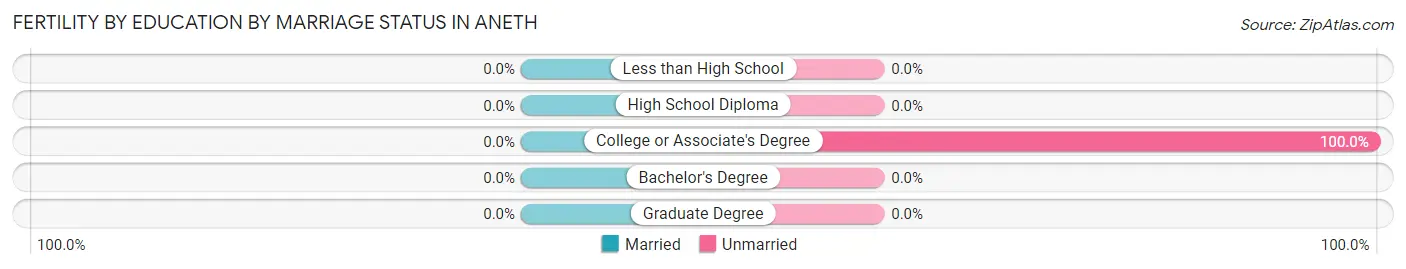
| Educational Attainment | Married | Unmarried |
| Less than High School | 0 (0.0%) | 0 (0.0%) |
| High School Diploma | 0 (0.0%) | 0 (0.0%) |
| College or Associate's Degree | 0 (0.0%) | 6 (100.0%) |
| Bachelor's Degree | 0 (0.0%) | 0 (0.0%) |
| Graduate Degree | 0 (0.0%) | 0 (0.0%) |
| Total | 0 (0.0%) | 6 (100.0%) |
Employment Characteristics in Aneth
Employment by Class of Employer in Aneth
Among the 85 employed individuals in Aneth, private company employees (49 | 57.7%), local government employees (17 | 20.0%), and federal government employees (15 | 17.6%) make up the most common classes of employment.
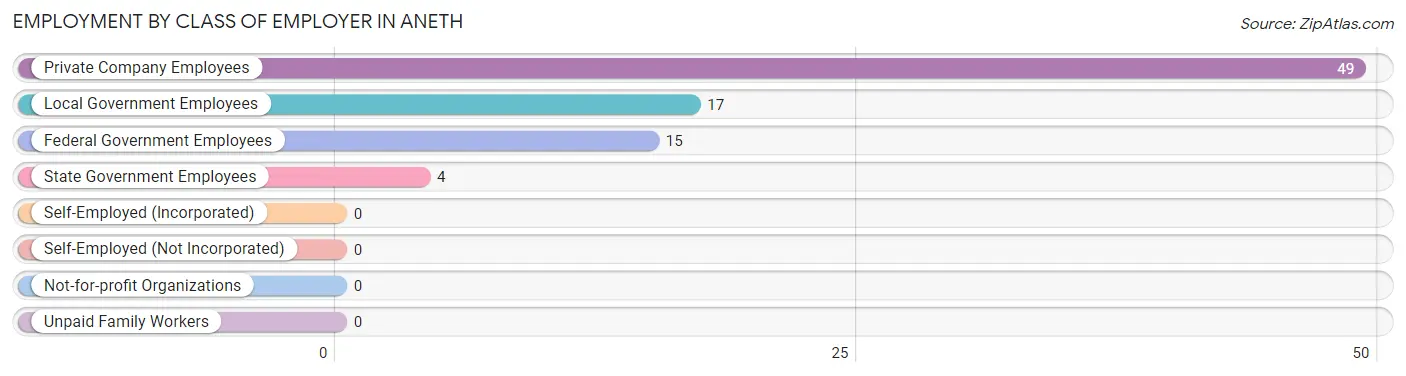
| Employer Class | # Employees | % Employees |
| Private Company Employees | 49 | 57.7% |
| Self-Employed (Incorporated) | 0 | 0.0% |
| Self-Employed (Not Incorporated) | 0 | 0.0% |
| Not-for-profit Organizations | 0 | 0.0% |
| Local Government Employees | 17 | 20.0% |
| State Government Employees | 4 | 4.7% |
| Federal Government Employees | 15 | 17.6% |
| Unpaid Family Workers | 0 | 0.0% |
| Total | 85 | 100.0% |
Employment Status by Age in Aneth
According to the labor force statistics for Aneth, out of the total population over 16 years of age (238), 46.6% or 111 individuals are in the labor force, with 23.4% or 26 of them unemployed. The age group with the highest labor force participation rate is 35 to 44 years, with 100.0% or 26 individuals in the labor force. Within the labor force, the 30 to 34 years age range has the highest percentage of unemployed individuals, with 66.7% or 4 of them being unemployed.
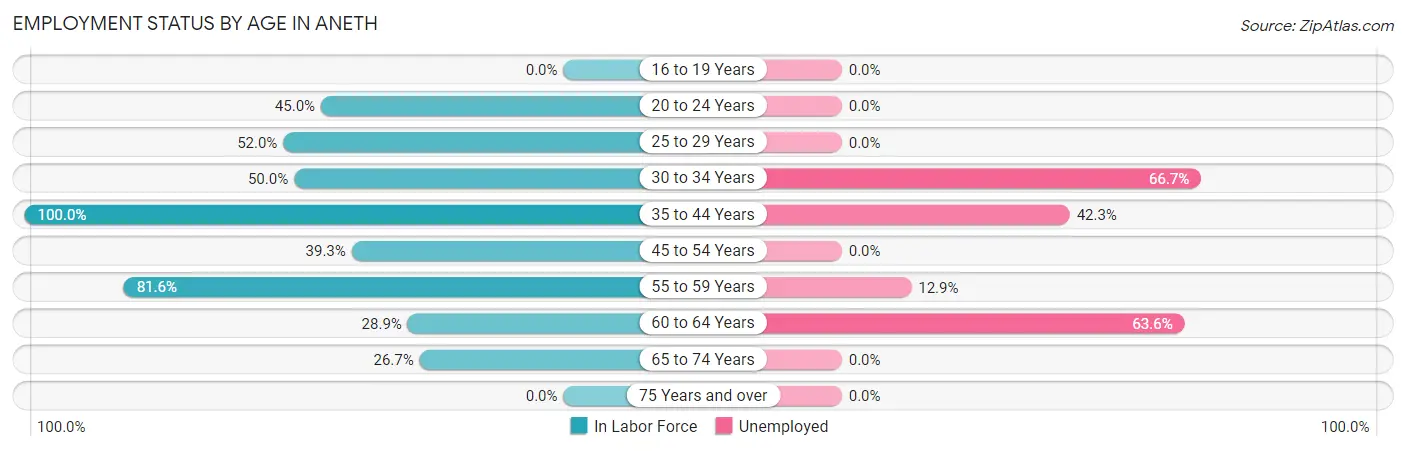
| Age Bracket | In Labor Force | Unemployed |
| 16 to 19 Years | 0 (0.0%) | 0 (0.0%) |
| 20 to 24 Years | 9 (45.0%) | 0 (0.0%) |
| 25 to 29 Years | 13 (52.0%) | 0 (0.0%) |
| 30 to 34 Years | 6 (50.0%) | 4 (66.7%) |
| 35 to 44 Years | 26 (100.0%) | 11 (42.3%) |
| 45 to 54 Years | 11 (39.3%) | 0 (0.0%) |
| 55 to 59 Years | 31 (81.6%) | 4 (12.9%) |
| 60 to 64 Years | 11 (28.9%) | 7 (63.6%) |
| 65 to 74 Years | 4 (26.7%) | 0 (0.0%) |
| 75 Years and over | 0 (0.0%) | 0 (0.0%) |
| Total | 111 (46.6%) | 26 (23.4%) |
Employment Status by Educational Attainment in Aneth
According to labor force statistics for Aneth, 58.7% of individuals (98) out of the total population between 25 and 64 years of age (167) are in the labor force, with 26.5% or 26 of them being unemployed. The group with the highest labor force participation rate are those with the educational attainment of bachelor's degree or higher, with 100.0% or 4 individuals in the labor force. Within the labor force, individuals with less than high school education have the highest percentage of unemployment, with 100.0% or 3 of them being unemployed.
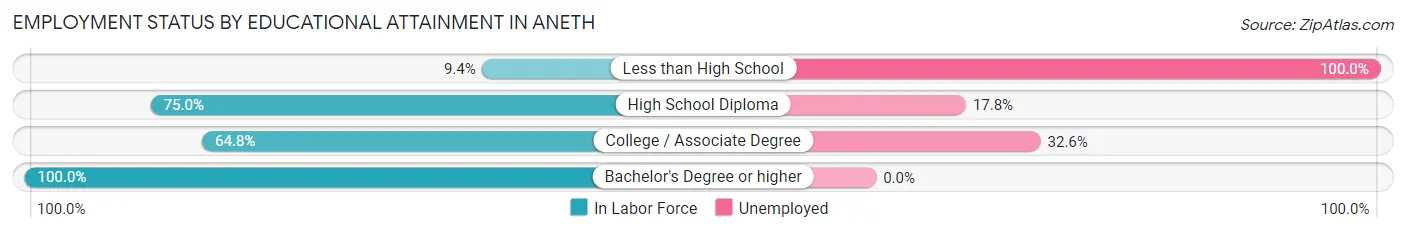
| Educational Attainment | In Labor Force | Unemployed |
| Less than High School | 3 (9.4%) | 32 (100.0%) |
| High School Diploma | 45 (75.0%) | 11 (17.8%) |
| College / Associate Degree | 46 (64.8%) | 23 (32.6%) |
| Bachelor's Degree or higher | 4 (100.0%) | 0 (0.0%) |
| Total | 98 (58.7%) | 44 (26.5%) |
Employment Occupations by Sex in Aneth
Management, Business, Science and Arts Occupations
The most common Management, Business, Science and Arts occupations in Aneth are Management (9 | 10.6%), Community & Social Service (7 | 8.2%), Education Instruction & Library (7 | 8.2%), Computers, Engineering & Science (3 | 3.5%), and Computers & Mathematics (3 | 3.5%).
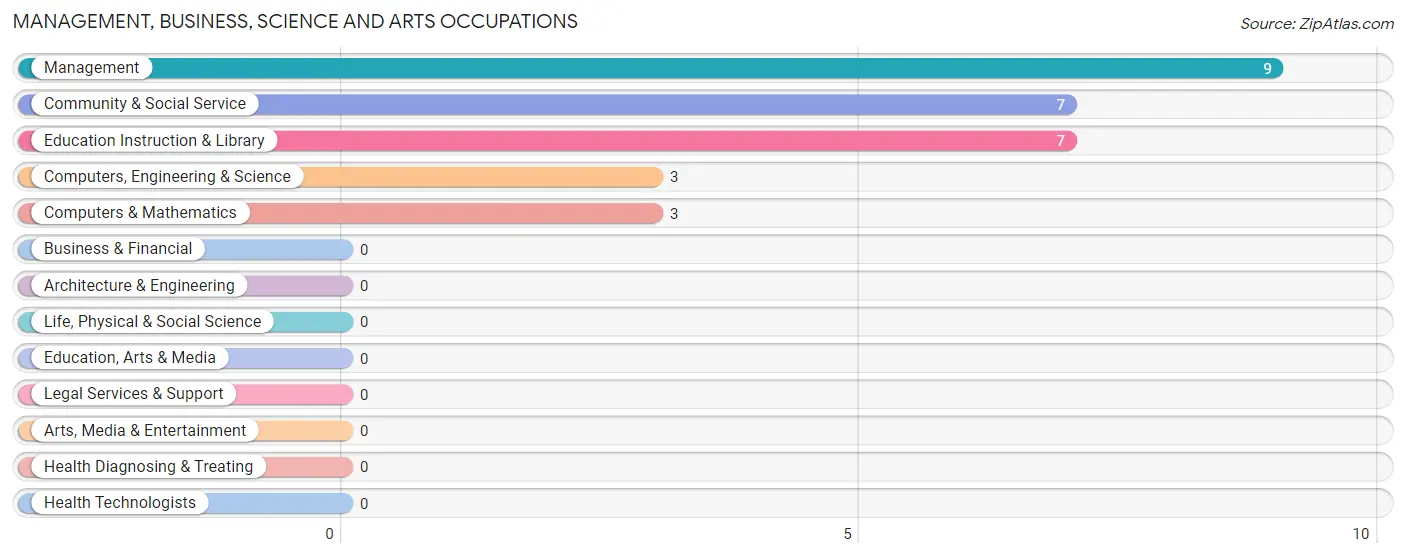
Management, Business, Science and Arts Occupations by Sex
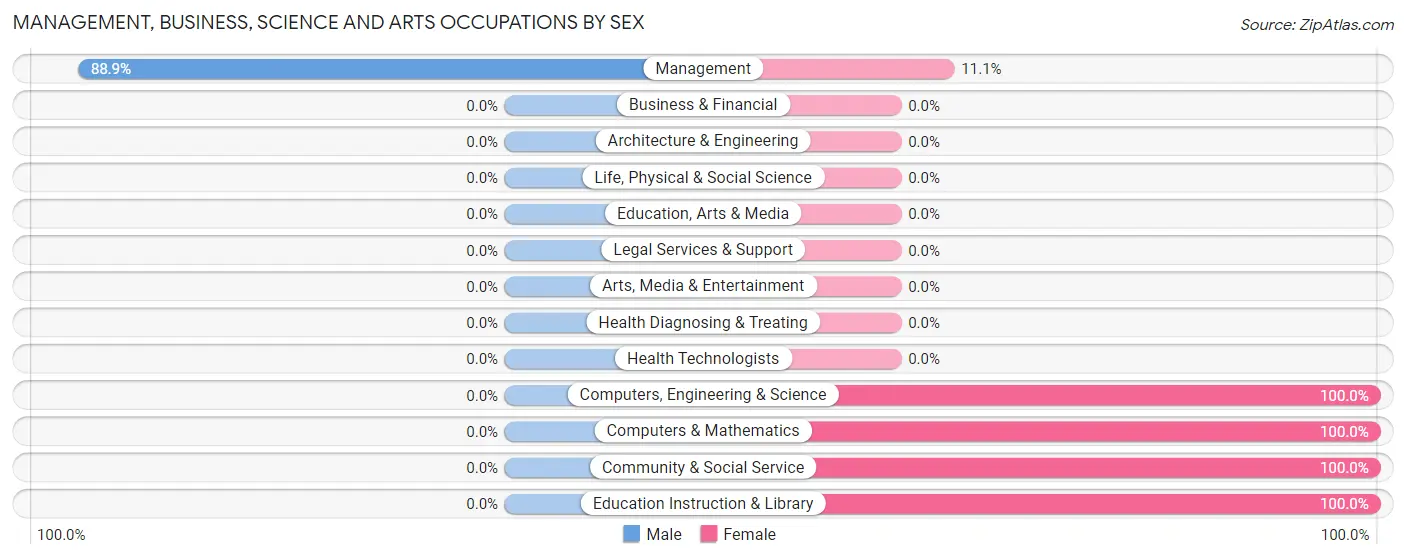
| Occupation | Male | Female |
| Management | 8 (88.9%) | 1 (11.1%) |
| Business & Financial | 0 (0.0%) | 0 (0.0%) |
| Computers, Engineering & Science | 0 (0.0%) | 3 (100.0%) |
| Computers & Mathematics | 0 (0.0%) | 3 (100.0%) |
| Architecture & Engineering | 0 (0.0%) | 0 (0.0%) |
| Life, Physical & Social Science | 0 (0.0%) | 0 (0.0%) |
| Community & Social Service | 0 (0.0%) | 7 (100.0%) |
| Education, Arts & Media | 0 (0.0%) | 0 (0.0%) |
| Legal Services & Support | 0 (0.0%) | 0 (0.0%) |
| Education Instruction & Library | 0 (0.0%) | 7 (100.0%) |
| Arts, Media & Entertainment | 0 (0.0%) | 0 (0.0%) |
| Health Diagnosing & Treating | 0 (0.0%) | 0 (0.0%) |
| Health Technologists | 0 (0.0%) | 0 (0.0%) |
| Total (Category) | 8 (42.1%) | 11 (57.9%) |
| Total (Overall) | 38 (44.7%) | 47 (55.3%) |
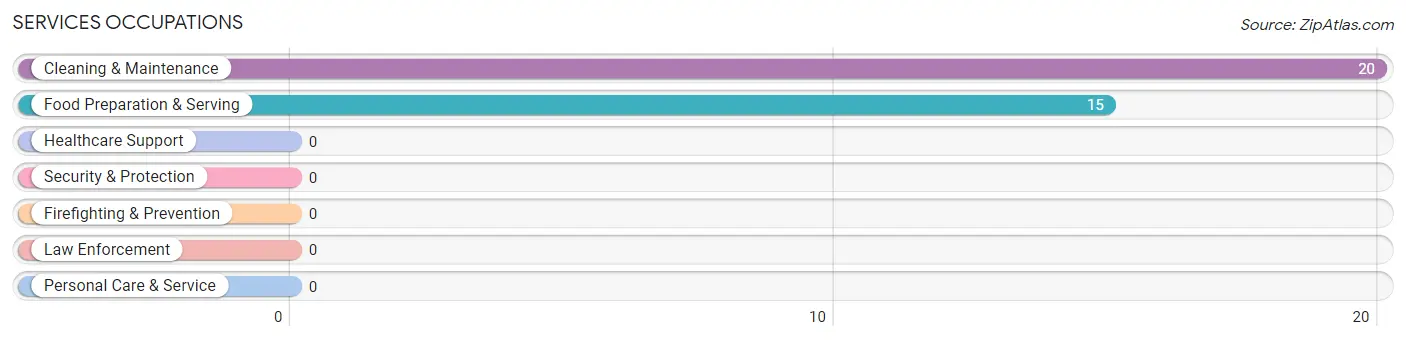
Services Occupations
The most common Services occupations in Aneth are Cleaning & Maintenance (20 | 23.5%), and Food Preparation & Serving (15 | 17.6%).
Services Occupations by Sex
Within the Services occupations in Aneth, the most male-oriented occupations are Food Preparation & Serving (33.3%), and Cleaning & Maintenance (20.0%), while the most female-oriented occupations are Cleaning & Maintenance (80.0%), and Food Preparation & Serving (66.7%).
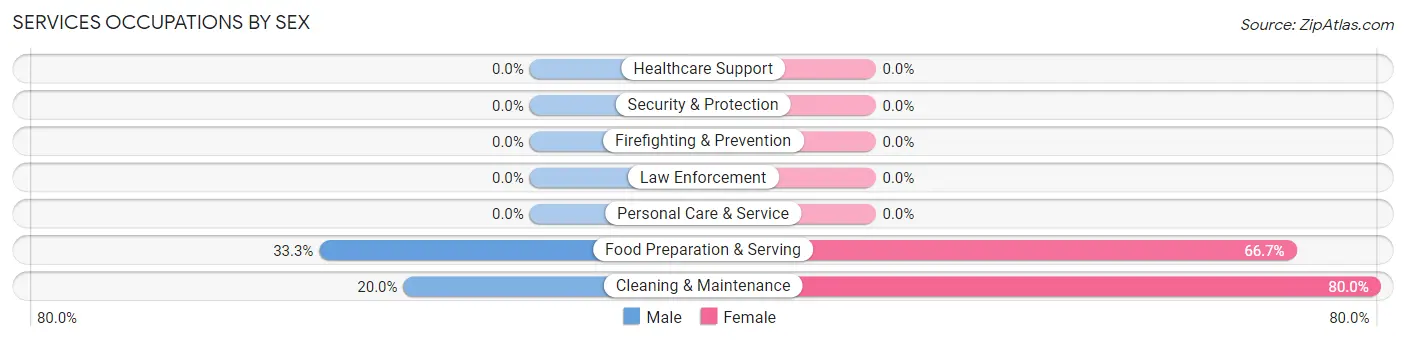
| Occupation | Male | Female |
| Healthcare Support | 0 (0.0%) | 0 (0.0%) |
| Security & Protection | 0 (0.0%) | 0 (0.0%) |
| Firefighting & Prevention | 0 (0.0%) | 0 (0.0%) |
| Law Enforcement | 0 (0.0%) | 0 (0.0%) |
| Food Preparation & Serving | 5 (33.3%) | 10 (66.7%) |
| Cleaning & Maintenance | 4 (20.0%) | 16 (80.0%) |
| Personal Care & Service | 0 (0.0%) | 0 (0.0%) |
| Total (Category) | 9 (25.7%) | 26 (74.3%) |
| Total (Overall) | 38 (44.7%) | 47 (55.3%) |
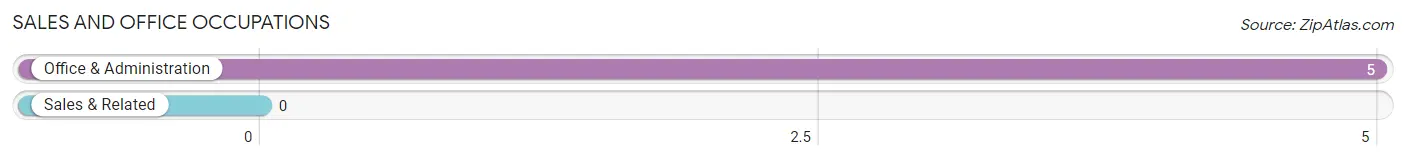
Sales and Office Occupations
The most common Sales and Office occupations in Aneth are , and Office & Administration (5 | 5.9%).
Sales and Office Occupations by Sex
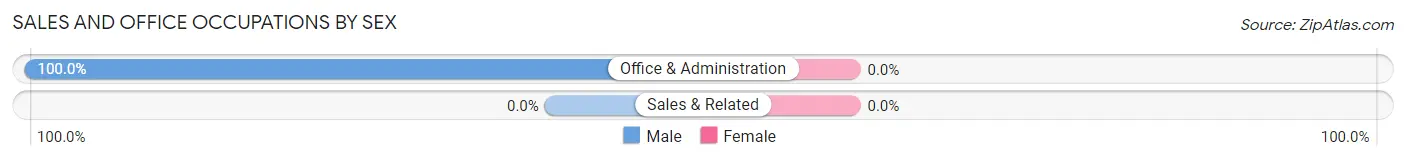
| Occupation | Male | Female |
| Sales & Related | 0 (0.0%) | 0 (0.0%) |
| Office & Administration | 5 (100.0%) | 0 (0.0%) |
| Total (Category) | 5 (100.0%) | 0 (0.0%) |
| Total (Overall) | 38 (44.7%) | 47 (55.3%) |
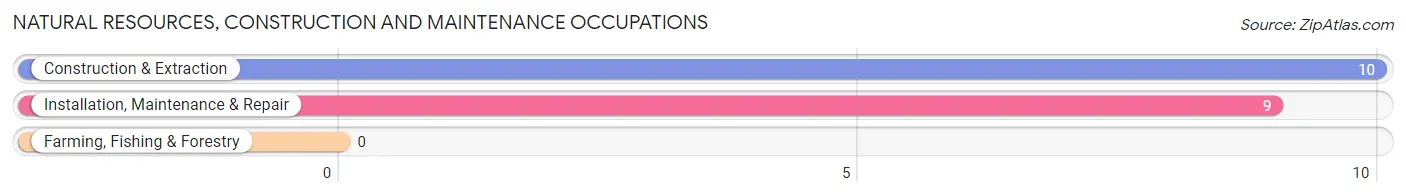
Natural Resources, Construction and Maintenance Occupations
The most common Natural Resources, Construction and Maintenance occupations in Aneth are Construction & Extraction (10 | 11.8%), and Installation, Maintenance & Repair (9 | 10.6%).
Natural Resources, Construction and Maintenance Occupations by Sex
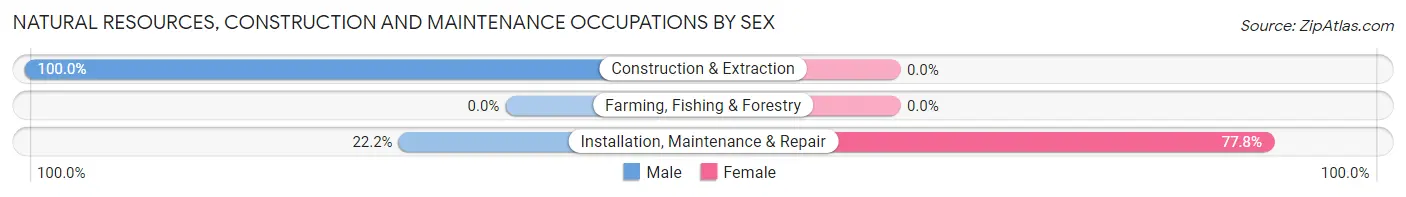
| Occupation | Male | Female |
| Farming, Fishing & Forestry | 0 (0.0%) | 0 (0.0%) |
| Construction & Extraction | 10 (100.0%) | 0 (0.0%) |
| Installation, Maintenance & Repair | 2 (22.2%) | 7 (77.8%) |
| Total (Category) | 12 (63.2%) | 7 (36.8%) |
| Total (Overall) | 38 (44.7%) | 47 (55.3%) |
Production, Transportation and Moving Occupations
The most common Production, Transportation and Moving occupations in Aneth are , and Transportation (7 | 8.2%).
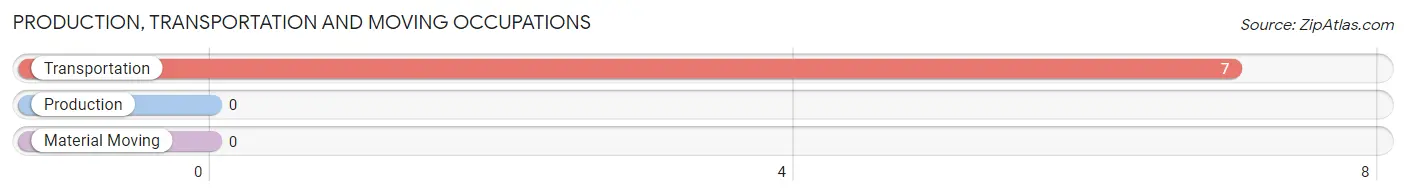
Production, Transportation and Moving Occupations by Sex
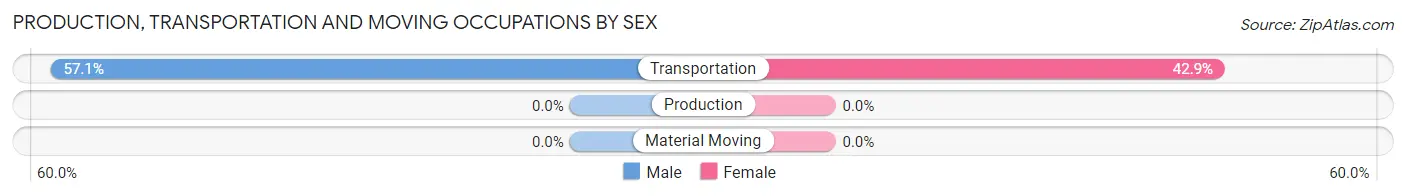
| Occupation | Male | Female |
| Production | 0 (0.0%) | 0 (0.0%) |
| Transportation | 4 (57.1%) | 3 (42.9%) |
| Material Moving | 0 (0.0%) | 0 (0.0%) |
| Total (Category) | 4 (57.1%) | 3 (42.9%) |
| Total (Overall) | 38 (44.7%) | 47 (55.3%) |
Employment Industries by Sex in Aneth
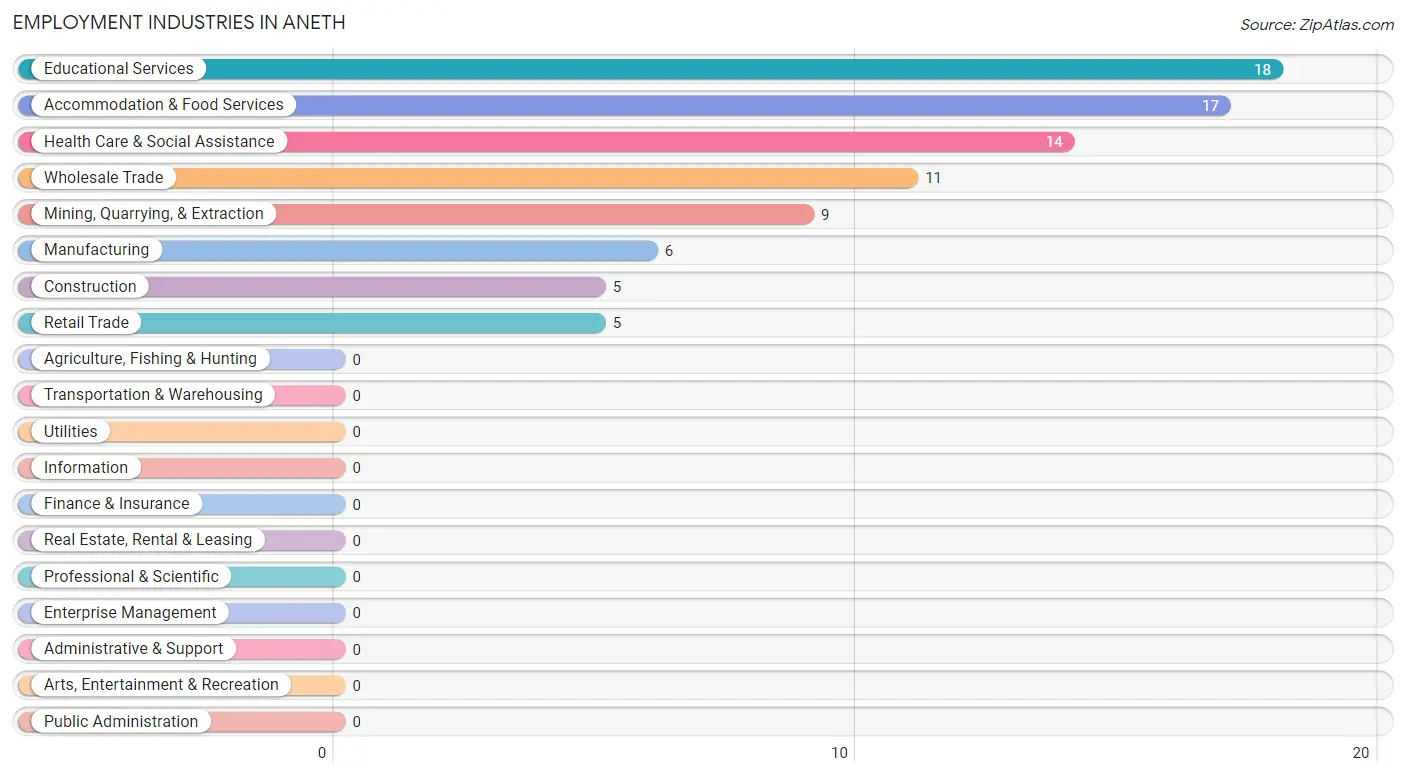
Employment Industries in Aneth
The major employment industries in Aneth include Educational Services (18 | 21.2%), Accommodation & Food Services (17 | 20.0%), Health Care & Social Assistance (14 | 16.5%), Wholesale Trade (11 | 12.9%), and Mining, Quarrying, & Extraction (9 | 10.6%).
Employment Industries by Sex in Aneth
The Aneth industries that see more men than women are Mining, Quarrying, & Extraction (100.0%), Construction (100.0%), and Manufacturing (100.0%), whereas the industries that tend to have a higher number of women are Health Care & Social Assistance (100.0%), Educational Services (77.8%), and Accommodation & Food Services (70.6%).
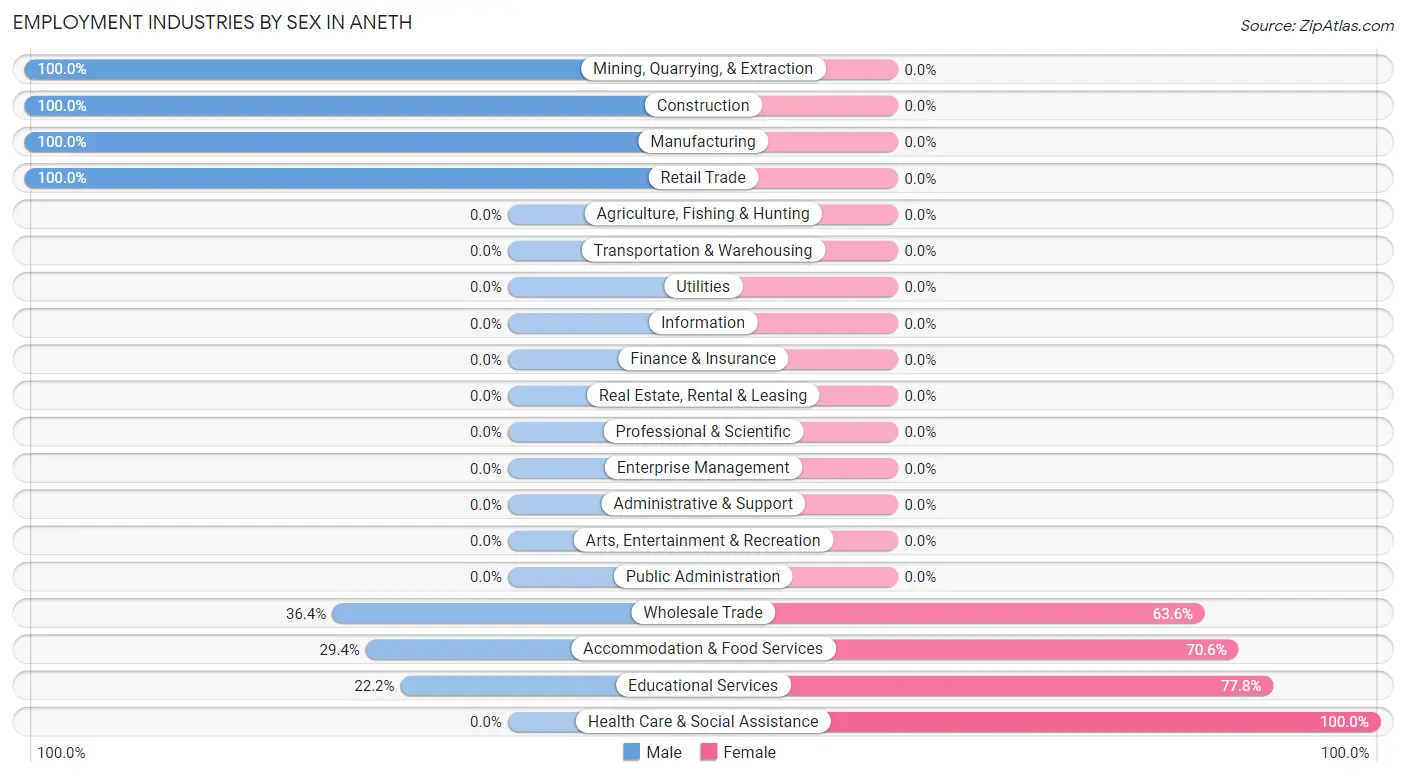
| Industry | Male | Female |
| Agriculture, Fishing & Hunting | 0 (0.0%) | 0 (0.0%) |
| Mining, Quarrying, & Extraction | 9 (100.0%) | 0 (0.0%) |
| Construction | 5 (100.0%) | 0 (0.0%) |
| Manufacturing | 6 (100.0%) | 0 (0.0%) |
| Wholesale Trade | 4 (36.4%) | 7 (63.6%) |
| Retail Trade | 5 (100.0%) | 0 (0.0%) |
| Transportation & Warehousing | 0 (0.0%) | 0 (0.0%) |
| Utilities | 0 (0.0%) | 0 (0.0%) |
| Information | 0 (0.0%) | 0 (0.0%) |
| Finance & Insurance | 0 (0.0%) | 0 (0.0%) |
| Real Estate, Rental & Leasing | 0 (0.0%) | 0 (0.0%) |
| Professional & Scientific | 0 (0.0%) | 0 (0.0%) |
| Enterprise Management | 0 (0.0%) | 0 (0.0%) |
| Administrative & Support | 0 (0.0%) | 0 (0.0%) |
| Educational Services | 4 (22.2%) | 14 (77.8%) |
| Health Care & Social Assistance | 0 (0.0%) | 14 (100.0%) |
| Arts, Entertainment & Recreation | 0 (0.0%) | 0 (0.0%) |
| Accommodation & Food Services | 5 (29.4%) | 12 (70.6%) |
| Public Administration | 0 (0.0%) | 0 (0.0%) |
| Total | 38 (44.7%) | 47 (55.3%) |
Education in Aneth
School Enrollment in Aneth
The most common levels of schooling among the 130 students in Aneth are elementary school (53 | 40.8%), high school (33 | 25.4%), and middle school (21 | 16.2%).
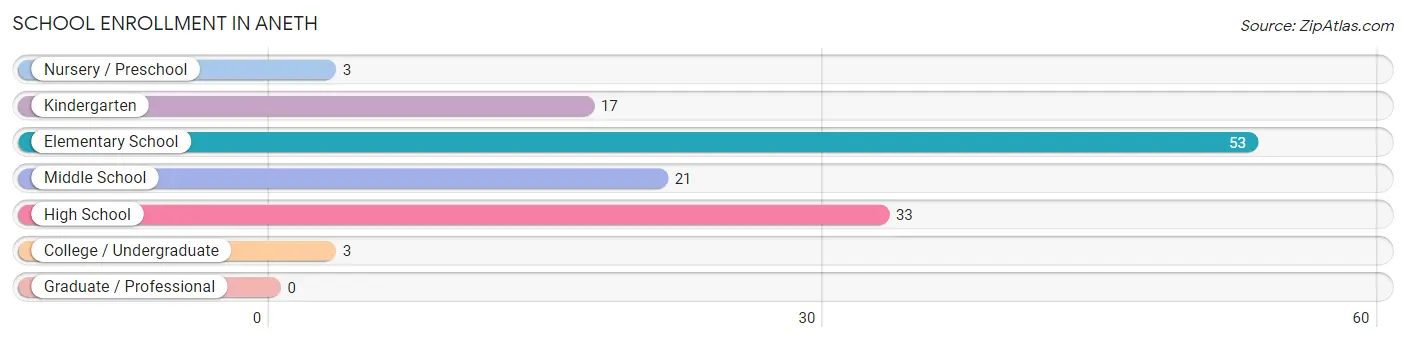
| School Level | # Students | % Students |
| Nursery / Preschool | 3 | 2.3% |
| Kindergarten | 17 | 13.1% |
| Elementary School | 53 | 40.8% |
| Middle School | 21 | 16.2% |
| High School | 33 | 25.4% |
| College / Undergraduate | 3 | 2.3% |
| Graduate / Professional | 0 | 0.0% |
| Total | 130 | 100.0% |
School Enrollment by Age by Funding Source in Aneth
Out of a total of 130 students who are enrolled in schools in Aneth, 9 (6.9%) attend a private institution, while the remaining 121 (93.1%) are enrolled in public schools. The age group of 25 to 34 year olds has the highest likelihood of being enrolled in private schools, with 9 (100.0% in the age bracket) enrolled. Conversely, the age group of 3 to 4 year olds has the lowest likelihood of being enrolled in a private school, with 3 (100.0% in the age bracket) attending a public institution.
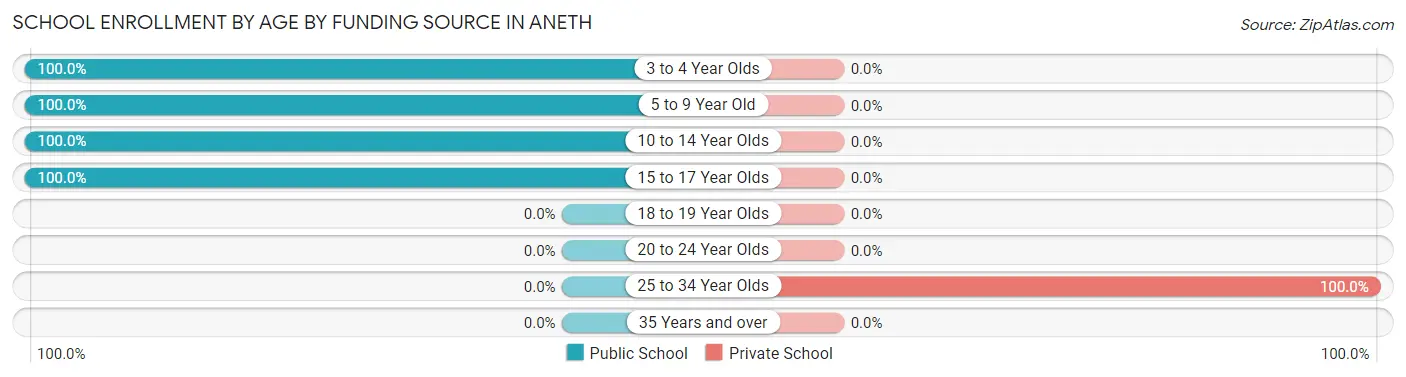
| Age Bracket | Public School | Private School |
| 3 to 4 Year Olds | 3 (100.0%) | 0 (0.0%) |
| 5 to 9 Year Old | 55 (100.0%) | 0 (0.0%) |
| 10 to 14 Year Olds | 41 (100.0%) | 0 (0.0%) |
| 15 to 17 Year Olds | 22 (100.0%) | 0 (0.0%) |
| 18 to 19 Year Olds | 0 (0.0%) | 0 (0.0%) |
| 20 to 24 Year Olds | 0 (0.0%) | 0 (0.0%) |
| 25 to 34 Year Olds | 0 (0.0%) | 9 (100.0%) |
| 35 Years and over | 0 (0.0%) | 0 (0.0%) |
| Total | 121 (93.1%) | 9 (6.9%) |
Educational Attainment by Field of Study in Aneth
Social sciences (4 | 33.3%), business (4 | 33.3%), and education (4 | 33.3%) are the most common fields of study among 12 individuals in Aneth who have obtained a bachelor's degree or higher.
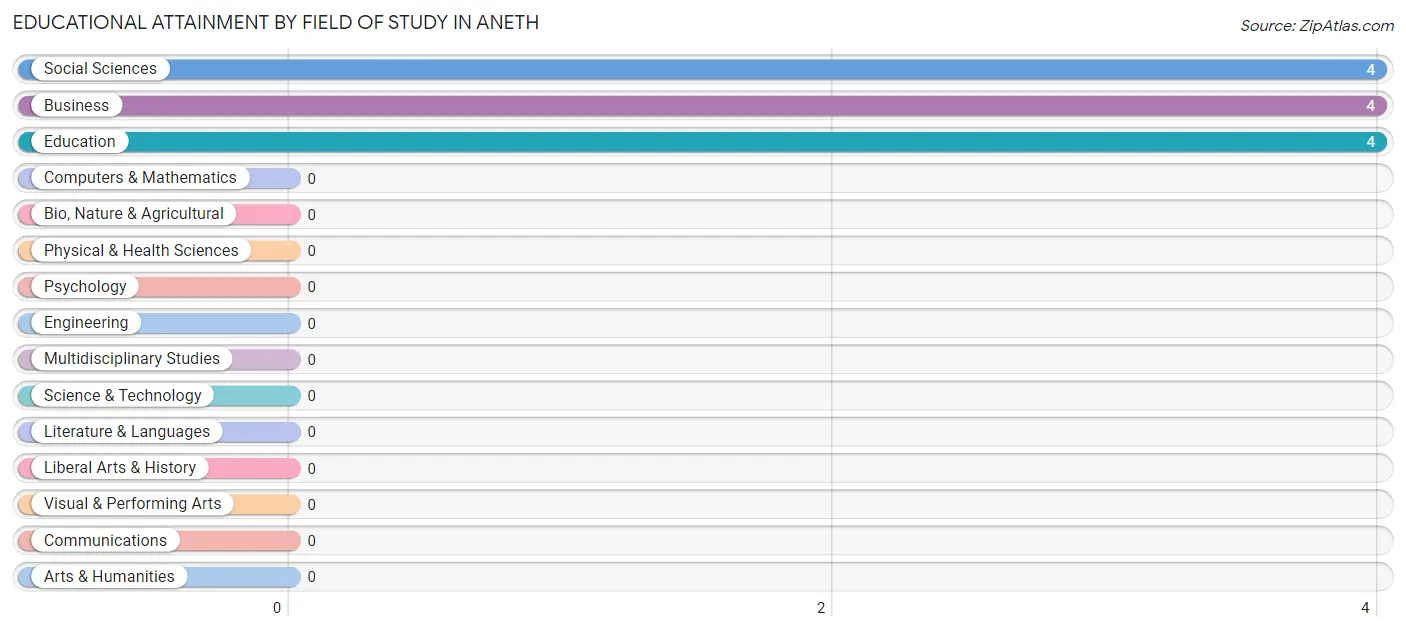
| Field of Study | # Graduates | % Graduates |
| Computers & Mathematics | 0 | 0.0% |
| Bio, Nature & Agricultural | 0 | 0.0% |
| Physical & Health Sciences | 0 | 0.0% |
| Psychology | 0 | 0.0% |
| Social Sciences | 4 | 33.3% |
| Engineering | 0 | 0.0% |
| Multidisciplinary Studies | 0 | 0.0% |
| Science & Technology | 0 | 0.0% |
| Business | 4 | 33.3% |
| Education | 4 | 33.3% |
| Literature & Languages | 0 | 0.0% |
| Liberal Arts & History | 0 | 0.0% |
| Visual & Performing Arts | 0 | 0.0% |
| Communications | 0 | 0.0% |
| Arts & Humanities | 0 | 0.0% |
| Total | 12 | 100.0% |
Transportation & Commute in Aneth
Vehicle Availability by Sex in Aneth
The most prevalent vehicle ownership categories in Aneth are males with 1 vehicle (14, accounting for 36.8%) and females with 1 vehicle (17, making up 29.8%).
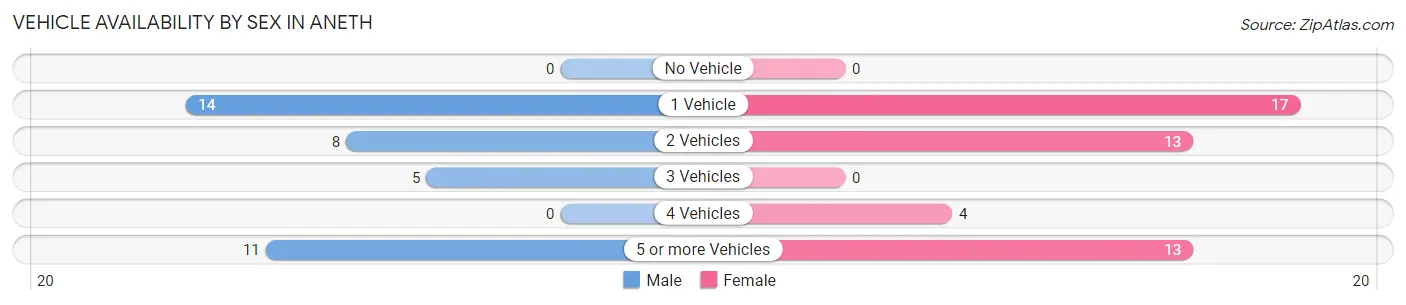
| Vehicles Available | Male | Female |
| No Vehicle | 0 (0.0%) | 0 (0.0%) |
| 1 Vehicle | 14 (36.8%) | 17 (36.2%) |
| 2 Vehicles | 8 (21.0%) | 13 (27.7%) |
| 3 Vehicles | 5 (13.2%) | 0 (0.0%) |
| 4 Vehicles | 0 (0.0%) | 4 (8.5%) |
| 5 or more Vehicles | 11 (28.9%) | 13 (27.7%) |
| Total | 38 (100.0%) | 47 (100.0%) |
Commute Time in Aneth
The most frequently occuring commute durations in Aneth are 90 or more minutes (22 commuters, 32.8%), 60 to 89 minutes (18 commuters, 26.9%), and 10 to 14 minutes (9 commuters, 13.4%).
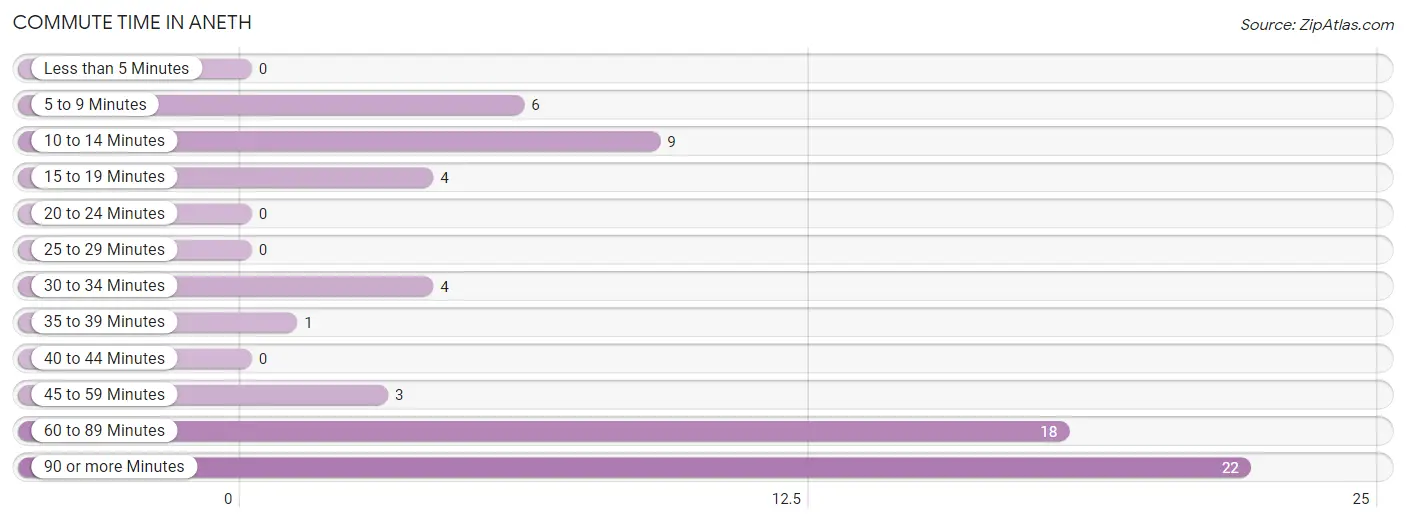
| Commute Time | # Commuters | % Commuters |
| Less than 5 Minutes | 0 | 0.0% |
| 5 to 9 Minutes | 6 | 9.0% |
| 10 to 14 Minutes | 9 | 13.4% |
| 15 to 19 Minutes | 4 | 6.0% |
| 20 to 24 Minutes | 0 | 0.0% |
| 25 to 29 Minutes | 0 | 0.0% |
| 30 to 34 Minutes | 4 | 6.0% |
| 35 to 39 Minutes | 1 | 1.5% |
| 40 to 44 Minutes | 0 | 0.0% |
| 45 to 59 Minutes | 3 | 4.5% |
| 60 to 89 Minutes | 18 | 26.9% |
| 90 or more Minutes | 22 | 32.8% |
Commute Time by Sex in Aneth
The most common commute times in Aneth are 60 to 89 minutes (11 commuters, 32.4%) for males and 90 or more minutes (12 commuters, 36.4%) for females.
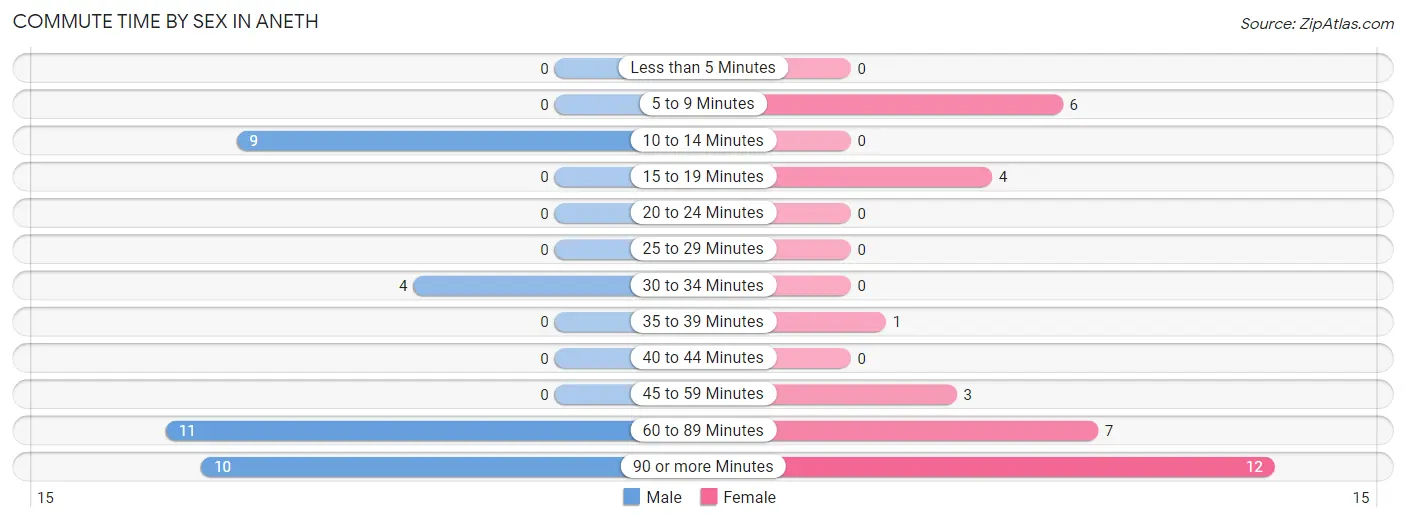
| Commute Time | Male | Female |
| Less than 5 Minutes | 0 (0.0%) | 0 (0.0%) |
| 5 to 9 Minutes | 0 (0.0%) | 6 (18.2%) |
| 10 to 14 Minutes | 9 (26.5%) | 0 (0.0%) |
| 15 to 19 Minutes | 0 (0.0%) | 4 (12.1%) |
| 20 to 24 Minutes | 0 (0.0%) | 0 (0.0%) |
| 25 to 29 Minutes | 0 (0.0%) | 0 (0.0%) |
| 30 to 34 Minutes | 4 (11.8%) | 0 (0.0%) |
| 35 to 39 Minutes | 0 (0.0%) | 1 (3.0%) |
| 40 to 44 Minutes | 0 (0.0%) | 0 (0.0%) |
| 45 to 59 Minutes | 0 (0.0%) | 3 (9.1%) |
| 60 to 89 Minutes | 11 (32.4%) | 7 (21.2%) |
| 90 or more Minutes | 10 (29.4%) | 12 (36.4%) |
Time of Departure to Work by Sex in Aneth
The most frequent times of departure to work in Aneth are 7:00 AM to 7:29 AM (9, 26.5%) for males and 7:00 AM to 7:29 AM (11, 33.3%) for females.
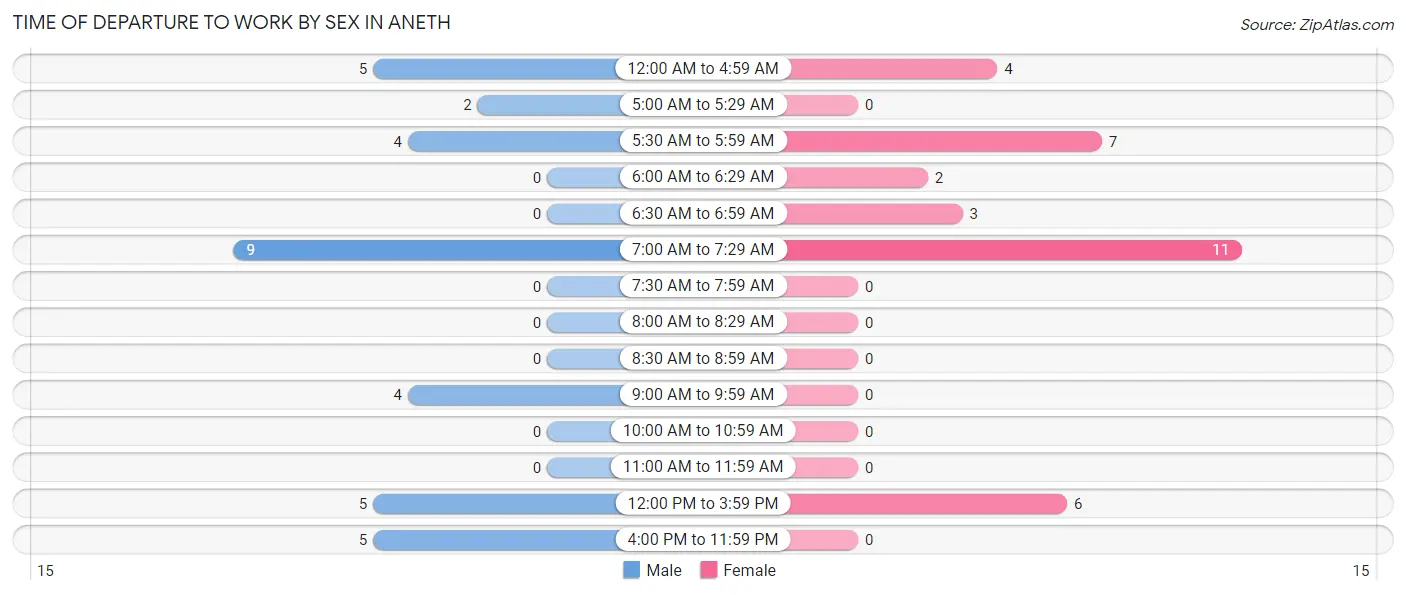
| Time of Departure | Male | Female |
| 12:00 AM to 4:59 AM | 5 (14.7%) | 4 (12.1%) |
| 5:00 AM to 5:29 AM | 2 (5.9%) | 0 (0.0%) |
| 5:30 AM to 5:59 AM | 4 (11.8%) | 7 (21.2%) |
| 6:00 AM to 6:29 AM | 0 (0.0%) | 2 (6.1%) |
| 6:30 AM to 6:59 AM | 0 (0.0%) | 3 (9.1%) |
| 7:00 AM to 7:29 AM | 9 (26.5%) | 11 (33.3%) |
| 7:30 AM to 7:59 AM | 0 (0.0%) | 0 (0.0%) |
| 8:00 AM to 8:29 AM | 0 (0.0%) | 0 (0.0%) |
| 8:30 AM to 8:59 AM | 0 (0.0%) | 0 (0.0%) |
| 9:00 AM to 9:59 AM | 4 (11.8%) | 0 (0.0%) |
| 10:00 AM to 10:59 AM | 0 (0.0%) | 0 (0.0%) |
| 11:00 AM to 11:59 AM | 0 (0.0%) | 0 (0.0%) |
| 12:00 PM to 3:59 PM | 5 (14.7%) | 6 (18.2%) |
| 4:00 PM to 11:59 PM | 5 (14.7%) | 0 (0.0%) |
| Total | 34 (100.0%) | 33 (100.0%) |
Housing Occupancy in Aneth
Occupancy by Ownership in Aneth
Of the total 97 dwellings in Aneth, owner-occupied units account for 83 (85.6%), while renter-occupied units make up 14 (14.4%).
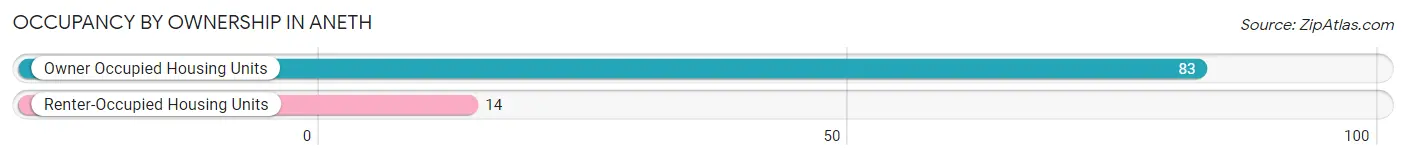
| Occupancy | # Housing Units | % Housing Units |
| Owner Occupied Housing Units | 83 | 85.6% |
| Renter-Occupied Housing Units | 14 | 14.4% |
| Total Occupied Housing Units | 97 | 100.0% |
Occupancy by Household Size in Aneth
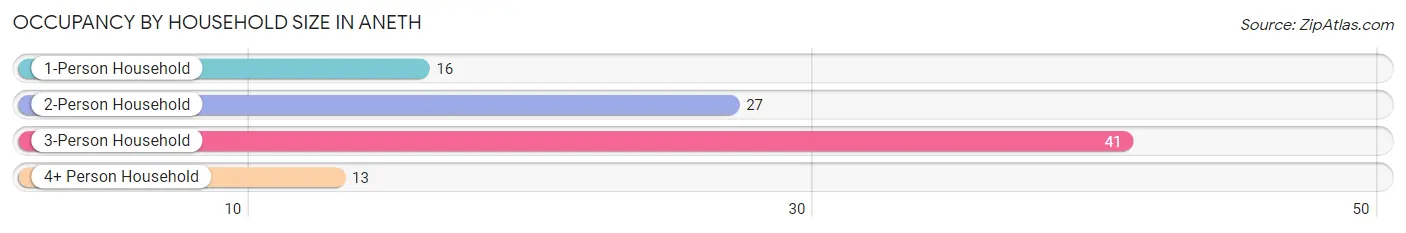
| Household Size | # Housing Units | % Housing Units |
| 1-Person Household | 16 | 16.5% |
| 2-Person Household | 27 | 27.8% |
| 3-Person Household | 41 | 42.3% |
| 4+ Person Household | 13 | 13.4% |
| Total Housing Units | 97 | 100.0% |
Occupancy by Ownership by Household Size in Aneth
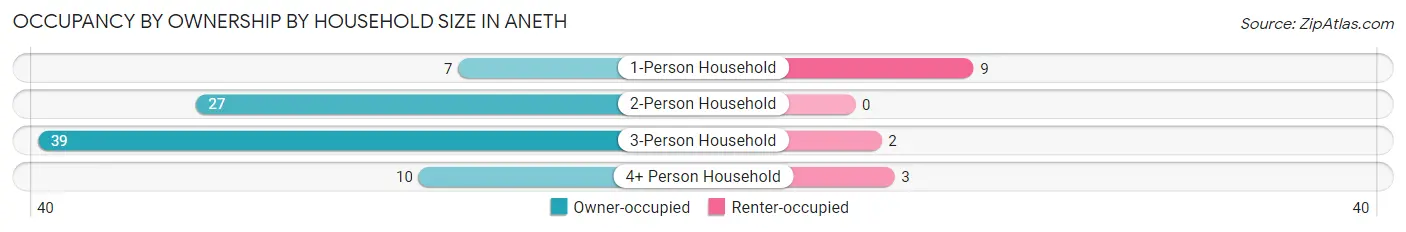
| Household Size | Owner-occupied | Renter-occupied |
| 1-Person Household | 7 (43.8%) | 9 (56.2%) |
| 2-Person Household | 27 (100.0%) | 0 (0.0%) |
| 3-Person Household | 39 (95.1%) | 2 (4.9%) |
| 4+ Person Household | 10 (76.9%) | 3 (23.1%) |
| Total Housing Units | 83 (85.6%) | 14 (14.4%) |
Occupancy by Educational Attainment in Aneth
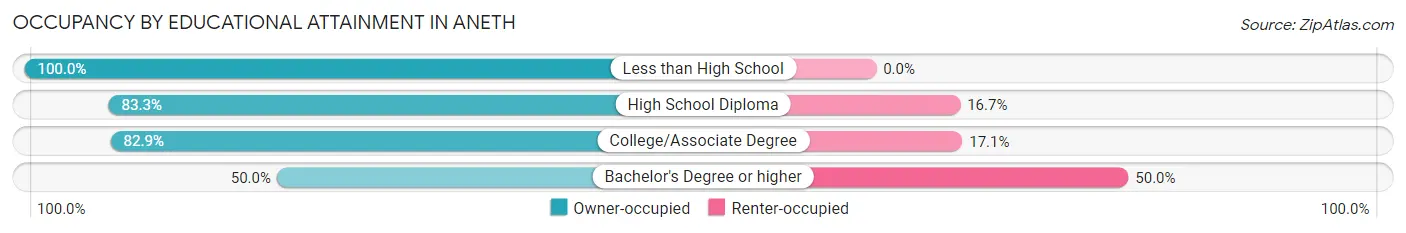
| Household Size | Owner-occupied | Renter-occupied |
| Less than High School | 30 (100.0%) | 0 (0.0%) |
| High School Diploma | 15 (83.3%) | 3 (16.7%) |
| College/Associate Degree | 34 (82.9%) | 7 (17.1%) |
| Bachelor's Degree or higher | 4 (50.0%) | 4 (50.0%) |
Occupancy by Age of Householder in Aneth
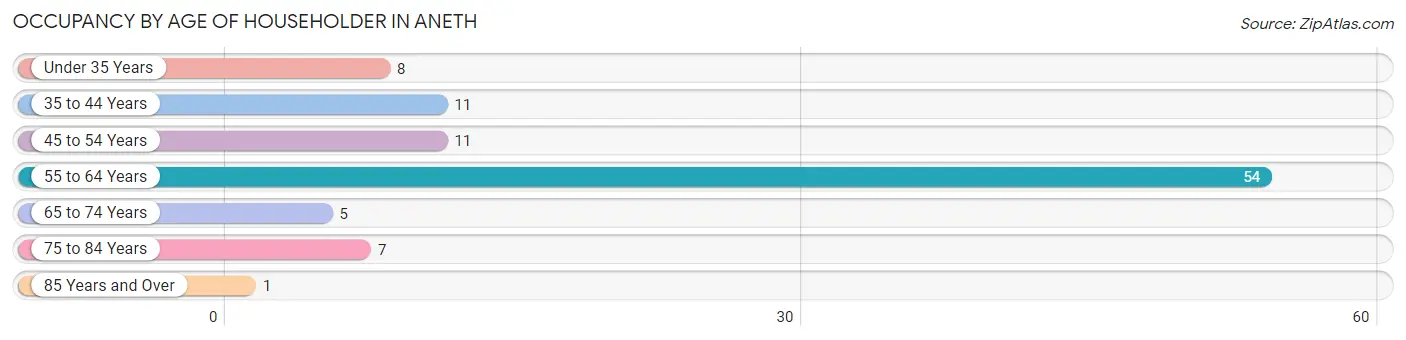
| Age Bracket | # Households | % Households |
| Under 35 Years | 8 | 8.3% |
| 35 to 44 Years | 11 | 11.3% |
| 45 to 54 Years | 11 | 11.3% |
| 55 to 64 Years | 54 | 55.7% |
| 65 to 74 Years | 5 | 5.1% |
| 75 to 84 Years | 7 | 7.2% |
| 85 Years and Over | 1 | 1.0% |
| Total | 97 | 100.0% |
Housing Finances in Aneth
Median Income by Occupancy in Aneth
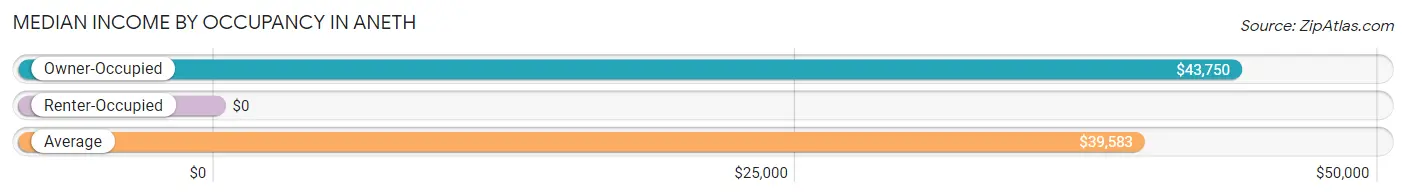
| Occupancy Type | # Households | Median Income |
| Owner-Occupied | 83 (85.6%) | $43,750 |
| Renter-Occupied | 14 (14.4%) | $0 |
| Average | 97 (100.0%) | $39,583 |
Occupancy by Householder Income Bracket in Aneth
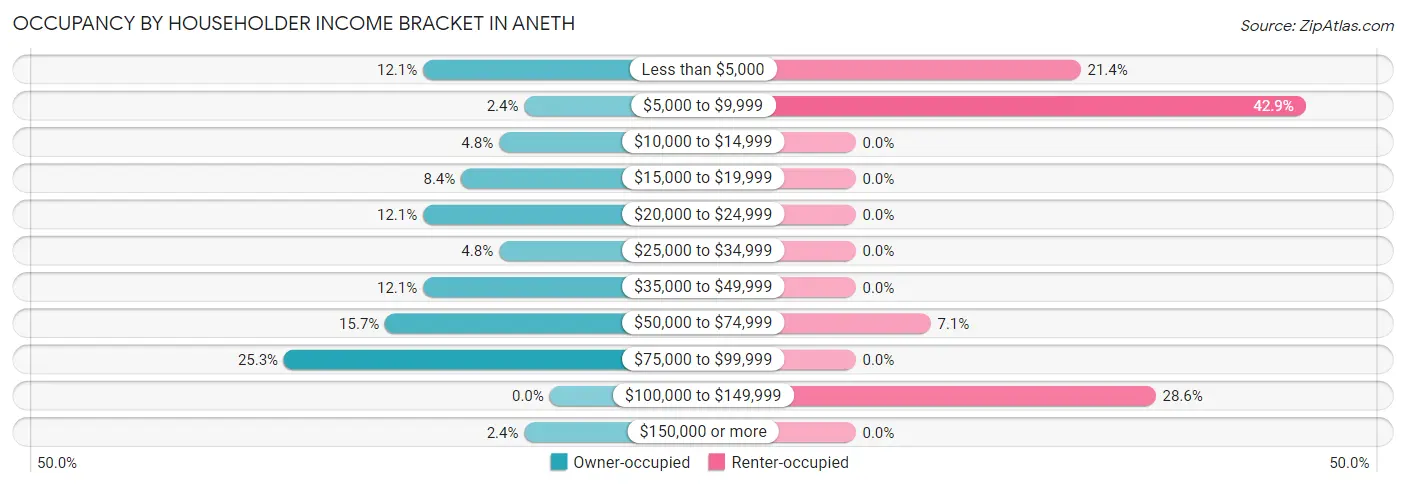
| Income Bracket | Owner-occupied | Renter-occupied |
| Less than $5,000 | 10 (12.0%) | 3 (21.4%) |
| $5,000 to $9,999 | 2 (2.4%) | 6 (42.9%) |
| $10,000 to $14,999 | 4 (4.8%) | 0 (0.0%) |
| $15,000 to $19,999 | 7 (8.4%) | 0 (0.0%) |
| $20,000 to $24,999 | 10 (12.0%) | 0 (0.0%) |
| $25,000 to $34,999 | 4 (4.8%) | 0 (0.0%) |
| $35,000 to $49,999 | 10 (12.0%) | 0 (0.0%) |
| $50,000 to $74,999 | 13 (15.7%) | 1 (7.1%) |
| $75,000 to $99,999 | 21 (25.3%) | 0 (0.0%) |
| $100,000 to $149,999 | 0 (0.0%) | 4 (28.6%) |
| $150,000 or more | 2 (2.4%) | 0 (0.0%) |
| Total | 83 (100.0%) | 14 (100.0%) |
Monthly Housing Cost Tiers in Aneth
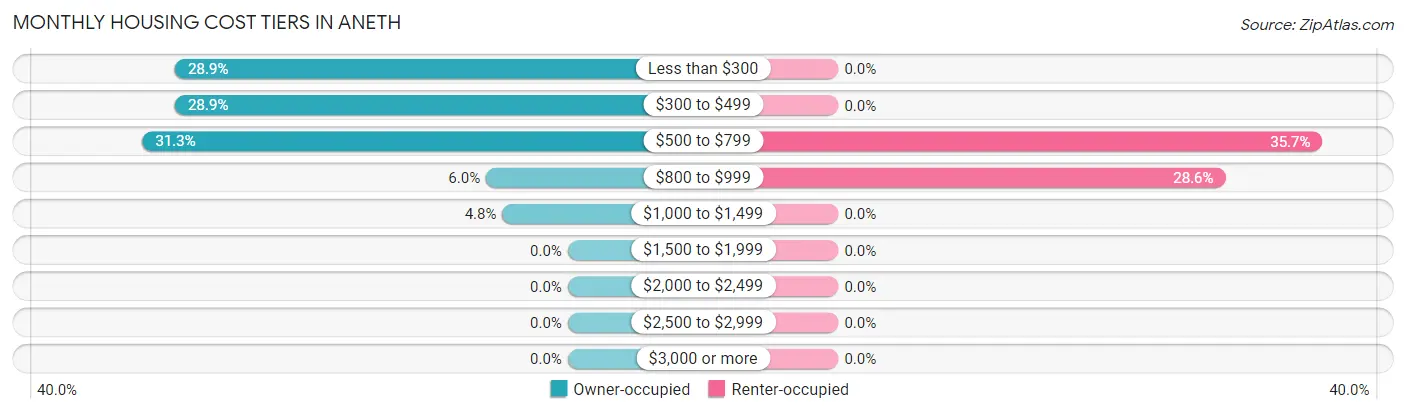
| Monthly Cost | Owner-occupied | Renter-occupied |
| Less than $300 | 24 (28.9%) | 0 (0.0%) |
| $300 to $499 | 24 (28.9%) | 0 (0.0%) |
| $500 to $799 | 26 (31.3%) | 5 (35.7%) |
| $800 to $999 | 5 (6.0%) | 4 (28.6%) |
| $1,000 to $1,499 | 4 (4.8%) | 0 (0.0%) |
| $1,500 to $1,999 | 0 (0.0%) | 0 (0.0%) |
| $2,000 to $2,499 | 0 (0.0%) | 0 (0.0%) |
| $2,500 to $2,999 | 0 (0.0%) | 0 (0.0%) |
| $3,000 or more | 0 (0.0%) | 0 (0.0%) |
| Total | 83 (100.0%) | 14 (100.0%) |
Physical Housing Characteristics in Aneth
Housing Structures in Aneth
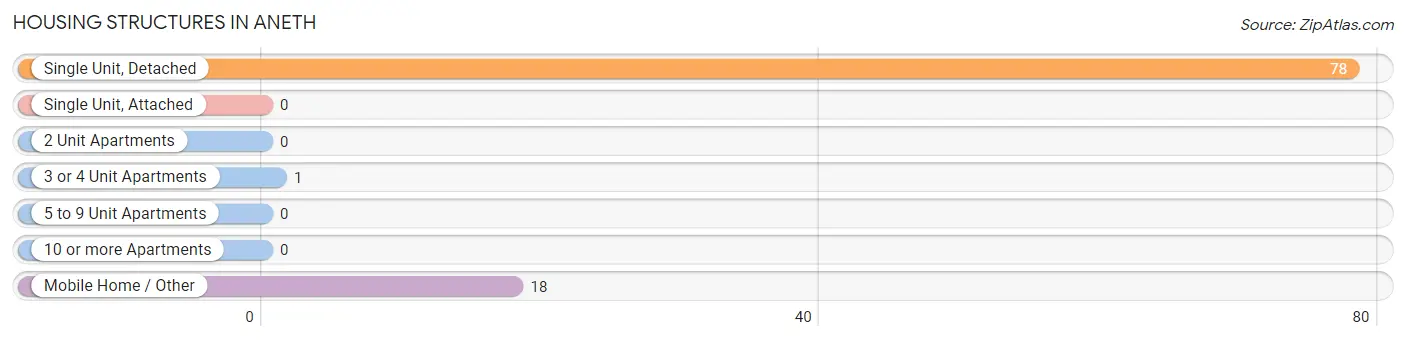
| Structure Type | # Housing Units | % Housing Units |
| Single Unit, Detached | 78 | 80.4% |
| Single Unit, Attached | 0 | 0.0% |
| 2 Unit Apartments | 0 | 0.0% |
| 3 or 4 Unit Apartments | 1 | 1.0% |
| 5 to 9 Unit Apartments | 0 | 0.0% |
| 10 or more Apartments | 0 | 0.0% |
| Mobile Home / Other | 18 | 18.6% |
| Total | 97 | 100.0% |
Housing Structures by Occupancy in Aneth
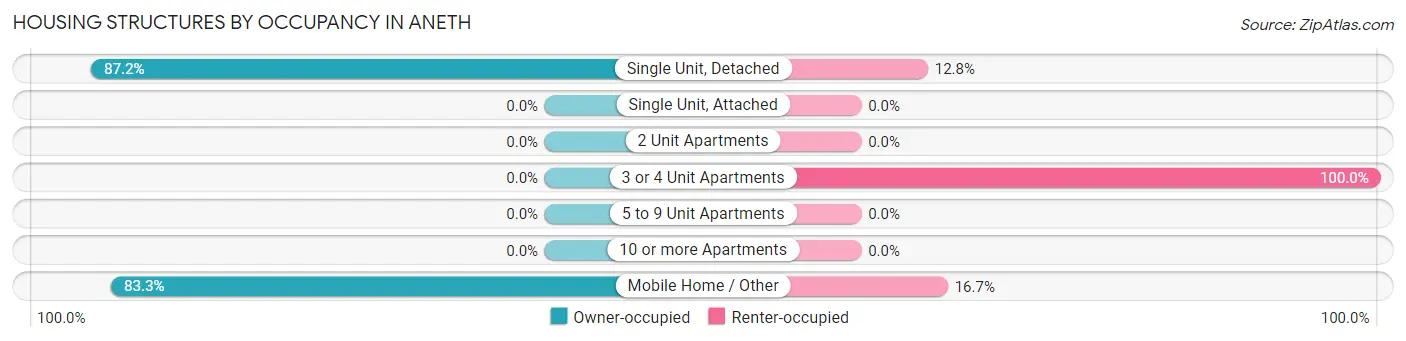
| Structure Type | Owner-occupied | Renter-occupied |
| Single Unit, Detached | 68 (87.2%) | 10 (12.8%) |
| Single Unit, Attached | 0 (0.0%) | 0 (0.0%) |
| 2 Unit Apartments | 0 (0.0%) | 0 (0.0%) |
| 3 or 4 Unit Apartments | 0 (0.0%) | 1 (100.0%) |
| 5 to 9 Unit Apartments | 0 (0.0%) | 0 (0.0%) |
| 10 or more Apartments | 0 (0.0%) | 0 (0.0%) |
| Mobile Home / Other | 15 (83.3%) | 3 (16.7%) |
| Total | 83 (85.6%) | 14 (14.4%) |
Housing Structures by Number of Rooms in Aneth
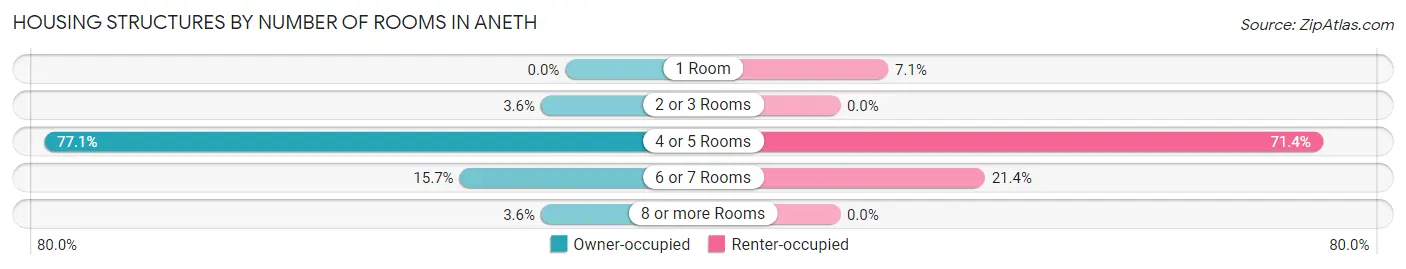
| Number of Rooms | Owner-occupied | Renter-occupied |
| 1 Room | 0 (0.0%) | 1 (7.1%) |
| 2 or 3 Rooms | 3 (3.6%) | 0 (0.0%) |
| 4 or 5 Rooms | 64 (77.1%) | 10 (71.4%) |
| 6 or 7 Rooms | 13 (15.7%) | 3 (21.4%) |
| 8 or more Rooms | 3 (3.6%) | 0 (0.0%) |
| Total | 83 (100.0%) | 14 (100.0%) |
Housing Structure by Heating Type in Aneth
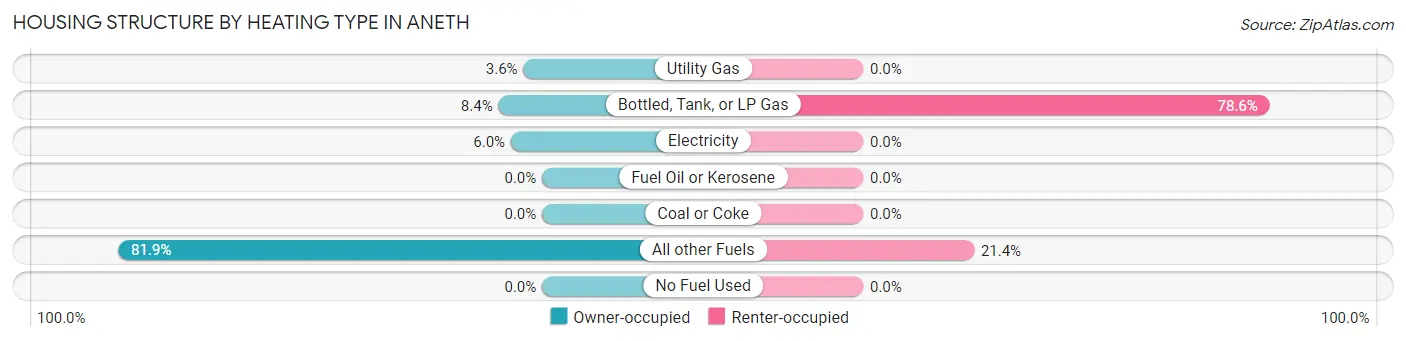
| Heating Type | Owner-occupied | Renter-occupied |
| Utility Gas | 3 (3.6%) | 0 (0.0%) |
| Bottled, Tank, or LP Gas | 7 (8.4%) | 11 (78.6%) |
| Electricity | 5 (6.0%) | 0 (0.0%) |
| Fuel Oil or Kerosene | 0 (0.0%) | 0 (0.0%) |
| Coal or Coke | 0 (0.0%) | 0 (0.0%) |
| All other Fuels | 68 (81.9%) | 3 (21.4%) |
| No Fuel Used | 0 (0.0%) | 0 (0.0%) |
| Total | 83 (100.0%) | 14 (100.0%) |
Household Vehicle Usage in Aneth
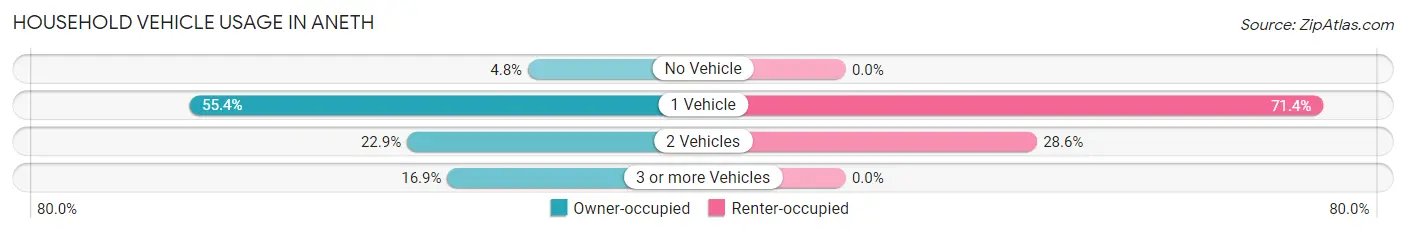
| Vehicles per Household | Owner-occupied | Renter-occupied |
| No Vehicle | 4 (4.8%) | 0 (0.0%) |
| 1 Vehicle | 46 (55.4%) | 10 (71.4%) |
| 2 Vehicles | 19 (22.9%) | 4 (28.6%) |
| 3 or more Vehicles | 14 (16.9%) | 0 (0.0%) |
| Total | 83 (100.0%) | 14 (100.0%) |
Real Estate & Mortgages in Aneth
Real Estate and Mortgage Overview in Aneth
| Characteristic | Without Mortgage | With Mortgage |
| Housing Units | 78 | 5 |
| Median Property Value | - | - |
| Median Household Income | $39,167 | $0 |
| Monthly Housing Costs | $377 | $0 |
| Real Estate Taxes | - | - |
Property Value by Mortgage Status in Aneth
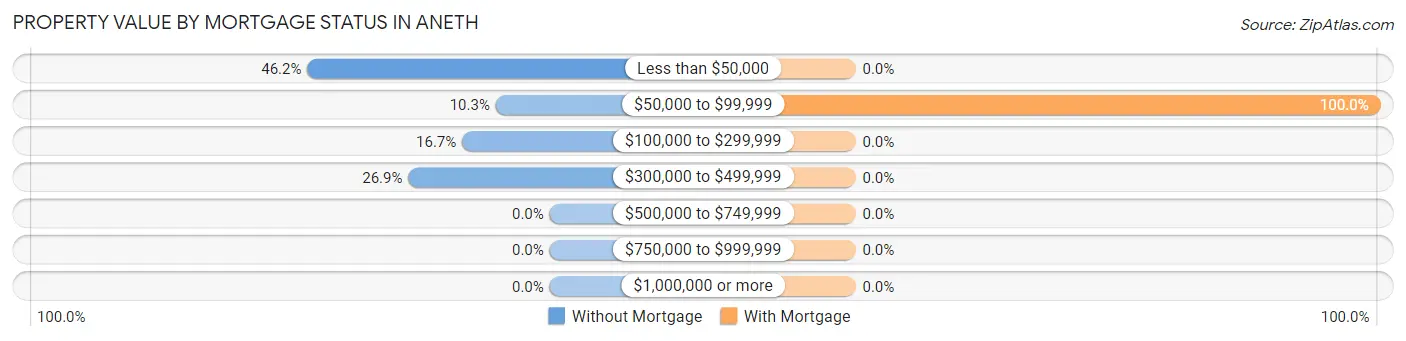
| Property Value | Without Mortgage | With Mortgage |
| Less than $50,000 | 36 (46.2%) | 0 (0.0%) |
| $50,000 to $99,999 | 8 (10.3%) | 5 (100.0%) |
| $100,000 to $299,999 | 13 (16.7%) | 0 (0.0%) |
| $300,000 to $499,999 | 21 (26.9%) | 0 (0.0%) |
| $500,000 to $749,999 | 0 (0.0%) | 0 (0.0%) |
| $750,000 to $999,999 | 0 (0.0%) | 0 (0.0%) |
| $1,000,000 or more | 0 (0.0%) | 0 (0.0%) |
| Total | 78 (100.0%) | 5 (100.0%) |
Household Income by Mortgage Status in Aneth
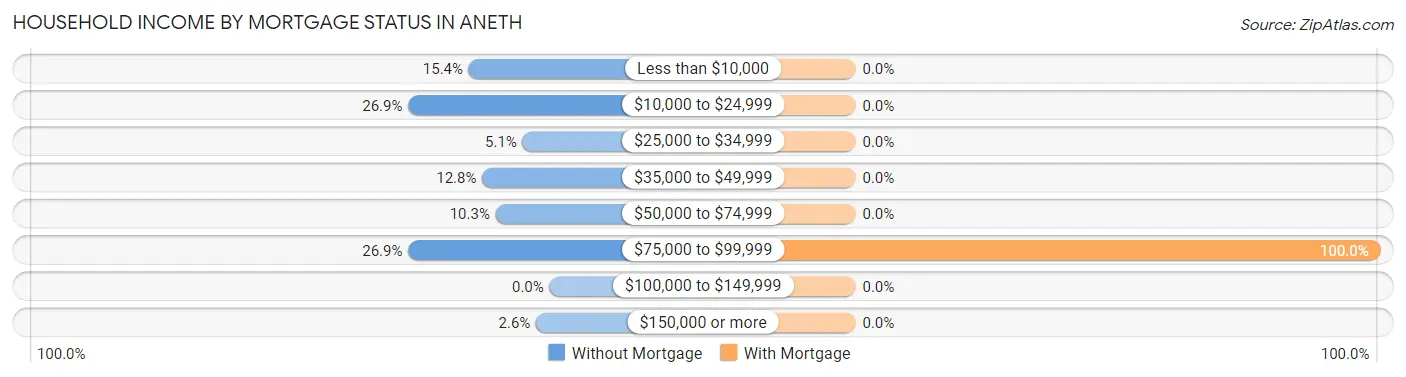
| Household Income | Without Mortgage | With Mortgage |
| Less than $10,000 | 12 (15.4%) | 0 (0.0%) |
| $10,000 to $24,999 | 21 (26.9%) | 0 (0.0%) |
| $25,000 to $34,999 | 4 (5.1%) | 0 (0.0%) |
| $35,000 to $49,999 | 10 (12.8%) | 0 (0.0%) |
| $50,000 to $74,999 | 8 (10.3%) | 0 (0.0%) |
| $75,000 to $99,999 | 21 (26.9%) | 5 (100.0%) |
| $100,000 to $149,999 | 0 (0.0%) | 0 (0.0%) |
| $150,000 or more | 2 (2.6%) | 0 (0.0%) |
| Total | 78 (100.0%) | 5 (100.0%) |
Property Value to Household Income Ratio in Aneth
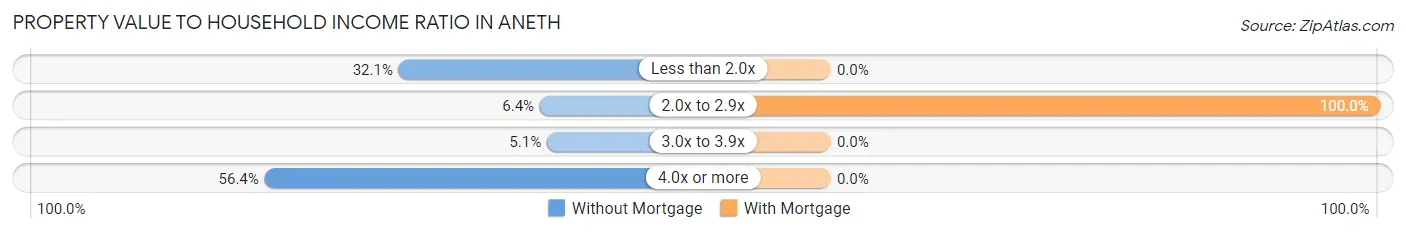
| Value-to-Income Ratio | Without Mortgage | With Mortgage |
| Less than 2.0x | 25 (32.1%) | 0 (0.0%) |
| 2.0x to 2.9x | 5 (6.4%) | 5 (100.0%) |
| 3.0x to 3.9x | 4 (5.1%) | 0 (0.0%) |
| 4.0x or more | 44 (56.4%) | 0 (0.0%) |
| Total | 78 (100.0%) | 5 (100.0%) |
Real Estate Taxes by Mortgage Status in Aneth
| Property Taxes | Without Mortgage | With Mortgage |
| Less than $800 | 0 (0.0%) | 0 (0.0%) |
| $800 to $1,499 | 0 (0.0%) | 0 (0.0%) |
| $800 to $1,499 | 0 (0.0%) | 0 (0.0%) |
| Total | 78 (100.0%) | 5 (100.0%) |
Health & Disability in Aneth
Health Insurance Coverage by Age in Aneth
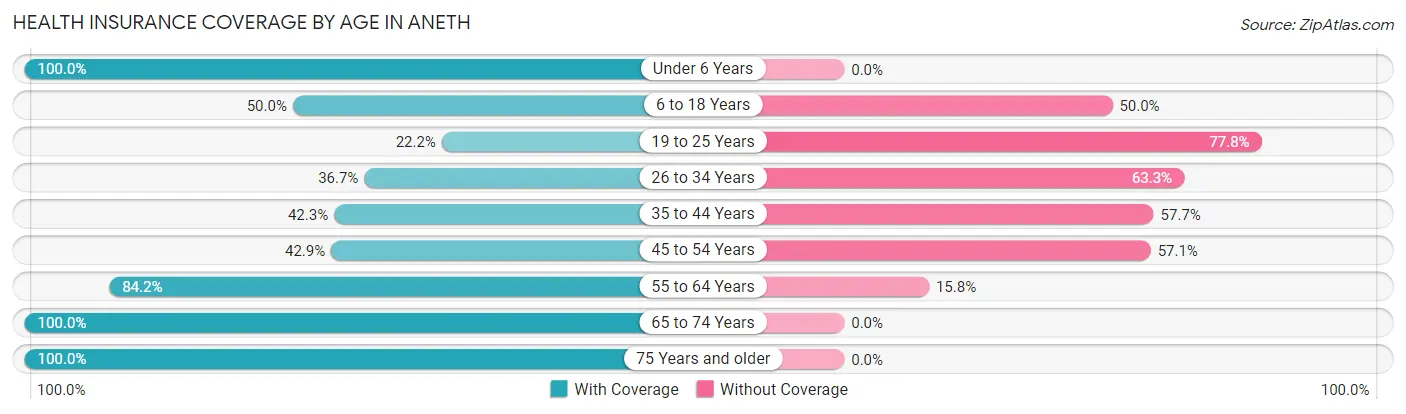
| Age Bracket | With Coverage | Without Coverage |
| Under 6 Years | 20 (100.0%) | 0 (0.0%) |
| 6 to 18 Years | 53 (50.0%) | 53 (50.0%) |
| 19 to 25 Years | 6 (22.2%) | 21 (77.8%) |
| 26 to 34 Years | 11 (36.7%) | 19 (63.3%) |
| 35 to 44 Years | 11 (42.3%) | 15 (57.7%) |
| 45 to 54 Years | 12 (42.9%) | 16 (57.1%) |
| 55 to 64 Years | 64 (84.2%) | 12 (15.8%) |
| 65 to 74 Years | 15 (100.0%) | 0 (0.0%) |
| 75 Years and older | 14 (100.0%) | 0 (0.0%) |
| Total | 206 (60.2%) | 136 (39.8%) |
Health Insurance Coverage by Citizenship Status in Aneth
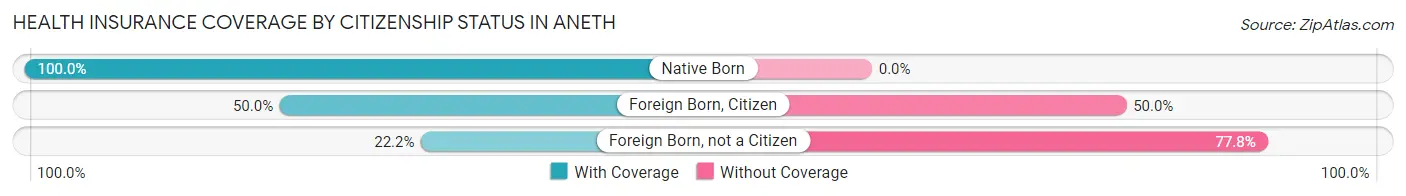
| Citizenship Status | With Coverage | Without Coverage |
| Native Born | 20 (100.0%) | 0 (0.0%) |
| Foreign Born, Citizen | 53 (50.0%) | 53 (50.0%) |
| Foreign Born, not a Citizen | 6 (22.2%) | 21 (77.8%) |
Health Insurance Coverage by Household Income in Aneth
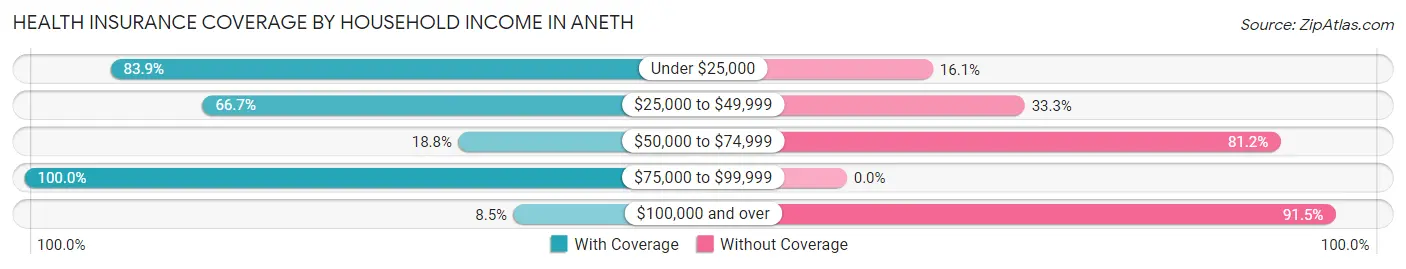
| Household Income | With Coverage | Without Coverage |
| Under $25,000 | 104 (83.9%) | 20 (16.1%) |
| $25,000 to $49,999 | 34 (66.7%) | 17 (33.3%) |
| $50,000 to $74,999 | 13 (18.8%) | 56 (81.2%) |
| $75,000 to $99,999 | 51 (100.0%) | 0 (0.0%) |
| $100,000 and over | 4 (8.5%) | 43 (91.5%) |
Public vs Private Health Insurance Coverage by Age in Aneth
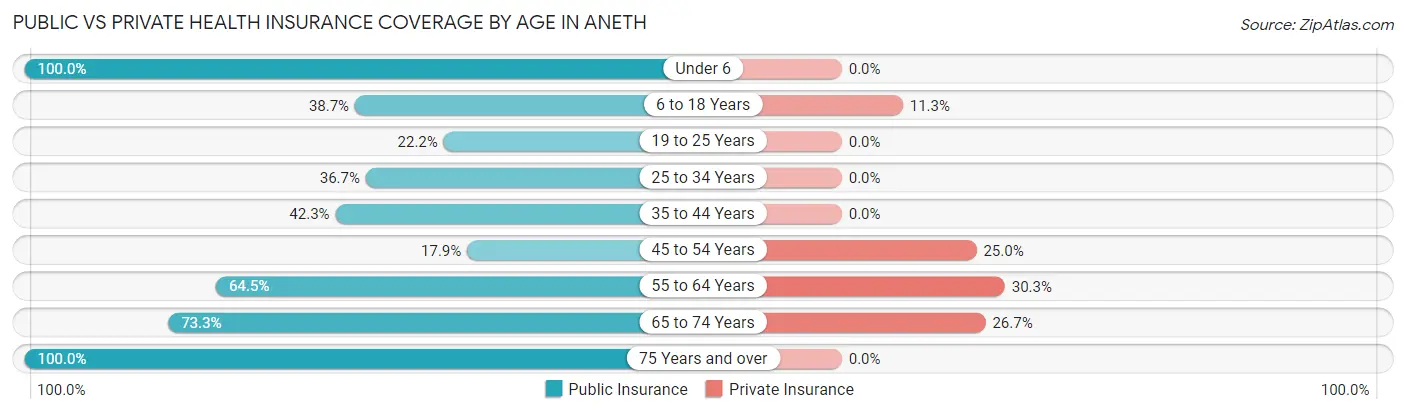
| Age Bracket | Public Insurance | Private Insurance |
| Under 6 | 20 (100.0%) | 0 (0.0%) |
| 6 to 18 Years | 41 (38.7%) | 12 (11.3%) |
| 19 to 25 Years | 6 (22.2%) | 0 (0.0%) |
| 25 to 34 Years | 11 (36.7%) | 0 (0.0%) |
| 35 to 44 Years | 11 (42.3%) | 0 (0.0%) |
| 45 to 54 Years | 5 (17.9%) | 7 (25.0%) |
| 55 to 64 Years | 49 (64.5%) | 23 (30.3%) |
| 65 to 74 Years | 11 (73.3%) | 4 (26.7%) |
| 75 Years and over | 14 (100.0%) | 0 (0.0%) |
| Total | 168 (49.1%) | 46 (13.5%) |
Disability Status by Sex by Age in Aneth
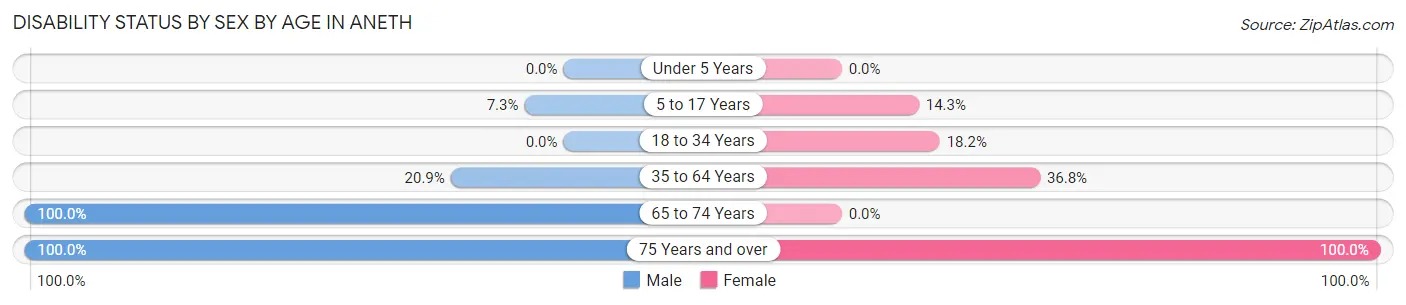
| Age Bracket | Male | Female |
| Under 5 Years | 0 (0.0%) | 0 (0.0%) |
| 5 to 17 Years | 5 (7.2%) | 7 (14.3%) |
| 18 to 34 Years | 0 (0.0%) | 6 (18.2%) |
| 35 to 64 Years | 9 (20.9%) | 32 (36.8%) |
| 65 to 74 Years | 10 (100.0%) | 0 (0.0%) |
| 75 Years and over | 9 (100.0%) | 5 (100.0%) |
Disability Class by Sex by Age in Aneth
Disability Class: Hearing Difficulty
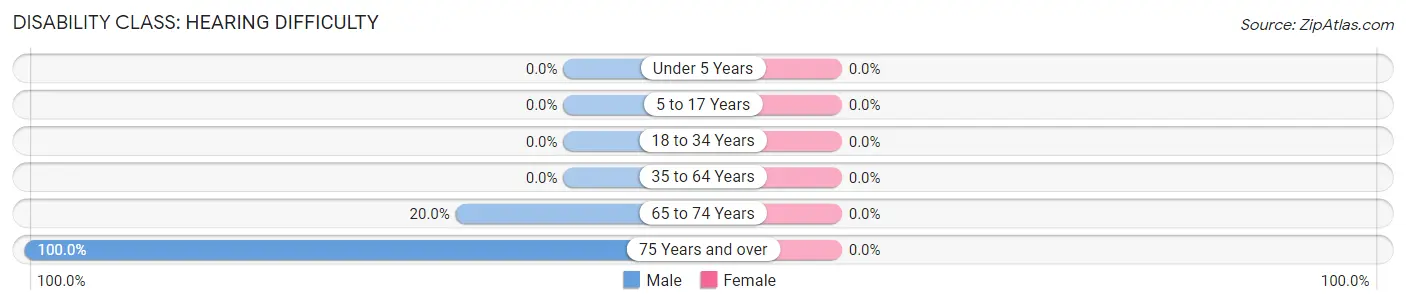
| Age Bracket | Male | Female |
| Under 5 Years | 0 (0.0%) | 0 (0.0%) |
| 5 to 17 Years | 0 (0.0%) | 0 (0.0%) |
| 18 to 34 Years | 0 (0.0%) | 0 (0.0%) |
| 35 to 64 Years | 0 (0.0%) | 0 (0.0%) |
| 65 to 74 Years | 2 (20.0%) | 0 (0.0%) |
| 75 Years and over | 9 (100.0%) | 0 (0.0%) |
Disability Class: Vision Difficulty
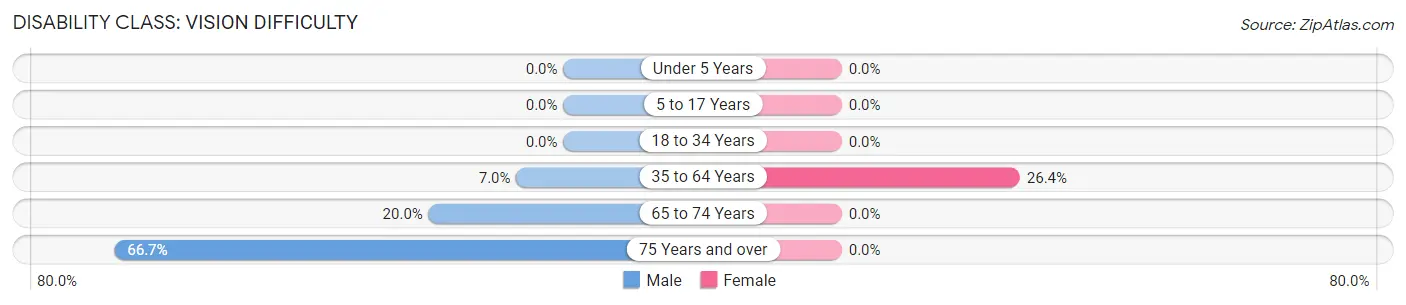
| Age Bracket | Male | Female |
| Under 5 Years | 0 (0.0%) | 0 (0.0%) |
| 5 to 17 Years | 0 (0.0%) | 0 (0.0%) |
| 18 to 34 Years | 0 (0.0%) | 0 (0.0%) |
| 35 to 64 Years | 3 (7.0%) | 23 (26.4%) |
| 65 to 74 Years | 2 (20.0%) | 0 (0.0%) |
| 75 Years and over | 6 (66.7%) | 0 (0.0%) |
Disability Class: Cognitive Difficulty
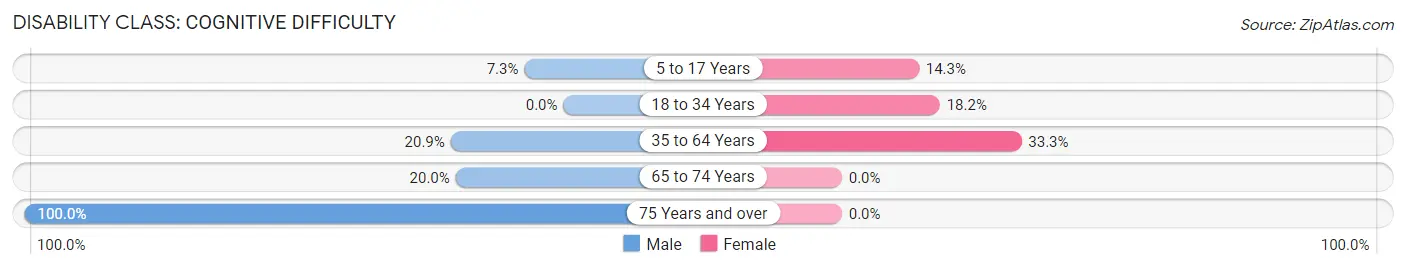
| Age Bracket | Male | Female |
| 5 to 17 Years | 5 (7.2%) | 7 (14.3%) |
| 18 to 34 Years | 0 (0.0%) | 6 (18.2%) |
| 35 to 64 Years | 9 (20.9%) | 29 (33.3%) |
| 65 to 74 Years | 2 (20.0%) | 0 (0.0%) |
| 75 Years and over | 9 (100.0%) | 0 (0.0%) |
Disability Class: Ambulatory Difficulty
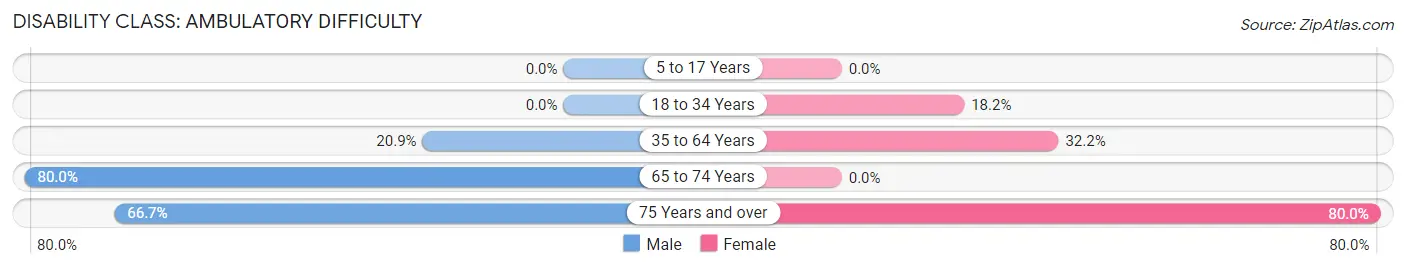
| Age Bracket | Male | Female |
| 5 to 17 Years | 0 (0.0%) | 0 (0.0%) |
| 18 to 34 Years | 0 (0.0%) | 6 (18.2%) |
| 35 to 64 Years | 9 (20.9%) | 28 (32.2%) |
| 65 to 74 Years | 8 (80.0%) | 0 (0.0%) |
| 75 Years and over | 6 (66.7%) | 4 (80.0%) |
Disability Class: Self-Care Difficulty
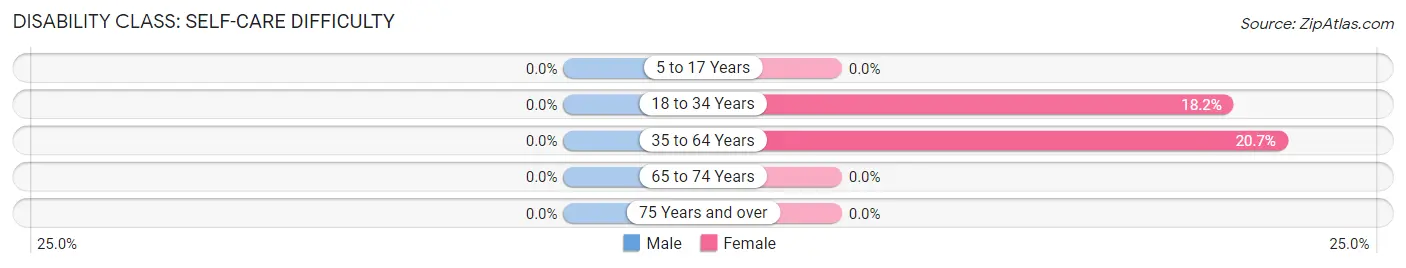
| Age Bracket | Male | Female |
| 5 to 17 Years | 0 (0.0%) | 0 (0.0%) |
| 18 to 34 Years | 0 (0.0%) | 6 (18.2%) |
| 35 to 64 Years | 0 (0.0%) | 18 (20.7%) |
| 65 to 74 Years | 0 (0.0%) | 0 (0.0%) |
| 75 Years and over | 0 (0.0%) | 0 (0.0%) |
Technology Access in Aneth
Computing Device Access in Aneth
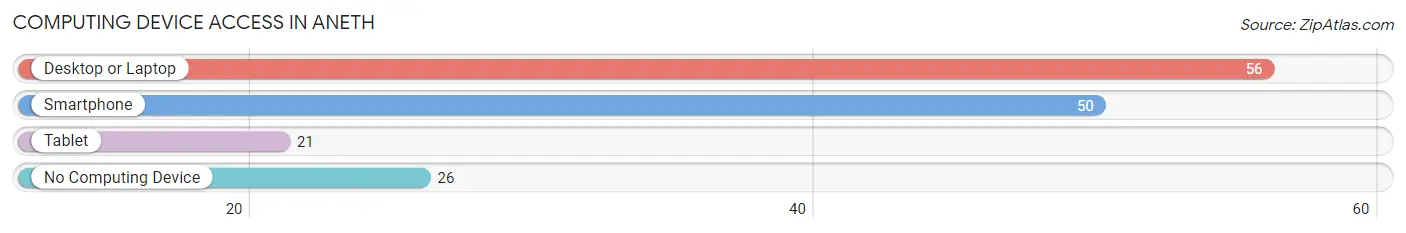
| Device Type | # Households | % Households |
| Desktop or Laptop | 56 | 57.7% |
| Smartphone | 50 | 51.5% |
| Tablet | 21 | 21.6% |
| No Computing Device | 26 | 26.8% |
| Total | 97 | 100.0% |
Internet Access in Aneth
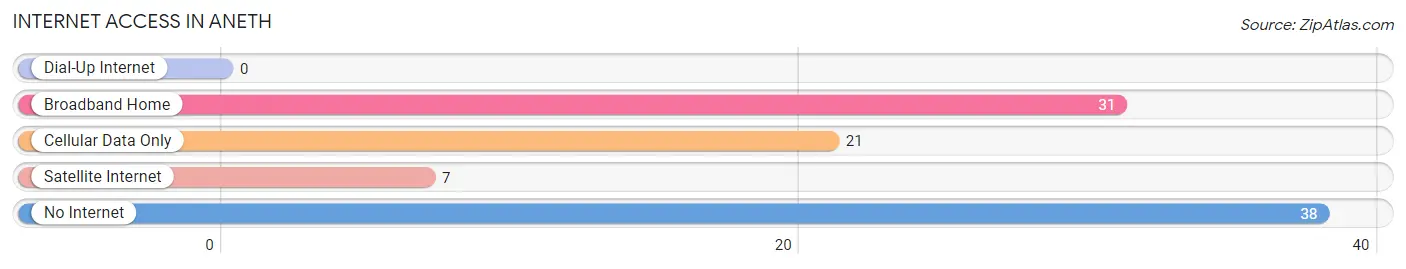
| Internet Type | # Households | % Households |
| Dial-Up Internet | 0 | 0.0% |
| Broadband Home | 31 | 32.0% |
| Cellular Data Only | 21 | 21.6% |
| Satellite Internet | 7 | 7.2% |
| No Internet | 38 | 39.2% |
| Total | 97 | 100.0% |
Aneth Summary
Aneth is a small unincorporated community located in the southeastern corner of San Juan County, Utah. It is situated on the banks of the San Juan River, approximately 20 miles south of the city of Blanding. Aneth is the home of the Navajo Nation's Aneth Chapter House, which serves as the local government for the area.
History
Aneth has a long and rich history. The area was first inhabited by the Anasazi people, who lived in the area from about 1000 BC to 1300 AD. The Anasazi were followed by the Navajo, who settled in the area in the late 1700s. The Navajo named the area Aneth, which means “place of the sun” in their language.
In the late 1800s, the area was settled by Mormon pioneers, who established a small farming community. The town was officially founded in 1906, and the first post office was established in 1907.
In the early 1900s, the area was home to a large number of uranium mines, which provided employment for many of the local residents. The uranium boom ended in the late 1950s, and the mines were eventually closed.
Geography
Aneth is located in the southeastern corner of San Juan County, Utah. It is situated on the banks of the San Juan River, approximately 20 miles south of the city of Blanding. The area is characterized by high desert terrain, with elevations ranging from 4,500 to 6,000 feet.
The climate in Aneth is semi-arid, with hot summers and cold winters. The average annual precipitation is approximately 8 inches, with most of it falling in the form of snow.
Economy
The economy of Aneth is largely based on agriculture and tourism. The area is home to a number of farms, which produce hay, alfalfa, and other crops. Tourism is also an important part of the local economy, with visitors coming to the area to enjoy the scenery and outdoor activities.
The Navajo Nation also has a significant presence in the area, with the Aneth Chapter House serving as the local government. The Navajo Nation operates a number of businesses in the area, including a casino, a gas station, and a convenience store.
Demographics
As of the 2010 census, the population of Aneth was 1,062. The racial makeup of the town was 94.3% Native American, 4.2% White, 0.2% Asian, and 0.3% from other races. The median household income was $25,000, and the median age was 33.
Aneth is served by the San Juan School District, which operates a K-12 school in the town. The town is also home to a branch of the Navajo Nation Library, which provides access to books, magazines, and other resources.
Common Questions
What is Per Capita Income in Aneth?
Per Capita income in Aneth is $13,248.
What is the Median Family Income in Aneth?
Median Family Income in Aneth is $44,583.
What is the Median Household income in Aneth?
Median Household Income in Aneth is $39,583.
What is Family Income Deficit in Aneth?
Family Income Deficit in Aneth is $15,623.
Families that are below poverty line in Aneth earn $15,623 less on average than the poverty threshold level.
What is Inequality or Gini Index in Aneth?
Inequality or Gini Index in Aneth is 0.44.
What is the Total Population of Aneth?
Total Population of Aneth is 342.
What is the Total Male Population of Aneth?
Total Male Population of Aneth is 155.
What is the Total Female Population of Aneth?
Total Female Population of Aneth is 187.
What is the Ratio of Males per 100 Females in Aneth?
There are 82.89 Males per 100 Females in Aneth.
What is the Ratio of Females per 100 Males in Aneth?
There are 120.65 Females per 100 Males in Aneth.
What is the Median Population Age in Aneth?
Median Population Age in Aneth is 30.5 Years.
What is the Average Family Size in Aneth
Average Family Size in Aneth is 3.9 People.
What is the Average Household Size in Aneth
Average Household Size in Aneth is 3.5 People.
How Large is the Labor Force in Aneth?
There are 111 People in the Labor Forcein in Aneth.
What is the Percentage of People in the Labor Force in Aneth?
46.6% of People are in the Labor Force in Aneth.
What is the Unemployment Rate in Aneth?
Unemployment Rate in Aneth is 23.4%.