Zip Codes with the Highest Percentage of Population Employed in Food Preparation & Serving in Ogden, UT
RELATED REPORTS & OPTIONS
Food Preparation & Serving
Ogden
Compare Zip Codes
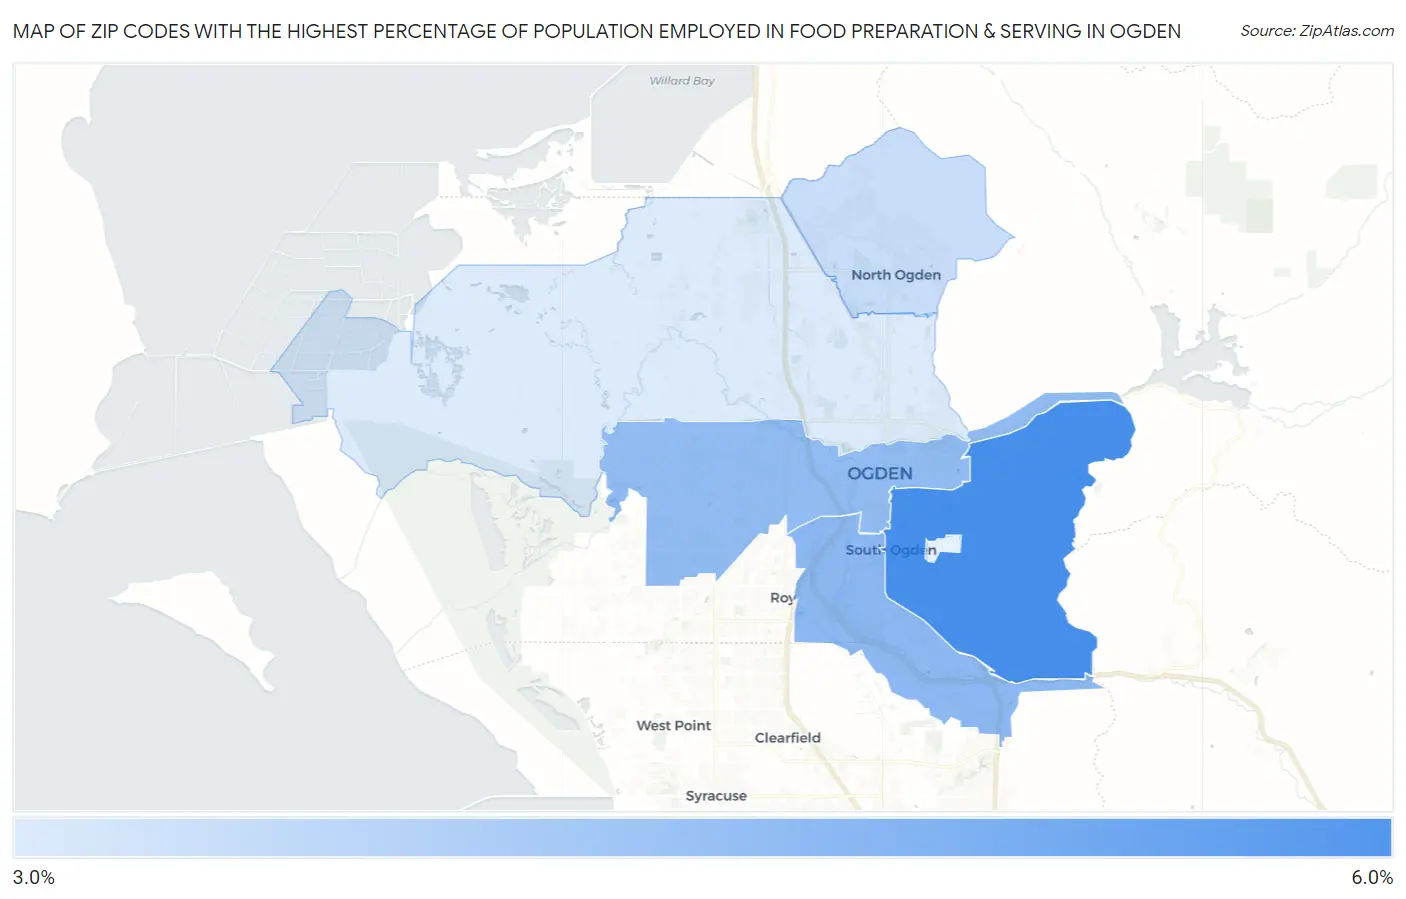
Map of Zip Codes with the Highest Percentage of Population Employed in Food Preparation & Serving in Ogden
3.9%
5.8%
Zip Codes with the Highest Percentage of Population Employed in Food Preparation & Serving in Ogden, UT
| Zip Code | % Employed | vs State | vs National | |
| 1. | 84403 | 5.8% | 4.5%(+1.25)#66 | 5.3%(+0.497)#10,085 |
| 2. | 84405 | 4.9% | 4.5%(+0.354)#93 | 5.3%(-0.395)#13,391 |
| 3. | 84401 | 4.8% | 4.5%(+0.291)#95 | 5.3%(-0.457)#13,643 |
| 4. | 84414 | 4.1% | 4.5%(-0.412)#119 | 5.3%(-1.16)#16,599 |
| 5. | 84404 | 3.9% | 4.5%(-0.673)#136 | 5.3%(-1.42)#17,697 |
1
Common Questions
What are the Top 5 Zip Codes with the Highest Percentage of Population Employed in Food Preparation & Serving in Ogden, UT?
Top 5 Zip Codes with the Highest Percentage of Population Employed in Food Preparation & Serving in Ogden, UT are:
What zip code has the Highest Percentage of Population Employed in Food Preparation & Serving in Ogden, UT?
84403 has the Highest Percentage of Population Employed in Food Preparation & Serving in Ogden, UT with 5.8%.
What is the Percentage of Population Employed in Food Preparation & Serving in Ogden, UT?
Percentage of Population Employed in Food Preparation & Serving in Ogden is 4.8%.
What is the Percentage of Population Employed in Food Preparation & Serving in Utah?
Percentage of Population Employed in Food Preparation & Serving in Utah is 4.5%.
What is the Percentage of Population Employed in Food Preparation & Serving in the United States?
Percentage of Population Employed in Food Preparation & Serving in the United States is 5.3%.