Blanding, UT Map & Demographics
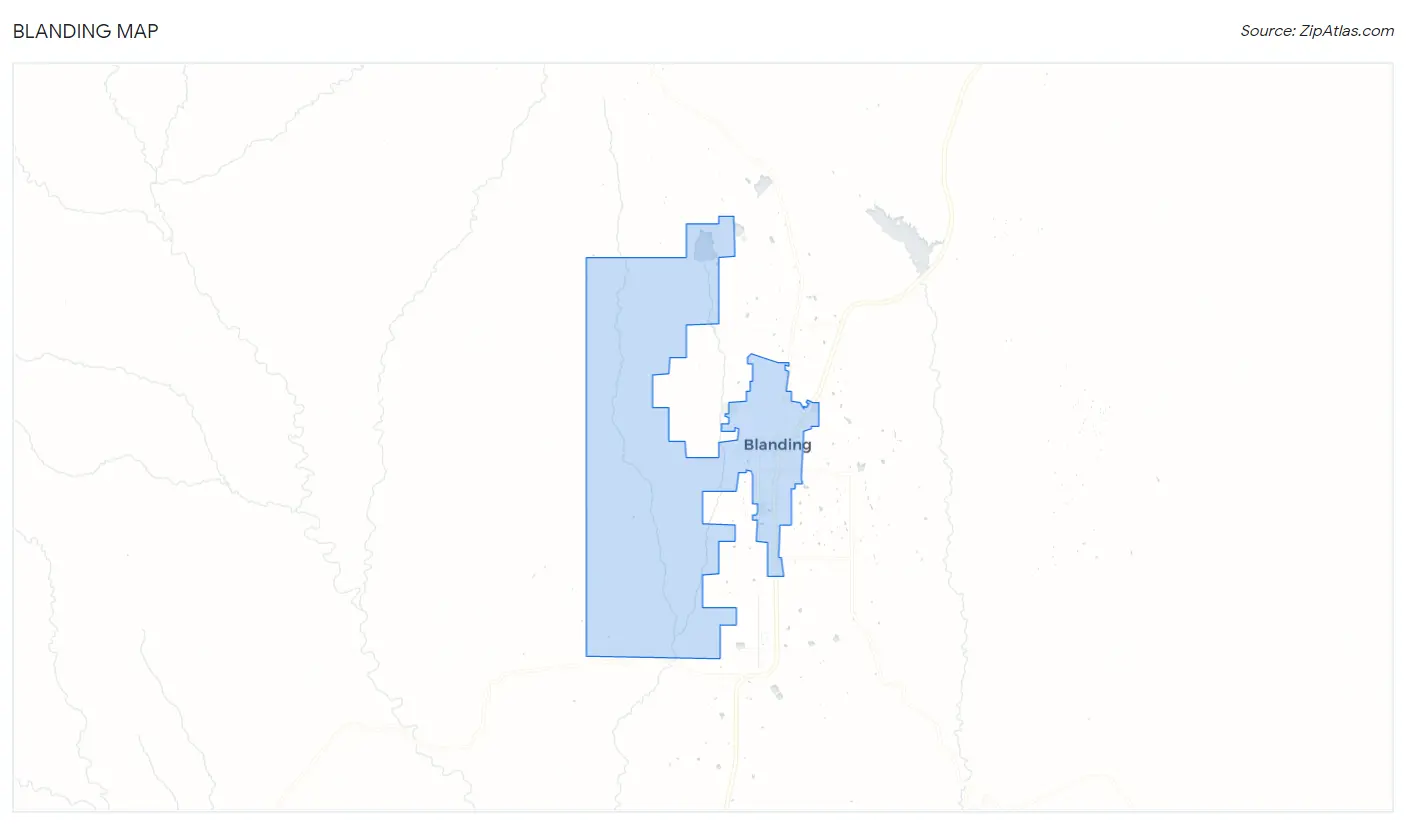
Blanding Map
Blanding Overview
$28,922
PER CAPITA INCOME
$71,250
AVG FAMILY INCOME
$61,833
AVG HOUSEHOLD INCOME
30.9%
WAGE / INCOME GAP [ % ]
69.1¢/ $1
WAGE / INCOME GAP [ $ ]
$15,013
FAMILY INCOME DEFICIT
0.54
INEQUALITY / GINI INDEX
3,345
TOTAL POPULATION
1,601
MALE POPULATION
1,744
FEMALE POPULATION
91.80
MALES / 100 FEMALES
108.93
FEMALES / 100 MALES
30.3
MEDIAN AGE
3.5
AVG FAMILY SIZE
2.9
AVG HOUSEHOLD SIZE
1,324
LABOR FORCE [ PEOPLE ]
57.0%
PERCENT IN LABOR FORCE
2.1%
UNEMPLOYMENT RATE
Blanding Zip Codes
Blanding Area Codes
Income in Blanding
Income Overview in Blanding
Per Capita Income in Blanding is $28,922, while median incomes of families and households are $71,250 and $61,833 respectively.
| Characteristic | Number | Measure |
| Per Capita Income | 3,345 | $28,922 |
| Median Family Income | 774 | $71,250 |
| Mean Family Income | 774 | $111,631 |
| Median Household Income | 1,092 | $61,833 |
| Mean Household Income | 1,092 | $89,545 |
| Income Deficit | 774 | $15,013 |
| Wage / Income Gap (%) | 3,345 | 30.87% |
| Wage / Income Gap ($) | 3,345 | 69.13¢ per $1 |
| Gini / Inequality Index | 3,345 | 0.54 |
Earnings by Sex in Blanding
Average Earnings in Blanding are $33,383, $42,870 for men and $29,638 for women, a difference of 30.9%.
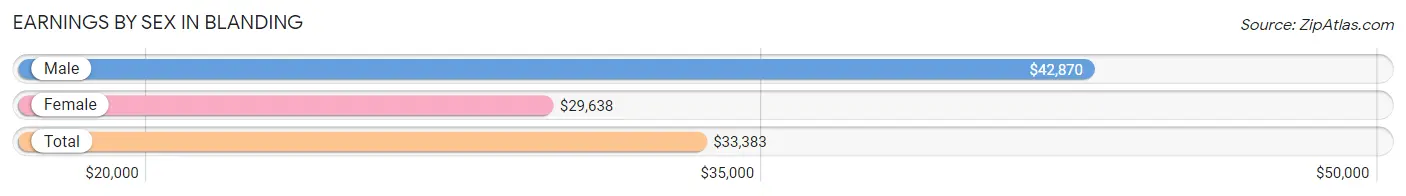
| Sex | Number | Average Earnings |
| Male | 736 (51.6%) | $42,870 |
| Female | 691 (48.4%) | $29,638 |
| Total | 1,427 (100.0%) | $33,383 |
Earnings by Sex by Income Bracket in Blanding
The most common earnings brackets in Blanding are $75,000 to $99,999 for men (100 | 13.6%) and $2,499 or less for women (90 | 13.0%).
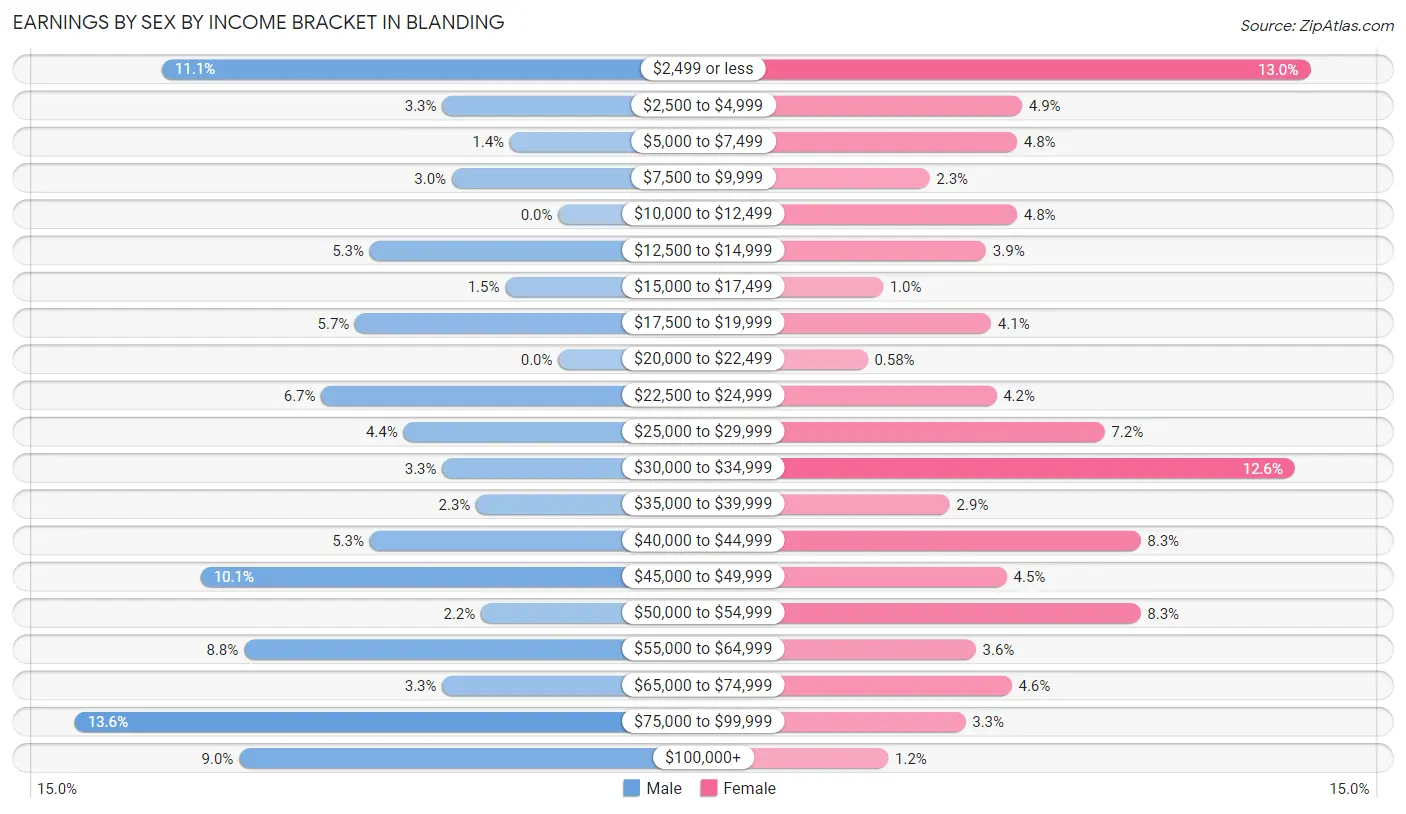
| Income | Male | Female |
| $2,499 or less | 82 (11.1%) | 90 (13.0%) |
| $2,500 to $4,999 | 24 (3.3%) | 34 (4.9%) |
| $5,000 to $7,499 | 10 (1.4%) | 33 (4.8%) |
| $7,500 to $9,999 | 22 (3.0%) | 16 (2.3%) |
| $10,000 to $12,499 | 0 (0.0%) | 33 (4.8%) |
| $12,500 to $14,999 | 39 (5.3%) | 27 (3.9%) |
| $15,000 to $17,499 | 11 (1.5%) | 7 (1.0%) |
| $17,500 to $19,999 | 42 (5.7%) | 28 (4.1%) |
| $20,000 to $22,499 | 0 (0.0%) | 4 (0.6%) |
| $22,500 to $24,999 | 49 (6.7%) | 29 (4.2%) |
| $25,000 to $29,999 | 32 (4.3%) | 50 (7.2%) |
| $30,000 to $34,999 | 24 (3.3%) | 87 (12.6%) |
| $35,000 to $39,999 | 17 (2.3%) | 20 (2.9%) |
| $40,000 to $44,999 | 39 (5.3%) | 57 (8.3%) |
| $45,000 to $49,999 | 74 (10.1%) | 31 (4.5%) |
| $50,000 to $54,999 | 16 (2.2%) | 57 (8.3%) |
| $55,000 to $64,999 | 65 (8.8%) | 25 (3.6%) |
| $65,000 to $74,999 | 24 (3.3%) | 32 (4.6%) |
| $75,000 to $99,999 | 100 (13.6%) | 23 (3.3%) |
| $100,000+ | 66 (9.0%) | 8 (1.2%) |
| Total | 736 (100.0%) | 691 (100.0%) |
Earnings by Sex by Educational Attainment in Blanding
Average earnings in Blanding are $46,324 for men and $34,962 for women, a difference of 24.5%. Men with an educational attainment of bachelor's degree enjoy the highest average annual earnings of $46,875, while those with college or associate's degree education earn the least with $46,593. Women with an educational attainment of bachelor's degree earn the most with the average annual earnings of $56,042, while those with high school diploma education have the smallest earnings of $26,458.
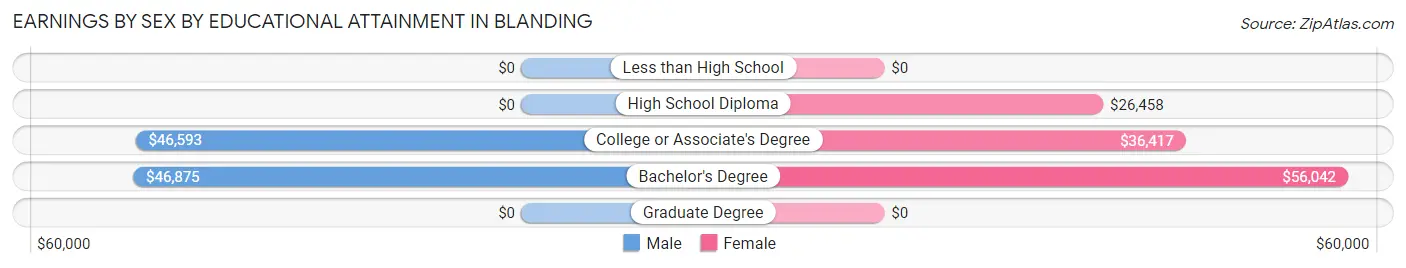
| Educational Attainment | Male Income | Female Income |
| Less than High School | - | - |
| High School Diploma | - | - |
| College or Associate's Degree | $46,593 | $36,417 |
| Bachelor's Degree | $46,875 | $56,042 |
| Graduate Degree | - | - |
| Total | $46,324 | $34,962 |
Family Income in Blanding
Family Income Brackets in Blanding
According to the Blanding family income data, there are 154 families falling into the $100,000 to $149,999 income range, which is the most common income bracket and makes up 19.9% of all families. Conversely, the $10,000 to $14,999 income bracket is the least frequent group with only 22 families (2.8%) belonging to this category.
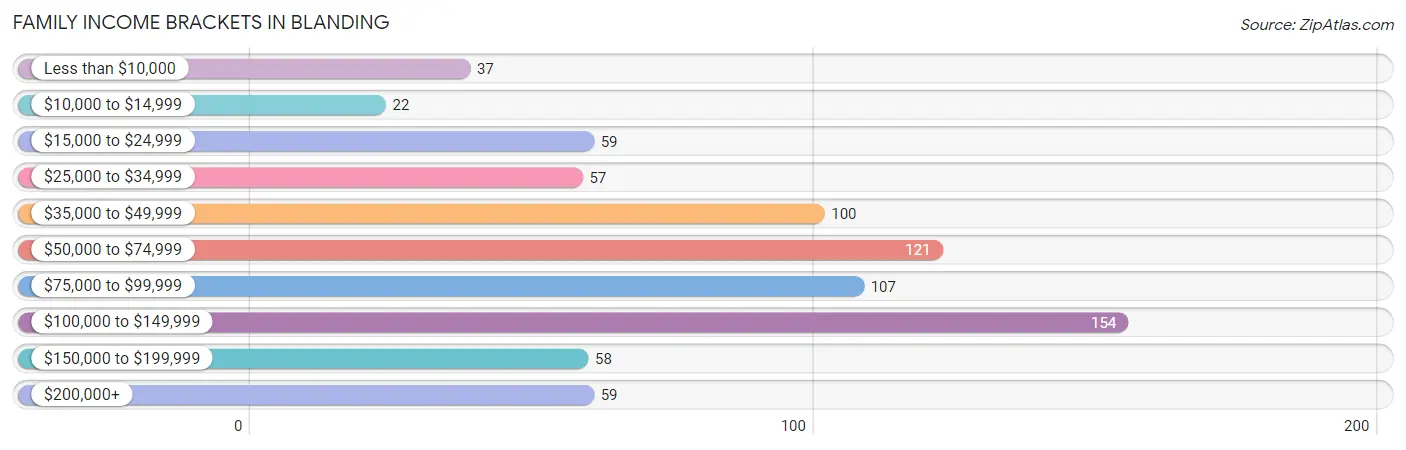
| Income Bracket | # Families | % Families |
| Less than $10,000 | 37 | 4.8% |
| $10,000 to $14,999 | 22 | 2.8% |
| $15,000 to $24,999 | 59 | 7.6% |
| $25,000 to $34,999 | 57 | 7.4% |
| $35,000 to $49,999 | 100 | 12.9% |
| $50,000 to $74,999 | 121 | 15.6% |
| $75,000 to $99,999 | 107 | 13.8% |
| $100,000 to $149,999 | 154 | 19.9% |
| $150,000 to $199,999 | 58 | 7.5% |
| $200,000+ | 59 | 7.6% |
Family Income by Famaliy Size in Blanding
6-person families (72 | 9.3%) account for the highest median family income in Blanding with $142,857 per family, while 2-person families (376 | 48.6%) have the highest median income of $32,812 per family member.
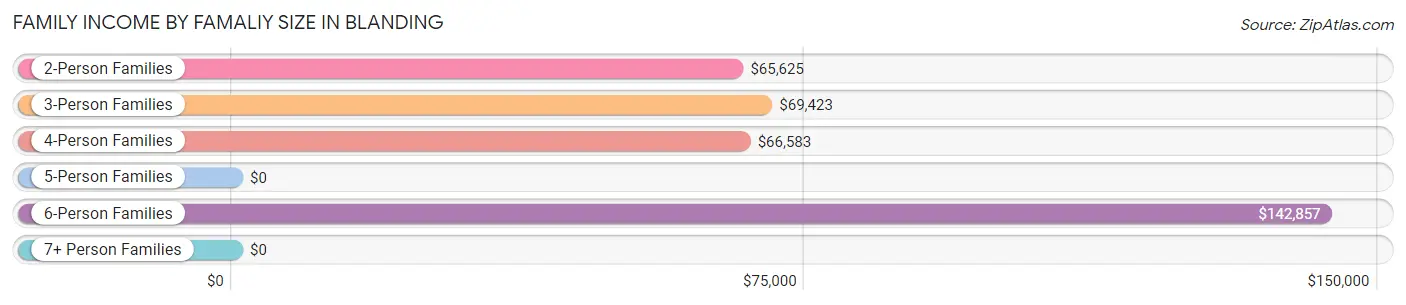
| Income Bracket | # Families | Median Income |
| 2-Person Families | 376 (48.6%) | $65,625 |
| 3-Person Families | 158 (20.4%) | $69,423 |
| 4-Person Families | 45 (5.8%) | $66,583 |
| 5-Person Families | 62 (8.0%) | $0 |
| 6-Person Families | 72 (9.3%) | $142,857 |
| 7+ Person Families | 61 (7.9%) | $0 |
| Total | 774 (100.0%) | $71,250 |
Family Income by Number of Earners in Blanding
The median family income in Blanding is $71,250, with families comprising 3+ earners (90) having the highest median family income of $143,929, while families with no earners (86) have the lowest median family income of $34,808, accounting for 11.6% and 11.1% of families, respectively.
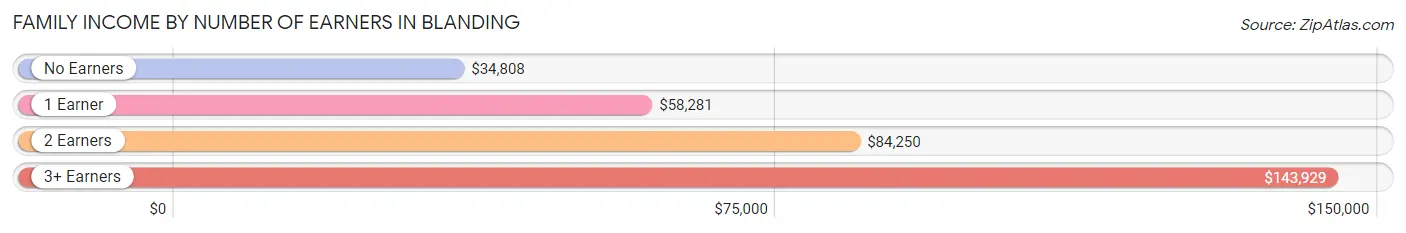
| Number of Earners | # Families | Median Income |
| No Earners | 86 (11.1%) | $34,808 |
| 1 Earner | 225 (29.1%) | $58,281 |
| 2 Earners | 373 (48.2%) | $84,250 |
| 3+ Earners | 90 (11.6%) | $143,929 |
| Total | 774 (100.0%) | $71,250 |
Household Income in Blanding
Household Income Brackets in Blanding
With 213 households falling in the category, the $50,000 to $74,999 income range is the most frequent in Blanding, accounting for 19.5% of all households. In contrast, only 58 households (5.3%) fall into the $150,000 to $199,999 income bracket, making it the least populous group.
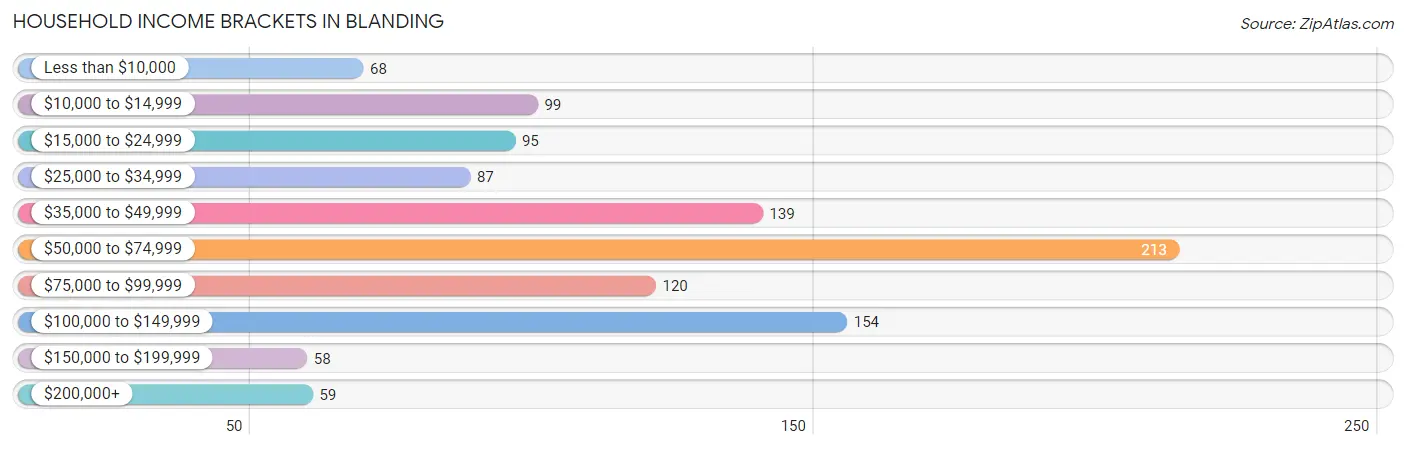
| Income Bracket | # Households | % Households |
| Less than $10,000 | 68 | 6.2% |
| $10,000 to $14,999 | 99 | 9.1% |
| $15,000 to $24,999 | 95 | 8.7% |
| $25,000 to $34,999 | 87 | 8.0% |
| $35,000 to $49,999 | 139 | 12.7% |
| $50,000 to $74,999 | 213 | 19.5% |
| $75,000 to $99,999 | 120 | 11.0% |
| $100,000 to $149,999 | 154 | 14.1% |
| $150,000 to $199,999 | 58 | 5.3% |
| $200,000+ | 59 | 5.4% |
Household Income by Householder Age in Blanding
The median household income in Blanding is $61,833, with the highest median household income of $95,781 found in the 45 to 64 years age bracket for the primary householder. A total of 352 households (32.2%) fall into this category. Meanwhile, the 15 to 24 years age bracket for the primary householder has the lowest median household income of $29,432, with 80 households (7.3%) in this group.
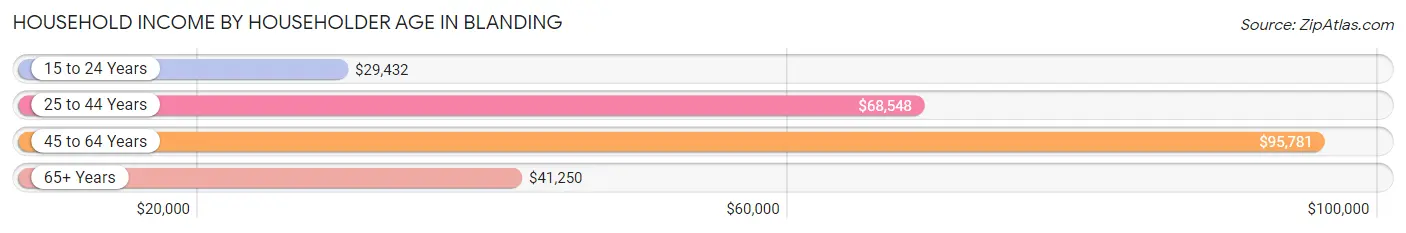
| Income Bracket | # Households | Median Income |
| 15 to 24 Years | 80 (7.3%) | $29,432 |
| 25 to 44 Years | 330 (30.2%) | $68,548 |
| 45 to 64 Years | 352 (32.2%) | $95,781 |
| 65+ Years | 330 (30.2%) | $41,250 |
| Total | 1,092 (100.0%) | $61,833 |
Poverty in Blanding
Income Below Poverty by Sex and Age in Blanding
With 18.1% poverty level for males and 20.1% for females among the residents of Blanding, 55 to 64 year old males and under 5 year old females are the most vulnerable to poverty, with 53 males (55.2%) and 45 females (45.5%) in their respective age groups living below the poverty level.
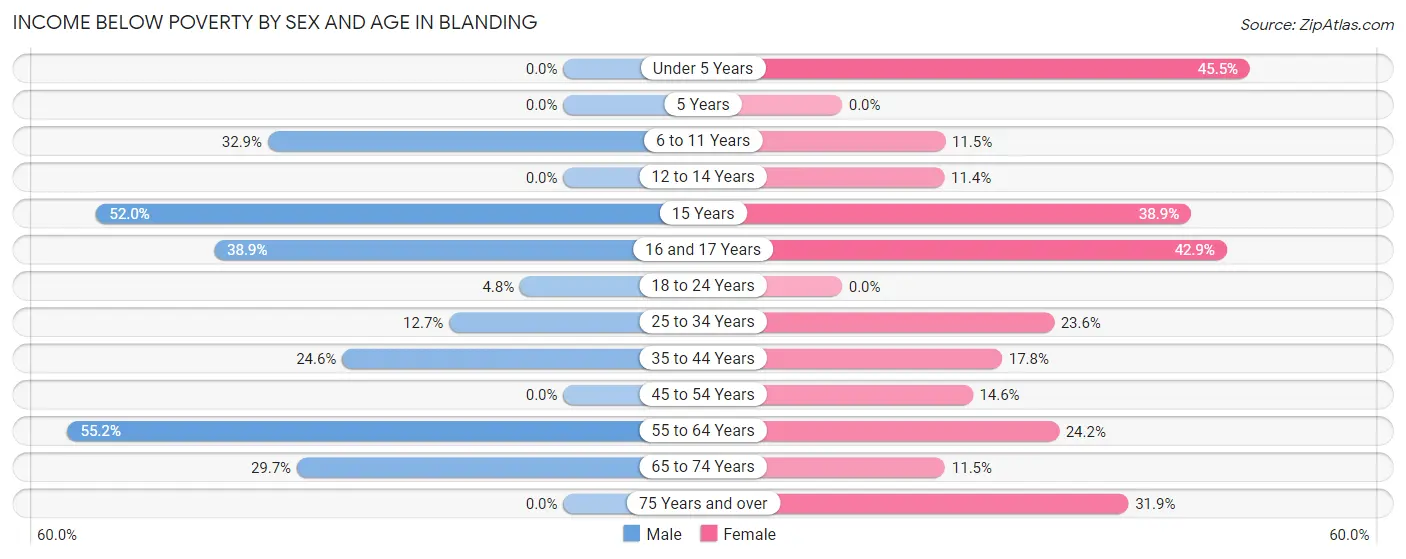
| Age Bracket | Male | Female |
| Under 5 Years | 0 (0.0%) | 45 (45.5%) |
| 5 Years | 0 (0.0%) | 0 (0.0%) |
| 6 to 11 Years | 78 (32.9%) | 27 (11.5%) |
| 12 to 14 Years | 0 (0.0%) | 9 (11.4%) |
| 15 Years | 39 (52.0%) | 14 (38.9%) |
| 16 and 17 Years | 14 (38.9%) | 39 (42.9%) |
| 18 to 24 Years | 4 (4.8%) | 0 (0.0%) |
| 25 to 34 Years | 29 (12.7%) | 42 (23.6%) |
| 35 to 44 Years | 33 (24.6%) | 31 (17.8%) |
| 45 to 54 Years | 0 (0.0%) | 24 (14.5%) |
| 55 to 64 Years | 53 (55.2%) | 36 (24.2%) |
| 65 to 74 Years | 27 (29.7%) | 14 (11.5%) |
| 75 Years and over | 0 (0.0%) | 52 (31.9%) |
| Total | 277 (18.1%) | 333 (20.1%) |
Income Above Poverty by Sex and Age in Blanding
According to the poverty statistics in Blanding, males aged under 5 years and females aged 5 years are the age groups that are most secure financially, with 100.0% of males and 100.0% of females in these age groups living above the poverty line.
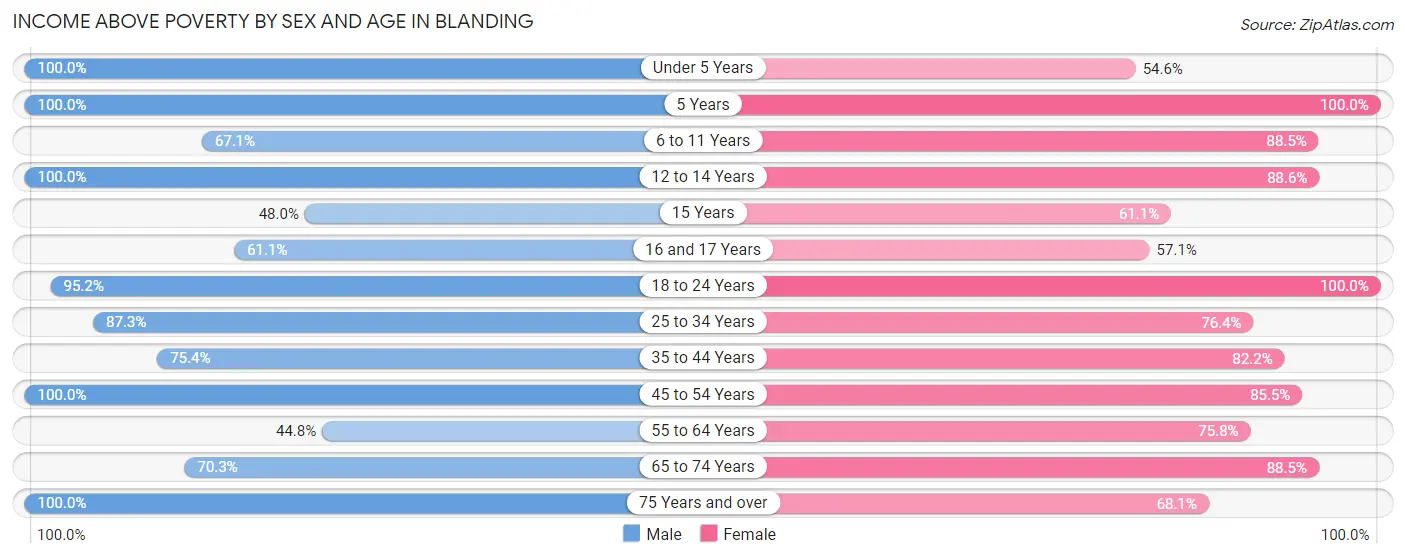
| Age Bracket | Male | Female |
| Under 5 Years | 134 (100.0%) | 54 (54.5%) |
| 5 Years | 38 (100.0%) | 6 (100.0%) |
| 6 to 11 Years | 159 (67.1%) | 208 (88.5%) |
| 12 to 14 Years | 83 (100.0%) | 70 (88.6%) |
| 15 Years | 36 (48.0%) | 22 (61.1%) |
| 16 and 17 Years | 22 (61.1%) | 52 (57.1%) |
| 18 to 24 Years | 79 (95.2%) | 164 (100.0%) |
| 25 to 34 Years | 199 (87.3%) | 136 (76.4%) |
| 35 to 44 Years | 101 (75.4%) | 143 (82.2%) |
| 45 to 54 Years | 187 (100.0%) | 141 (85.5%) |
| 55 to 64 Years | 43 (44.8%) | 113 (75.8%) |
| 65 to 74 Years | 64 (70.3%) | 108 (88.5%) |
| 75 Years and over | 108 (100.0%) | 111 (68.1%) |
| Total | 1,253 (81.9%) | 1,328 (79.9%) |
Income Below Poverty Among Married-Couple Families in Blanding
The poverty statistics for married-couple families in Blanding show that 6.7% or 40 of the total 597 families live below the poverty line. Families with 5 or more children have the highest poverty rate of 28.9%, comprising of 11 families. On the other hand, families with 1 or 2 children have the lowest poverty rate of 0.0%, which includes 0 families.
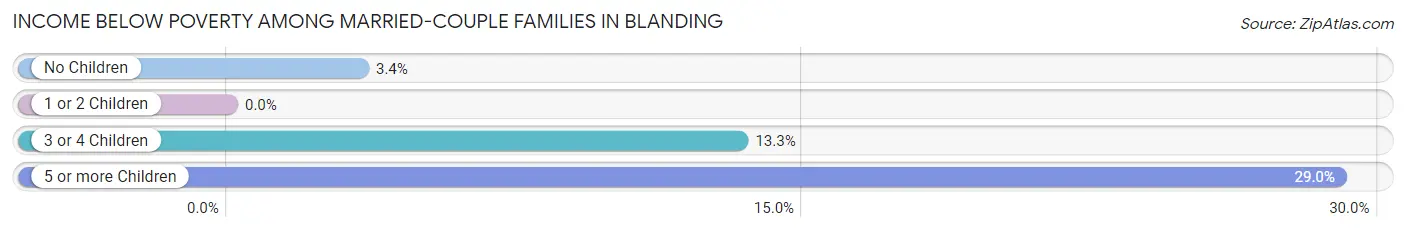
| Children | Above Poverty | Below Poverty |
| No Children | 311 (96.6%) | 11 (3.4%) |
| 1 or 2 Children | 102 (100.0%) | 0 (0.0%) |
| 3 or 4 Children | 117 (86.7%) | 18 (13.3%) |
| 5 or more Children | 27 (71.1%) | 11 (28.9%) |
| Total | 557 (93.3%) | 40 (6.7%) |
Income Below Poverty Among Single-Parent Households in Blanding
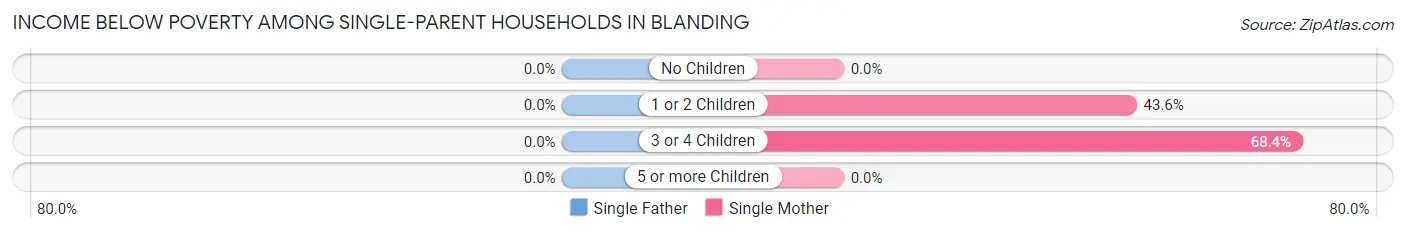
| Children | Single Father | Single Mother |
| No Children | 0 (0.0%) | 0 (0.0%) |
| 1 or 2 Children | 0 (0.0%) | 24 (43.6%) |
| 3 or 4 Children | 0 (0.0%) | 13 (68.4%) |
| 5 or more Children | 0 (0.0%) | 0 (0.0%) |
| Total | 0 (0.0%) | 37 (23.6%) |
Income Below Poverty Among Married-Couple vs Single-Parent Households in Blanding
The poverty data for Blanding shows that 40 of the married-couple family households (6.7%) and 37 of the single-parent households (20.9%) are living below the poverty level. Within the married-couple family households, those with 5 or more children have the highest poverty rate, with 11 households (28.9%) falling below the poverty line. Among the single-parent households, those with 3 or 4 children have the highest poverty rate, with 13 household (68.4%) living below poverty.
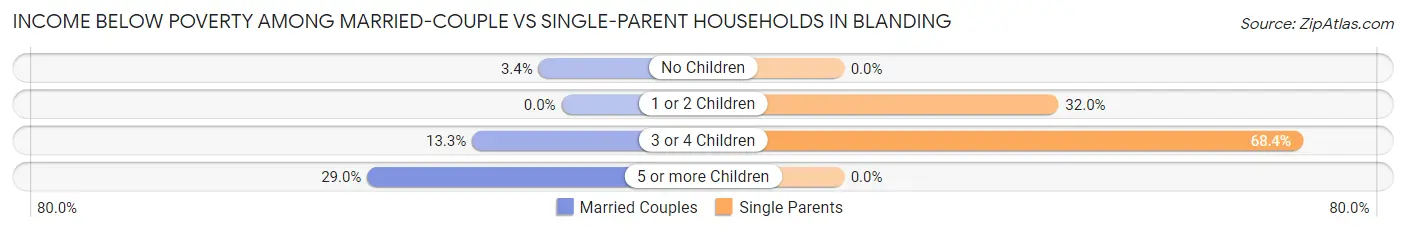
| Children | Married-Couple Families | Single-Parent Households |
| No Children | 11 (3.4%) | 0 (0.0%) |
| 1 or 2 Children | 0 (0.0%) | 24 (32.0%) |
| 3 or 4 Children | 18 (13.3%) | 13 (68.4%) |
| 5 or more Children | 11 (28.9%) | 0 (0.0%) |
| Total | 40 (6.7%) | 37 (20.9%) |
Race in Blanding
The most populous races in Blanding are White / Caucasian (2,076 | 62.1%), Native / Alaskan (711 | 21.3%), and Two or more Races (294 | 8.8%).
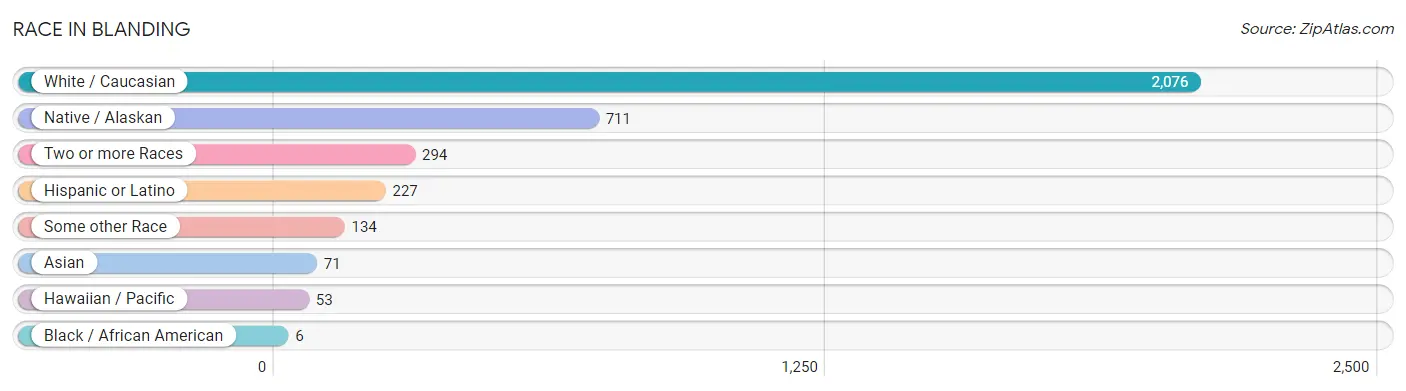
| Race | # Population | % Population |
| Asian | 71 | 2.1% |
| Black / African American | 6 | 0.2% |
| Hawaiian / Pacific | 53 | 1.6% |
| Hispanic or Latino | 227 | 6.8% |
| Native / Alaskan | 711 | 21.3% |
| White / Caucasian | 2,076 | 62.1% |
| Two or more Races | 294 | 8.8% |
| Some other Race | 134 | 4.0% |
| Total | 3,345 | 100.0% |
Ancestry in Blanding
The most populous ancestries reported in Blanding are English (850 | 25.4%), Navajo (811 | 24.2%), German (271 | 8.1%), Mexican (191 | 5.7%), and Irish (146 | 4.4%), together accounting for 67.8% of all Blanding residents.
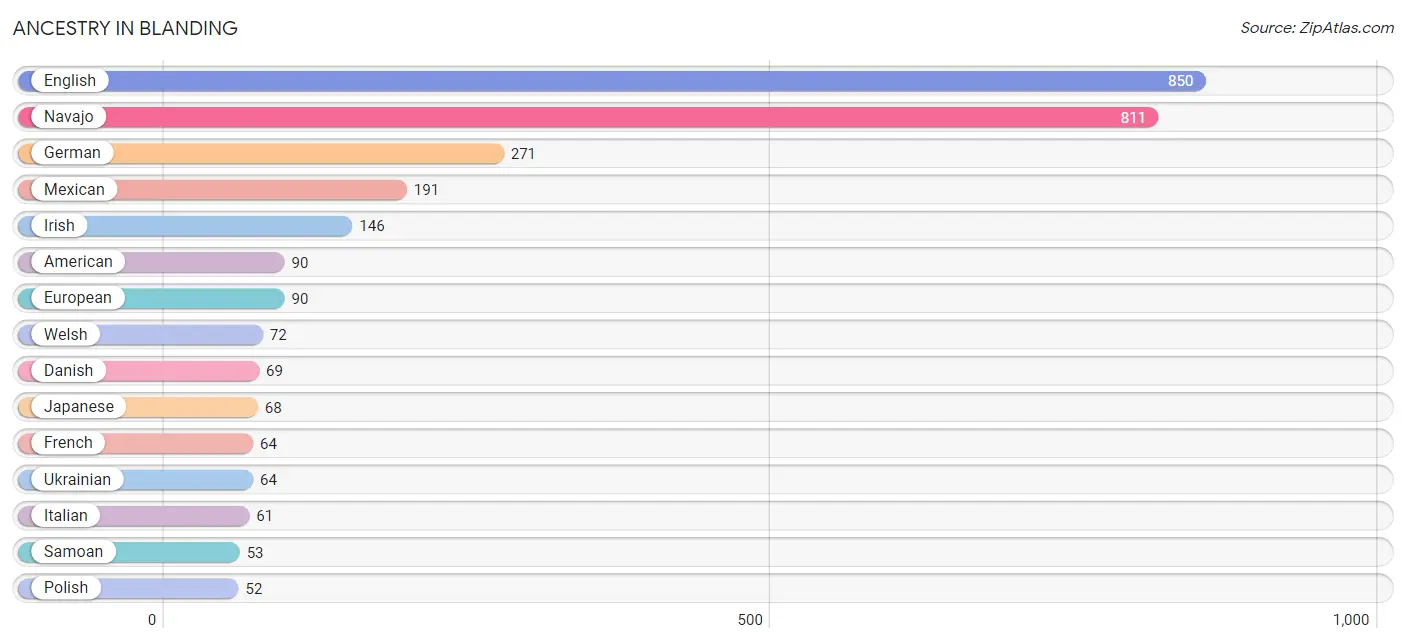
| Ancestry | # Population | % Population |
| American | 90 | 2.7% |
| Australian | 4 | 0.1% |
| British | 9 | 0.3% |
| Canadian | 5 | 0.2% |
| Cuban | 1 | 0.0% |
| Czech | 7 | 0.2% |
| Danish | 69 | 2.1% |
| Dutch | 35 | 1.1% |
| English | 850 | 25.4% |
| European | 90 | 2.7% |
| French | 64 | 1.9% |
| German | 271 | 8.1% |
| Inupiat | 4 | 0.1% |
| Irish | 146 | 4.4% |
| Italian | 61 | 1.8% |
| Japanese | 68 | 2.0% |
| Mexican | 191 | 5.7% |
| Navajo | 811 | 24.2% |
| Norwegian | 5 | 0.2% |
| Polish | 52 | 1.5% |
| Portuguese | 6 | 0.2% |
| Puerto Rican | 29 | 0.9% |
| Russian | 51 | 1.5% |
| Samoan | 53 | 1.6% |
| Scandinavian | 23 | 0.7% |
| Scotch-Irish | 43 | 1.3% |
| Scottish | 11 | 0.3% |
| South American | 1 | 0.0% |
| Swedish | 39 | 1.2% |
| Swiss | 49 | 1.5% |
| Thai | 3 | 0.1% |
| Tohono O'Odham | 7 | 0.2% |
| Tongan | 9 | 0.3% |
| Ukrainian | 64 | 1.9% |
| Uruguayan | 1 | 0.0% |
| Ute | 6 | 0.2% |
| Welsh | 72 | 2.1% | View All 37 Rows |
Immigrants in Blanding
The most numerous immigrant groups reported in Blanding came from Europe (80 | 2.4%), Eastern Europe (70 | 2.1%), Ukraine (59 | 1.8%), Oceania (53 | 1.6%), and Central America (42 | 1.3%), together accounting for 9.1% of all Blanding residents.
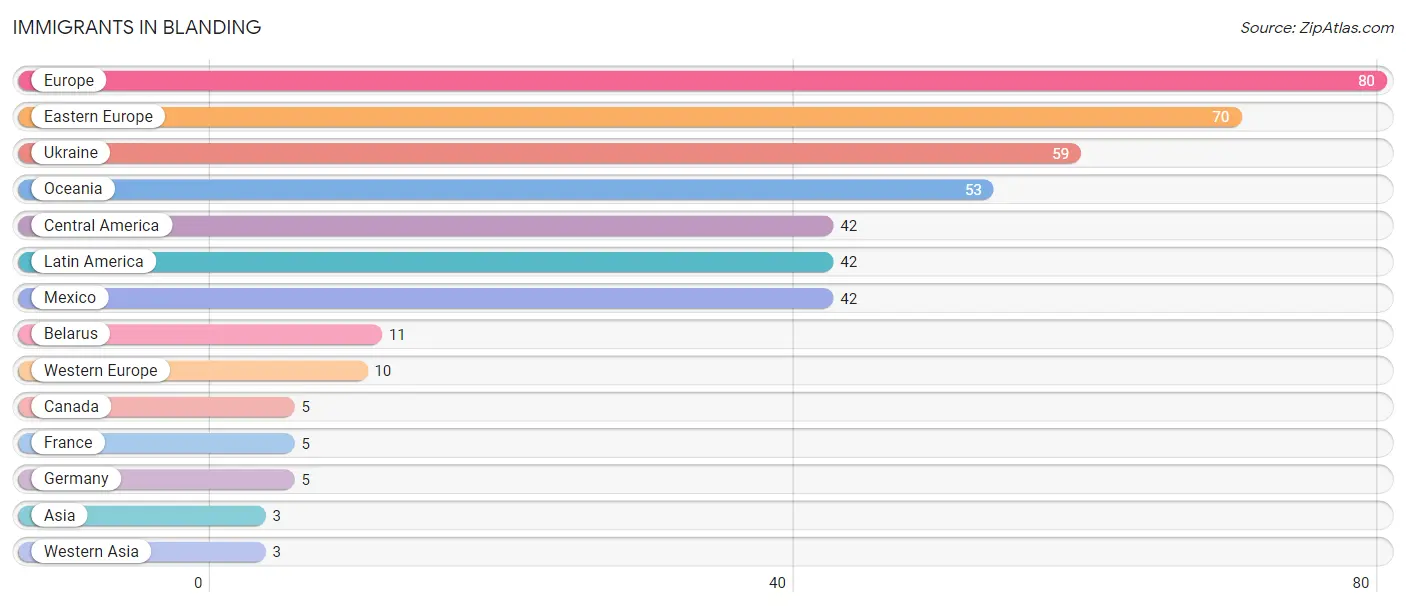
| Immigration Origin | # Population | % Population |
| Asia | 3 | 0.1% |
| Belarus | 11 | 0.3% |
| Canada | 5 | 0.2% |
| Central America | 42 | 1.3% |
| Eastern Europe | 70 | 2.1% |
| Europe | 80 | 2.4% |
| France | 5 | 0.2% |
| Germany | 5 | 0.2% |
| Latin America | 42 | 1.3% |
| Mexico | 42 | 1.3% |
| Oceania | 53 | 1.6% |
| Ukraine | 59 | 1.8% |
| Western Asia | 3 | 0.1% |
| Western Europe | 10 | 0.3% | View All 14 Rows |
Sex and Age in Blanding
Sex and Age in Blanding
The most populous age groups in Blanding are 5 to 9 Years (232 | 14.5%) for men and 15 to 19 Years (213 | 12.2%) for women.
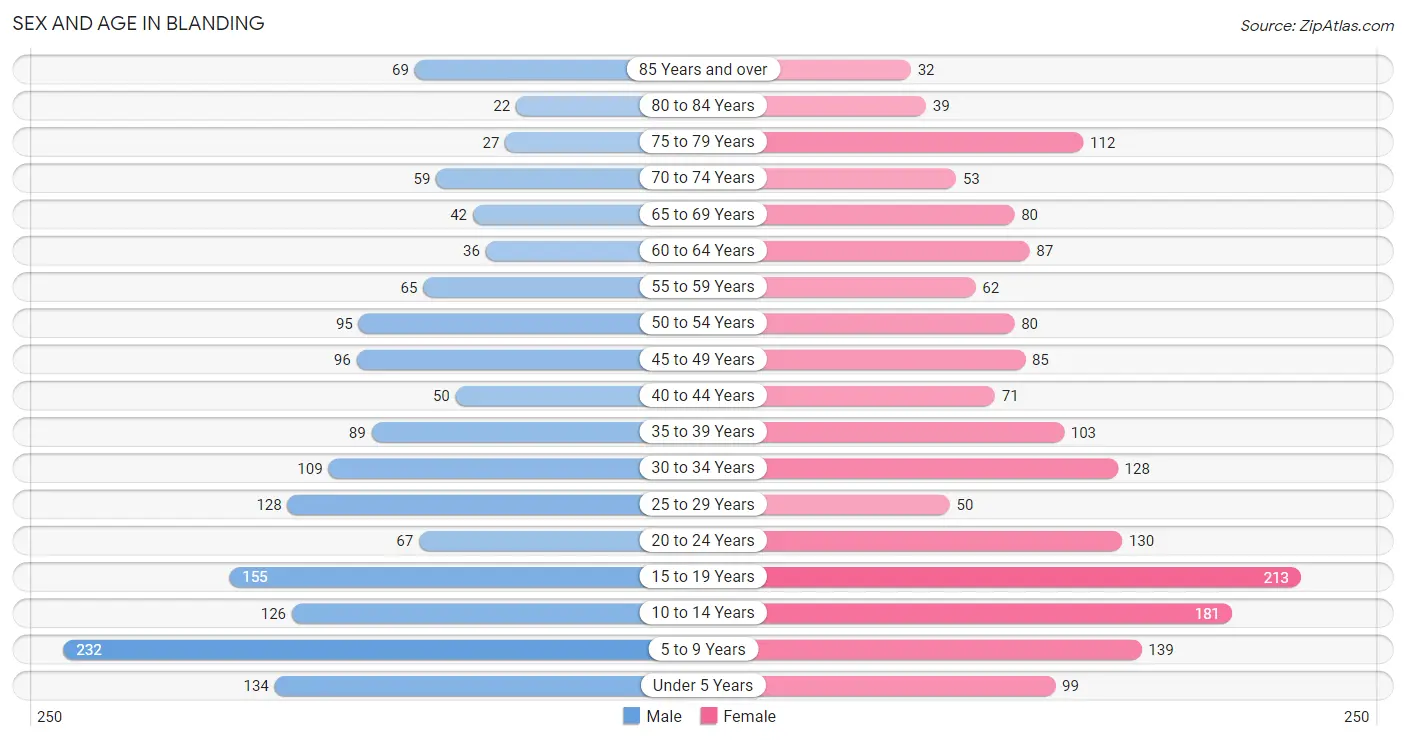
| Age Bracket | Male | Female |
| Under 5 Years | 134 (8.4%) | 99 (5.7%) |
| 5 to 9 Years | 232 (14.5%) | 139 (8.0%) |
| 10 to 14 Years | 126 (7.9%) | 181 (10.4%) |
| 15 to 19 Years | 155 (9.7%) | 213 (12.2%) |
| 20 to 24 Years | 67 (4.2%) | 130 (7.4%) |
| 25 to 29 Years | 128 (8.0%) | 50 (2.9%) |
| 30 to 34 Years | 109 (6.8%) | 128 (7.3%) |
| 35 to 39 Years | 89 (5.6%) | 103 (5.9%) |
| 40 to 44 Years | 50 (3.1%) | 71 (4.1%) |
| 45 to 49 Years | 96 (6.0%) | 85 (4.9%) |
| 50 to 54 Years | 95 (5.9%) | 80 (4.6%) |
| 55 to 59 Years | 65 (4.1%) | 62 (3.6%) |
| 60 to 64 Years | 36 (2.2%) | 87 (5.0%) |
| 65 to 69 Years | 42 (2.6%) | 80 (4.6%) |
| 70 to 74 Years | 59 (3.7%) | 53 (3.0%) |
| 75 to 79 Years | 27 (1.7%) | 112 (6.4%) |
| 80 to 84 Years | 22 (1.4%) | 39 (2.2%) |
| 85 Years and over | 69 (4.3%) | 32 (1.8%) |
| Total | 1,601 (100.0%) | 1,744 (100.0%) |
Families and Households in Blanding
Median Family Size in Blanding
The median family size in Blanding is 3.52 persons per family, with single female/mother families (157 | 20.3%) accounting for the largest median family size of 3.91 persons per family. On the other hand, single male/father families (20 | 2.6%) represent the smallest median family size with 2.85 persons per family.
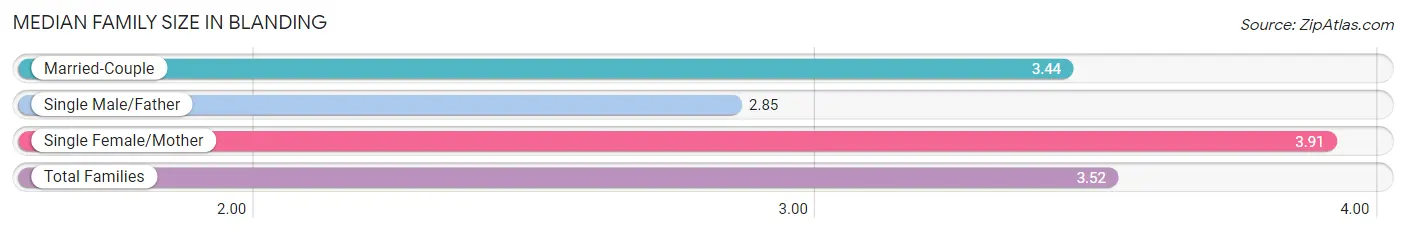
| Family Type | # Families | Family Size |
| Married-Couple | 597 (77.1%) | 3.44 |
| Single Male/Father | 20 (2.6%) | 2.85 |
| Single Female/Mother | 157 (20.3%) | 3.91 |
| Total Families | 774 (100.0%) | 3.52 |
Median Household Size in Blanding
The median household size in Blanding is 2.89 persons per household, with single female/mother households (157 | 14.4%) accounting for the largest median household size of 4.21 persons per household. non-family households (318 | 29.1%) represent the smallest median household size with 1.17 persons per household.
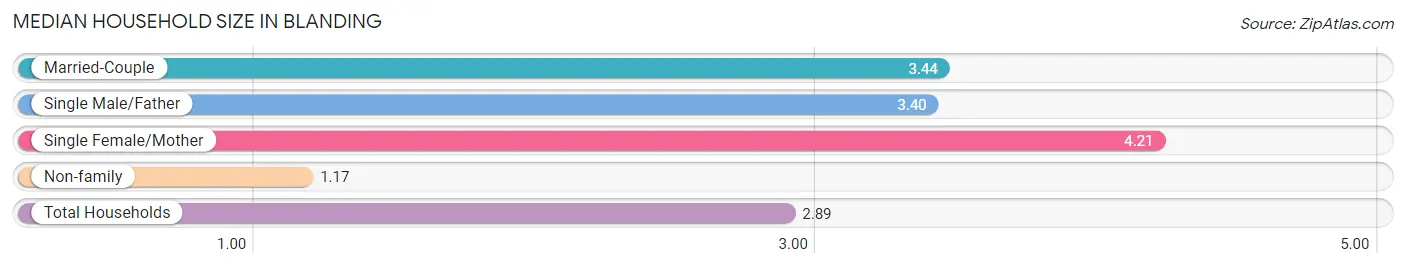
| Household Type | # Households | Household Size |
| Married-Couple | 597 (54.7%) | 3.44 |
| Single Male/Father | 20 (1.8%) | 3.40 |
| Single Female/Mother | 157 (14.4%) | 4.21 |
| Non-family | 318 (29.1%) | 1.17 |
| Total Households | 1,092 (100.0%) | 2.89 |
Household Size by Marriage Status in Blanding
Out of a total of 1,092 households in Blanding, 774 (70.9%) are family households, while 318 (29.1%) are nonfamily households. The most numerous type of family households are 2-person households, comprising 355, and the most common type of nonfamily households are 1-person households, comprising 285.
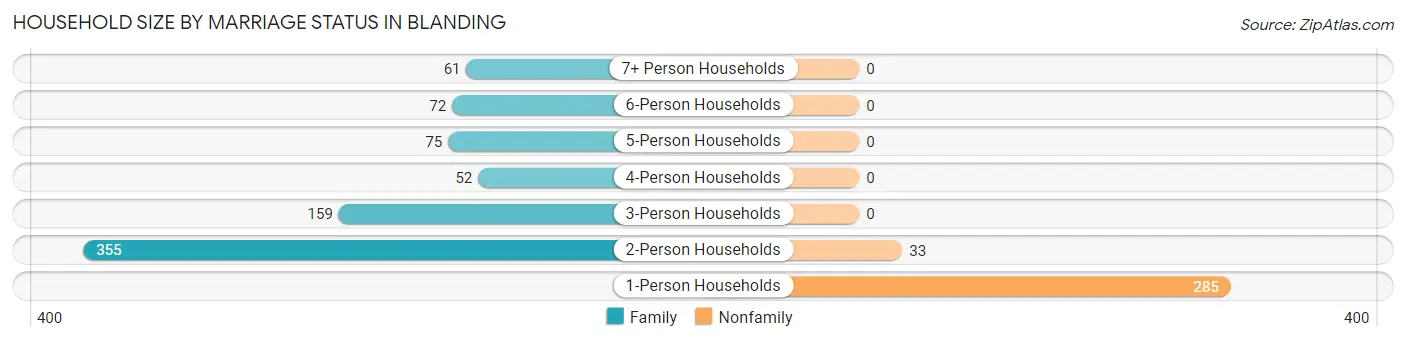
| Household Size | Family Households | Nonfamily Households |
| 1-Person Households | - | 285 (26.1%) |
| 2-Person Households | 355 (32.5%) | 33 (3.0%) |
| 3-Person Households | 159 (14.6%) | 0 (0.0%) |
| 4-Person Households | 52 (4.8%) | 0 (0.0%) |
| 5-Person Households | 75 (6.9%) | 0 (0.0%) |
| 6-Person Households | 72 (6.6%) | 0 (0.0%) |
| 7+ Person Households | 61 (5.6%) | 0 (0.0%) |
| Total | 774 (70.9%) | 318 (29.1%) |
Female Fertility in Blanding
Fertility by Age in Blanding
Average fertility rate in Blanding is 37.0 births per 1,000 women. Women in the age bracket of 15 to 19 years have the highest fertility rate with 99.0 births per 1,000 women. Women in the age bracket of 15 to 19 years acount for 72.4% of all women with births.
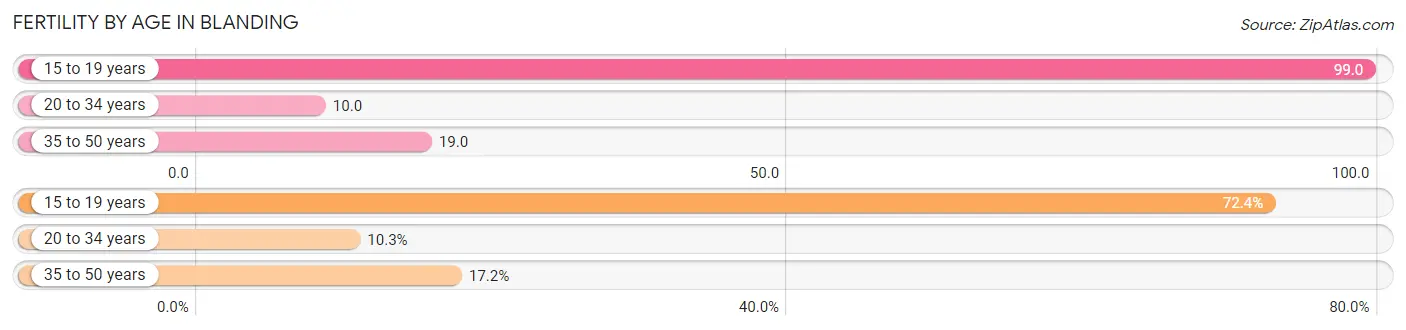
| Age Bracket | Women with Births | Births / 1,000 Women |
| 15 to 19 years | 21 (72.4%) | 99.0 |
| 20 to 34 years | 3 (10.3%) | 10.0 |
| 35 to 50 years | 5 (17.2%) | 19.0 |
| Total | 29 (100.0%) | 37.0 |
Fertility by Age by Marriage Status in Blanding
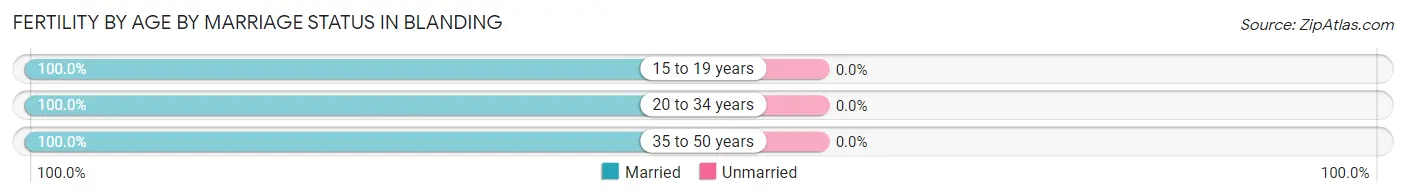
| Age Bracket | Married | Unmarried |
| 15 to 19 years | 21 (100.0%) | 0 (0.0%) |
| 20 to 34 years | 3 (100.0%) | 0 (0.0%) |
| 35 to 50 years | 5 (100.0%) | 0 (0.0%) |
| Total | 29 (100.0%) | 0 (0.0%) |
Fertility by Education in Blanding
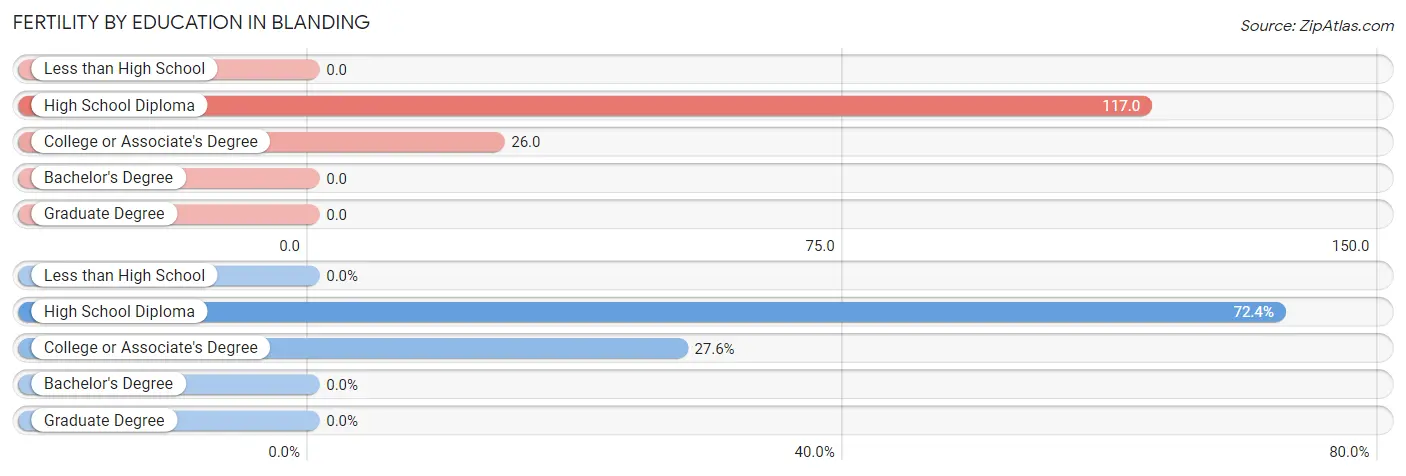
| Educational Attainment | Women with Births | Births / 1,000 Women |
| Less than High School | 0 (0.0%) | 0.0 |
| High School Diploma | 21 (72.4%) | 117.0 |
| College or Associate's Degree | 8 (27.6%) | 26.0 |
| Bachelor's Degree | 0 (0.0%) | 0.0 |
| Graduate Degree | 0 (0.0%) | 0.0 |
| Total | 29 (100.0%) | 37.0 |
Fertility by Education by Marriage Status in Blanding
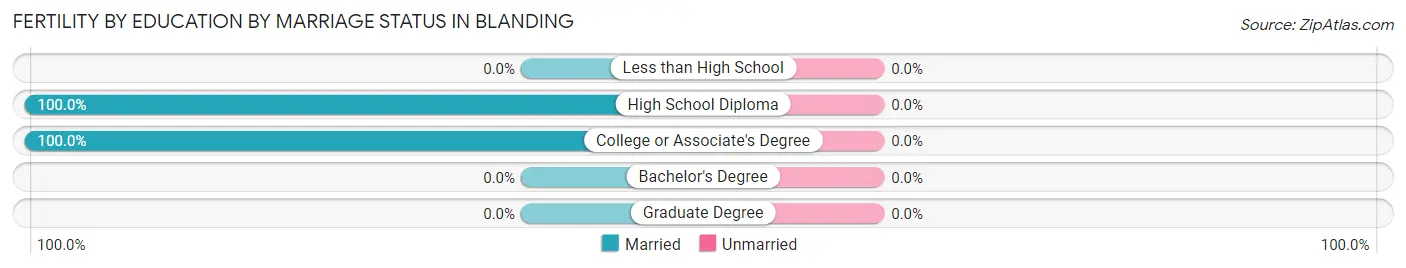
| Educational Attainment | Married | Unmarried |
| Less than High School | 0 (0.0%) | 0 (0.0%) |
| High School Diploma | 21 (100.0%) | 0 (0.0%) |
| College or Associate's Degree | 8 (100.0%) | 0 (0.0%) |
| Bachelor's Degree | 0 (0.0%) | 0 (0.0%) |
| Graduate Degree | 0 (0.0%) | 0 (0.0%) |
| Total | 29 (100.0%) | 0 (0.0%) |
Employment Characteristics in Blanding
Employment by Class of Employer in Blanding
Among the 1,263 employed individuals in Blanding, private company employees (641 | 50.7%), state government employees (197 | 15.6%), and local government employees (156 | 12.3%) make up the most common classes of employment.
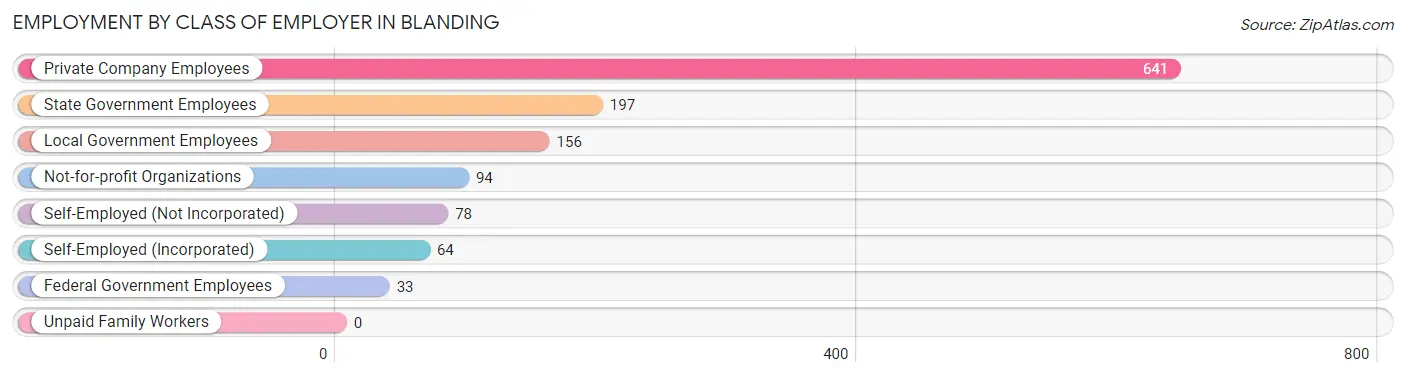
| Employer Class | # Employees | % Employees |
| Private Company Employees | 641 | 50.7% |
| Self-Employed (Incorporated) | 64 | 5.1% |
| Self-Employed (Not Incorporated) | 78 | 6.2% |
| Not-for-profit Organizations | 94 | 7.4% |
| Local Government Employees | 156 | 12.3% |
| State Government Employees | 197 | 15.6% |
| Federal Government Employees | 33 | 2.6% |
| Unpaid Family Workers | 0 | 0.0% |
| Total | 1,263 | 100.0% |
Employment Status by Age in Blanding
According to the labor force statistics for Blanding, out of the total population over 16 years of age (2,323), 57.0% or 1,324 individuals are in the labor force, with 2.1% or 28 of them unemployed. The age group with the highest labor force participation rate is 20 to 24 years, with 88.3% or 174 individuals in the labor force. Within the labor force, the 16 to 19 years age range has the highest percentage of unemployed individuals, with 5.8% or 5 of them being unemployed.
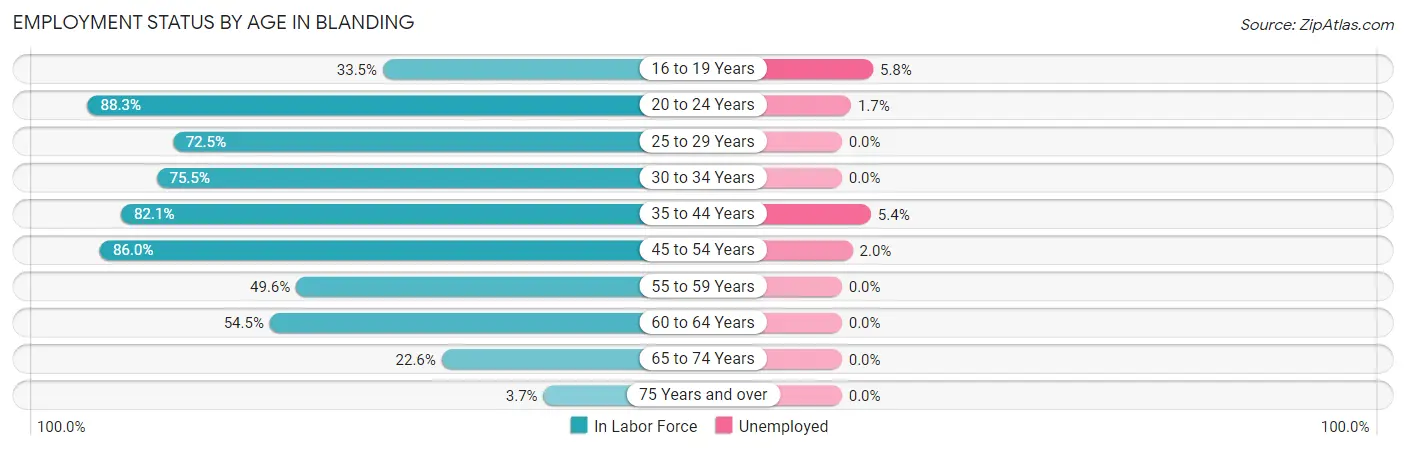
| Age Bracket | In Labor Force | Unemployed |
| 16 to 19 Years | 86 (33.5%) | 5 (5.8%) |
| 20 to 24 Years | 174 (88.3%) | 3 (1.7%) |
| 25 to 29 Years | 129 (72.5%) | 0 (0.0%) |
| 30 to 34 Years | 179 (75.5%) | 0 (0.0%) |
| 35 to 44 Years | 257 (82.1%) | 14 (5.4%) |
| 45 to 54 Years | 306 (86.0%) | 6 (2.0%) |
| 55 to 59 Years | 63 (49.6%) | 0 (0.0%) |
| 60 to 64 Years | 67 (54.5%) | 0 (0.0%) |
| 65 to 74 Years | 53 (22.6%) | 0 (0.0%) |
| 75 Years and over | 11 (3.7%) | 0 (0.0%) |
| Total | 1,324 (57.0%) | 28 (2.1%) |
Employment Status by Educational Attainment in Blanding
According to labor force statistics for Blanding, 75.0% of individuals (1,000) out of the total population between 25 and 64 years of age (1,334) are in the labor force, with 2.0% or 20 of them being unemployed. The group with the highest labor force participation rate are those with the educational attainment of bachelor's degree or higher, with 82.4% or 281 individuals in the labor force. Within the labor force, individuals with high school diploma education have the highest percentage of unemployment, with 3.4% or 8 of them being unemployed.
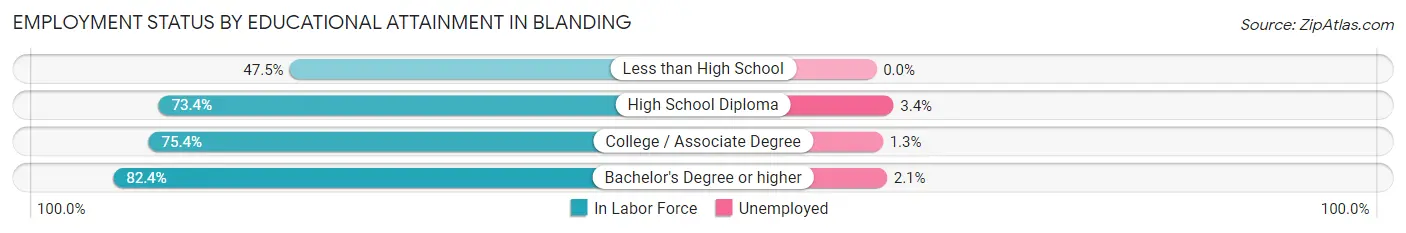
| Educational Attainment | In Labor Force | Unemployed |
| Less than High School | 38 (47.5%) | 0 (0.0%) |
| High School Diploma | 237 (73.4%) | 11 (3.4%) |
| College / Associate Degree | 445 (75.4%) | 8 (1.3%) |
| Bachelor's Degree or higher | 281 (82.4%) | 7 (2.1%) |
| Total | 1,000 (75.0%) | 27 (2.0%) |
Employment Occupations by Sex in Blanding
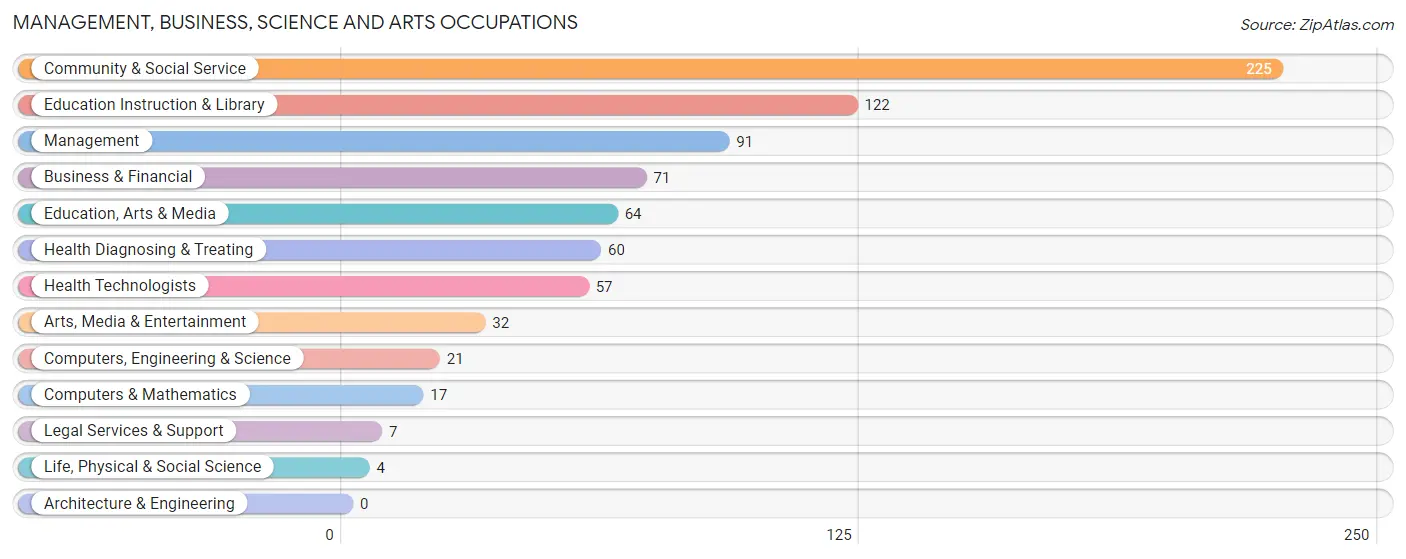
Management, Business, Science and Arts Occupations
The most common Management, Business, Science and Arts occupations in Blanding are Community & Social Service (225 | 17.3%), Education Instruction & Library (122 | 9.4%), Management (91 | 7.0%), Business & Financial (71 | 5.5%), and Education, Arts & Media (64 | 4.9%).
Management, Business, Science and Arts Occupations by Sex
Within the Management, Business, Science and Arts occupations in Blanding, the most male-oriented occupations are Business & Financial (100.0%), Computers & Mathematics (100.0%), and Arts, Media & Entertainment (90.6%), while the most female-oriented occupations are Life, Physical & Social Science (100.0%), Legal Services & Support (100.0%), and Education Instruction & Library (76.2%).
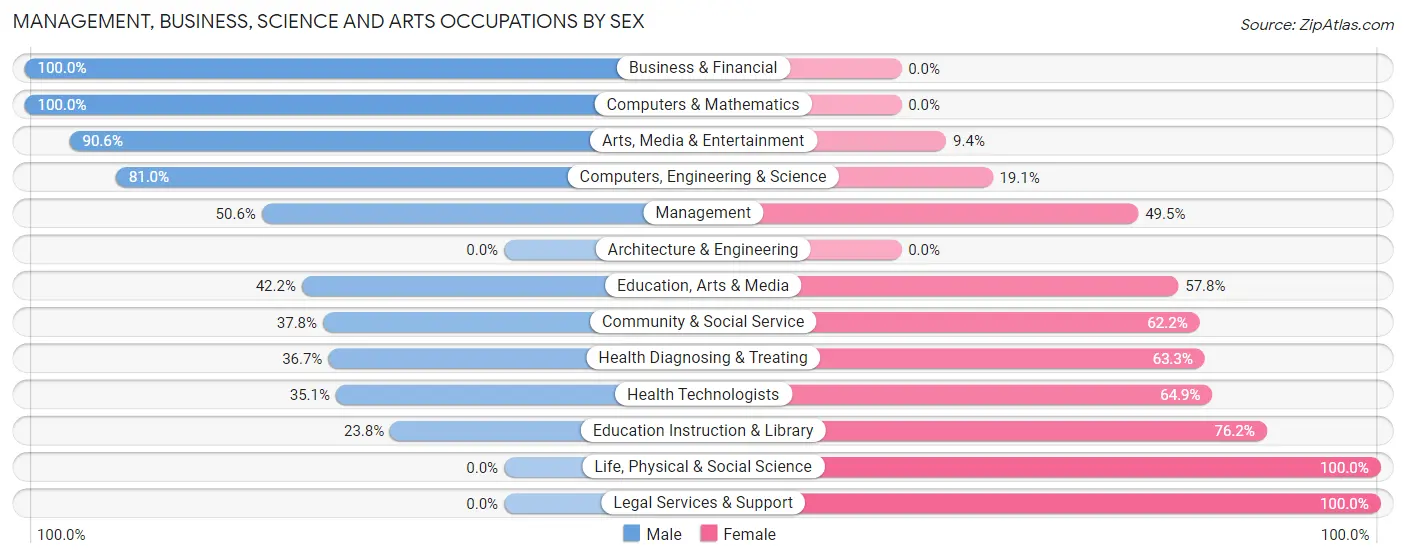
| Occupation | Male | Female |
| Management | 46 (50.5%) | 45 (49.4%) |
| Business & Financial | 71 (100.0%) | 0 (0.0%) |
| Computers, Engineering & Science | 17 (80.9%) | 4 (19.1%) |
| Computers & Mathematics | 17 (100.0%) | 0 (0.0%) |
| Architecture & Engineering | 0 (0.0%) | 0 (0.0%) |
| Life, Physical & Social Science | 0 (0.0%) | 4 (100.0%) |
| Community & Social Service | 85 (37.8%) | 140 (62.2%) |
| Education, Arts & Media | 27 (42.2%) | 37 (57.8%) |
| Legal Services & Support | 0 (0.0%) | 7 (100.0%) |
| Education Instruction & Library | 29 (23.8%) | 93 (76.2%) |
| Arts, Media & Entertainment | 29 (90.6%) | 3 (9.4%) |
| Health Diagnosing & Treating | 22 (36.7%) | 38 (63.3%) |
| Health Technologists | 20 (35.1%) | 37 (64.9%) |
| Total (Category) | 241 (51.5%) | 227 (48.5%) |
| Total (Overall) | 683 (52.7%) | 614 (47.3%) |
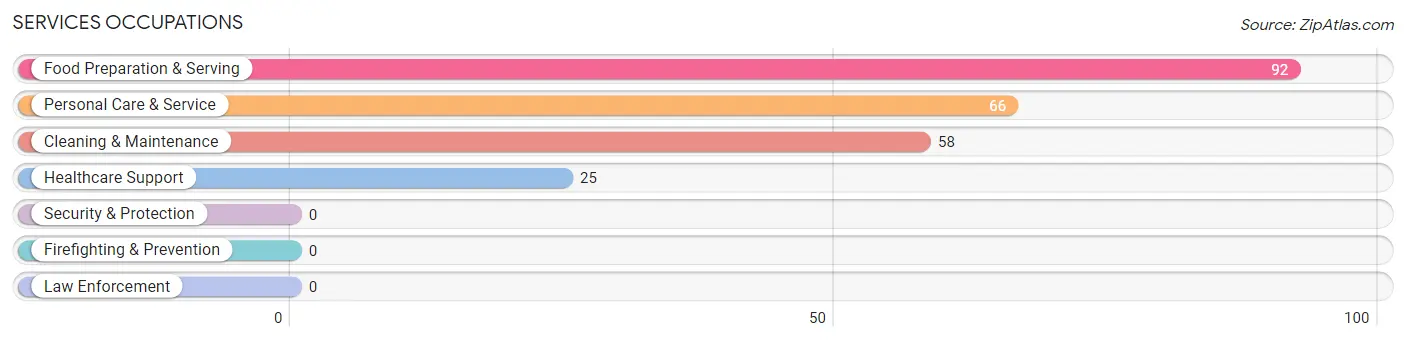
Services Occupations
The most common Services occupations in Blanding are Food Preparation & Serving (92 | 7.1%), Personal Care & Service (66 | 5.1%), Cleaning & Maintenance (58 | 4.5%), and Healthcare Support (25 | 1.9%).
Services Occupations by Sex
Within the Services occupations in Blanding, the most male-oriented occupations are Cleaning & Maintenance (37.9%), Food Preparation & Serving (20.6%), and Personal Care & Service (19.7%), while the most female-oriented occupations are Healthcare Support (100.0%), Personal Care & Service (80.3%), and Food Preparation & Serving (79.3%).
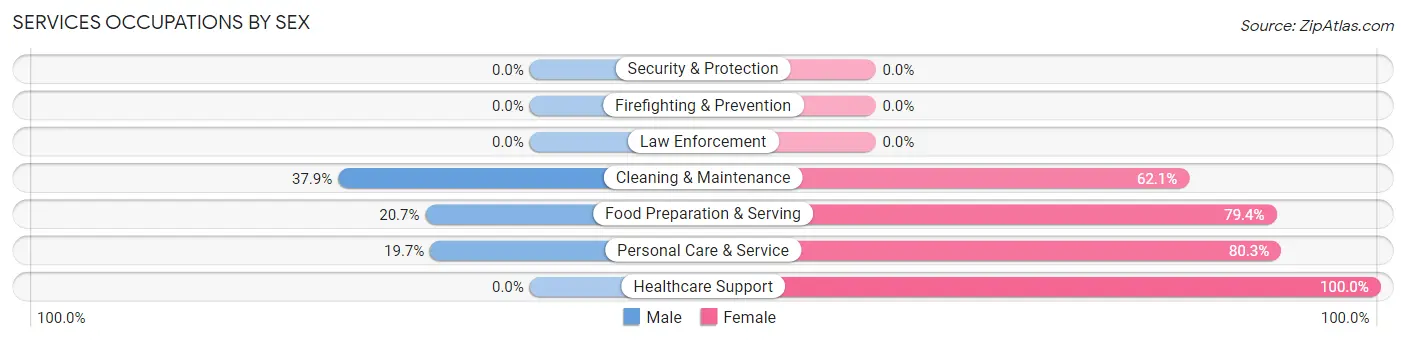
| Occupation | Male | Female |
| Healthcare Support | 0 (0.0%) | 25 (100.0%) |
| Security & Protection | 0 (0.0%) | 0 (0.0%) |
| Firefighting & Prevention | 0 (0.0%) | 0 (0.0%) |
| Law Enforcement | 0 (0.0%) | 0 (0.0%) |
| Food Preparation & Serving | 19 (20.6%) | 73 (79.3%) |
| Cleaning & Maintenance | 22 (37.9%) | 36 (62.1%) |
| Personal Care & Service | 13 (19.7%) | 53 (80.3%) |
| Total (Category) | 54 (22.4%) | 187 (77.6%) |
| Total (Overall) | 683 (52.7%) | 614 (47.3%) |
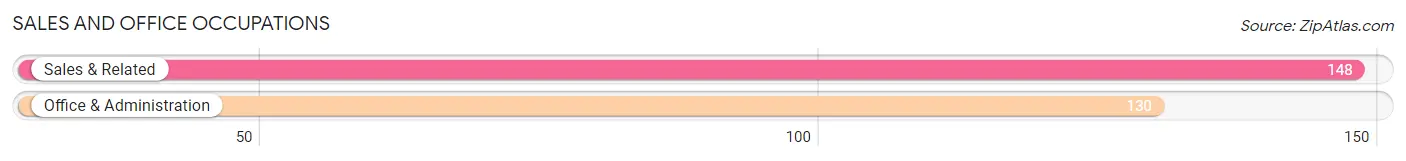
Sales and Office Occupations
The most common Sales and Office occupations in Blanding are Sales & Related (148 | 11.4%), and Office & Administration (130 | 10.0%).
Sales and Office Occupations by Sex
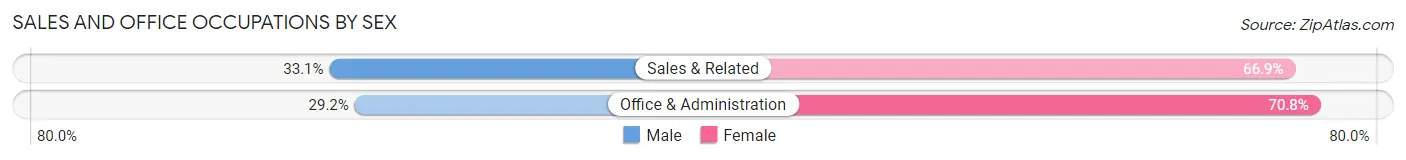
| Occupation | Male | Female |
| Sales & Related | 49 (33.1%) | 99 (66.9%) |
| Office & Administration | 38 (29.2%) | 92 (70.8%) |
| Total (Category) | 87 (31.3%) | 191 (68.7%) |
| Total (Overall) | 683 (52.7%) | 614 (47.3%) |
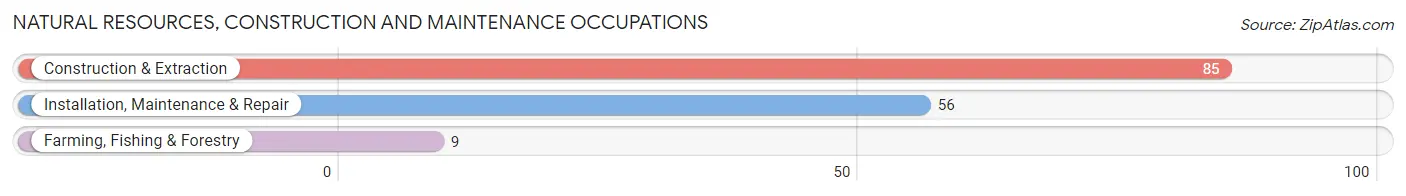
Natural Resources, Construction and Maintenance Occupations
The most common Natural Resources, Construction and Maintenance occupations in Blanding are Construction & Extraction (85 | 6.6%), Installation, Maintenance & Repair (56 | 4.3%), and Farming, Fishing & Forestry (9 | 0.7%).
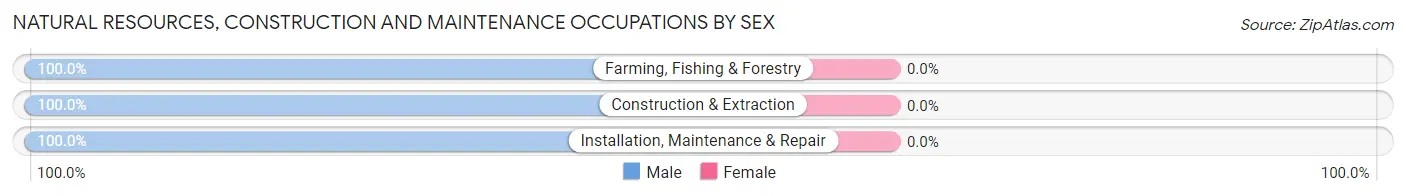
Natural Resources, Construction and Maintenance Occupations by Sex
| Occupation | Male | Female |
| Farming, Fishing & Forestry | 9 (100.0%) | 0 (0.0%) |
| Construction & Extraction | 85 (100.0%) | 0 (0.0%) |
| Installation, Maintenance & Repair | 56 (100.0%) | 0 (0.0%) |
| Total (Category) | 150 (100.0%) | 0 (0.0%) |
| Total (Overall) | 683 (52.7%) | 614 (47.3%) |
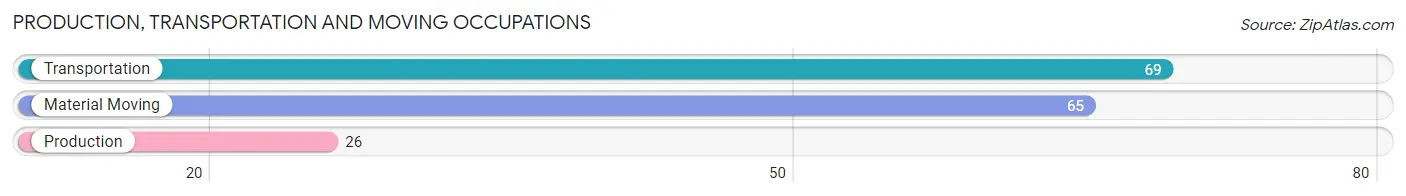
Production, Transportation and Moving Occupations
The most common Production, Transportation and Moving occupations in Blanding are Transportation (69 | 5.3%), Material Moving (65 | 5.0%), and Production (26 | 2.0%).
Production, Transportation and Moving Occupations by Sex
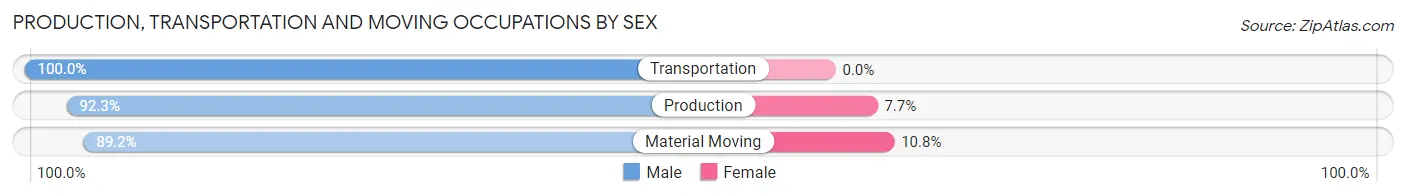
| Occupation | Male | Female |
| Production | 24 (92.3%) | 2 (7.7%) |
| Transportation | 69 (100.0%) | 0 (0.0%) |
| Material Moving | 58 (89.2%) | 7 (10.8%) |
| Total (Category) | 151 (94.4%) | 9 (5.6%) |
| Total (Overall) | 683 (52.7%) | 614 (47.3%) |
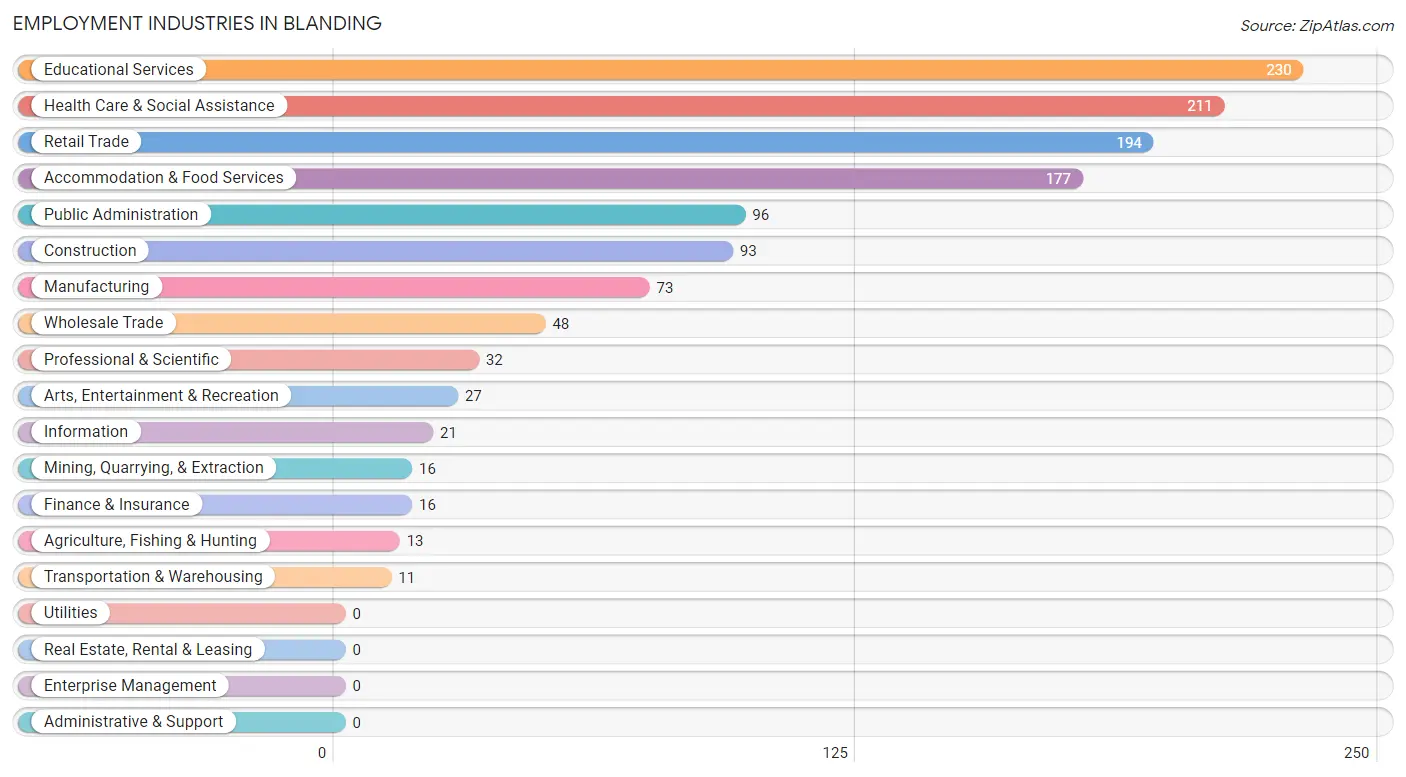
Employment Industries by Sex in Blanding
Employment Industries in Blanding
The major employment industries in Blanding include Educational Services (230 | 17.7%), Health Care & Social Assistance (211 | 16.3%), Retail Trade (194 | 15.0%), Accommodation & Food Services (177 | 13.7%), and Public Administration (96 | 7.4%).
Employment Industries by Sex in Blanding
The Blanding industries that see more men than women are Mining, Quarrying, & Extraction (100.0%), Manufacturing (100.0%), and Wholesale Trade (100.0%), whereas the industries that tend to have a higher number of women are Information (100.0%), Finance & Insurance (100.0%), and Educational Services (72.6%).
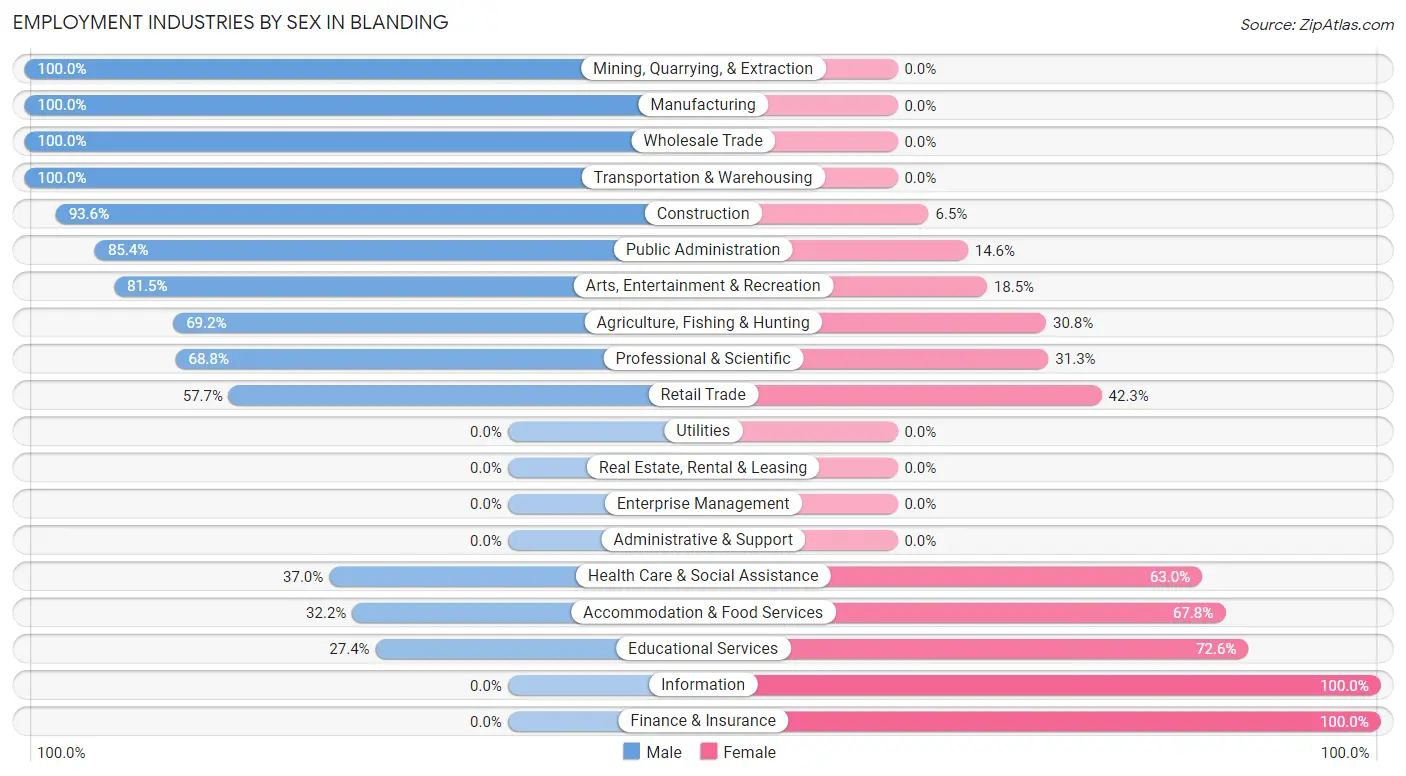
| Industry | Male | Female |
| Agriculture, Fishing & Hunting | 9 (69.2%) | 4 (30.8%) |
| Mining, Quarrying, & Extraction | 16 (100.0%) | 0 (0.0%) |
| Construction | 87 (93.5%) | 6 (6.5%) |
| Manufacturing | 73 (100.0%) | 0 (0.0%) |
| Wholesale Trade | 48 (100.0%) | 0 (0.0%) |
| Retail Trade | 112 (57.7%) | 82 (42.3%) |
| Transportation & Warehousing | 11 (100.0%) | 0 (0.0%) |
| Utilities | 0 (0.0%) | 0 (0.0%) |
| Information | 0 (0.0%) | 21 (100.0%) |
| Finance & Insurance | 0 (0.0%) | 16 (100.0%) |
| Real Estate, Rental & Leasing | 0 (0.0%) | 0 (0.0%) |
| Professional & Scientific | 22 (68.8%) | 10 (31.2%) |
| Enterprise Management | 0 (0.0%) | 0 (0.0%) |
| Administrative & Support | 0 (0.0%) | 0 (0.0%) |
| Educational Services | 63 (27.4%) | 167 (72.6%) |
| Health Care & Social Assistance | 78 (37.0%) | 133 (63.0%) |
| Arts, Entertainment & Recreation | 22 (81.5%) | 5 (18.5%) |
| Accommodation & Food Services | 57 (32.2%) | 120 (67.8%) |
| Public Administration | 82 (85.4%) | 14 (14.6%) |
| Total | 683 (52.7%) | 614 (47.3%) |
Education in Blanding
School Enrollment in Blanding
The most common levels of schooling among the 1,095 students in Blanding are high school (295 | 26.9%), middle school (246 | 22.5%), and elementary school (241 | 22.0%).
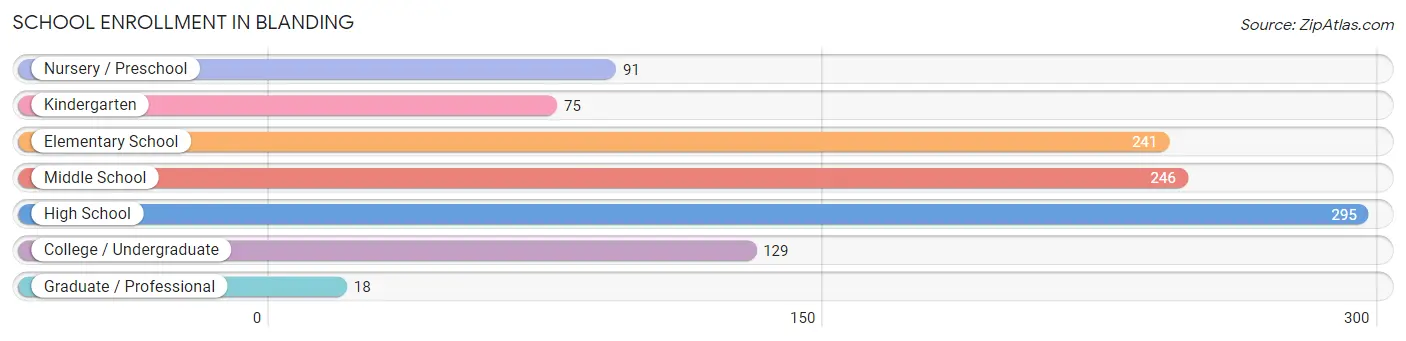
| School Level | # Students | % Students |
| Nursery / Preschool | 91 | 8.3% |
| Kindergarten | 75 | 6.9% |
| Elementary School | 241 | 22.0% |
| Middle School | 246 | 22.5% |
| High School | 295 | 26.9% |
| College / Undergraduate | 129 | 11.8% |
| Graduate / Professional | 18 | 1.6% |
| Total | 1,095 | 100.0% |
School Enrollment by Age by Funding Source in Blanding
Out of a total of 1,095 students who are enrolled in schools in Blanding, 77 (7.0%) attend a private institution, while the remaining 1,018 (93.0%) are enrolled in public schools. The age group of 3 to 4 year olds has the highest likelihood of being enrolled in private schools, with 28 (53.8% in the age bracket) enrolled. Conversely, the age group of 10 to 14 year olds has the lowest likelihood of being enrolled in a private school, with 273 (100.0% in the age bracket) attending a public institution.
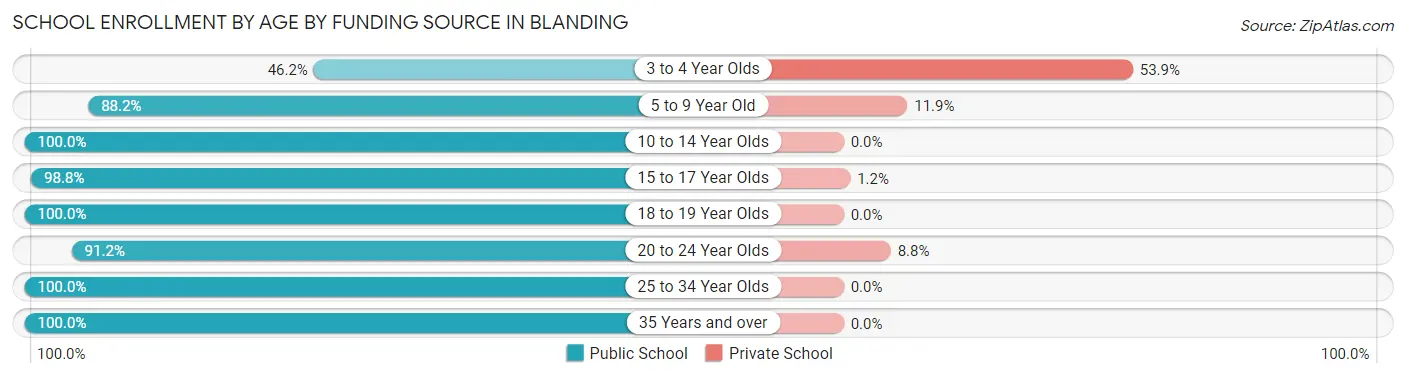
| Age Bracket | Public School | Private School |
| 3 to 4 Year Olds | 24 (46.2%) | 28 (53.8%) |
| 5 to 9 Year Old | 305 (88.1%) | 41 (11.8%) |
| 10 to 14 Year Olds | 273 (100.0%) | 0 (0.0%) |
| 15 to 17 Year Olds | 242 (98.8%) | 3 (1.2%) |
| 18 to 19 Year Olds | 75 (100.0%) | 0 (0.0%) |
| 20 to 24 Year Olds | 52 (91.2%) | 5 (8.8%) |
| 25 to 34 Year Olds | 16 (100.0%) | 0 (0.0%) |
| 35 Years and over | 31 (100.0%) | 0 (0.0%) |
| Total | 1,018 (93.0%) | 77 (7.0%) |
Educational Attainment by Field of Study in Blanding
Education (152 | 23.7%), business (73 | 11.4%), social sciences (61 | 9.5%), science & technology (57 | 8.9%), and liberal arts & history (44 | 6.9%) are the most common fields of study among 640 individuals in Blanding who have obtained a bachelor's degree or higher.
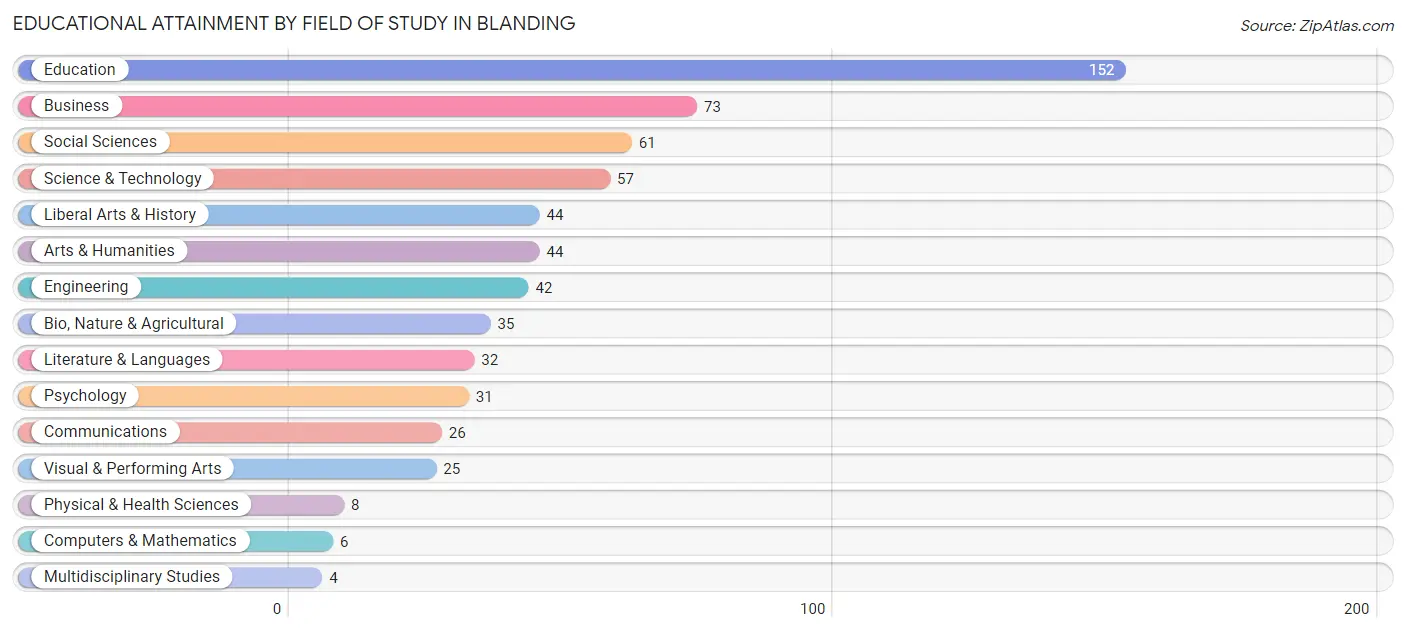
| Field of Study | # Graduates | % Graduates |
| Computers & Mathematics | 6 | 0.9% |
| Bio, Nature & Agricultural | 35 | 5.5% |
| Physical & Health Sciences | 8 | 1.3% |
| Psychology | 31 | 4.8% |
| Social Sciences | 61 | 9.5% |
| Engineering | 42 | 6.6% |
| Multidisciplinary Studies | 4 | 0.6% |
| Science & Technology | 57 | 8.9% |
| Business | 73 | 11.4% |
| Education | 152 | 23.7% |
| Literature & Languages | 32 | 5.0% |
| Liberal Arts & History | 44 | 6.9% |
| Visual & Performing Arts | 25 | 3.9% |
| Communications | 26 | 4.1% |
| Arts & Humanities | 44 | 6.9% |
| Total | 640 | 100.0% |
Transportation & Commute in Blanding
Vehicle Availability by Sex in Blanding
The most prevalent vehicle ownership categories in Blanding are males with 3 vehicles (279, accounting for 44.8%) and females with 3 vehicles (195, making up 46.5%).
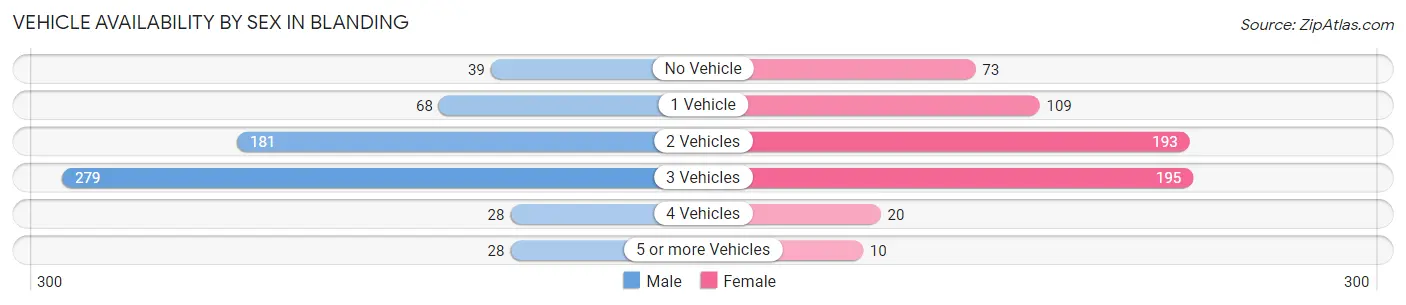
| Vehicles Available | Male | Female |
| No Vehicle | 39 (6.3%) | 73 (12.2%) |
| 1 Vehicle | 68 (10.9%) | 109 (18.2%) |
| 2 Vehicles | 181 (29.0%) | 193 (32.2%) |
| 3 Vehicles | 279 (44.8%) | 195 (32.5%) |
| 4 Vehicles | 28 (4.5%) | 20 (3.3%) |
| 5 or more Vehicles | 28 (4.5%) | 10 (1.7%) |
| Total | 623 (100.0%) | 600 (100.0%) |
Commute Time in Blanding
The most frequently occuring commute durations in Blanding are 5 to 9 minutes (451 commuters, 36.8%), less than 5 minutes (357 commuters, 29.1%), and 10 to 14 minutes (148 commuters, 12.1%).
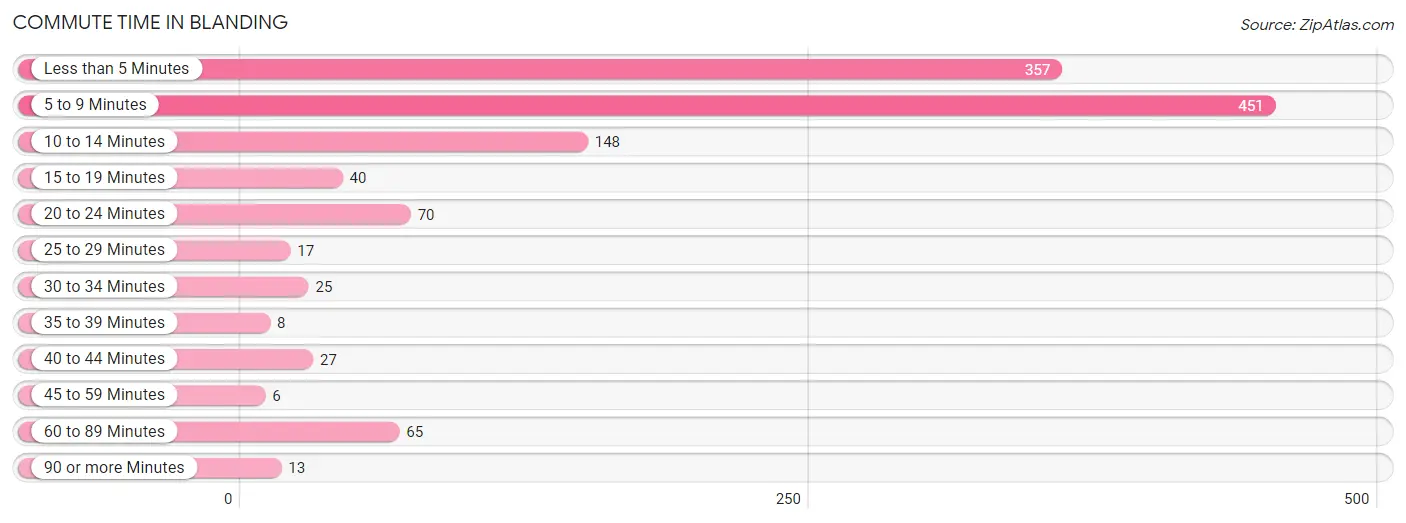
| Commute Time | # Commuters | % Commuters |
| Less than 5 Minutes | 357 | 29.1% |
| 5 to 9 Minutes | 451 | 36.8% |
| 10 to 14 Minutes | 148 | 12.1% |
| 15 to 19 Minutes | 40 | 3.3% |
| 20 to 24 Minutes | 70 | 5.7% |
| 25 to 29 Minutes | 17 | 1.4% |
| 30 to 34 Minutes | 25 | 2.0% |
| 35 to 39 Minutes | 8 | 0.6% |
| 40 to 44 Minutes | 27 | 2.2% |
| 45 to 59 Minutes | 6 | 0.5% |
| 60 to 89 Minutes | 65 | 5.3% |
| 90 or more Minutes | 13 | 1.1% |
Commute Time by Sex in Blanding
The most common commute times in Blanding are 5 to 9 minutes (246 commuters, 38.0%) for males and less than 5 minutes (230 commuters, 39.7%) for females.
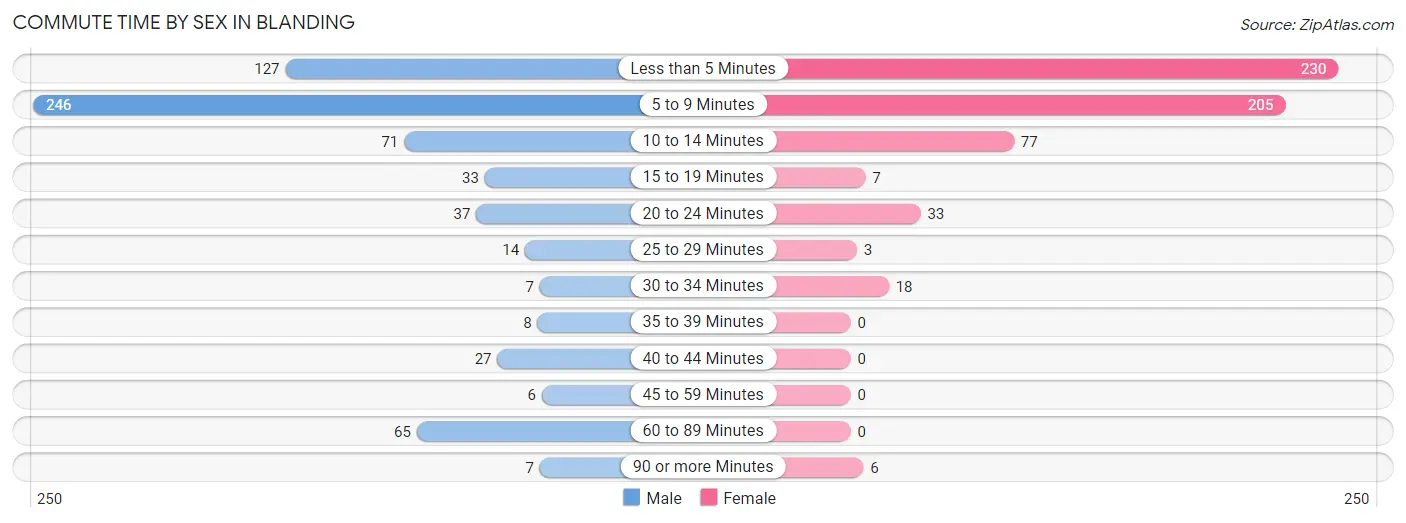
| Commute Time | Male | Female |
| Less than 5 Minutes | 127 (19.6%) | 230 (39.7%) |
| 5 to 9 Minutes | 246 (38.0%) | 205 (35.4%) |
| 10 to 14 Minutes | 71 (11.0%) | 77 (13.3%) |
| 15 to 19 Minutes | 33 (5.1%) | 7 (1.2%) |
| 20 to 24 Minutes | 37 (5.7%) | 33 (5.7%) |
| 25 to 29 Minutes | 14 (2.2%) | 3 (0.5%) |
| 30 to 34 Minutes | 7 (1.1%) | 18 (3.1%) |
| 35 to 39 Minutes | 8 (1.2%) | 0 (0.0%) |
| 40 to 44 Minutes | 27 (4.2%) | 0 (0.0%) |
| 45 to 59 Minutes | 6 (0.9%) | 0 (0.0%) |
| 60 to 89 Minutes | 65 (10.0%) | 0 (0.0%) |
| 90 or more Minutes | 7 (1.1%) | 6 (1.0%) |
Time of Departure to Work by Sex in Blanding
The most frequent times of departure to work in Blanding are 7:30 AM to 7:59 AM (163, 25.2%) for males and 7:30 AM to 7:59 AM (158, 27.3%) for females.
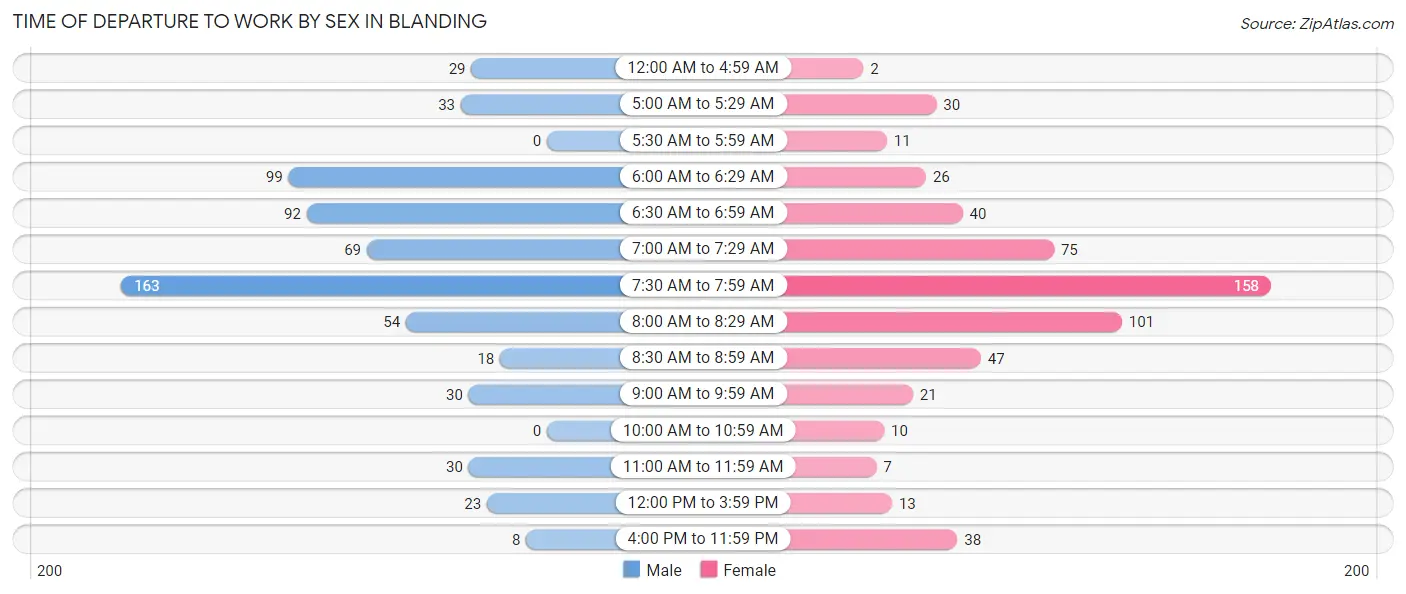
| Time of Departure | Male | Female |
| 12:00 AM to 4:59 AM | 29 (4.5%) | 2 (0.4%) |
| 5:00 AM to 5:29 AM | 33 (5.1%) | 30 (5.2%) |
| 5:30 AM to 5:59 AM | 0 (0.0%) | 11 (1.9%) |
| 6:00 AM to 6:29 AM | 99 (15.3%) | 26 (4.5%) |
| 6:30 AM to 6:59 AM | 92 (14.2%) | 40 (6.9%) |
| 7:00 AM to 7:29 AM | 69 (10.6%) | 75 (13.0%) |
| 7:30 AM to 7:59 AM | 163 (25.2%) | 158 (27.3%) |
| 8:00 AM to 8:29 AM | 54 (8.3%) | 101 (17.4%) |
| 8:30 AM to 8:59 AM | 18 (2.8%) | 47 (8.1%) |
| 9:00 AM to 9:59 AM | 30 (4.6%) | 21 (3.6%) |
| 10:00 AM to 10:59 AM | 0 (0.0%) | 10 (1.7%) |
| 11:00 AM to 11:59 AM | 30 (4.6%) | 7 (1.2%) |
| 12:00 PM to 3:59 PM | 23 (3.5%) | 13 (2.2%) |
| 4:00 PM to 11:59 PM | 8 (1.2%) | 38 (6.6%) |
| Total | 648 (100.0%) | 579 (100.0%) |
Housing Occupancy in Blanding
Occupancy by Ownership in Blanding
Of the total 1,092 dwellings in Blanding, owner-occupied units account for 809 (74.1%), while renter-occupied units make up 283 (25.9%).
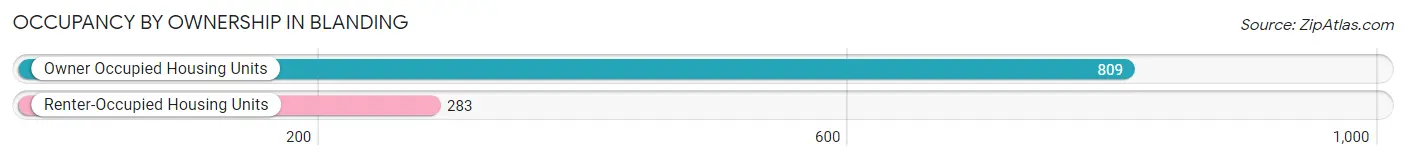
| Occupancy | # Housing Units | % Housing Units |
| Owner Occupied Housing Units | 809 | 74.1% |
| Renter-Occupied Housing Units | 283 | 25.9% |
| Total Occupied Housing Units | 1,092 | 100.0% |
Occupancy by Household Size in Blanding
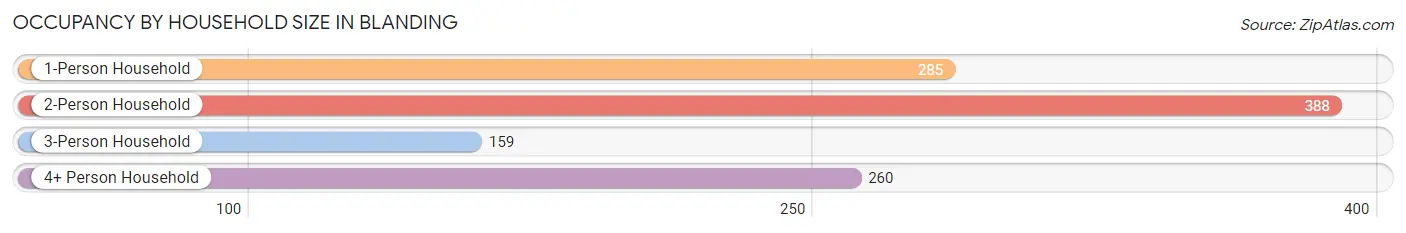
| Household Size | # Housing Units | % Housing Units |
| 1-Person Household | 285 | 26.1% |
| 2-Person Household | 388 | 35.5% |
| 3-Person Household | 159 | 14.6% |
| 4+ Person Household | 260 | 23.8% |
| Total Housing Units | 1,092 | 100.0% |
Occupancy by Ownership by Household Size in Blanding
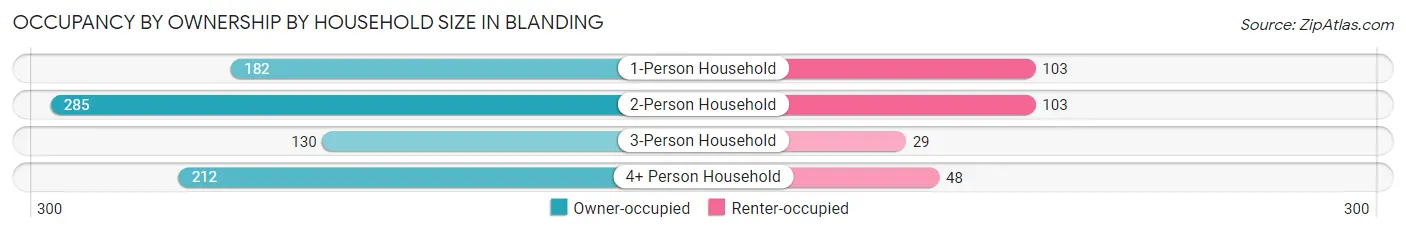
| Household Size | Owner-occupied | Renter-occupied |
| 1-Person Household | 182 (63.9%) | 103 (36.1%) |
| 2-Person Household | 285 (73.5%) | 103 (26.6%) |
| 3-Person Household | 130 (81.8%) | 29 (18.2%) |
| 4+ Person Household | 212 (81.5%) | 48 (18.5%) |
| Total Housing Units | 809 (74.1%) | 283 (25.9%) |
Occupancy by Educational Attainment in Blanding
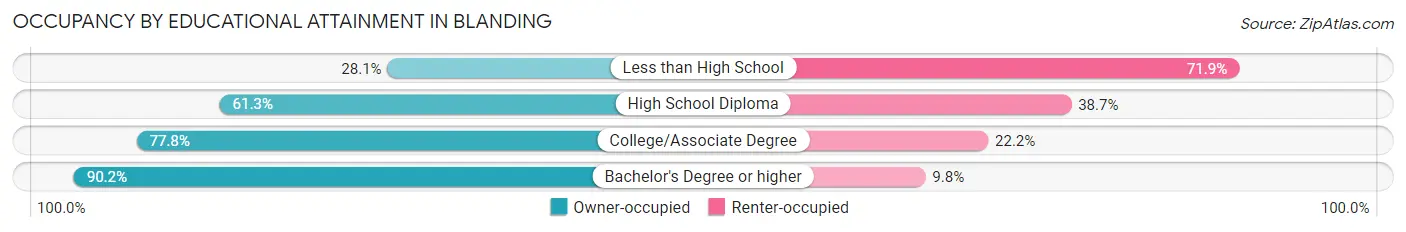
| Household Size | Owner-occupied | Renter-occupied |
| Less than High School | 32 (28.1%) | 82 (71.9%) |
| High School Diploma | 111 (61.3%) | 70 (38.7%) |
| College/Associate Degree | 333 (77.8%) | 95 (22.2%) |
| Bachelor's Degree or higher | 333 (90.2%) | 36 (9.8%) |
Occupancy by Age of Householder in Blanding
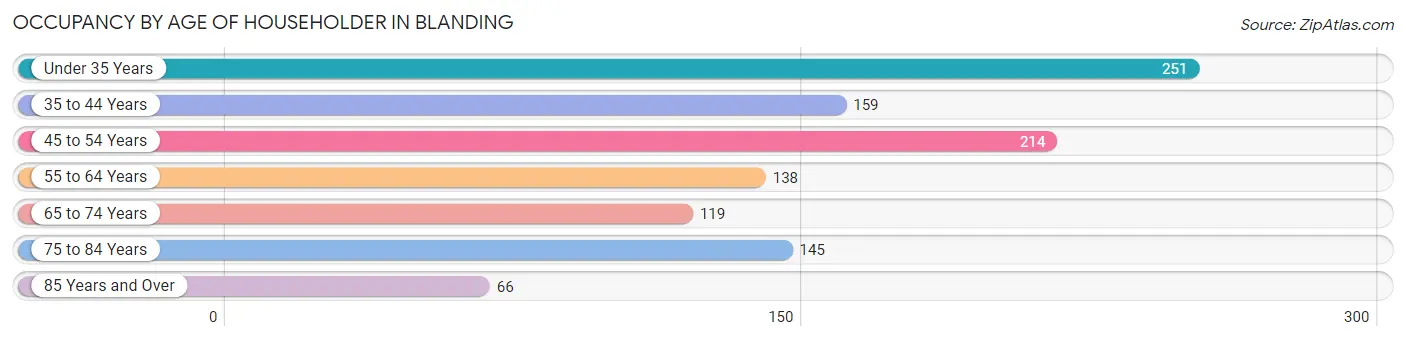
| Age Bracket | # Households | % Households |
| Under 35 Years | 251 | 23.0% |
| 35 to 44 Years | 159 | 14.6% |
| 45 to 54 Years | 214 | 19.6% |
| 55 to 64 Years | 138 | 12.6% |
| 65 to 74 Years | 119 | 10.9% |
| 75 to 84 Years | 145 | 13.3% |
| 85 Years and Over | 66 | 6.0% |
| Total | 1,092 | 100.0% |
Housing Finances in Blanding
Median Income by Occupancy in Blanding
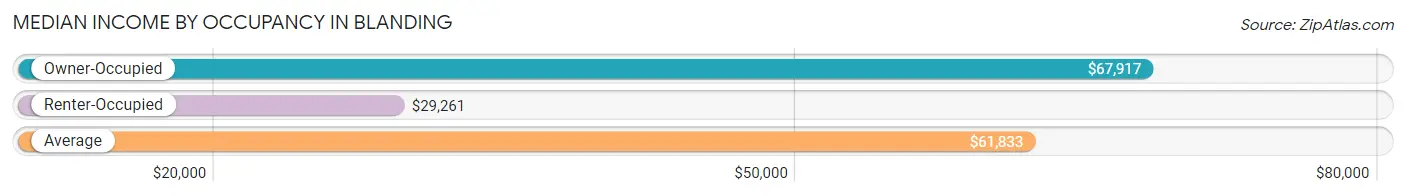
| Occupancy Type | # Households | Median Income |
| Owner-Occupied | 809 (74.1%) | $67,917 |
| Renter-Occupied | 283 (25.9%) | $29,261 |
| Average | 1,092 (100.0%) | $61,833 |
Occupancy by Householder Income Bracket in Blanding
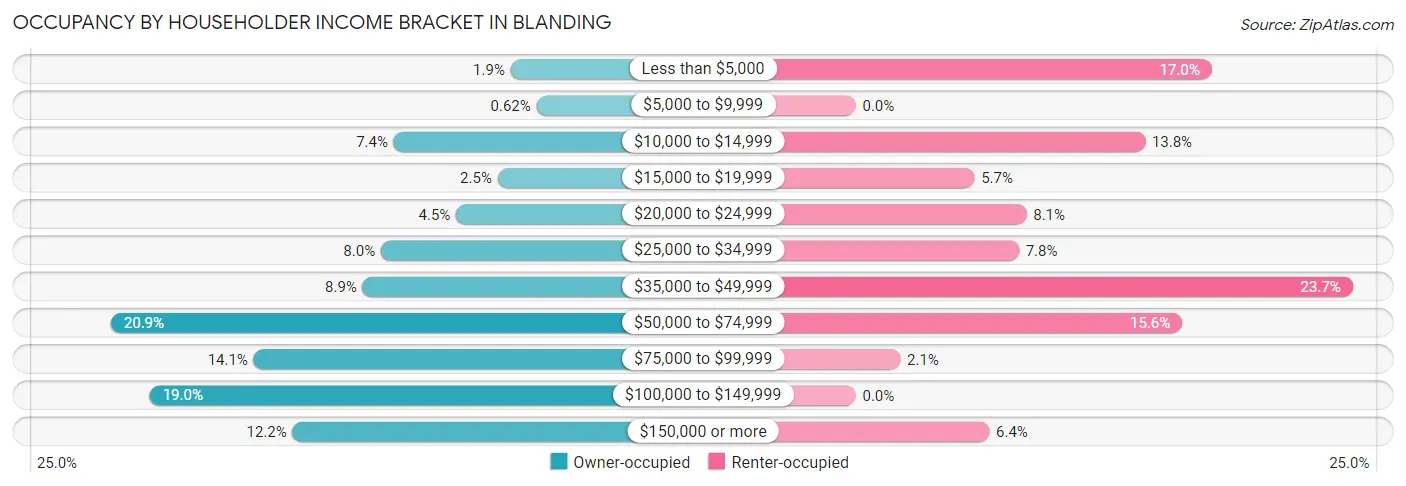
| Income Bracket | Owner-occupied | Renter-occupied |
| Less than $5,000 | 15 (1.8%) | 48 (17.0%) |
| $5,000 to $9,999 | 5 (0.6%) | 0 (0.0%) |
| $10,000 to $14,999 | 60 (7.4%) | 39 (13.8%) |
| $15,000 to $19,999 | 20 (2.5%) | 16 (5.7%) |
| $20,000 to $24,999 | 36 (4.4%) | 23 (8.1%) |
| $25,000 to $34,999 | 65 (8.0%) | 22 (7.8%) |
| $35,000 to $49,999 | 72 (8.9%) | 67 (23.7%) |
| $50,000 to $74,999 | 169 (20.9%) | 44 (15.5%) |
| $75,000 to $99,999 | 114 (14.1%) | 6 (2.1%) |
| $100,000 to $149,999 | 154 (19.0%) | 0 (0.0%) |
| $150,000 or more | 99 (12.2%) | 18 (6.4%) |
| Total | 809 (100.0%) | 283 (100.0%) |
Monthly Housing Cost Tiers in Blanding
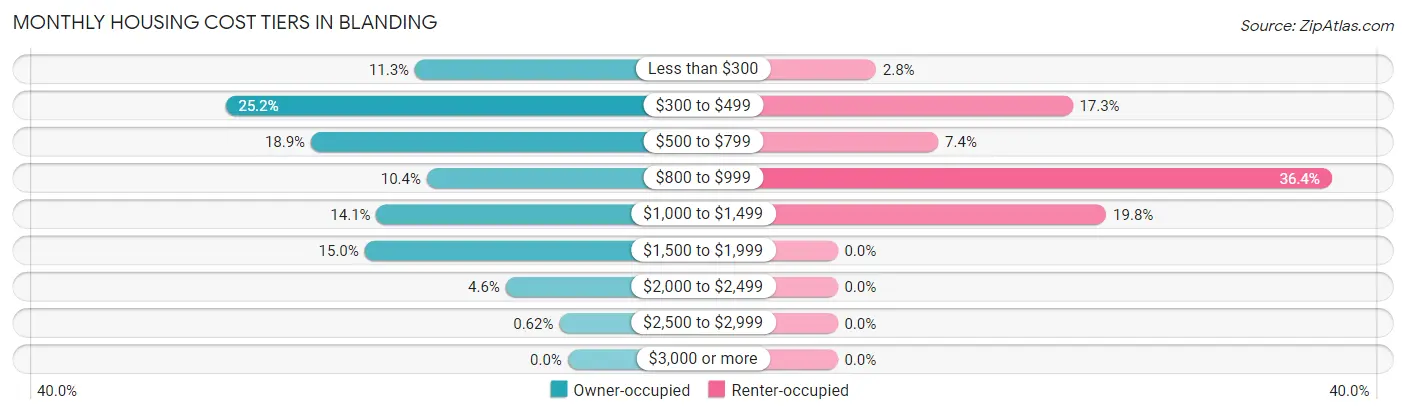
| Monthly Cost | Owner-occupied | Renter-occupied |
| Less than $300 | 91 (11.3%) | 8 (2.8%) |
| $300 to $499 | 204 (25.2%) | 49 (17.3%) |
| $500 to $799 | 153 (18.9%) | 21 (7.4%) |
| $800 to $999 | 84 (10.4%) | 103 (36.4%) |
| $1,000 to $1,499 | 114 (14.1%) | 56 (19.8%) |
| $1,500 to $1,999 | 121 (15.0%) | 0 (0.0%) |
| $2,000 to $2,499 | 37 (4.6%) | 0 (0.0%) |
| $2,500 to $2,999 | 5 (0.6%) | 0 (0.0%) |
| $3,000 or more | 0 (0.0%) | 0 (0.0%) |
| Total | 809 (100.0%) | 283 (100.0%) |
Physical Housing Characteristics in Blanding
Housing Structures in Blanding
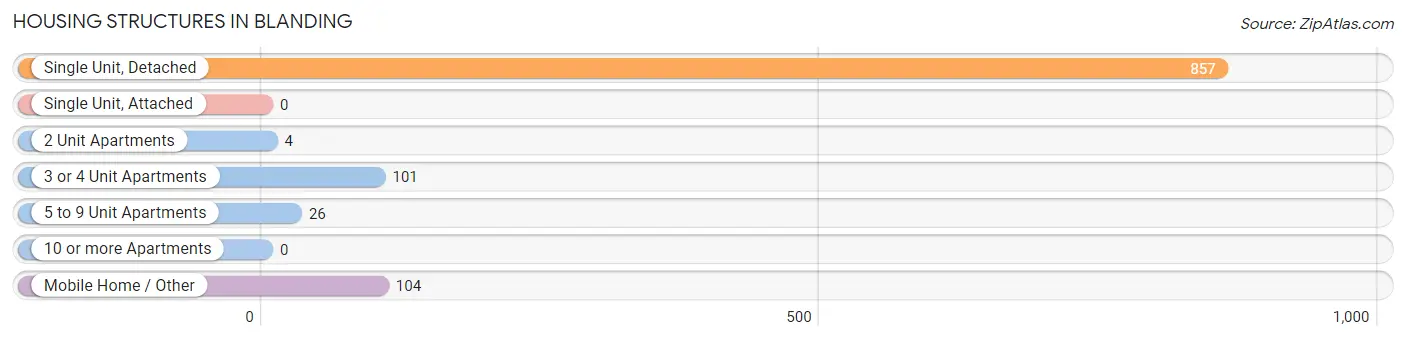
| Structure Type | # Housing Units | % Housing Units |
| Single Unit, Detached | 857 | 78.5% |
| Single Unit, Attached | 0 | 0.0% |
| 2 Unit Apartments | 4 | 0.4% |
| 3 or 4 Unit Apartments | 101 | 9.2% |
| 5 to 9 Unit Apartments | 26 | 2.4% |
| 10 or more Apartments | 0 | 0.0% |
| Mobile Home / Other | 104 | 9.5% |
| Total | 1,092 | 100.0% |
Housing Structures by Occupancy in Blanding
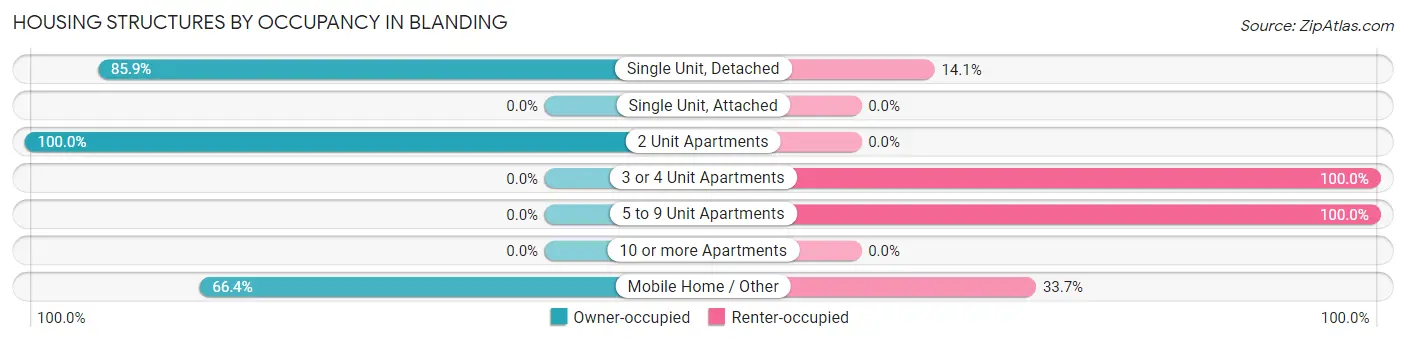
| Structure Type | Owner-occupied | Renter-occupied |
| Single Unit, Detached | 736 (85.9%) | 121 (14.1%) |
| Single Unit, Attached | 0 (0.0%) | 0 (0.0%) |
| 2 Unit Apartments | 4 (100.0%) | 0 (0.0%) |
| 3 or 4 Unit Apartments | 0 (0.0%) | 101 (100.0%) |
| 5 to 9 Unit Apartments | 0 (0.0%) | 26 (100.0%) |
| 10 or more Apartments | 0 (0.0%) | 0 (0.0%) |
| Mobile Home / Other | 69 (66.3%) | 35 (33.7%) |
| Total | 809 (74.1%) | 283 (25.9%) |
Housing Structures by Number of Rooms in Blanding
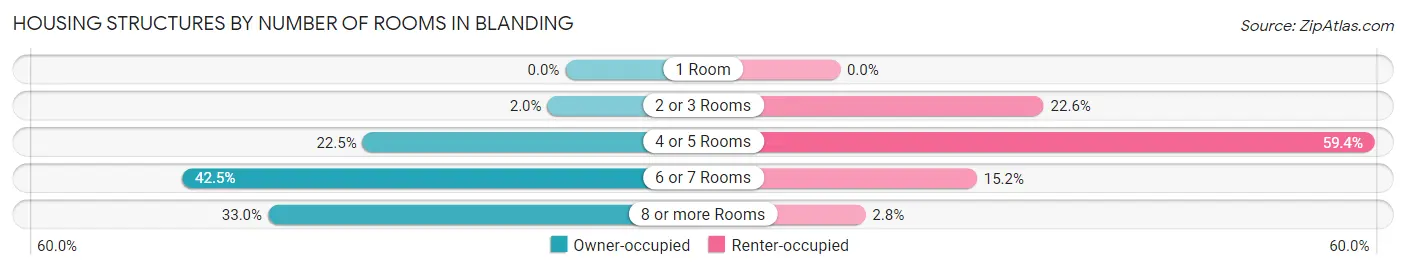
| Number of Rooms | Owner-occupied | Renter-occupied |
| 1 Room | 0 (0.0%) | 0 (0.0%) |
| 2 or 3 Rooms | 16 (2.0%) | 64 (22.6%) |
| 4 or 5 Rooms | 182 (22.5%) | 168 (59.4%) |
| 6 or 7 Rooms | 344 (42.5%) | 43 (15.2%) |
| 8 or more Rooms | 267 (33.0%) | 8 (2.8%) |
| Total | 809 (100.0%) | 283 (100.0%) |
Housing Structure by Heating Type in Blanding
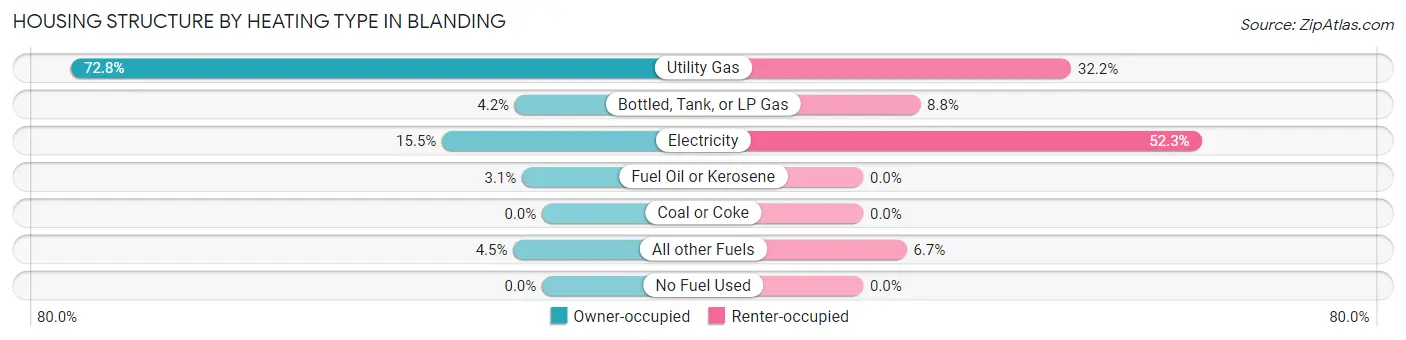
| Heating Type | Owner-occupied | Renter-occupied |
| Utility Gas | 589 (72.8%) | 91 (32.2%) |
| Bottled, Tank, or LP Gas | 34 (4.2%) | 25 (8.8%) |
| Electricity | 125 (15.4%) | 148 (52.3%) |
| Fuel Oil or Kerosene | 25 (3.1%) | 0 (0.0%) |
| Coal or Coke | 0 (0.0%) | 0 (0.0%) |
| All other Fuels | 36 (4.4%) | 19 (6.7%) |
| No Fuel Used | 0 (0.0%) | 0 (0.0%) |
| Total | 809 (100.0%) | 283 (100.0%) |
Household Vehicle Usage in Blanding
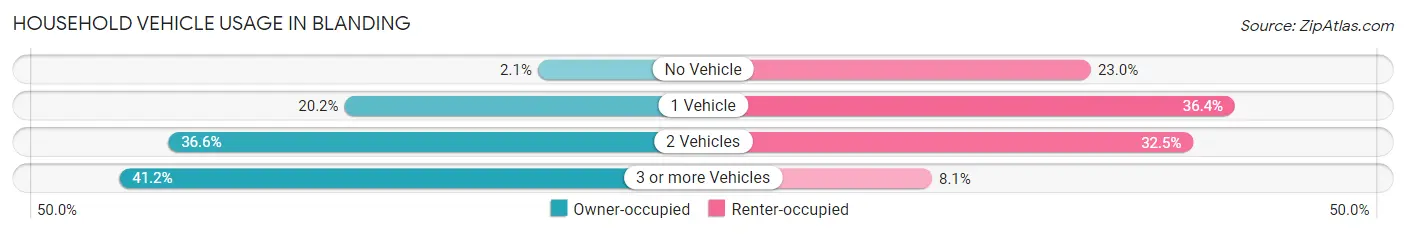
| Vehicles per Household | Owner-occupied | Renter-occupied |
| No Vehicle | 17 (2.1%) | 65 (23.0%) |
| 1 Vehicle | 163 (20.2%) | 103 (36.4%) |
| 2 Vehicles | 296 (36.6%) | 92 (32.5%) |
| 3 or more Vehicles | 333 (41.2%) | 23 (8.1%) |
| Total | 809 (100.0%) | 283 (100.0%) |
Real Estate & Mortgages in Blanding
Real Estate and Mortgage Overview in Blanding
| Characteristic | Without Mortgage | With Mortgage |
| Housing Units | 454 | 355 |
| Median Property Value | $194,000 | $225,500 |
| Median Household Income | $66,736 | $75 |
| Monthly Housing Costs | $460 | $0 |
| Real Estate Taxes | $1,449 | $31 |
Property Value by Mortgage Status in Blanding
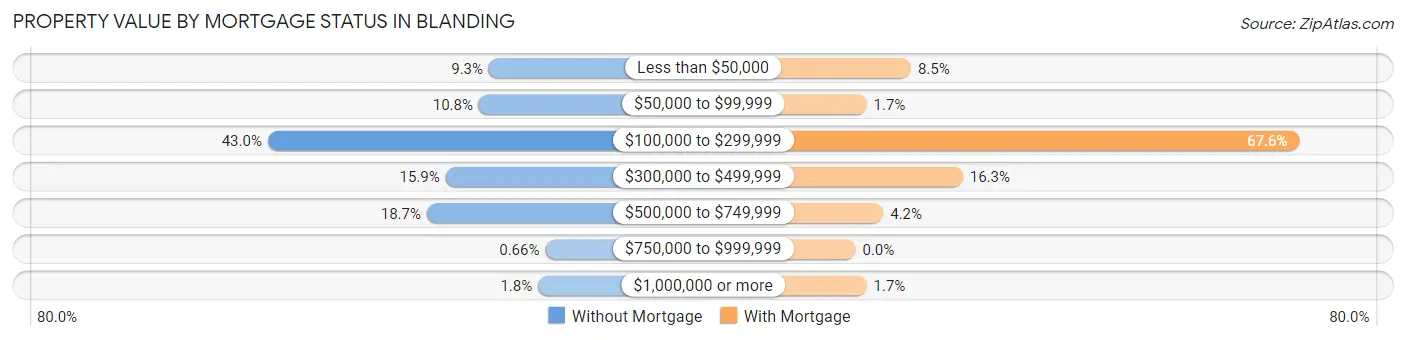
| Property Value | Without Mortgage | With Mortgage |
| Less than $50,000 | 42 (9.2%) | 30 (8.5%) |
| $50,000 to $99,999 | 49 (10.8%) | 6 (1.7%) |
| $100,000 to $299,999 | 195 (42.9%) | 240 (67.6%) |
| $300,000 to $499,999 | 72 (15.9%) | 58 (16.3%) |
| $500,000 to $749,999 | 85 (18.7%) | 15 (4.2%) |
| $750,000 to $999,999 | 3 (0.7%) | 0 (0.0%) |
| $1,000,000 or more | 8 (1.8%) | 6 (1.7%) |
| Total | 454 (100.0%) | 355 (100.0%) |
Household Income by Mortgage Status in Blanding
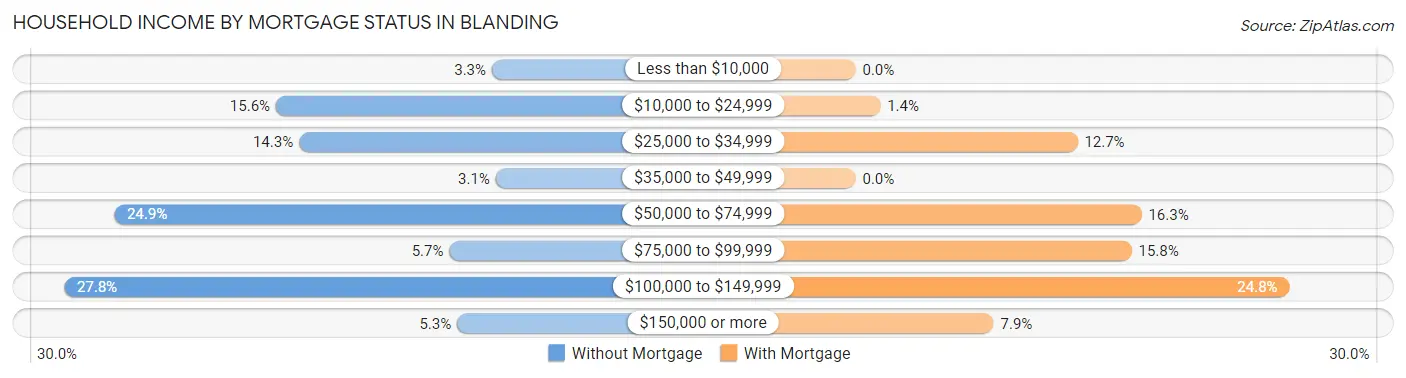
| Household Income | Without Mortgage | With Mortgage |
| Less than $10,000 | 15 (3.3%) | 0 (0.0%) |
| $10,000 to $24,999 | 71 (15.6%) | 5 (1.4%) |
| $25,000 to $34,999 | 65 (14.3%) | 45 (12.7%) |
| $35,000 to $49,999 | 14 (3.1%) | 0 (0.0%) |
| $50,000 to $74,999 | 113 (24.9%) | 58 (16.3%) |
| $75,000 to $99,999 | 26 (5.7%) | 56 (15.8%) |
| $100,000 to $149,999 | 126 (27.8%) | 88 (24.8%) |
| $150,000 or more | 24 (5.3%) | 28 (7.9%) |
| Total | 454 (100.0%) | 355 (100.0%) |
Property Value to Household Income Ratio in Blanding
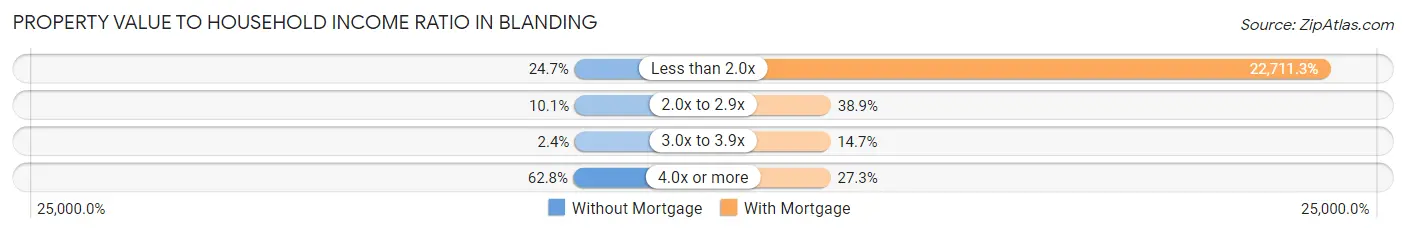
| Value-to-Income Ratio | Without Mortgage | With Mortgage |
| Less than 2.0x | 112 (24.7%) | 80,625 (22,711.3%) |
| 2.0x to 2.9x | 46 (10.1%) | 138 (38.9%) |
| 3.0x to 3.9x | 11 (2.4%) | 52 (14.6%) |
| 4.0x or more | 285 (62.8%) | 97 (27.3%) |
| Total | 454 (100.0%) | 355 (100.0%) |
Real Estate Taxes by Mortgage Status in Blanding
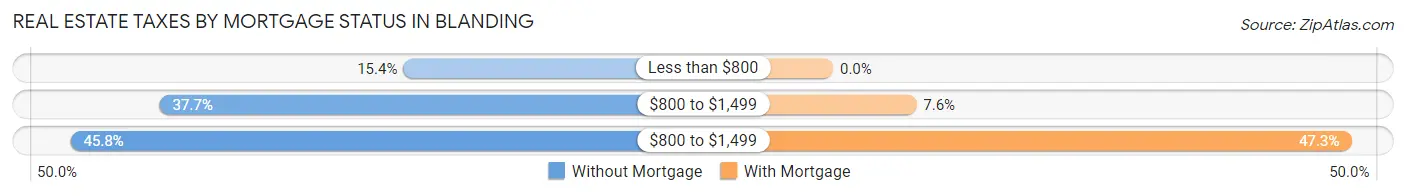
| Property Taxes | Without Mortgage | With Mortgage |
| Less than $800 | 70 (15.4%) | 0 (0.0%) |
| $800 to $1,499 | 171 (37.7%) | 27 (7.6%) |
| $800 to $1,499 | 208 (45.8%) | 168 (47.3%) |
| Total | 454 (100.0%) | 355 (100.0%) |
Health & Disability in Blanding
Health Insurance Coverage by Age in Blanding
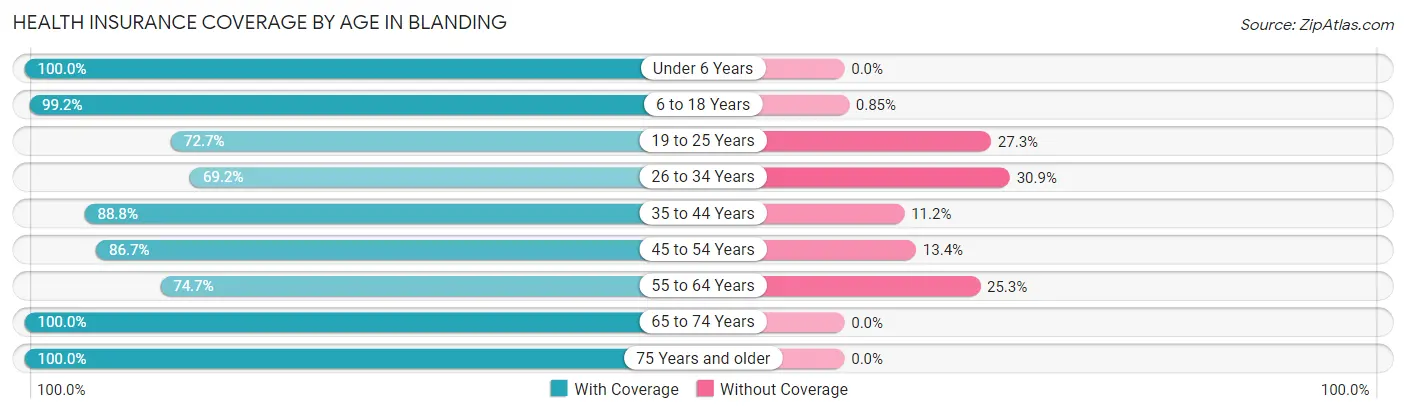
| Age Bracket | With Coverage | Without Coverage |
| Under 6 Years | 277 (100.0%) | 0 (0.0%) |
| 6 to 18 Years | 934 (99.2%) | 8 (0.9%) |
| 19 to 25 Years | 202 (72.7%) | 76 (27.3%) |
| 26 to 34 Years | 269 (69.2%) | 120 (30.8%) |
| 35 to 44 Years | 278 (88.8%) | 35 (11.2%) |
| 45 to 54 Years | 305 (86.7%) | 47 (13.4%) |
| 55 to 64 Years | 183 (74.7%) | 62 (25.3%) |
| 65 to 74 Years | 213 (100.0%) | 0 (0.0%) |
| 75 Years and older | 271 (100.0%) | 0 (0.0%) |
| Total | 2,932 (89.4%) | 348 (10.6%) |
Health Insurance Coverage by Citizenship Status in Blanding
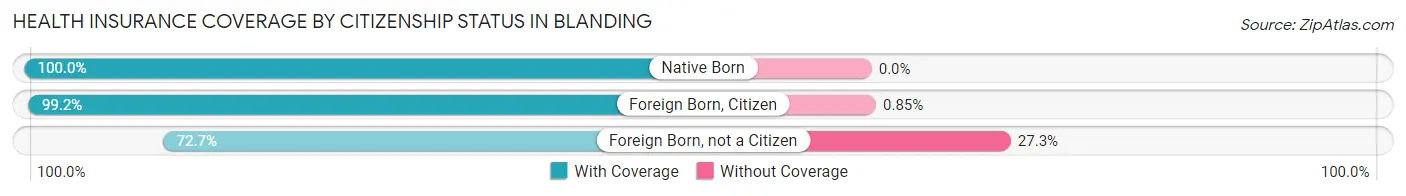
| Citizenship Status | With Coverage | Without Coverage |
| Native Born | 277 (100.0%) | 0 (0.0%) |
| Foreign Born, Citizen | 934 (99.2%) | 8 (0.9%) |
| Foreign Born, not a Citizen | 202 (72.7%) | 76 (27.3%) |
Health Insurance Coverage by Household Income in Blanding
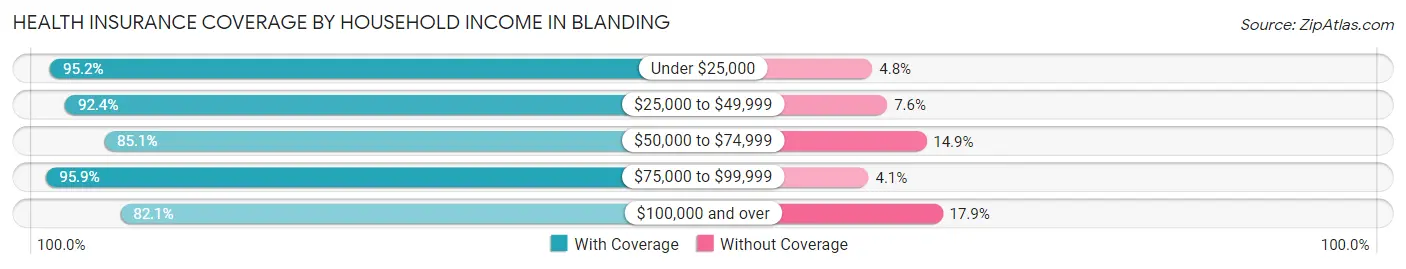
| Household Income | With Coverage | Without Coverage |
| Under $25,000 | 576 (95.2%) | 29 (4.8%) |
| $25,000 to $49,999 | 451 (92.4%) | 37 (7.6%) |
| $50,000 to $74,999 | 434 (85.1%) | 76 (14.9%) |
| $75,000 to $99,999 | 519 (95.9%) | 22 (4.1%) |
| $100,000 and over | 828 (82.1%) | 181 (17.9%) |
Public vs Private Health Insurance Coverage by Age in Blanding
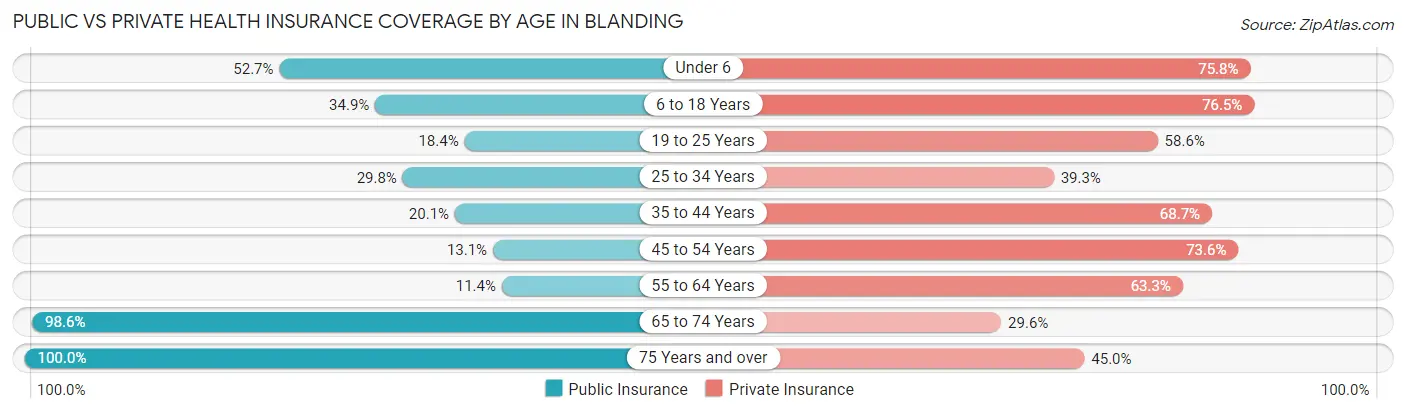
| Age Bracket | Public Insurance | Private Insurance |
| Under 6 | 146 (52.7%) | 210 (75.8%) |
| 6 to 18 Years | 329 (34.9%) | 721 (76.5%) |
| 19 to 25 Years | 51 (18.3%) | 163 (58.6%) |
| 25 to 34 Years | 116 (29.8%) | 153 (39.3%) |
| 35 to 44 Years | 63 (20.1%) | 215 (68.7%) |
| 45 to 54 Years | 46 (13.1%) | 259 (73.6%) |
| 55 to 64 Years | 28 (11.4%) | 155 (63.3%) |
| 65 to 74 Years | 210 (98.6%) | 63 (29.6%) |
| 75 Years and over | 271 (100.0%) | 122 (45.0%) |
| Total | 1,260 (38.4%) | 2,061 (62.8%) |
Disability Status by Sex by Age in Blanding
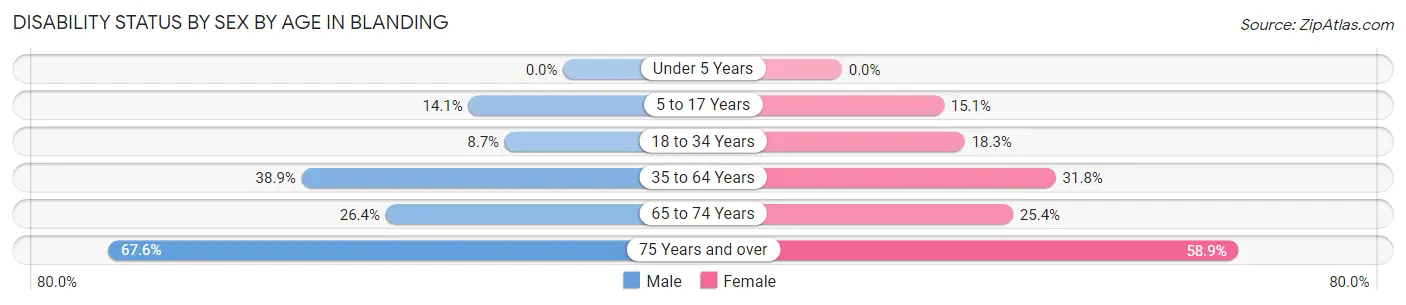
| Age Bracket | Male | Female |
| Under 5 Years | 0 (0.0%) | 0 (0.0%) |
| 5 to 17 Years | 66 (14.1%) | 68 (15.1%) |
| 18 to 34 Years | 30 (8.7%) | 71 (18.2%) |
| 35 to 64 Years | 164 (38.9%) | 155 (31.8%) |
| 65 to 74 Years | 24 (26.4%) | 31 (25.4%) |
| 75 Years and over | 73 (67.6%) | 96 (58.9%) |
Disability Class by Sex by Age in Blanding
Disability Class: Hearing Difficulty

| Age Bracket | Male | Female |
| Under 5 Years | 0 (0.0%) | 0 (0.0%) |
| 5 to 17 Years | 0 (0.0%) | 0 (0.0%) |
| 18 to 34 Years | 6 (1.7%) | 0 (0.0%) |
| 35 to 64 Years | 44 (10.4%) | 16 (3.3%) |
| 65 to 74 Years | 15 (16.5%) | 11 (9.0%) |
| 75 Years and over | 64 (59.3%) | 46 (28.2%) |
Disability Class: Vision Difficulty
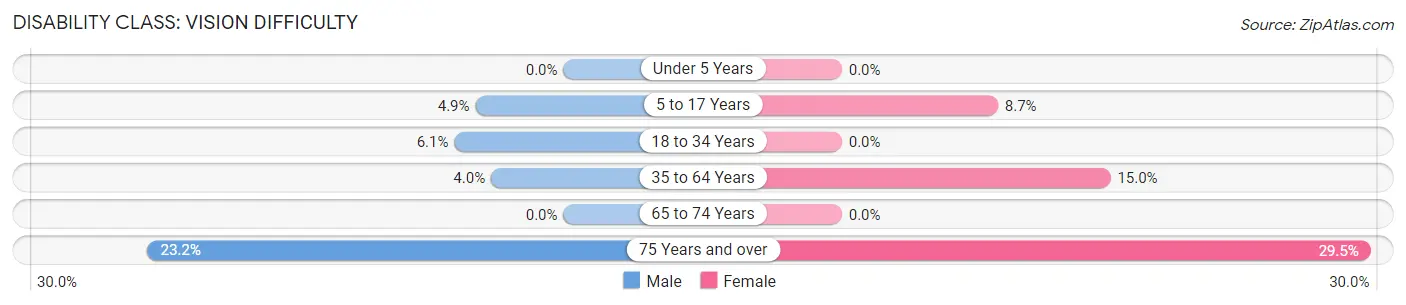
| Age Bracket | Male | Female |
| Under 5 Years | 0 (0.0%) | 0 (0.0%) |
| 5 to 17 Years | 23 (4.9%) | 39 (8.7%) |
| 18 to 34 Years | 21 (6.1%) | 0 (0.0%) |
| 35 to 64 Years | 17 (4.0%) | 73 (15.0%) |
| 65 to 74 Years | 0 (0.0%) | 0 (0.0%) |
| 75 Years and over | 25 (23.2%) | 48 (29.4%) |
Disability Class: Cognitive Difficulty
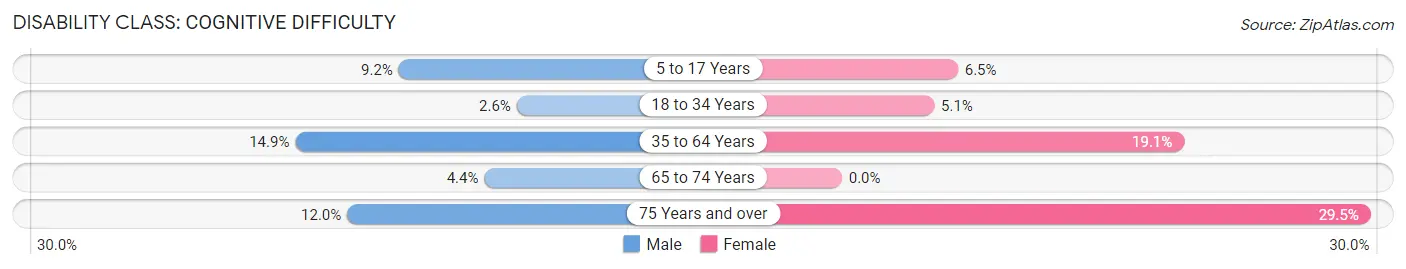
| Age Bracket | Male | Female |
| 5 to 17 Years | 43 (9.2%) | 29 (6.5%) |
| 18 to 34 Years | 9 (2.6%) | 20 (5.1%) |
| 35 to 64 Years | 63 (14.9%) | 93 (19.1%) |
| 65 to 74 Years | 4 (4.4%) | 0 (0.0%) |
| 75 Years and over | 13 (12.0%) | 48 (29.4%) |
Disability Class: Ambulatory Difficulty
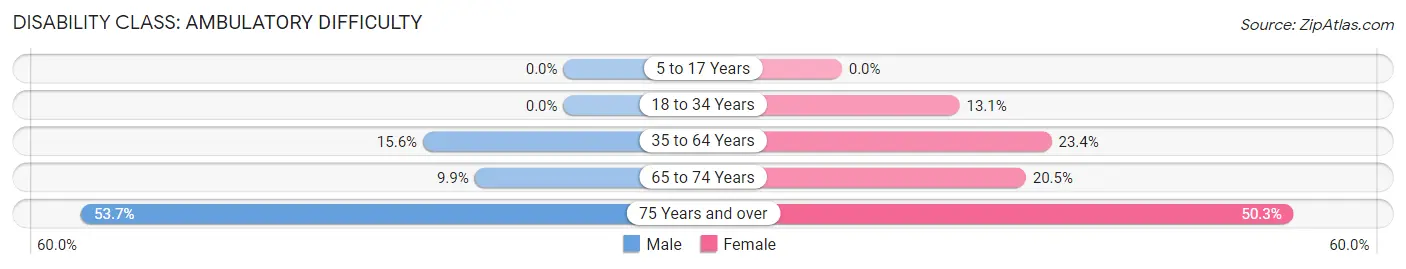
| Age Bracket | Male | Female |
| 5 to 17 Years | 0 (0.0%) | 0 (0.0%) |
| 18 to 34 Years | 0 (0.0%) | 51 (13.1%) |
| 35 to 64 Years | 66 (15.6%) | 114 (23.4%) |
| 65 to 74 Years | 9 (9.9%) | 25 (20.5%) |
| 75 Years and over | 58 (53.7%) | 82 (50.3%) |
Disability Class: Self-Care Difficulty
| Age Bracket | Male | Female |
| 5 to 17 Years | 0 (0.0%) | 0 (0.0%) |
| 18 to 34 Years | 0 (0.0%) | 0 (0.0%) |
| 35 to 64 Years | 5 (1.2%) | 29 (5.9%) |
| 65 to 74 Years | 0 (0.0%) | 0 (0.0%) |
| 75 Years and over | 25 (23.2%) | 17 (10.4%) |
Technology Access in Blanding
Computing Device Access in Blanding
| Device Type | # Households | % Households |
| Desktop or Laptop | 832 | 76.2% |
| Smartphone | 897 | 82.1% |
| Tablet | 650 | 59.5% |
| No Computing Device | 103 | 9.4% |
| Total | 1,092 | 100.0% |
Internet Access in Blanding
| Internet Type | # Households | % Households |
| Dial-Up Internet | 0 | 0.0% |
| Broadband Home | 704 | 64.5% |
| Cellular Data Only | 94 | 8.6% |
| Satellite Internet | 174 | 15.9% |
| No Internet | 161 | 14.7% |
| Total | 1,092 | 100.0% |
Blanding Summary
Blanding is a city located in San Juan County, Utah, United States. It is the county seat of San Juan County and is located in the southeastern corner of the state. The population was 3,375 at the 2010 census.
History
The area around Blanding was first settled in the late 1800s by Mormon pioneers. The town was originally called Grayson, but was renamed Blanding in honor of William Henry Blanding, a Mormon leader who had served as a missionary in the area. The town was incorporated in 1915.
Geography
Blanding is located at the junction of U.S. Route 191 and State Route 95. It is situated in the Four Corners region of the Colorado Plateau, at an elevation of 5,945 feet (1,813 m). The city is surrounded by the Abajo Mountains to the east and the Blue Mountains to the west.
Economy
The economy of Blanding is largely based on agriculture and tourism. The city is home to several large farms and ranches, as well as a number of small businesses. Tourism is also an important part of the local economy, with visitors coming to the area to explore the nearby national parks and monuments, such as Natural Bridges National Monument, Hovenweep National Monument, and Canyonlands National Park.
Demographics
As of the 2010 census, there were 3,375 people, 1,093 households, and 790 families residing in the city. The population density was 1,093.3 people per square mile (421.7/km2). The racial makeup of the city was 79.2% White, 0.3% African American, 11.2% Native American, 0.3% Asian, 0.1% Pacific Islander, 6.2% from other races, and 2.8% from two or more races. Hispanic or Latino of any race were 11.2% of the population.
There were 1,093 households, out of which 37.2% had children under the age of 18 living with them, 54.2% were married couples living together, 11.7% had a female householder with no husband present, and 28.2% were non-families. 24.2% of all households were made up of individuals, and 9.2% had someone living alone who was 65 years of age or older. The average household size was 2.90 and the average family size was 3.45.
In the city, the population was spread out, with 30.2% under the age of 18, 10.2% from 18 to 24, 24.2% from 25 to 44, 22.7% from 45 to 64, and 12.7% who were 65 years of age or older. The median age was 33 years. For every 100 females, there were 97.2 males. For every 100 females age 18 and over, there were 94.2 males.
The median income for a household in the city was $33,958, and the median income for a family was $38,958. Males had a median income of $30,000 versus $20,000 for females. The per capita income for the city was $14,958. About 11.2% of families and 14.2% of the population were below the poverty line, including 17.2% of those under age 18 and 8.2% of those age 65 or over.
Common Questions
What is Per Capita Income in Blanding?
Per Capita income in Blanding is $28,922.
What is the Median Family Income in Blanding?
Median Family Income in Blanding is $71,250.
What is the Median Household income in Blanding?
Median Household Income in Blanding is $61,833.
What is Income or Wage Gap in Blanding?
Income or Wage Gap in Blanding is 30.9%.
Women in Blanding earn 69.1 cents for every dollar earned by a man.
What is Family Income Deficit in Blanding?
Family Income Deficit in Blanding is $15,013.
Families that are below poverty line in Blanding earn $15,013 less on average than the poverty threshold level.
What is Inequality or Gini Index in Blanding?
Inequality or Gini Index in Blanding is 0.54.
What is the Total Population of Blanding?
Total Population of Blanding is 3,345.
What is the Total Male Population of Blanding?
Total Male Population of Blanding is 1,601.
What is the Total Female Population of Blanding?
Total Female Population of Blanding is 1,744.
What is the Ratio of Males per 100 Females in Blanding?
There are 91.80 Males per 100 Females in Blanding.
What is the Ratio of Females per 100 Males in Blanding?
There are 108.93 Females per 100 Males in Blanding.
What is the Median Population Age in Blanding?
Median Population Age in Blanding is 30.3 Years.
What is the Average Family Size in Blanding
Average Family Size in Blanding is 3.5 People.
What is the Average Household Size in Blanding
Average Household Size in Blanding is 2.9 People.
How Large is the Labor Force in Blanding?
There are 1,324 People in the Labor Forcein in Blanding.
What is the Percentage of People in the Labor Force in Blanding?
57.0% of People are in the Labor Force in Blanding.
What is the Unemployment Rate in Blanding?
Unemployment Rate in Blanding is 2.1%.