Fort Bliss, TX Map & Demographics
Fort Bliss Map
Fort Bliss Overview
$22,181
PER CAPITA INCOME
$57,754
AVG FAMILY INCOME
$57,283
AVG HOUSEHOLD INCOME
35.0%
WAGE / INCOME GAP [ % ]
65.0¢/ $1
WAGE / INCOME GAP [ $ ]
$10,212
FAMILY INCOME DEFICIT
0.34
INEQUALITY / GINI INDEX
12,511
TOTAL POPULATION
7,734
MALE POPULATION
4,777
FEMALE POPULATION
161.90
MALES / 100 FEMALES
61.77
FEMALES / 100 MALES
21.9
MEDIAN AGE
4.0
AVG FAMILY SIZE
3.8
AVG HOUSEHOLD SIZE
6,531
LABOR FORCE [ PEOPLE ]
76.5%
PERCENT IN LABOR FORCE
9.0%
UNEMPLOYMENT RATE
Fort Bliss Area Codes
Income in Fort Bliss
Income Overview in Fort Bliss
Per Capita Income in Fort Bliss is $22,181, while median incomes of families and households are $57,754 and $57,283 respectively.
| Characteristic | Number | Measure |
| Per Capita Income | 12,511 | $22,181 |
| Median Family Income | 2,172 | $57,754 |
| Mean Family Income | 2,172 | $68,190 |
| Median Household Income | 2,282 | $57,283 |
| Mean Household Income | 2,282 | $66,624 |
| Income Deficit | 2,172 | $10,212 |
| Wage / Income Gap (%) | 12,511 | 35.02% |
| Wage / Income Gap ($) | 12,511 | 64.98¢ per $1 |
| Gini / Inequality Index | 12,511 | 0.34 |
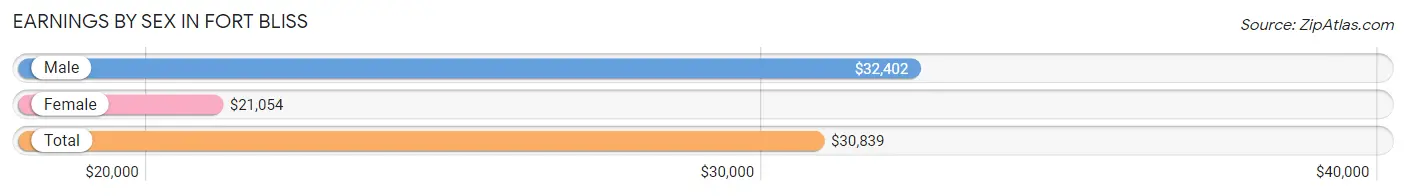
Earnings by Sex in Fort Bliss
Average Earnings in Fort Bliss are $30,839, $32,402 for men and $21,054 for women, a difference of 35.0%.
| Sex | Number | Average Earnings |
| Male | 5,487 (80.9%) | $32,402 |
| Female | 1,291 (19.1%) | $21,054 |
| Total | 6,778 (100.0%) | $30,839 |
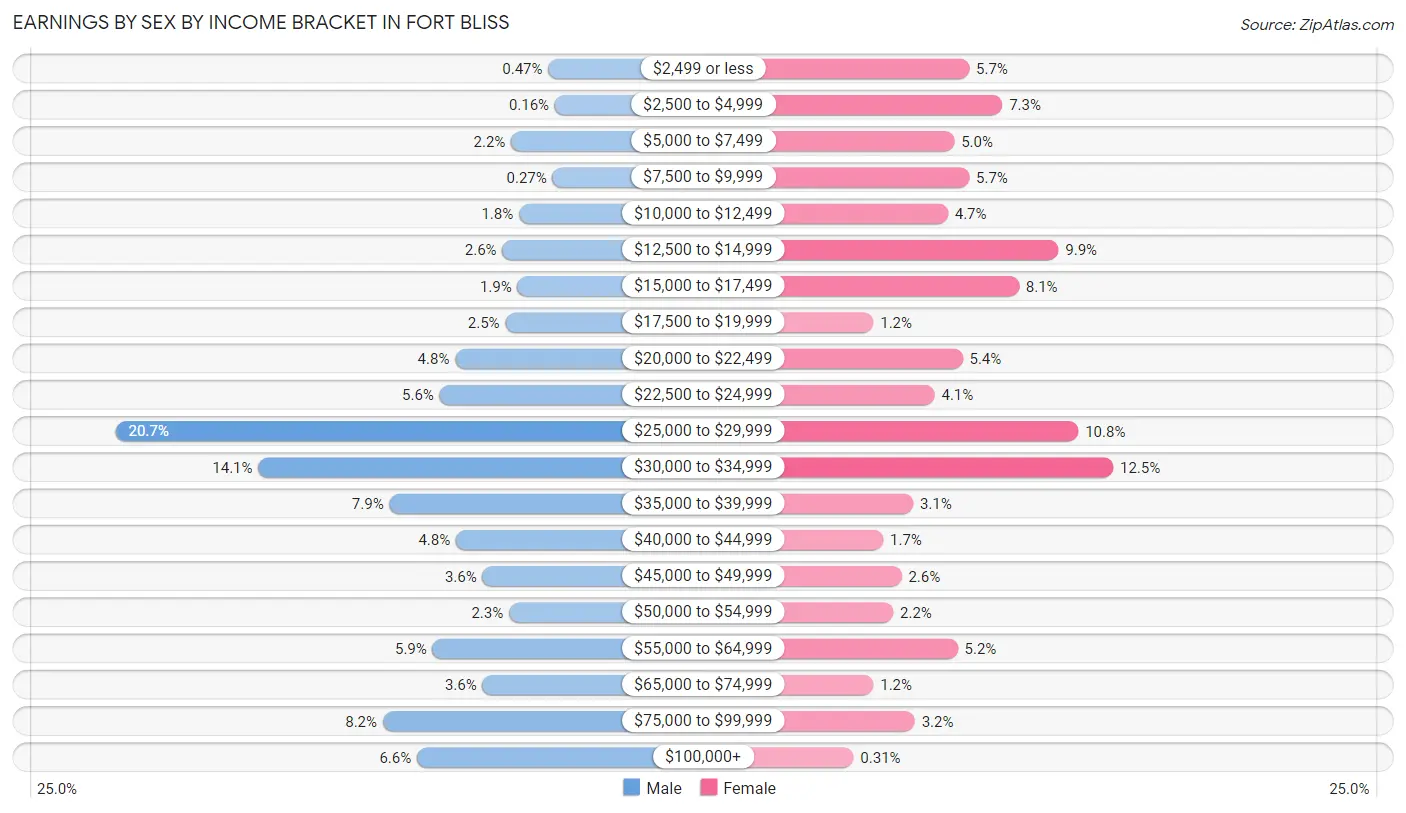
Earnings by Sex by Income Bracket in Fort Bliss
The most common earnings brackets in Fort Bliss are $25,000 to $29,999 for men (1,138 | 20.7%) and $30,000 to $34,999 for women (161 | 12.5%).
| Income | Male | Female |
| $2,499 or less | 26 (0.5%) | 74 (5.7%) |
| $2,500 to $4,999 | 9 (0.2%) | 94 (7.3%) |
| $5,000 to $7,499 | 121 (2.2%) | 65 (5.0%) |
| $7,500 to $9,999 | 15 (0.3%) | 74 (5.7%) |
| $10,000 to $12,499 | 101 (1.8%) | 61 (4.7%) |
| $12,500 to $14,999 | 144 (2.6%) | 128 (9.9%) |
| $15,000 to $17,499 | 105 (1.9%) | 104 (8.1%) |
| $17,500 to $19,999 | 136 (2.5%) | 16 (1.2%) |
| $20,000 to $22,499 | 265 (4.8%) | 70 (5.4%) |
| $22,500 to $24,999 | 305 (5.6%) | 53 (4.1%) |
| $25,000 to $29,999 | 1,138 (20.7%) | 140 (10.8%) |
| $30,000 to $34,999 | 771 (14.1%) | 161 (12.5%) |
| $35,000 to $39,999 | 434 (7.9%) | 40 (3.1%) |
| $40,000 to $44,999 | 263 (4.8%) | 22 (1.7%) |
| $45,000 to $49,999 | 195 (3.5%) | 33 (2.6%) |
| $50,000 to $54,999 | 127 (2.3%) | 28 (2.2%) |
| $55,000 to $64,999 | 323 (5.9%) | 67 (5.2%) |
| $65,000 to $74,999 | 195 (3.5%) | 16 (1.2%) |
| $75,000 to $99,999 | 451 (8.2%) | 41 (3.2%) |
| $100,000+ | 363 (6.6%) | 4 (0.3%) |
| Total | 5,487 (100.0%) | 1,291 (100.0%) |
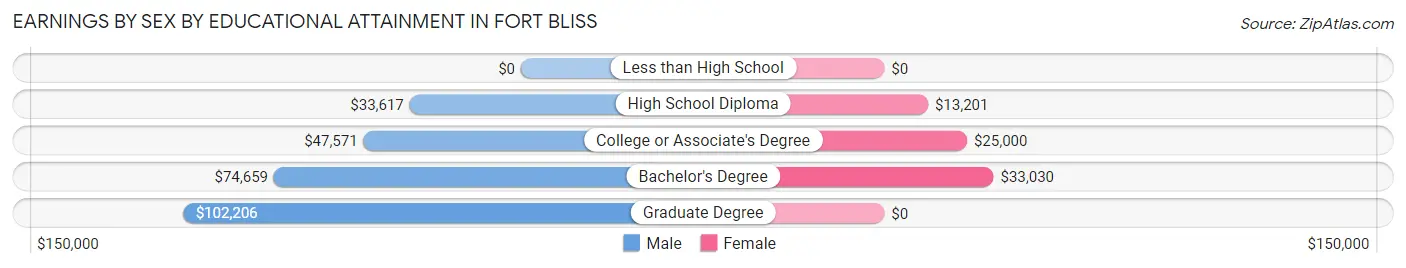
Earnings by Sex by Educational Attainment in Fort Bliss
Average earnings in Fort Bliss are $53,244 for men and $21,806 for women, a difference of 59.1%. Men with an educational attainment of graduate degree enjoy the highest average annual earnings of $102,206, while those with high school diploma education earn the least with $33,617. Women with an educational attainment of bachelor's degree earn the most with the average annual earnings of $33,030, while those with high school diploma education have the smallest earnings of $13,201.
| Educational Attainment | Male Income | Female Income |
| Less than High School | - | - |
| High School Diploma | $33,617 | $13,201 |
| College or Associate's Degree | $47,571 | $25,000 |
| Bachelor's Degree | $74,659 | $33,030 |
| Graduate Degree | $102,206 | $0 |
| Total | $53,244 | $21,806 |
Family Income in Fort Bliss
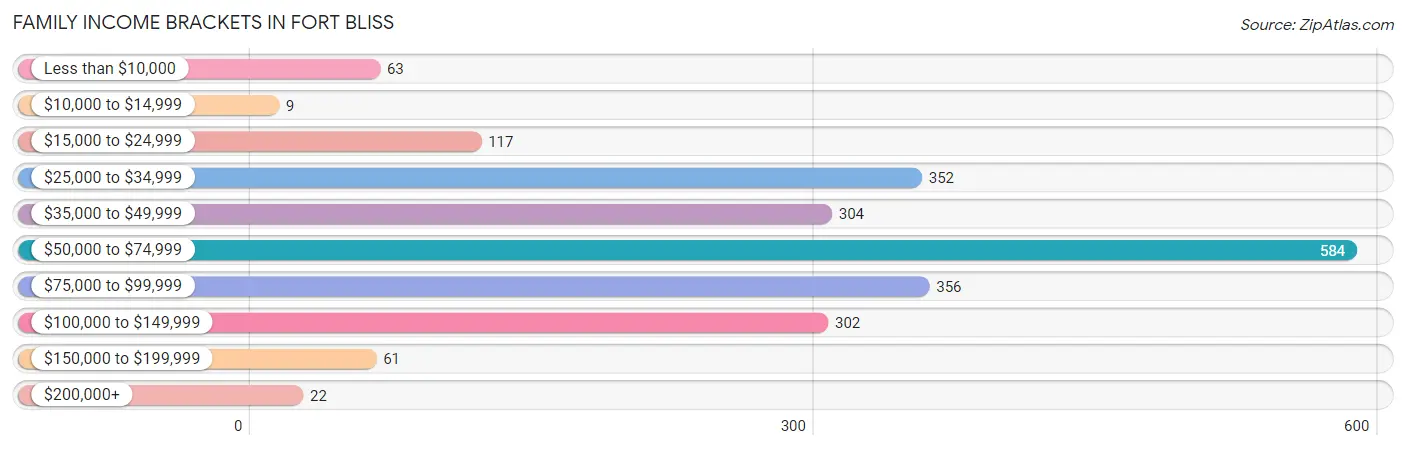
Family Income Brackets in Fort Bliss
According to the Fort Bliss family income data, there are 584 families falling into the $50,000 to $74,999 income range, which is the most common income bracket and makes up 26.9% of all families. Conversely, the $10,000 to $14,999 income bracket is the least frequent group with only 9 families (0.4%) belonging to this category.
| Income Bracket | # Families | % Families |
| Less than $10,000 | 63 | 2.9% |
| $10,000 to $14,999 | 9 | 0.4% |
| $15,000 to $24,999 | 117 | 5.4% |
| $25,000 to $34,999 | 352 | 16.2% |
| $35,000 to $49,999 | 304 | 14.0% |
| $50,000 to $74,999 | 584 | 26.9% |
| $75,000 to $99,999 | 356 | 16.4% |
| $100,000 to $149,999 | 302 | 13.9% |
| $150,000 to $199,999 | 61 | 2.8% |
| $200,000+ | 22 | 1.0% |
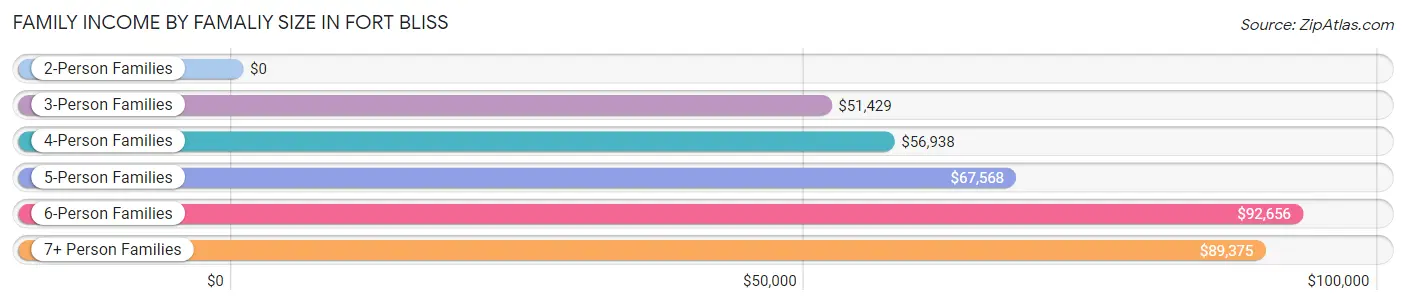
Family Income by Famaliy Size in Fort Bliss
6-person families (104 | 4.8%) account for the highest median family income in Fort Bliss with $92,656 per family, while 3-person families (396 | 18.2%) have the highest median income of $17,143 per family member.
| Income Bracket | # Families | Median Income |
| 2-Person Families | 326 (15.0%) | $0 |
| 3-Person Families | 396 (18.2%) | $51,429 |
| 4-Person Families | 925 (42.6%) | $56,938 |
| 5-Person Families | 382 (17.6%) | $67,568 |
| 6-Person Families | 104 (4.8%) | $92,656 |
| 7+ Person Families | 39 (1.8%) | $89,375 |
| Total | 2,172 (100.0%) | $57,754 |
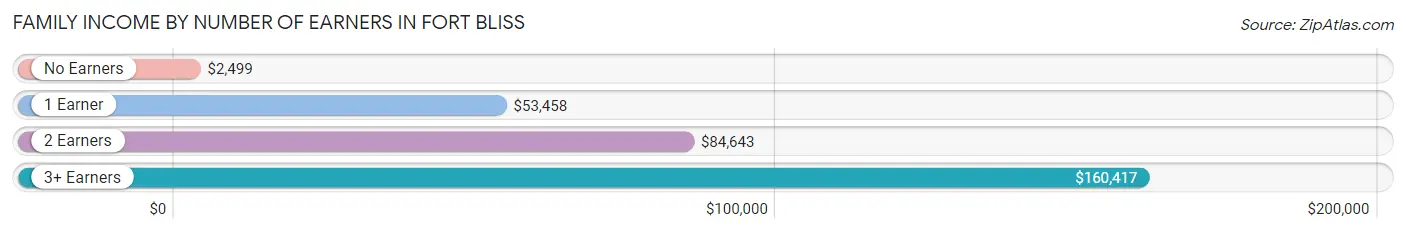
Family Income by Number of Earners in Fort Bliss
The median family income in Fort Bliss is $57,754, with families comprising 3+ earners (46) having the highest median family income of $160,417, while families with no earners (60) have the lowest median family income of $2,499, accounting for 2.1% and 2.8% of families, respectively.
| Number of Earners | # Families | Median Income |
| No Earners | 60 (2.8%) | $2,499 |
| 1 Earner | 1,314 (60.5%) | $53,458 |
| 2 Earners | 752 (34.6%) | $84,643 |
| 3+ Earners | 46 (2.1%) | $160,417 |
| Total | 2,172 (100.0%) | $57,754 |
Household Income in Fort Bliss
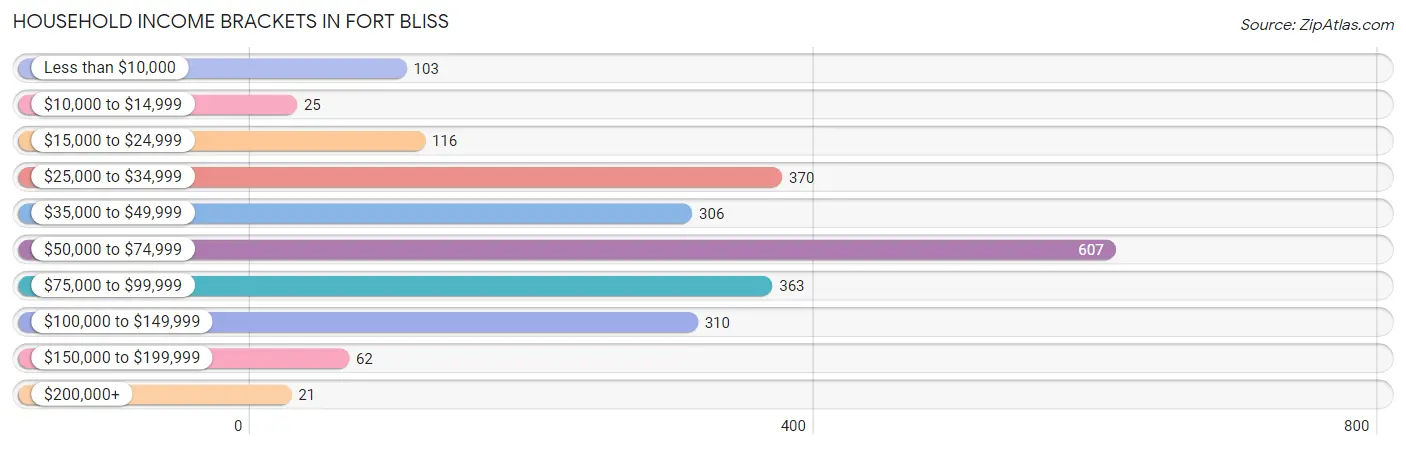
Household Income Brackets in Fort Bliss
With 607 households falling in the category, the $50,000 to $74,999 income range is the most frequent in Fort Bliss, accounting for 26.6% of all households. In contrast, only 21 households (0.9%) fall into the $200,000+ income bracket, making it the least populous group.
| Income Bracket | # Households | % Households |
| Less than $10,000 | 103 | 4.5% |
| $10,000 to $14,999 | 25 | 1.1% |
| $15,000 to $24,999 | 116 | 5.1% |
| $25,000 to $34,999 | 370 | 16.2% |
| $35,000 to $49,999 | 306 | 13.4% |
| $50,000 to $74,999 | 607 | 26.6% |
| $75,000 to $99,999 | 363 | 15.9% |
| $100,000 to $149,999 | 310 | 13.6% |
| $150,000 to $199,999 | 62 | 2.7% |
| $200,000+ | 21 | 0.9% |
Household Income by Householder Age in Fort Bliss
The median household income in Fort Bliss is $57,283, with the highest median household income of $97,778 found in the 45 to 64 years age bracket for the primary householder. A total of 214 households (9.4%) fall into this category. Meanwhile, the 65+ years age bracket for the primary householder has the lowest median household income of $0, with 10 households (0.4%) in this group.
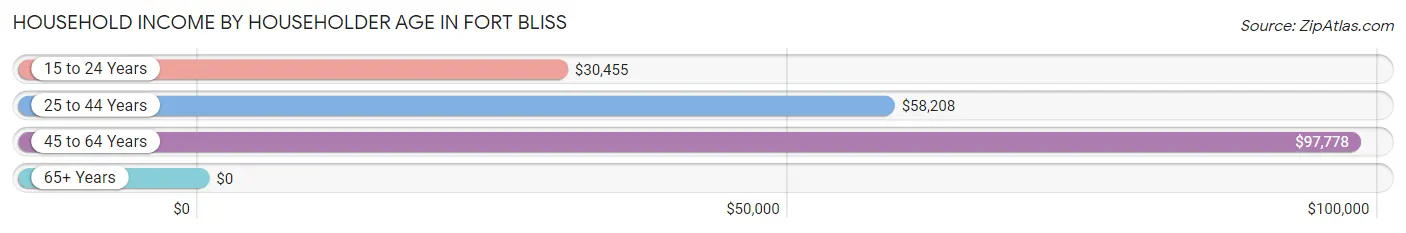
| Income Bracket | # Households | Median Income |
| 15 to 24 Years | 338 (14.8%) | $30,455 |
| 25 to 44 Years | 1,720 (75.4%) | $58,208 |
| 45 to 64 Years | 214 (9.4%) | $97,778 |
| 65+ Years | 10 (0.4%) | $0 |
| Total | 2,282 (100.0%) | $57,283 |
Poverty in Fort Bliss
Income Below Poverty by Sex and Age in Fort Bliss
With 11.5% poverty level for males and 14.6% for females among the residents of Fort Bliss, 5 year old males and 5 year old females are the most vulnerable to poverty, with 74 males (28.8%) and 45 females (35.2%) in their respective age groups living below the poverty level.
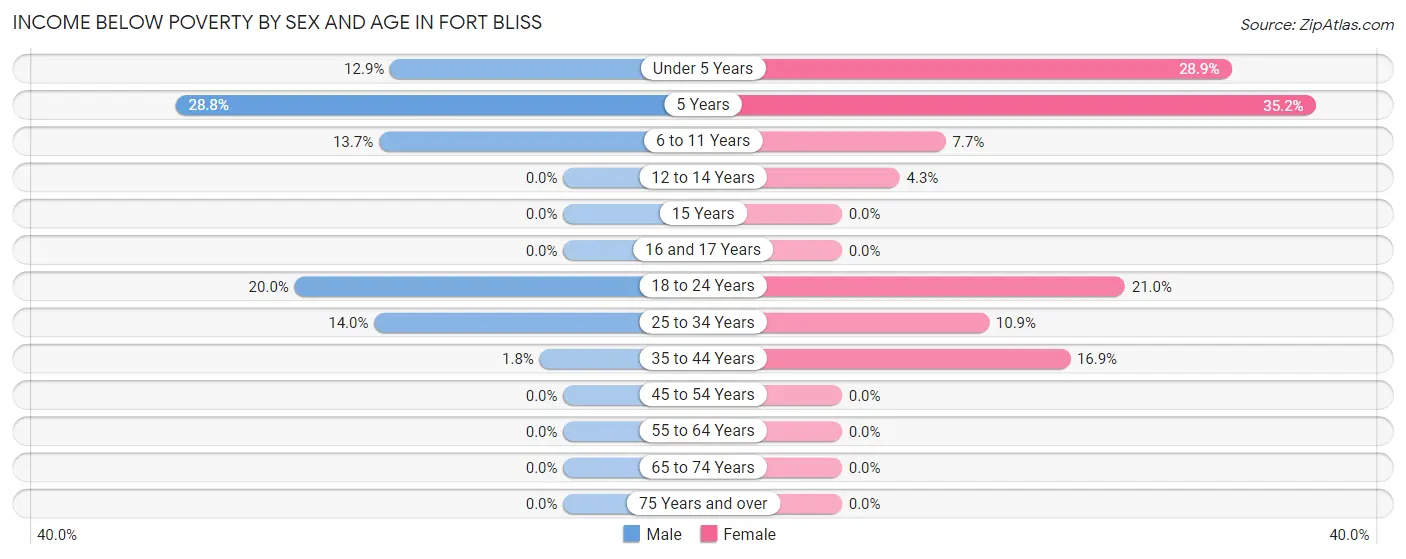
| Age Bracket | Male | Female |
| Under 5 Years | 97 (12.9%) | 231 (28.9%) |
| 5 Years | 74 (28.8%) | 45 (35.2%) |
| 6 to 11 Years | 96 (13.7%) | 57 (7.7%) |
| 12 to 14 Years | 0 (0.0%) | 14 (4.3%) |
| 15 Years | 0 (0.0%) | 0 (0.0%) |
| 16 and 17 Years | 0 (0.0%) | 0 (0.0%) |
| 18 to 24 Years | 82 (20.0%) | 100 (21.0%) |
| 25 to 34 Years | 141 (14.0%) | 97 (10.9%) |
| 35 to 44 Years | 12 (1.8%) | 93 (16.9%) |
| 45 to 54 Years | 0 (0.0%) | 0 (0.0%) |
| 55 to 64 Years | 0 (0.0%) | 0 (0.0%) |
| 65 to 74 Years | 0 (0.0%) | 0 (0.0%) |
| 75 Years and over | 0 (0.0%) | 0 (0.0%) |
| Total | 502 (11.5%) | 637 (14.6%) |
Income Above Poverty by Sex and Age in Fort Bliss
According to the poverty statistics in Fort Bliss, males aged 12 to 14 years and females aged 15 years are the age groups that are most secure financially, with 100.0% of males and 100.0% of females in these age groups living above the poverty line.
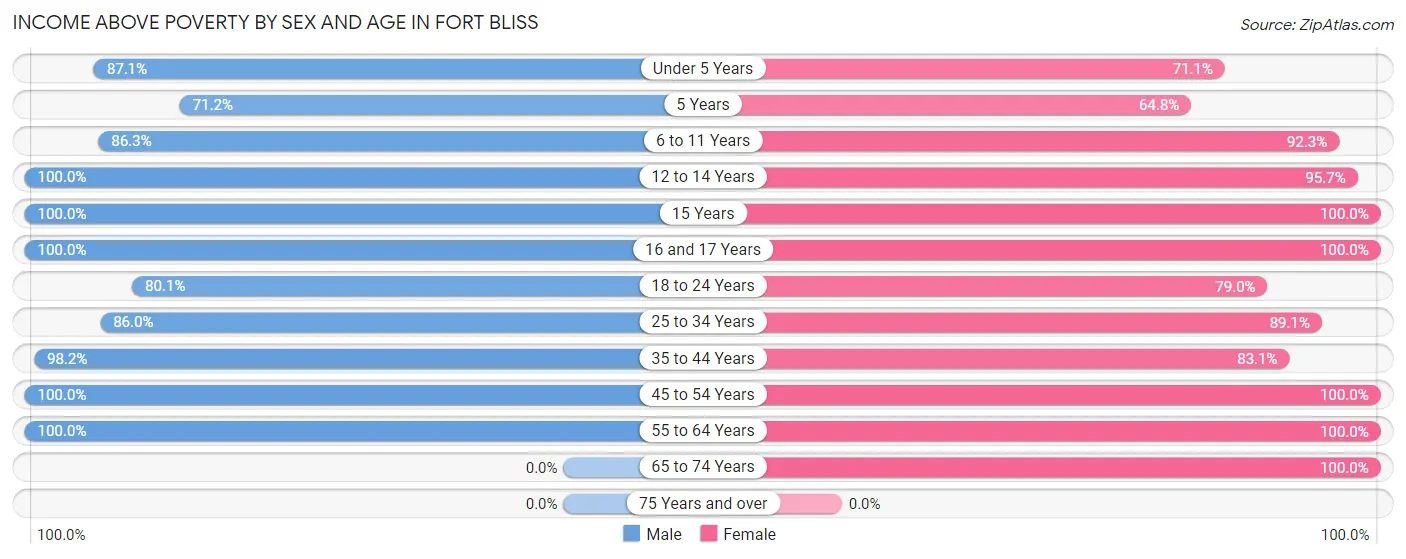
| Age Bracket | Male | Female |
| Under 5 Years | 657 (87.1%) | 568 (71.1%) |
| 5 Years | 183 (71.2%) | 83 (64.8%) |
| 6 to 11 Years | 605 (86.3%) | 683 (92.3%) |
| 12 to 14 Years | 187 (100.0%) | 312 (95.7%) |
| 15 Years | 56 (100.0%) | 26 (100.0%) |
| 16 and 17 Years | 114 (100.0%) | 127 (100.0%) |
| 18 to 24 Years | 329 (80.0%) | 376 (79.0%) |
| 25 to 34 Years | 863 (86.0%) | 791 (89.1%) |
| 35 to 44 Years | 668 (98.2%) | 456 (83.1%) |
| 45 to 54 Years | 181 (100.0%) | 213 (100.0%) |
| 55 to 64 Years | 31 (100.0%) | 66 (100.0%) |
| 65 to 74 Years | 0 (0.0%) | 12 (100.0%) |
| 75 Years and over | 0 (0.0%) | 0 (0.0%) |
| Total | 3,874 (88.5%) | 3,713 (85.4%) |
Income Below Poverty Among Married-Couple Families in Fort Bliss
The poverty statistics for married-couple families in Fort Bliss show that 9.6% or 197 of the total 2,054 families live below the poverty line. Families with 3 or 4 children have the highest poverty rate of 19.7%, comprising of 93 families. On the other hand, families with 5 or more children have the lowest poverty rate of 0.0%, which includes 0 families.
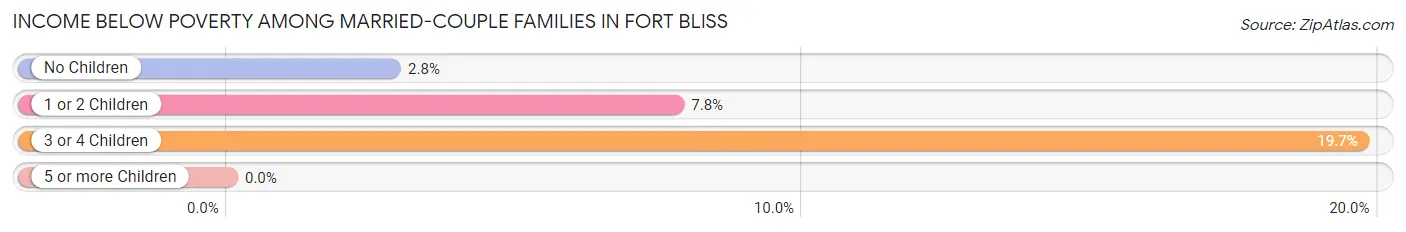
| Children | Above Poverty | Below Poverty |
| No Children | 342 (97.2%) | 10 (2.8%) |
| 1 or 2 Children | 1,116 (92.2%) | 94 (7.8%) |
| 3 or 4 Children | 379 (80.3%) | 93 (19.7%) |
| 5 or more Children | 20 (100.0%) | 0 (0.0%) |
| Total | 1,857 (90.4%) | 197 (9.6%) |
Income Below Poverty Among Single-Parent Households in Fort Bliss
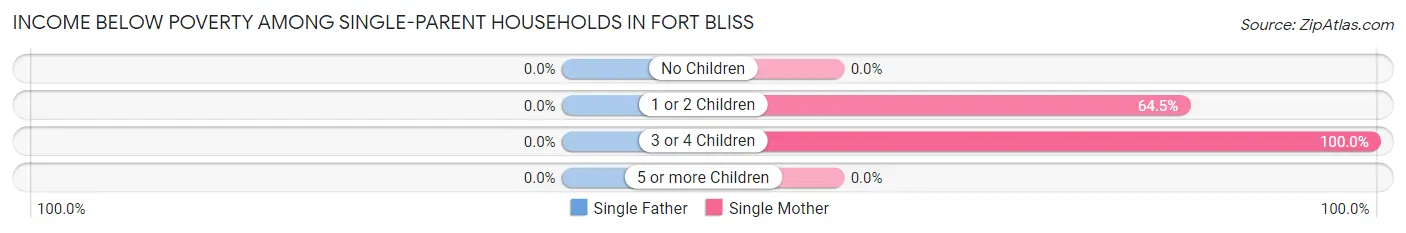
| Children | Single Father | Single Mother |
| No Children | 0 (0.0%) | 0 (0.0%) |
| 1 or 2 Children | 0 (0.0%) | 60 (64.5%) |
| 3 or 4 Children | 0 (0.0%) | 4 (100.0%) |
| 5 or more Children | 0 (0.0%) | 0 (0.0%) |
| Total | 0 (0.0%) | 64 (66.0%) |
Income Below Poverty Among Married-Couple vs Single-Parent Households in Fort Bliss
The poverty data for Fort Bliss shows that 197 of the married-couple family households (9.6%) and 64 of the single-parent households (54.2%) are living below the poverty level. Within the married-couple family households, those with 3 or 4 children have the highest poverty rate, with 93 households (19.7%) falling below the poverty line. Among the single-parent households, those with 3 or 4 children have the highest poverty rate, with 4 household (100.0%) living below poverty.
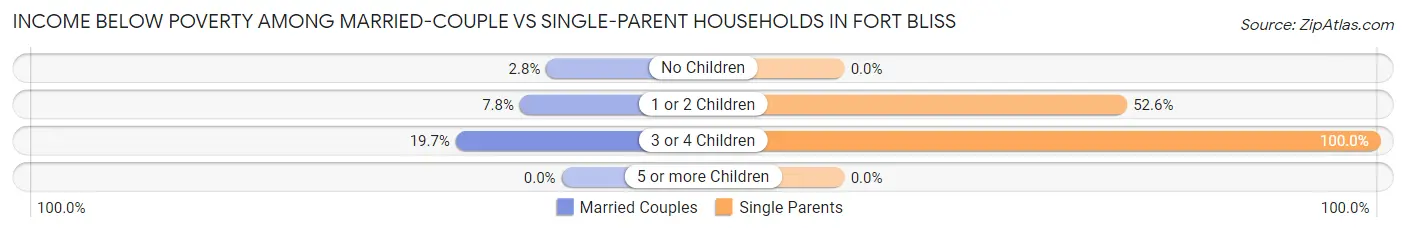
| Children | Married-Couple Families | Single-Parent Households |
| No Children | 10 (2.8%) | 0 (0.0%) |
| 1 or 2 Children | 94 (7.8%) | 60 (52.6%) |
| 3 or 4 Children | 93 (19.7%) | 4 (100.0%) |
| 5 or more Children | 0 (0.0%) | 0 (0.0%) |
| Total | 197 (9.6%) | 64 (54.2%) |
Race in Fort Bliss
The most populous races in Fort Bliss are White / Caucasian (7,286 | 58.2%), Hispanic or Latino (2,937 | 23.5%), and Black / African American (2,061 | 16.5%).
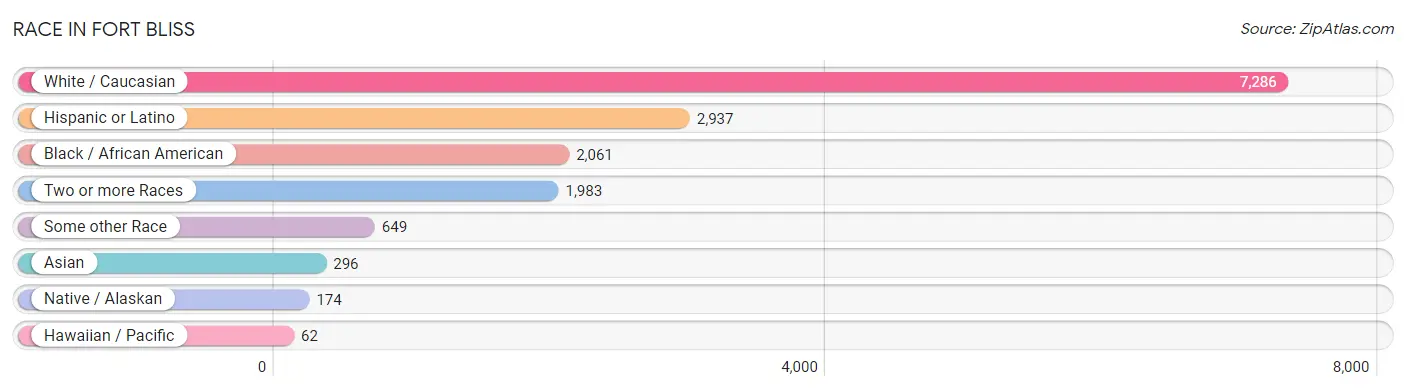
| Race | # Population | % Population |
| Asian | 296 | 2.4% |
| Black / African American | 2,061 | 16.5% |
| Hawaiian / Pacific | 62 | 0.5% |
| Hispanic or Latino | 2,937 | 23.5% |
| Native / Alaskan | 174 | 1.4% |
| White / Caucasian | 7,286 | 58.2% |
| Two or more Races | 1,983 | 15.9% |
| Some other Race | 649 | 5.2% |
| Total | 12,511 | 100.0% |
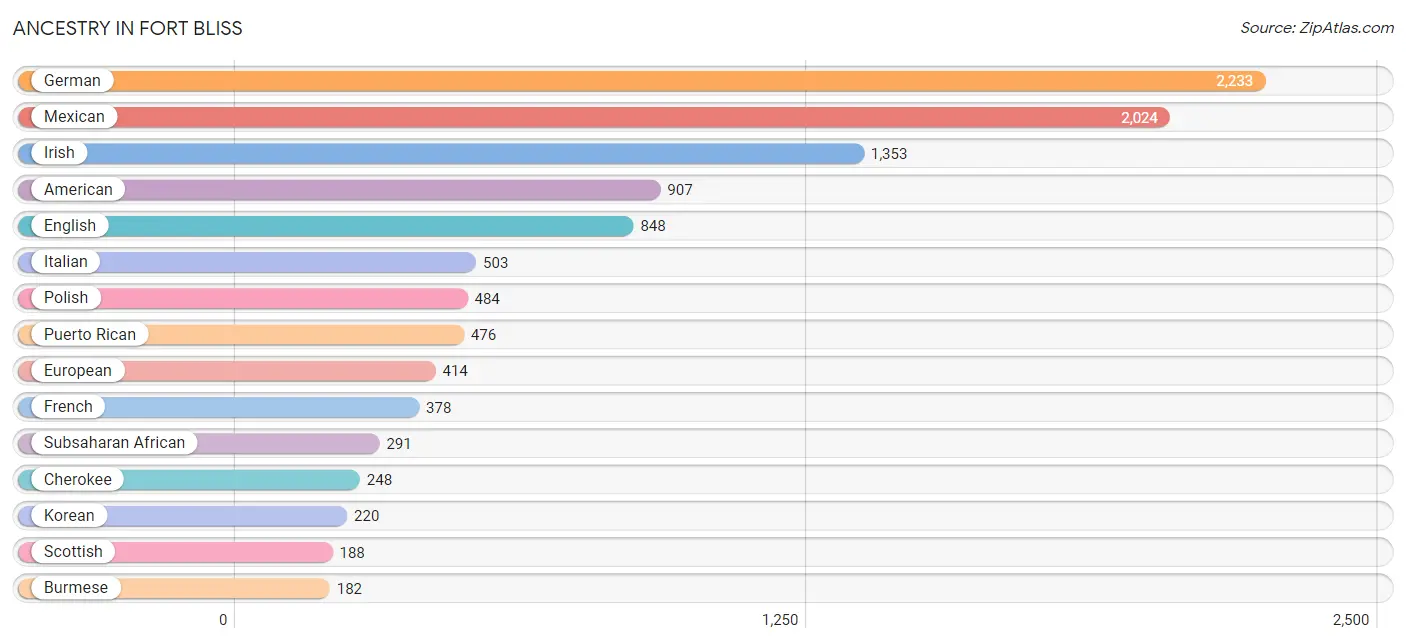
Ancestry in Fort Bliss
The most populous ancestries reported in Fort Bliss are German (2,233 | 17.8%), Mexican (2,024 | 16.2%), Irish (1,353 | 10.8%), American (907 | 7.2%), and English (848 | 6.8%), together accounting for 58.9% of all Fort Bliss residents.
| Ancestry | # Population | % Population |
| African | 80 | 0.6% |
| American | 907 | 7.2% |
| Apache | 18 | 0.1% |
| Arab | 51 | 0.4% |
| Austrian | 6 | 0.1% |
| Bangladeshi | 48 | 0.4% |
| Belgian | 16 | 0.1% |
| Belizean | 20 | 0.2% |
| Bhutanese | 102 | 0.8% |
| Blackfeet | 6 | 0.1% |
| Brazilian | 6 | 0.1% |
| British | 7 | 0.1% |
| Burmese | 182 | 1.5% |
| Central American | 182 | 1.5% |
| Central American Indian | 55 | 0.4% |
| Cherokee | 248 | 2.0% |
| Chickasaw | 28 | 0.2% |
| Choctaw | 6 | 0.1% |
| Colombian | 96 | 0.8% |
| Costa Rican | 83 | 0.7% |
| Cuban | 33 | 0.3% |
| Czech | 3 | 0.0% |
| Czechoslovakian | 4 | 0.0% |
| Dominican | 11 | 0.1% |
| Dutch | 27 | 0.2% |
| Eastern European | 15 | 0.1% |
| English | 848 | 6.8% |
| European | 414 | 3.3% |
| Finnish | 20 | 0.2% |
| French | 378 | 3.0% |
| French Canadian | 7 | 0.1% |
| German | 2,233 | 17.8% |
| Guamanian / Chamorro | 70 | 0.6% |
| Guatemalan | 80 | 0.6% |
| Haitian | 34 | 0.3% |
| Honduran | 12 | 0.1% |
| Hungarian | 13 | 0.1% |
| Indian (Asian) | 104 | 0.8% |
| Irish | 1,353 | 10.8% |
| Italian | 503 | 4.0% |
| Jamaican | 93 | 0.7% |
| Kenyan | 29 | 0.2% |
| Korean | 220 | 1.8% |
| Latvian | 5 | 0.0% |
| Lebanese | 51 | 0.4% |
| Liberian | 89 | 0.7% |
| Lumbee | 5 | 0.0% |
| Luxembourger | 11 | 0.1% |
| Mexican | 2,024 | 16.2% |
| Native Hawaiian | 31 | 0.3% |
| Navajo | 14 | 0.1% |
| Nigerian | 88 | 0.7% |
| Norwegian | 87 | 0.7% |
| Polish | 484 | 3.9% |
| Portuguese | 92 | 0.7% |
| Puerto Rican | 476 | 3.8% |
| Russian | 16 | 0.1% |
| Salvadoran | 7 | 0.1% |
| Samoan | 73 | 0.6% |
| Scandinavian | 17 | 0.1% |
| Scotch-Irish | 48 | 0.4% |
| Scottish | 188 | 1.5% |
| Slovak | 25 | 0.2% |
| South African | 5 | 0.0% |
| South American | 105 | 0.8% |
| Spaniard | 23 | 0.2% |
| Sri Lankan | 28 | 0.2% |
| Subsaharan African | 291 | 2.3% |
| Swedish | 70 | 0.6% |
| Swiss | 15 | 0.1% |
| Venezuelan | 9 | 0.1% |
| Welsh | 20 | 0.2% |
| Yuman | 31 | 0.3% | View All 73 Rows |
Immigrants in Fort Bliss
The most numerous immigrant groups reported in Fort Bliss came from Latin America (374 | 3.0%), Central America (184 | 1.5%), Mexico (174 | 1.4%), Asia (167 | 1.3%), and Caribbean (140 | 1.1%), together accounting for 8.3% of all Fort Bliss residents.
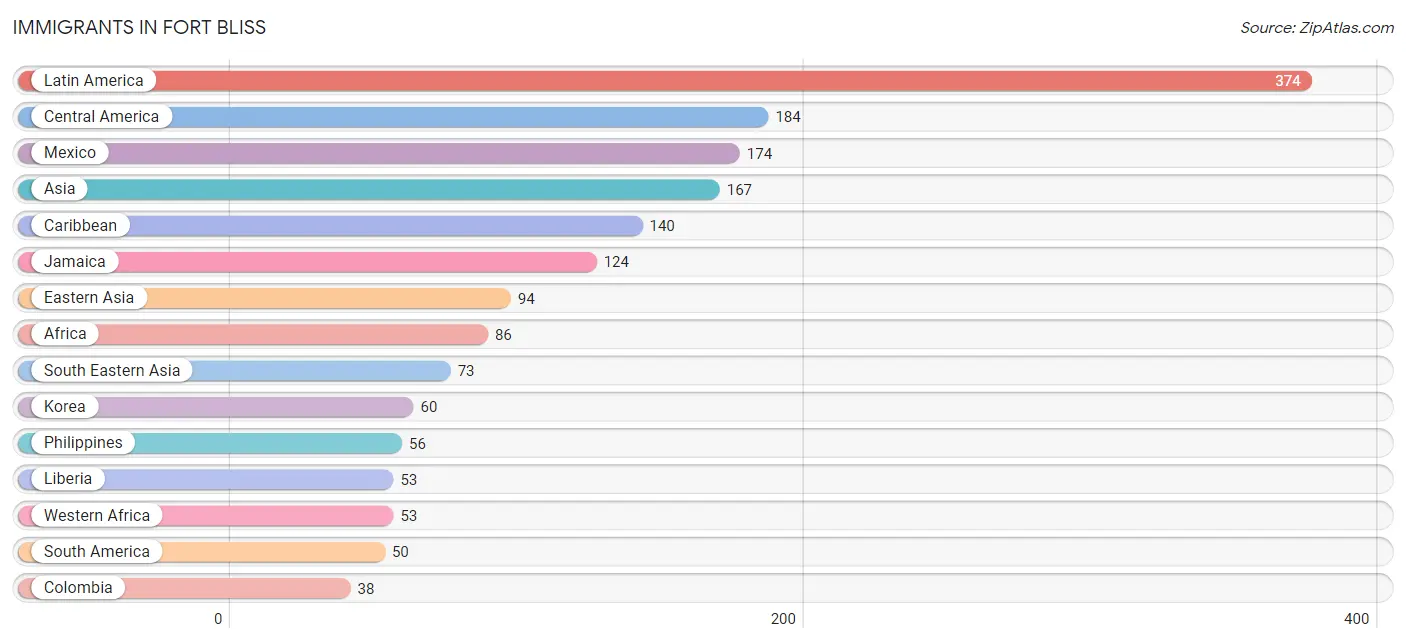
| Immigration Origin | # Population | % Population |
| Africa | 86 | 0.7% |
| Asia | 167 | 1.3% |
| Belize | 10 | 0.1% |
| Caribbean | 140 | 1.1% |
| Central America | 184 | 1.5% |
| China | 27 | 0.2% |
| Colombia | 38 | 0.3% |
| Cuba | 11 | 0.1% |
| Eastern Africa | 33 | 0.3% |
| Eastern Asia | 94 | 0.7% |
| Europe | 11 | 0.1% |
| Germany | 11 | 0.1% |
| Guyana | 12 | 0.1% |
| Hong Kong | 13 | 0.1% |
| Jamaica | 124 | 1.0% |
| Japan | 7 | 0.1% |
| Kenya | 33 | 0.3% |
| Korea | 60 | 0.5% |
| Latin America | 374 | 3.0% |
| Liberia | 53 | 0.4% |
| Mexico | 174 | 1.4% |
| Micronesia | 15 | 0.1% |
| Oceania | 15 | 0.1% |
| Philippines | 56 | 0.4% |
| South America | 50 | 0.4% |
| South Eastern Asia | 73 | 0.6% |
| Thailand | 13 | 0.1% |
| Vietnam | 4 | 0.0% |
| Western Africa | 53 | 0.4% |
| Western Europe | 11 | 0.1% | View All 30 Rows |
Sex and Age in Fort Bliss
Sex and Age in Fort Bliss
The most populous age groups in Fort Bliss are 20 to 24 Years (2,198 | 28.4%) for men and Under 5 Years (799 | 16.7%) for women.
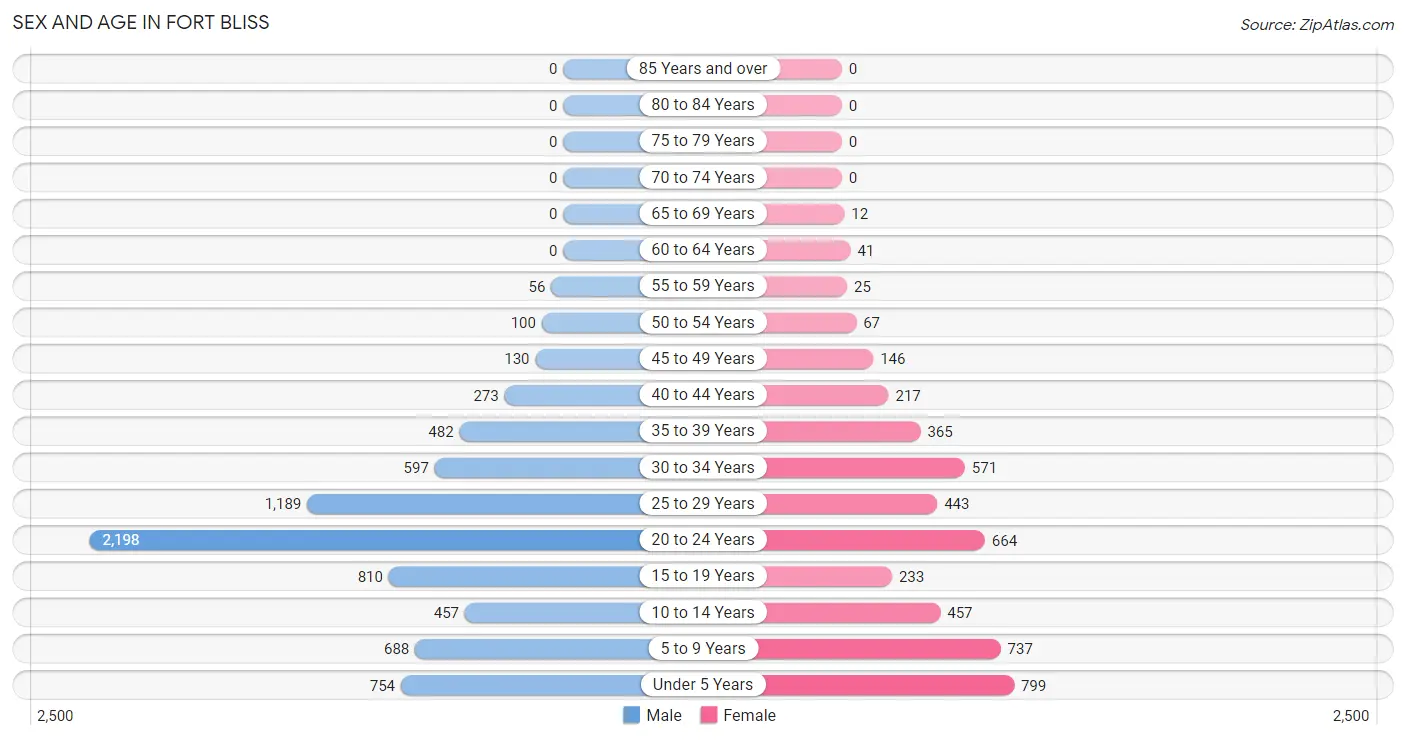
| Age Bracket | Male | Female |
| Under 5 Years | 754 (9.8%) | 799 (16.7%) |
| 5 to 9 Years | 688 (8.9%) | 737 (15.4%) |
| 10 to 14 Years | 457 (5.9%) | 457 (9.6%) |
| 15 to 19 Years | 810 (10.5%) | 233 (4.9%) |
| 20 to 24 Years | 2,198 (28.4%) | 664 (13.9%) |
| 25 to 29 Years | 1,189 (15.4%) | 443 (9.3%) |
| 30 to 34 Years | 597 (7.7%) | 571 (11.9%) |
| 35 to 39 Years | 482 (6.2%) | 365 (7.6%) |
| 40 to 44 Years | 273 (3.5%) | 217 (4.5%) |
| 45 to 49 Years | 130 (1.7%) | 146 (3.1%) |
| 50 to 54 Years | 100 (1.3%) | 67 (1.4%) |
| 55 to 59 Years | 56 (0.7%) | 25 (0.5%) |
| 60 to 64 Years | 0 (0.0%) | 41 (0.9%) |
| 65 to 69 Years | 0 (0.0%) | 12 (0.3%) |
| 70 to 74 Years | 0 (0.0%) | 0 (0.0%) |
| 75 to 79 Years | 0 (0.0%) | 0 (0.0%) |
| 80 to 84 Years | 0 (0.0%) | 0 (0.0%) |
| 85 Years and over | 0 (0.0%) | 0 (0.0%) |
| Total | 7,734 (100.0%) | 4,777 (100.0%) |
Families and Households in Fort Bliss
Median Family Size in Fort Bliss
The median family size in Fort Bliss is 3.97 persons per family, with married-couple families (2,054 | 94.6%) accounting for the largest median family size of 3.99 persons per family. On the other hand, single female/mother families (97 | 4.5%) represent the smallest median family size with 3.46 persons per family.
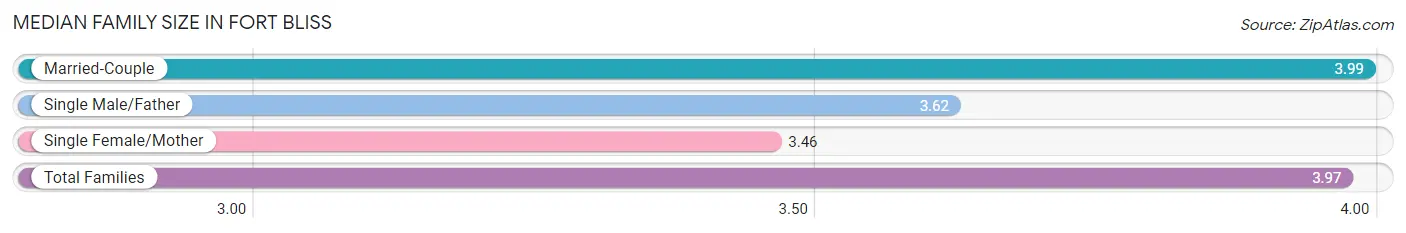
| Family Type | # Families | Family Size |
| Married-Couple | 2,054 (94.6%) | 3.99 |
| Single Male/Father | 21 (1.0%) | 3.62 |
| Single Female/Mother | 97 (4.5%) | 3.46 |
| Total Families | 2,172 (100.0%) | 3.97 |
Median Household Size in Fort Bliss
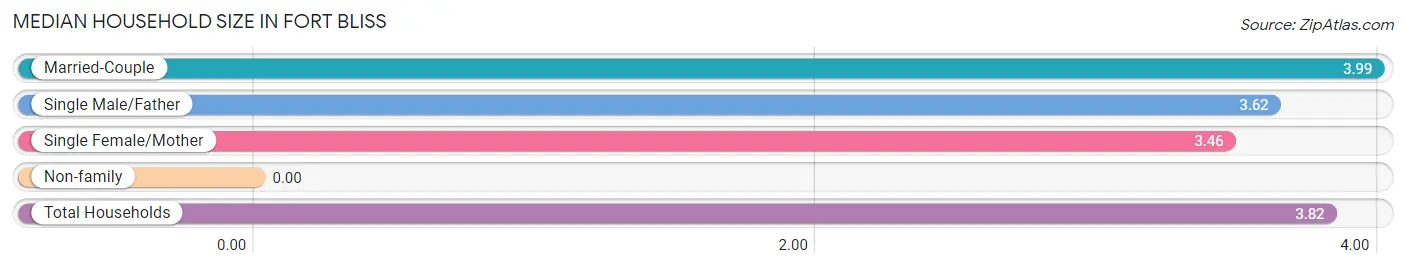
| Household Type | # Households | Household Size |
| Married-Couple | 2,054 (90.0%) | 3.99 |
| Single Male/Father | 21 (0.9%) | 3.62 |
| Single Female/Mother | 97 (4.3%) | 3.46 |
| Non-family | 110 (4.8%) | - |
| Total Households | 2,282 (100.0%) | 3.82 |
Household Size by Marriage Status in Fort Bliss
Out of a total of 2,282 households in Fort Bliss, 2,172 (95.2%) are family households, while 110 (4.8%) are nonfamily households. The most numerous type of family households are 4-person households, comprising 925, and the most common type of nonfamily households are 1-person households, comprising 110.
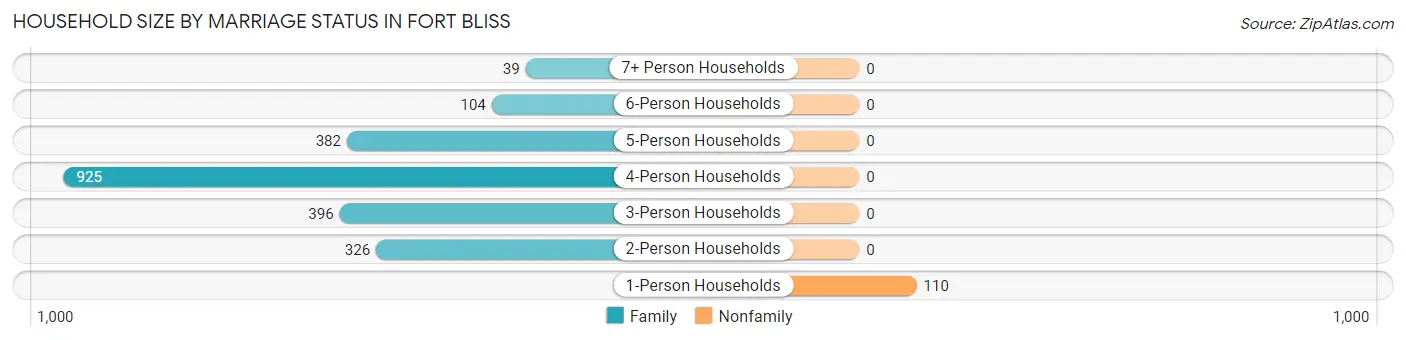
| Household Size | Family Households | Nonfamily Households |
| 1-Person Households | - | 110 (4.8%) |
| 2-Person Households | 326 (14.3%) | 0 (0.0%) |
| 3-Person Households | 396 (17.3%) | 0 (0.0%) |
| 4-Person Households | 925 (40.5%) | 0 (0.0%) |
| 5-Person Households | 382 (16.7%) | 0 (0.0%) |
| 6-Person Households | 104 (4.6%) | 0 (0.0%) |
| 7+ Person Households | 39 (1.7%) | 0 (0.0%) |
| Total | 2,172 (95.2%) | 110 (4.8%) |
Female Fertility in Fort Bliss
Fertility by Age in Fort Bliss
Average fertility rate in Fort Bliss is 86.0 births per 1,000 women. Women in the age bracket of 20 to 34 years have the highest fertility rate with 125.0 births per 1,000 women. Women in the age bracket of 20 to 34 years acount for 91.3% of all women with births.
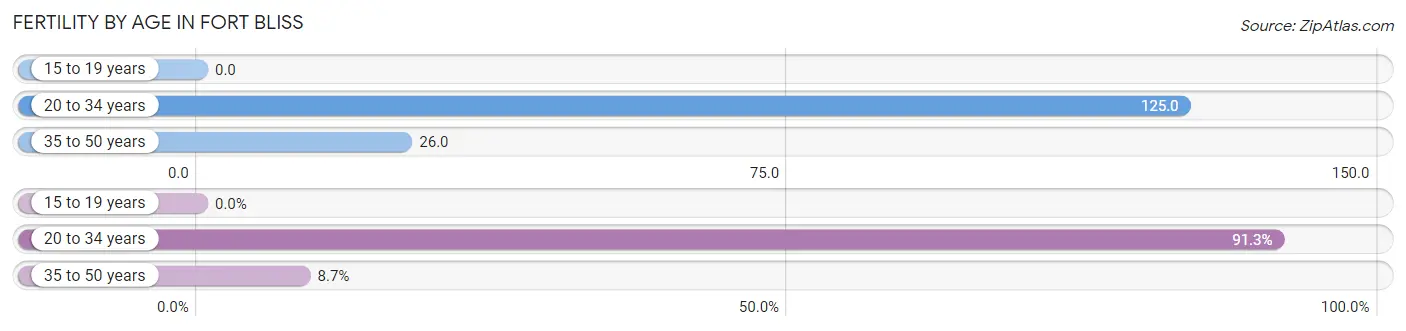
| Age Bracket | Women with Births | Births / 1,000 Women |
| 15 to 19 years | 0 (0.0%) | 0.0 |
| 20 to 34 years | 210 (91.3%) | 125.0 |
| 35 to 50 years | 20 (8.7%) | 26.0 |
| Total | 230 (100.0%) | 86.0 |
Fertility by Age by Marriage Status in Fort Bliss
93.9% of women with births (230) in Fort Bliss are married. The highest percentage of unmarried women with births falls into 20 to 34 years age bracket with 6.7% of them unmarried at the time of birth, while the lowest percentage of unmarried women with births belong to 35 to 50 years age bracket with 0.0% of them unmarried.
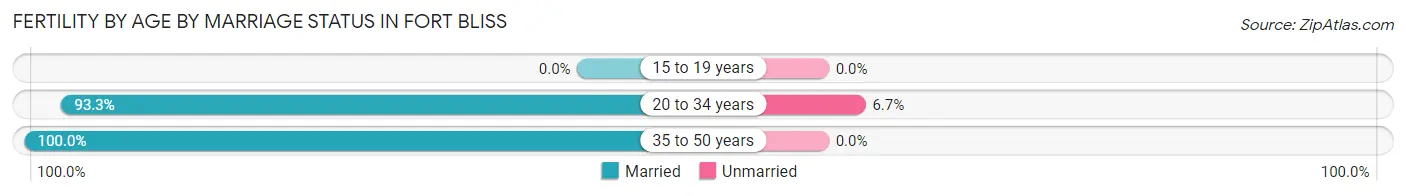
| Age Bracket | Married | Unmarried |
| 15 to 19 years | 0 (0.0%) | 0 (0.0%) |
| 20 to 34 years | 196 (93.3%) | 14 (6.7%) |
| 35 to 50 years | 20 (100.0%) | 0 (0.0%) |
| Total | 216 (93.9%) | 14 (6.1%) |
Fertility by Education in Fort Bliss
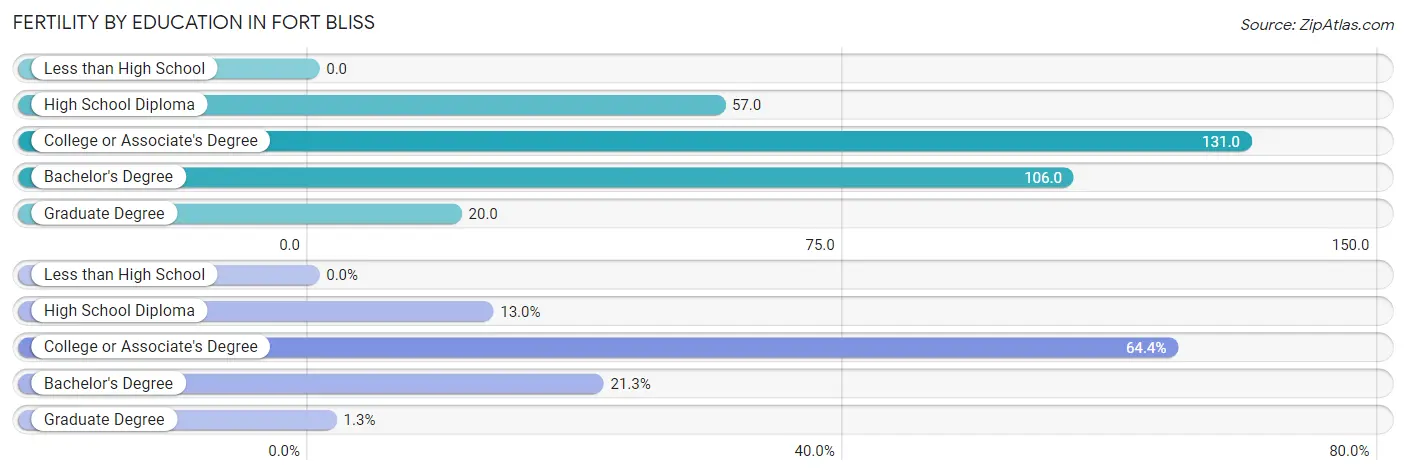
| Educational Attainment | Women with Births | Births / 1,000 Women |
| Less than High School | 0 (0.0%) | 0.0 |
| High School Diploma | 30 (13.0%) | 57.0 |
| College or Associate's Degree | 148 (64.3%) | 131.0 |
| Bachelor's Degree | 49 (21.3%) | 106.0 |
| Graduate Degree | 3 (1.3%) | 20.0 |
| Total | 230 (100.0%) | 86.0 |
Fertility by Education by Marriage Status in Fort Bliss
6.1% of women with births in Fort Bliss are unmarried. Women with the educational attainment of high school diploma are most likely to be married with 100.0% of them married at childbirth, while women with the educational attainment of college or associate's degree are least likely to be married with 9.5% of them unmarried at childbirth.
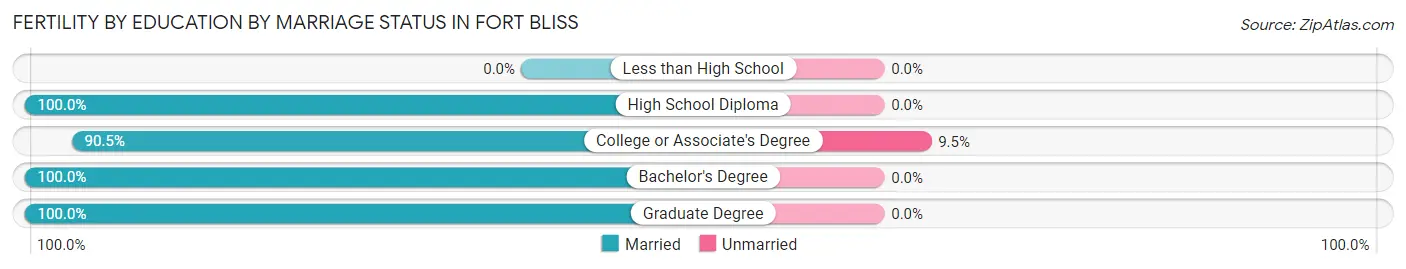
| Educational Attainment | Married | Unmarried |
| Less than High School | 0 (0.0%) | 0 (0.0%) |
| High School Diploma | 30 (100.0%) | 0 (0.0%) |
| College or Associate's Degree | 134 (90.5%) | 14 (9.5%) |
| Bachelor's Degree | 49 (100.0%) | 0 (0.0%) |
| Graduate Degree | 3 (100.0%) | 0 (0.0%) |
| Total | 216 (93.9%) | 14 (6.1%) |
Employment Characteristics in Fort Bliss
Employment by Class of Employer in Fort Bliss
Among the 6,263 employed individuals in Fort Bliss, federal government employees (5,505 | 87.9%), private company employees (510 | 8.1%), and self-employed (not incorporated) (90 | 1.4%) make up the most common classes of employment.
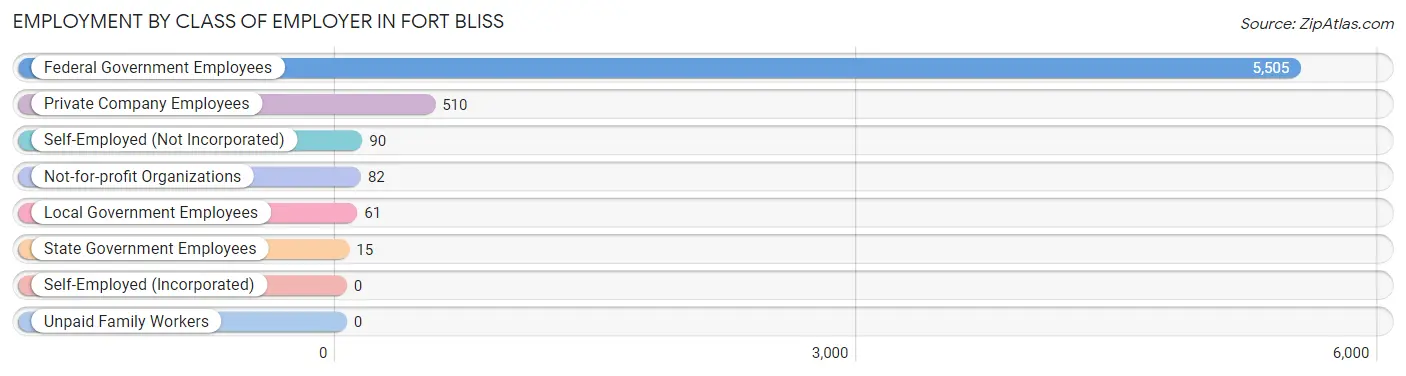
| Employer Class | # Employees | % Employees |
| Private Company Employees | 510 | 8.1% |
| Self-Employed (Incorporated) | 0 | 0.0% |
| Self-Employed (Not Incorporated) | 90 | 1.4% |
| Not-for-profit Organizations | 82 | 1.3% |
| Local Government Employees | 61 | 1.0% |
| State Government Employees | 15 | 0.2% |
| Federal Government Employees | 5,505 | 87.9% |
| Unpaid Family Workers | 0 | 0.0% |
| Total | 6,263 | 100.0% |
Employment Status by Age in Fort Bliss
According to the labor force statistics for Fort Bliss, out of the total population over 16 years of age (8,537), 76.5% or 6,531 individuals are in the labor force, with 9.0% or 588 of them unemployed. The age group with the highest labor force participation rate is 55 to 59 years, with 88.9% or 72 individuals in the labor force. Within the labor force, the 60 to 64 years age range has the highest percentage of unemployed individuals, with 28.0% or 7 of them being unemployed.
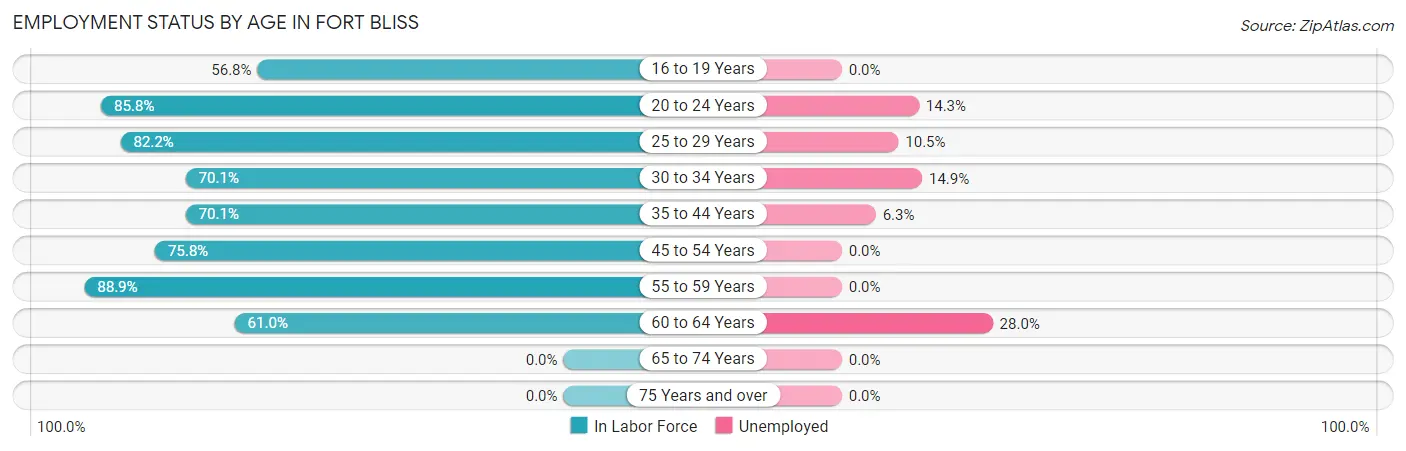
| Age Bracket | In Labor Force | Unemployed |
| 16 to 19 Years | 546 (56.8%) | 0 (0.0%) |
| 20 to 24 Years | 2,456 (85.8%) | 351 (14.3%) |
| 25 to 29 Years | 1,342 (82.2%) | 141 (10.5%) |
| 30 to 34 Years | 819 (70.1%) | 122 (14.9%) |
| 35 to 44 Years | 937 (70.1%) | 59 (6.3%) |
| 45 to 54 Years | 336 (75.8%) | 0 (0.0%) |
| 55 to 59 Years | 72 (88.9%) | 0 (0.0%) |
| 60 to 64 Years | 25 (61.0%) | 7 (28.0%) |
| 65 to 74 Years | 0 (0.0%) | 0 (0.0%) |
| 75 Years and over | 0 (0.0%) | 0 (0.0%) |
| Total | 6,531 (76.5%) | 588 (9.0%) |
Employment Status by Educational Attainment in Fort Bliss
According to labor force statistics for Fort Bliss, 75.1% of individuals (3,531) out of the total population between 25 and 64 years of age (4,702) are in the labor force, with 8.2% or 290 of them being unemployed. The group with the highest labor force participation rate are those with the educational attainment of bachelor's degree or higher, with 84.3% or 1,159 individuals in the labor force. Within the labor force, individuals with bachelor's degree or higher education have the highest percentage of unemployment, with 14.1% or 163 of them being unemployed.
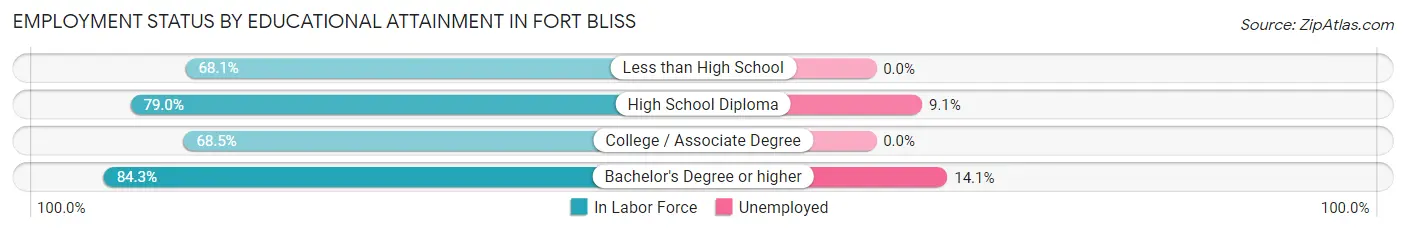
| Educational Attainment | In Labor Force | Unemployed |
| Less than High School | 81 (68.1%) | 0 (0.0%) |
| High School Diploma | 691 (79.0%) | 80 (9.1%) |
| College / Associate Degree | 1,598 (68.5%) | 0 (0.0%) |
| Bachelor's Degree or higher | 1,159 (84.3%) | 194 (14.1%) |
| Total | 3,531 (75.1%) | 386 (8.2%) |
Employment Occupations by Sex in Fort Bliss
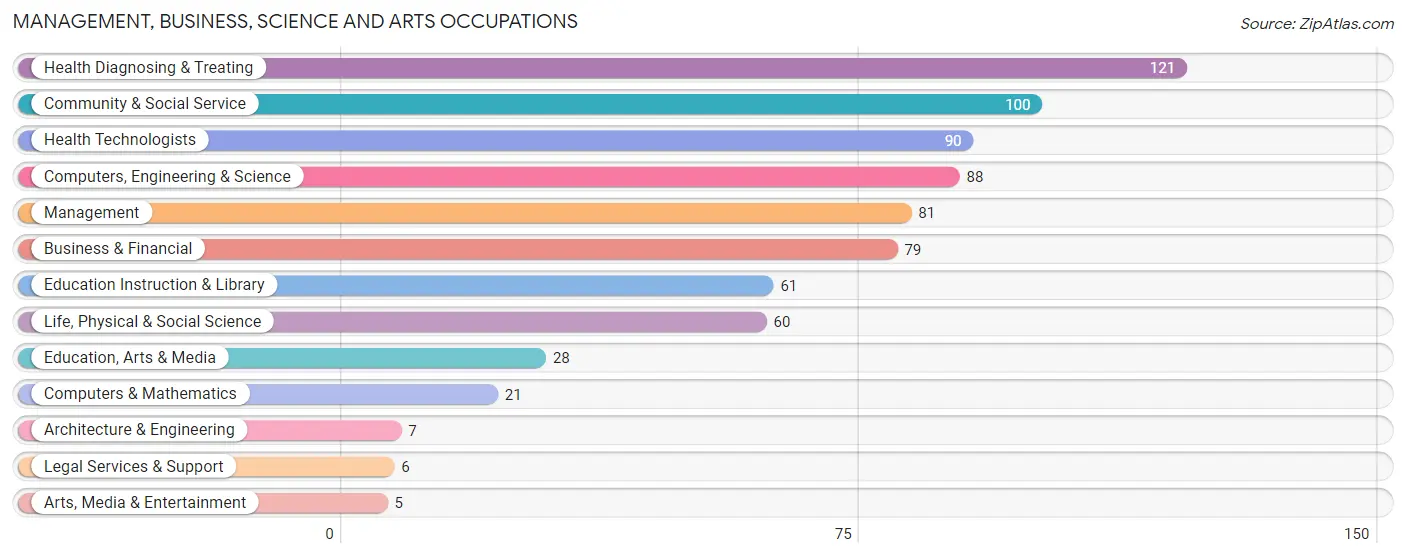
Management, Business, Science and Arts Occupations
The most common Management, Business, Science and Arts occupations in Fort Bliss are Health Diagnosing & Treating (121 | 9.0%), Community & Social Service (100 | 7.4%), Health Technologists (90 | 6.7%), Computers, Engineering & Science (88 | 6.5%), and Management (81 | 6.0%).
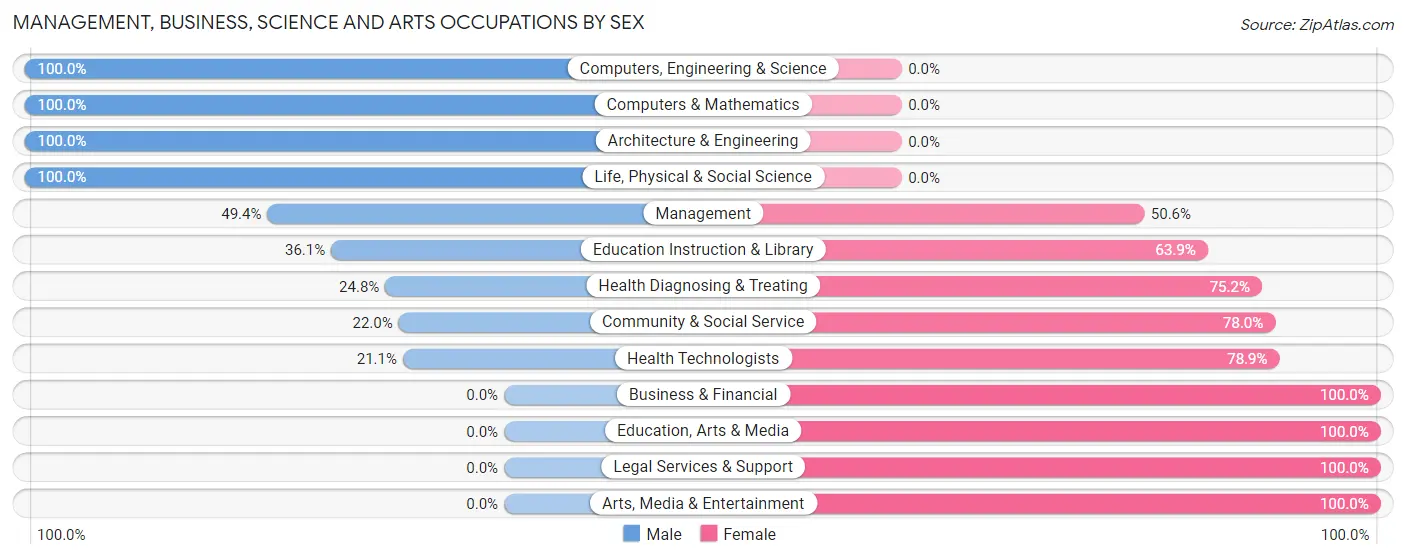
Management, Business, Science and Arts Occupations by Sex
Within the Management, Business, Science and Arts occupations in Fort Bliss, the most male-oriented occupations are Computers, Engineering & Science (100.0%), Computers & Mathematics (100.0%), and Architecture & Engineering (100.0%), while the most female-oriented occupations are Business & Financial (100.0%), Education, Arts & Media (100.0%), and Legal Services & Support (100.0%).
| Occupation | Male | Female |
| Management | 40 (49.4%) | 41 (50.6%) |
| Business & Financial | 0 (0.0%) | 79 (100.0%) |
| Computers, Engineering & Science | 88 (100.0%) | 0 (0.0%) |
| Computers & Mathematics | 21 (100.0%) | 0 (0.0%) |
| Architecture & Engineering | 7 (100.0%) | 0 (0.0%) |
| Life, Physical & Social Science | 60 (100.0%) | 0 (0.0%) |
| Community & Social Service | 22 (22.0%) | 78 (78.0%) |
| Education, Arts & Media | 0 (0.0%) | 28 (100.0%) |
| Legal Services & Support | 0 (0.0%) | 6 (100.0%) |
| Education Instruction & Library | 22 (36.1%) | 39 (63.9%) |
| Arts, Media & Entertainment | 0 (0.0%) | 5 (100.0%) |
| Health Diagnosing & Treating | 30 (24.8%) | 91 (75.2%) |
| Health Technologists | 19 (21.1%) | 71 (78.9%) |
| Total (Category) | 180 (38.4%) | 289 (61.6%) |
| Total (Overall) | 592 (43.9%) | 758 (56.1%) |
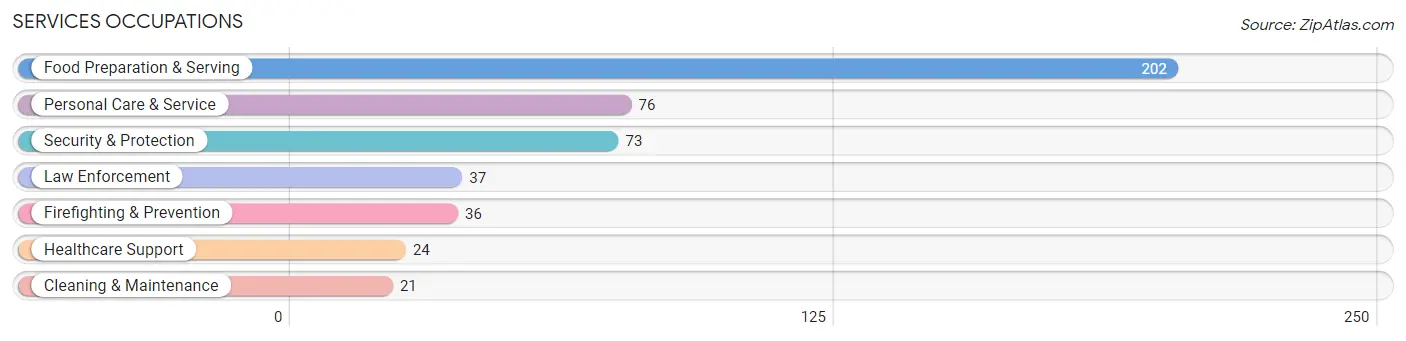
Services Occupations
The most common Services occupations in Fort Bliss are Food Preparation & Serving (202 | 15.0%), Personal Care & Service (76 | 5.6%), Security & Protection (73 | 5.4%), Law Enforcement (37 | 2.7%), and Firefighting & Prevention (36 | 2.7%).
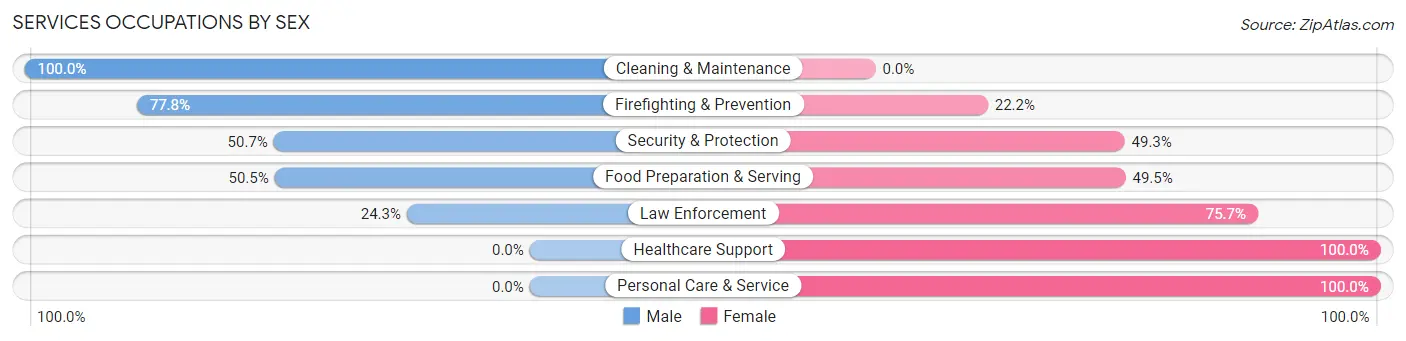
Services Occupations by Sex
Within the Services occupations in Fort Bliss, the most male-oriented occupations are Cleaning & Maintenance (100.0%), Firefighting & Prevention (77.8%), and Security & Protection (50.7%), while the most female-oriented occupations are Healthcare Support (100.0%), Personal Care & Service (100.0%), and Law Enforcement (75.7%).
| Occupation | Male | Female |
| Healthcare Support | 0 (0.0%) | 24 (100.0%) |
| Security & Protection | 37 (50.7%) | 36 (49.3%) |
| Firefighting & Prevention | 28 (77.8%) | 8 (22.2%) |
| Law Enforcement | 9 (24.3%) | 28 (75.7%) |
| Food Preparation & Serving | 102 (50.5%) | 100 (49.5%) |
| Cleaning & Maintenance | 21 (100.0%) | 0 (0.0%) |
| Personal Care & Service | 0 (0.0%) | 76 (100.0%) |
| Total (Category) | 160 (40.4%) | 236 (59.6%) |
| Total (Overall) | 592 (43.9%) | 758 (56.1%) |
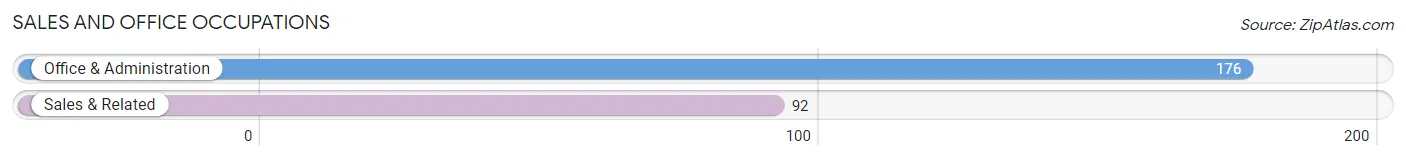
Sales and Office Occupations
The most common Sales and Office occupations in Fort Bliss are Office & Administration (176 | 13.0%), and Sales & Related (92 | 6.8%).
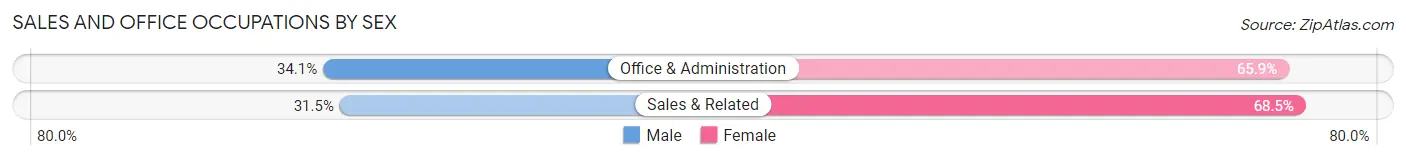
Sales and Office Occupations by Sex
| Occupation | Male | Female |
| Sales & Related | 29 (31.5%) | 63 (68.5%) |
| Office & Administration | 60 (34.1%) | 116 (65.9%) |
| Total (Category) | 89 (33.2%) | 179 (66.8%) |
| Total (Overall) | 592 (43.9%) | 758 (56.1%) |
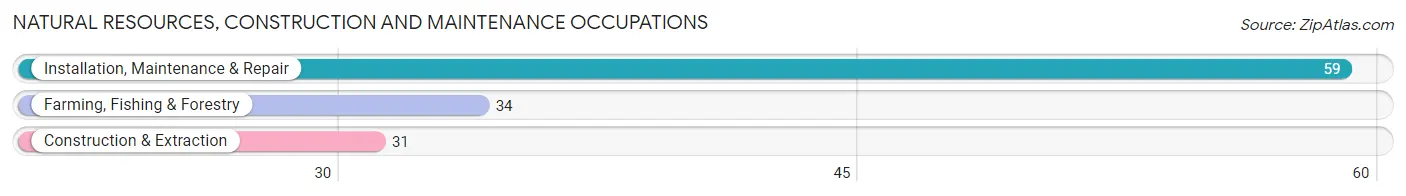
Natural Resources, Construction and Maintenance Occupations
The most common Natural Resources, Construction and Maintenance occupations in Fort Bliss are Installation, Maintenance & Repair (59 | 4.4%), Farming, Fishing & Forestry (34 | 2.5%), and Construction & Extraction (31 | 2.3%).
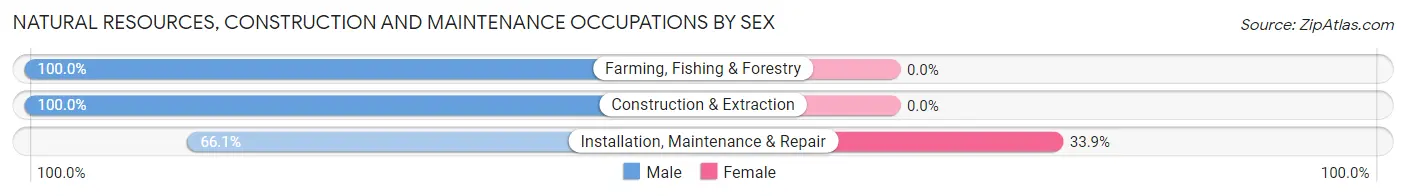
Natural Resources, Construction and Maintenance Occupations by Sex
| Occupation | Male | Female |
| Farming, Fishing & Forestry | 34 (100.0%) | 0 (0.0%) |
| Construction & Extraction | 31 (100.0%) | 0 (0.0%) |
| Installation, Maintenance & Repair | 39 (66.1%) | 20 (33.9%) |
| Total (Category) | 104 (83.9%) | 20 (16.1%) |
| Total (Overall) | 592 (43.9%) | 758 (56.1%) |
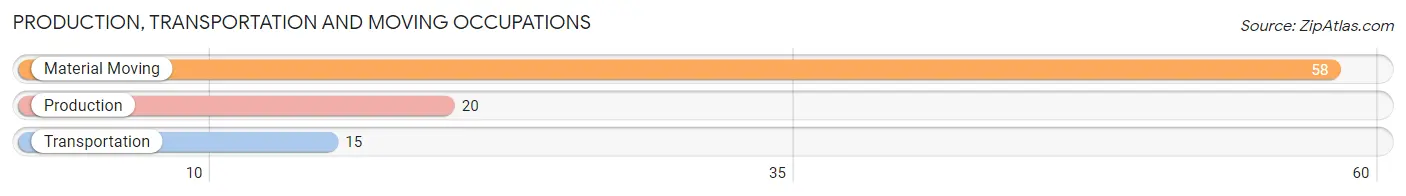
Production, Transportation and Moving Occupations
The most common Production, Transportation and Moving occupations in Fort Bliss are Material Moving (58 | 4.3%), Production (20 | 1.5%), and Transportation (15 | 1.1%).
Production, Transportation and Moving Occupations by Sex
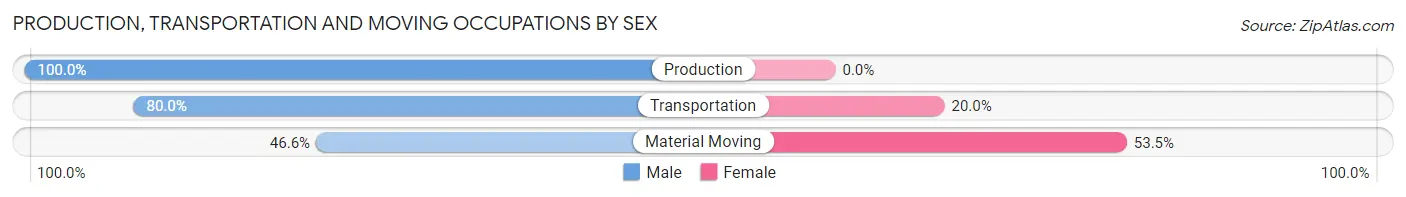
| Occupation | Male | Female |
| Production | 20 (100.0%) | 0 (0.0%) |
| Transportation | 12 (80.0%) | 3 (20.0%) |
| Material Moving | 27 (46.6%) | 31 (53.4%) |
| Total (Category) | 59 (63.4%) | 34 (36.6%) |
| Total (Overall) | 592 (43.9%) | 758 (56.1%) |
Employment Industries by Sex in Fort Bliss
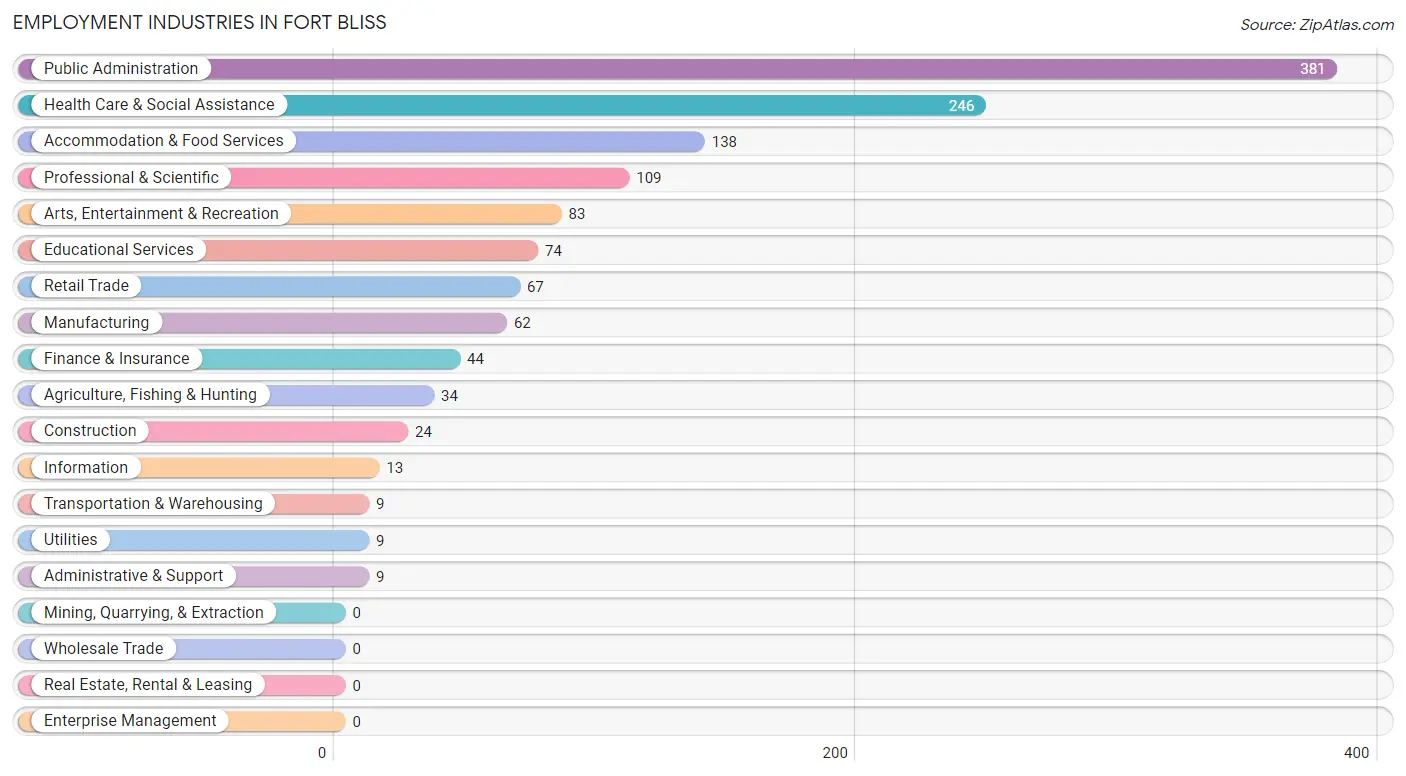
Employment Industries in Fort Bliss
The major employment industries in Fort Bliss include Public Administration (381 | 28.2%), Health Care & Social Assistance (246 | 18.2%), Accommodation & Food Services (138 | 10.2%), Professional & Scientific (109 | 8.1%), and Arts, Entertainment & Recreation (83 | 6.1%).
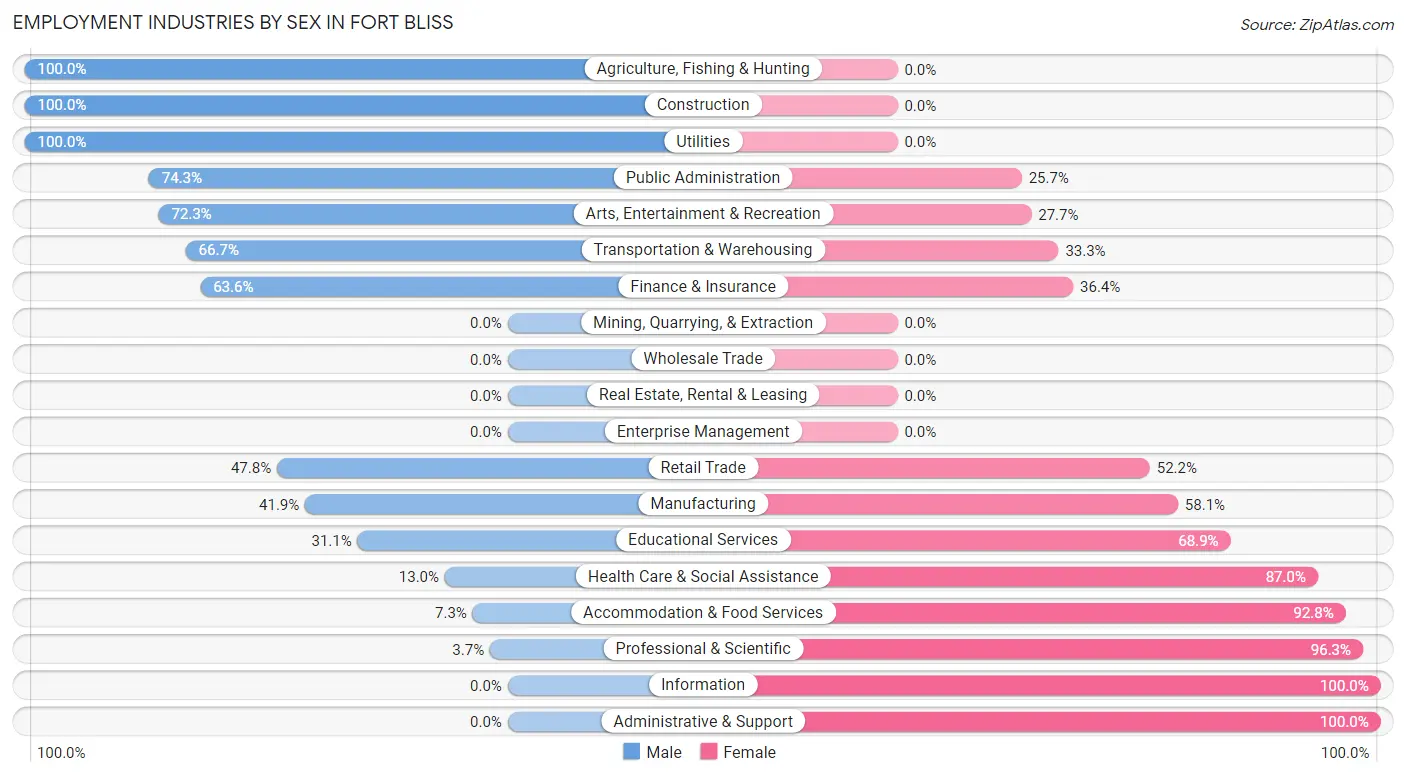
Employment Industries by Sex in Fort Bliss
The Fort Bliss industries that see more men than women are Agriculture, Fishing & Hunting (100.0%), Construction (100.0%), and Utilities (100.0%), whereas the industries that tend to have a higher number of women are Information (100.0%), Administrative & Support (100.0%), and Professional & Scientific (96.3%).
| Industry | Male | Female |
| Agriculture, Fishing & Hunting | 34 (100.0%) | 0 (0.0%) |
| Mining, Quarrying, & Extraction | 0 (0.0%) | 0 (0.0%) |
| Construction | 24 (100.0%) | 0 (0.0%) |
| Manufacturing | 26 (41.9%) | 36 (58.1%) |
| Wholesale Trade | 0 (0.0%) | 0 (0.0%) |
| Retail Trade | 32 (47.8%) | 35 (52.2%) |
| Transportation & Warehousing | 6 (66.7%) | 3 (33.3%) |
| Utilities | 9 (100.0%) | 0 (0.0%) |
| Information | 0 (0.0%) | 13 (100.0%) |
| Finance & Insurance | 28 (63.6%) | 16 (36.4%) |
| Real Estate, Rental & Leasing | 0 (0.0%) | 0 (0.0%) |
| Professional & Scientific | 4 (3.7%) | 105 (96.3%) |
| Enterprise Management | 0 (0.0%) | 0 (0.0%) |
| Administrative & Support | 0 (0.0%) | 9 (100.0%) |
| Educational Services | 23 (31.1%) | 51 (68.9%) |
| Health Care & Social Assistance | 32 (13.0%) | 214 (87.0%) |
| Arts, Entertainment & Recreation | 60 (72.3%) | 23 (27.7%) |
| Accommodation & Food Services | 10 (7.2%) | 128 (92.7%) |
| Public Administration | 283 (74.3%) | 98 (25.7%) |
| Total | 592 (43.9%) | 758 (56.1%) |
Education in Fort Bliss
School Enrollment in Fort Bliss
The most common levels of schooling among the 3,881 students in Fort Bliss are college / undergraduate (1,074 | 27.7%), elementary school (1,006 | 25.9%), and middle school (656 | 16.9%).
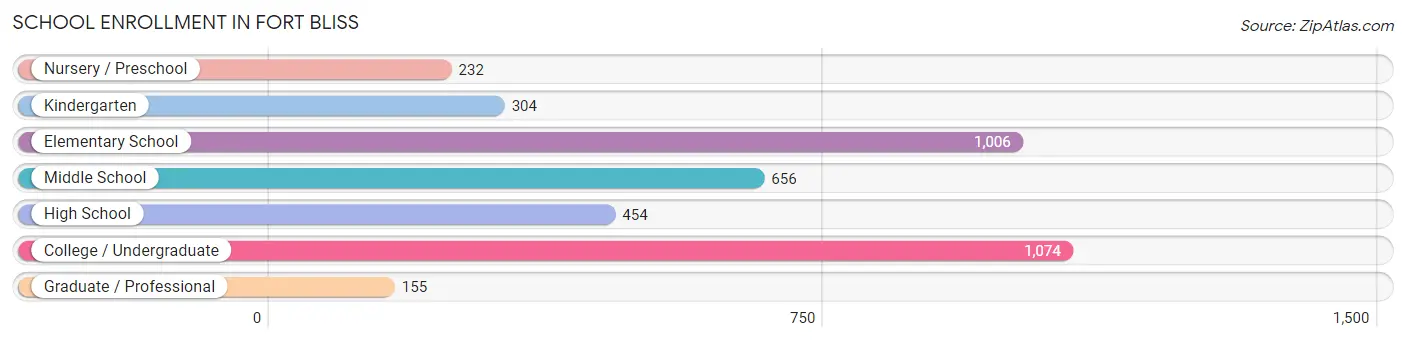
| School Level | # Students | % Students |
| Nursery / Preschool | 232 | 6.0% |
| Kindergarten | 304 | 7.8% |
| Elementary School | 1,006 | 25.9% |
| Middle School | 656 | 16.9% |
| High School | 454 | 11.7% |
| College / Undergraduate | 1,074 | 27.7% |
| Graduate / Professional | 155 | 4.0% |
| Total | 3,881 | 100.0% |
School Enrollment by Age by Funding Source in Fort Bliss
Out of a total of 3,881 students who are enrolled in schools in Fort Bliss, 431 (11.1%) attend a private institution, while the remaining 3,450 (88.9%) are enrolled in public schools. The age group of 18 to 19 year olds has the highest likelihood of being enrolled in private schools, with 14 (23.0% in the age bracket) enrolled. Conversely, the age group of 15 to 17 year olds has the lowest likelihood of being enrolled in a private school, with 328 (98.8% in the age bracket) attending a public institution.
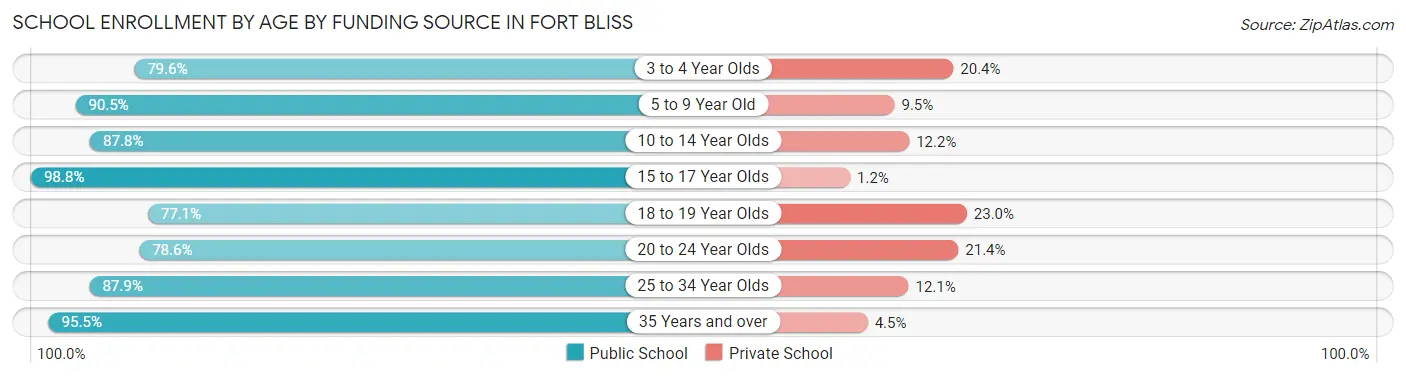
| Age Bracket | Public School | Private School |
| 3 to 4 Year Olds | 148 (79.6%) | 38 (20.4%) |
| 5 to 9 Year Old | 1,107 (90.5%) | 116 (9.5%) |
| 10 to 14 Year Olds | 791 (87.8%) | 110 (12.2%) |
| 15 to 17 Year Olds | 328 (98.8%) | 4 (1.2%) |
| 18 to 19 Year Olds | 47 (77.0%) | 14 (23.0%) |
| 20 to 24 Year Olds | 243 (78.6%) | 66 (21.4%) |
| 25 to 34 Year Olds | 509 (87.9%) | 70 (12.1%) |
| 35 Years and over | 277 (95.5%) | 13 (4.5%) |
| Total | 3,450 (88.9%) | 431 (11.1%) |
Educational Attainment by Field of Study in Fort Bliss
Liberal arts & history (254 | 17.4%), business (246 | 16.9%), science & technology (191 | 13.1%), social sciences (182 | 12.5%), and arts & humanities (165 | 11.3%) are the most common fields of study among 1,458 individuals in Fort Bliss who have obtained a bachelor's degree or higher.
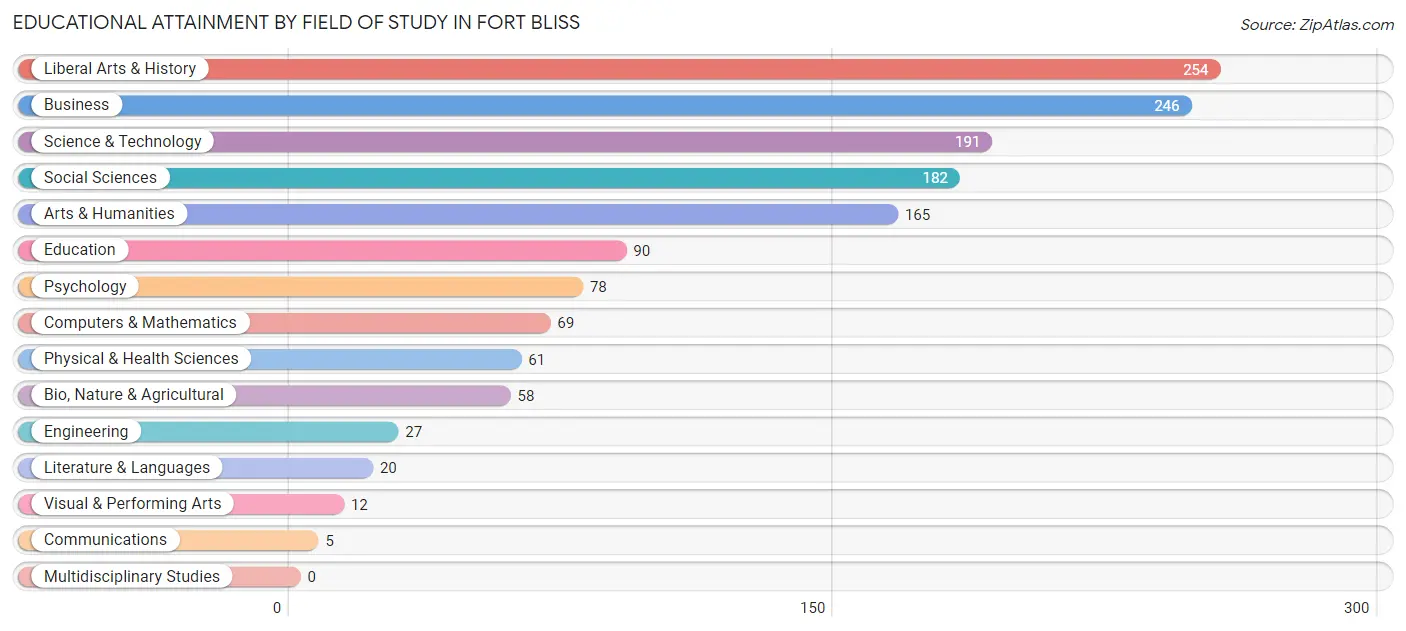
| Field of Study | # Graduates | % Graduates |
| Computers & Mathematics | 69 | 4.7% |
| Bio, Nature & Agricultural | 58 | 4.0% |
| Physical & Health Sciences | 61 | 4.2% |
| Psychology | 78 | 5.3% |
| Social Sciences | 182 | 12.5% |
| Engineering | 27 | 1.8% |
| Multidisciplinary Studies | 0 | 0.0% |
| Science & Technology | 191 | 13.1% |
| Business | 246 | 16.9% |
| Education | 90 | 6.2% |
| Literature & Languages | 20 | 1.4% |
| Liberal Arts & History | 254 | 17.4% |
| Visual & Performing Arts | 12 | 0.8% |
| Communications | 5 | 0.3% |
| Arts & Humanities | 165 | 11.3% |
| Total | 1,458 | 100.0% |
Transportation & Commute in Fort Bliss
Vehicle Availability by Sex in Fort Bliss
The most prevalent vehicle ownership categories in Fort Bliss are males with 2 vehicles (1,566, accounting for 72.6%) and females with 2 vehicles (535, making up 236.6%).
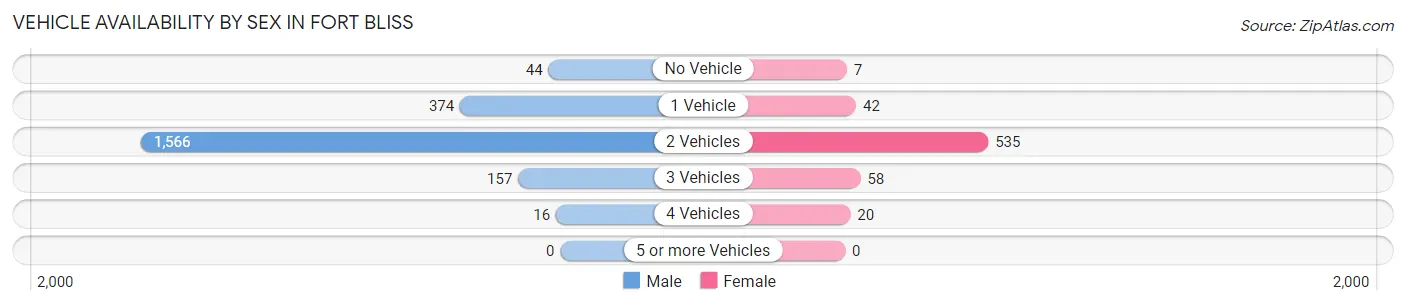
| Vehicles Available | Male | Female |
| No Vehicle | 44 (2.0%) | 7 (1.1%) |
| 1 Vehicle | 374 (17.3%) | 42 (6.3%) |
| 2 Vehicles | 1,566 (72.6%) | 535 (80.8%) |
| 3 Vehicles | 157 (7.3%) | 58 (8.8%) |
| 4 Vehicles | 16 (0.7%) | 20 (3.0%) |
| 5 or more Vehicles | 0 (0.0%) | 0 (0.0%) |
| Total | 2,157 (100.0%) | 662 (100.0%) |
Commute Time in Fort Bliss
The most frequently occuring commute durations in Fort Bliss are 5 to 9 minutes (1,314 commuters, 22.7%), 15 to 19 minutes (1,097 commuters, 19.0%), and less than 5 minutes (1,035 commuters, 17.9%).
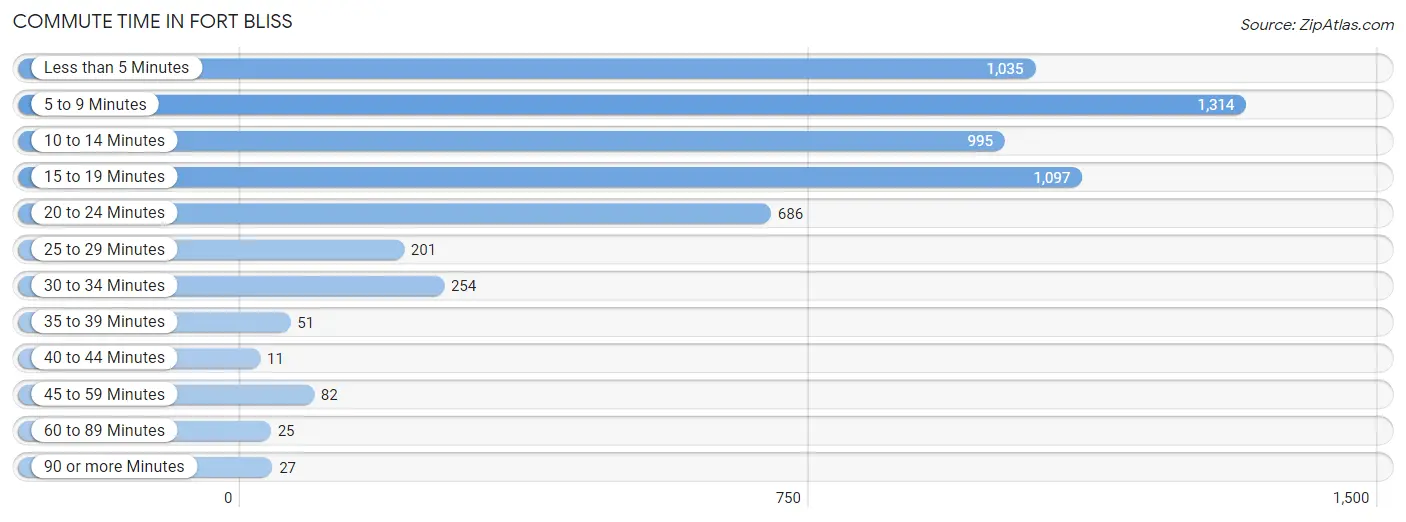
| Commute Time | # Commuters | % Commuters |
| Less than 5 Minutes | 1,035 | 17.9% |
| 5 to 9 Minutes | 1,314 | 22.7% |
| 10 to 14 Minutes | 995 | 17.2% |
| 15 to 19 Minutes | 1,097 | 19.0% |
| 20 to 24 Minutes | 686 | 11.9% |
| 25 to 29 Minutes | 201 | 3.5% |
| 30 to 34 Minutes | 254 | 4.4% |
| 35 to 39 Minutes | 51 | 0.9% |
| 40 to 44 Minutes | 11 | 0.2% |
| 45 to 59 Minutes | 82 | 1.4% |
| 60 to 89 Minutes | 25 | 0.4% |
| 90 or more Minutes | 27 | 0.5% |
Commute Time by Sex in Fort Bliss
The most common commute times in Fort Bliss are 5 to 9 minutes (1,171 commuters, 24.1%) for males and 10 to 14 minutes (220 commuters, 23.9%) for females.
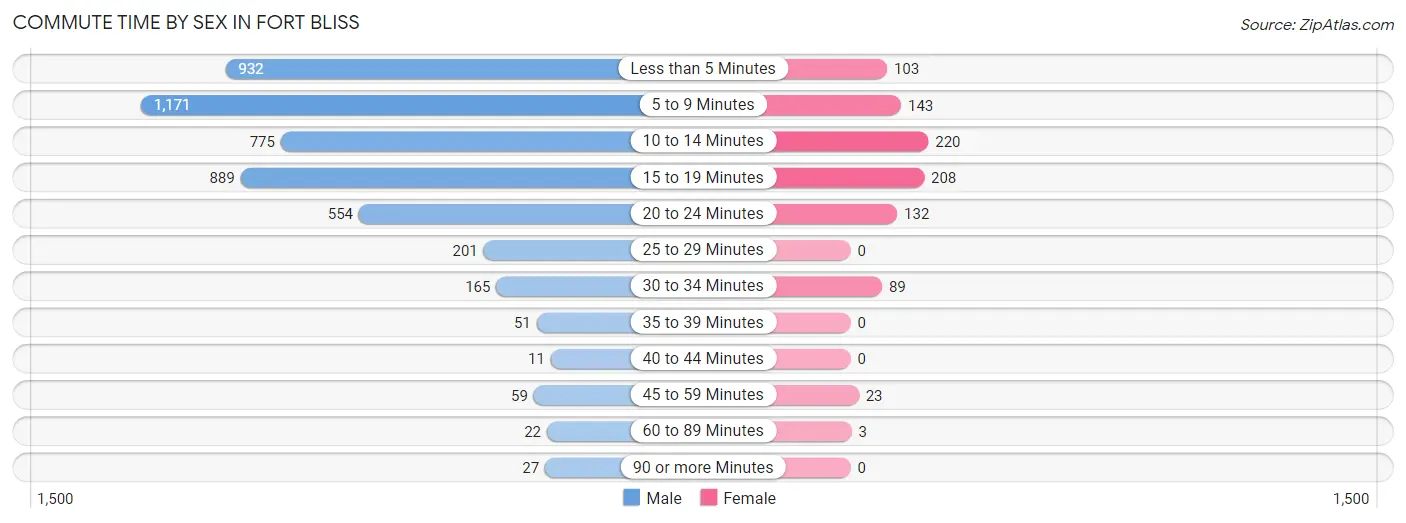
| Commute Time | Male | Female |
| Less than 5 Minutes | 932 (19.2%) | 103 (11.2%) |
| 5 to 9 Minutes | 1,171 (24.1%) | 143 (15.5%) |
| 10 to 14 Minutes | 775 (16.0%) | 220 (23.9%) |
| 15 to 19 Minutes | 889 (18.3%) | 208 (22.6%) |
| 20 to 24 Minutes | 554 (11.4%) | 132 (14.3%) |
| 25 to 29 Minutes | 201 (4.1%) | 0 (0.0%) |
| 30 to 34 Minutes | 165 (3.4%) | 89 (9.7%) |
| 35 to 39 Minutes | 51 (1.1%) | 0 (0.0%) |
| 40 to 44 Minutes | 11 (0.2%) | 0 (0.0%) |
| 45 to 59 Minutes | 59 (1.2%) | 23 (2.5%) |
| 60 to 89 Minutes | 22 (0.4%) | 3 (0.3%) |
| 90 or more Minutes | 27 (0.6%) | 0 (0.0%) |
Time of Departure to Work by Sex in Fort Bliss
The most frequent times of departure to work in Fort Bliss are 6:00 AM to 6:29 AM (967, 19.9%) for males and 7:30 AM to 7:59 AM (165, 17.9%) for females.
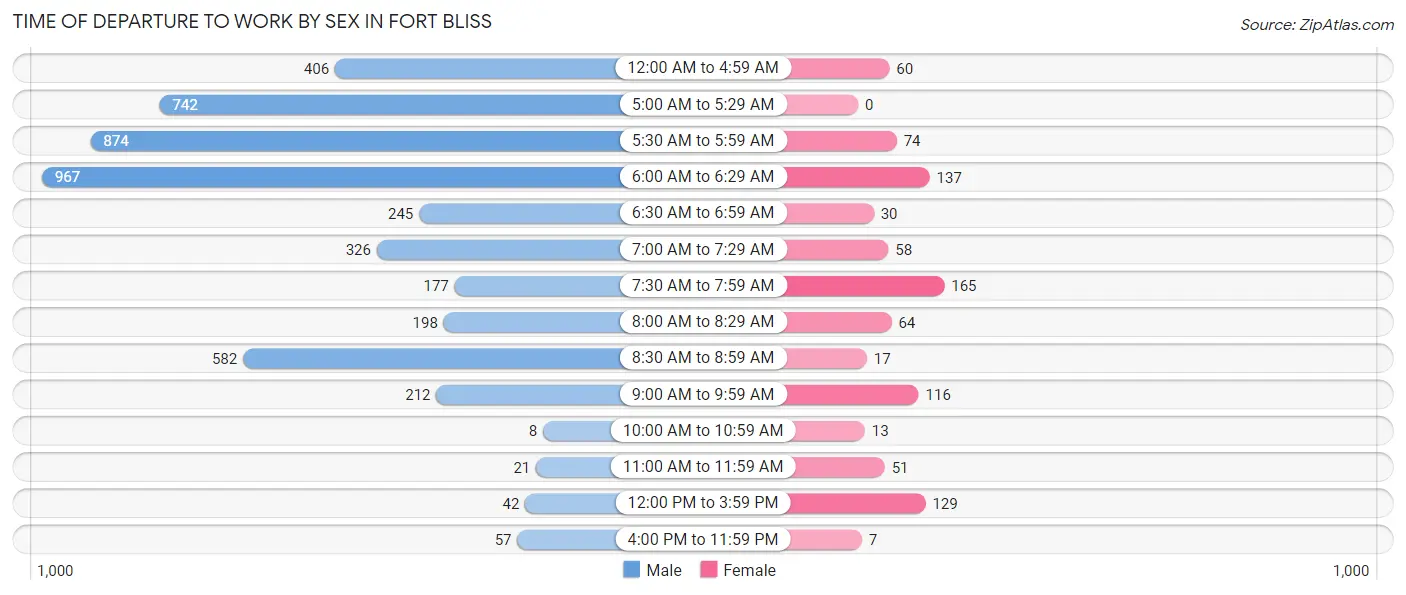
| Time of Departure | Male | Female |
| 12:00 AM to 4:59 AM | 406 (8.4%) | 60 (6.5%) |
| 5:00 AM to 5:29 AM | 742 (15.3%) | 0 (0.0%) |
| 5:30 AM to 5:59 AM | 874 (18.0%) | 74 (8.0%) |
| 6:00 AM to 6:29 AM | 967 (19.9%) | 137 (14.9%) |
| 6:30 AM to 6:59 AM | 245 (5.0%) | 30 (3.3%) |
| 7:00 AM to 7:29 AM | 326 (6.7%) | 58 (6.3%) |
| 7:30 AM to 7:59 AM | 177 (3.6%) | 165 (17.9%) |
| 8:00 AM to 8:29 AM | 198 (4.1%) | 64 (7.0%) |
| 8:30 AM to 8:59 AM | 582 (12.0%) | 17 (1.8%) |
| 9:00 AM to 9:59 AM | 212 (4.4%) | 116 (12.6%) |
| 10:00 AM to 10:59 AM | 8 (0.2%) | 13 (1.4%) |
| 11:00 AM to 11:59 AM | 21 (0.4%) | 51 (5.5%) |
| 12:00 PM to 3:59 PM | 42 (0.9%) | 129 (14.0%) |
| 4:00 PM to 11:59 PM | 57 (1.2%) | 7 (0.8%) |
| Total | 4,857 (100.0%) | 921 (100.0%) |
Housing Occupancy in Fort Bliss
Occupancy by Ownership in Fort Bliss
Of the total 2,282 dwellings in Fort Bliss, owner-occupied units account for 0 (0.0%), while renter-occupied units make up 2,282 (100.0%).
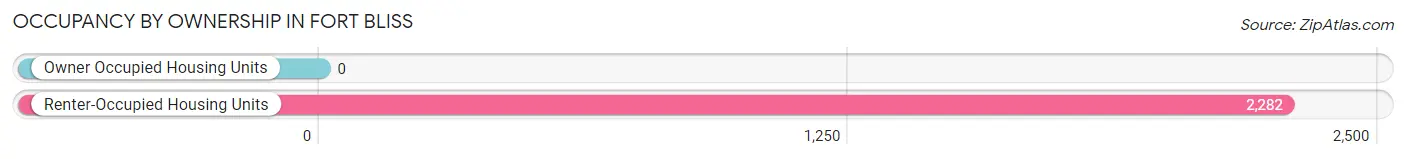
| Occupancy | # Housing Units | % Housing Units |
| Owner Occupied Housing Units | 0 | 0.0% |
| Renter-Occupied Housing Units | 2,282 | 100.0% |
| Total Occupied Housing Units | 2,282 | 100.0% |
Occupancy by Household Size in Fort Bliss
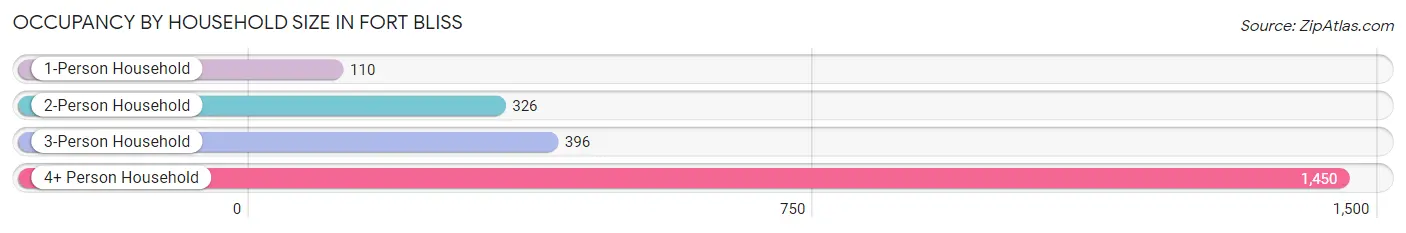
| Household Size | # Housing Units | % Housing Units |
| 1-Person Household | 110 | 4.8% |
| 2-Person Household | 326 | 14.3% |
| 3-Person Household | 396 | 17.3% |
| 4+ Person Household | 1,450 | 63.5% |
| Total Housing Units | 2,282 | 100.0% |
Occupancy by Ownership by Household Size in Fort Bliss
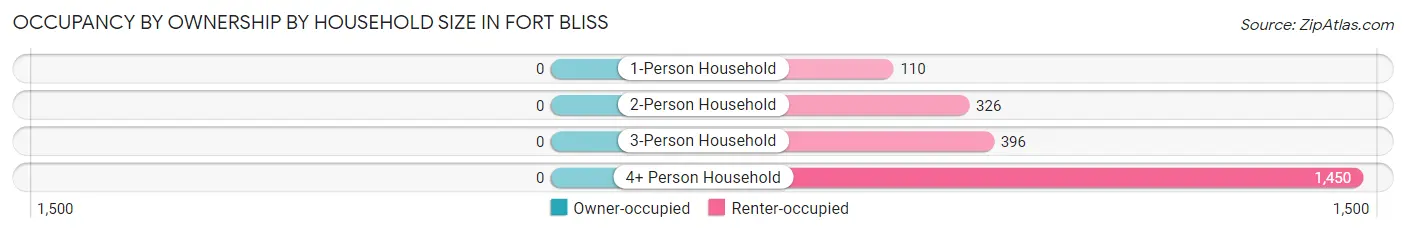
| Household Size | Owner-occupied | Renter-occupied |
| 1-Person Household | 0 (0.0%) | 110 (100.0%) |
| 2-Person Household | 0 (0.0%) | 326 (100.0%) |
| 3-Person Household | 0 (0.0%) | 396 (100.0%) |
| 4+ Person Household | 0 (0.0%) | 1,450 (100.0%) |
| Total Housing Units | 0 (0.0%) | 2,282 (100.0%) |
Occupancy by Educational Attainment in Fort Bliss
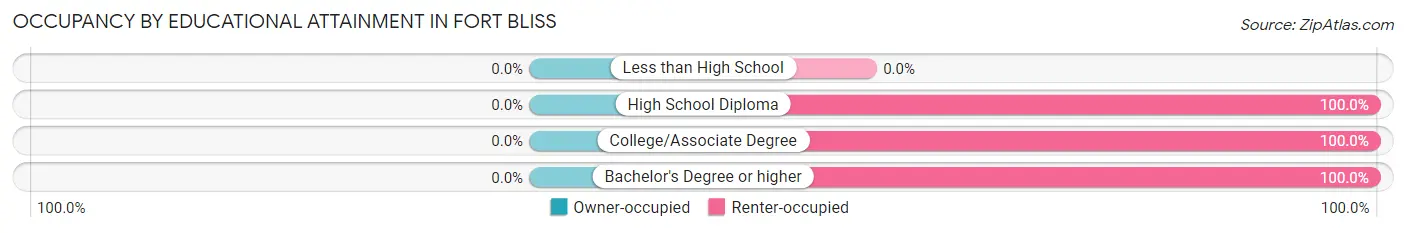
| Household Size | Owner-occupied | Renter-occupied |
| Less than High School | 0 (0.0%) | 0 (0.0%) |
| High School Diploma | 0 (0.0%) | 530 (100.0%) |
| College/Associate Degree | 0 (0.0%) | 1,084 (100.0%) |
| Bachelor's Degree or higher | 0 (0.0%) | 668 (100.0%) |
Occupancy by Age of Householder in Fort Bliss
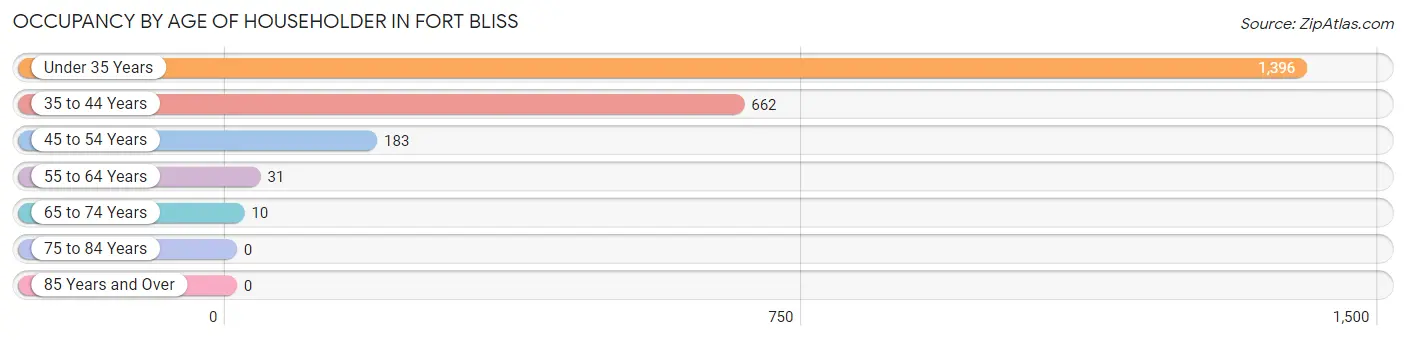
| Age Bracket | # Households | % Households |
| Under 35 Years | 1,396 | 61.2% |
| 35 to 44 Years | 662 | 29.0% |
| 45 to 54 Years | 183 | 8.0% |
| 55 to 64 Years | 31 | 1.4% |
| 65 to 74 Years | 10 | 0.4% |
| 75 to 84 Years | 0 | 0.0% |
| 85 Years and Over | 0 | 0.0% |
| Total | 2,282 | 100.0% |
Housing Finances in Fort Bliss
Median Income by Occupancy in Fort Bliss
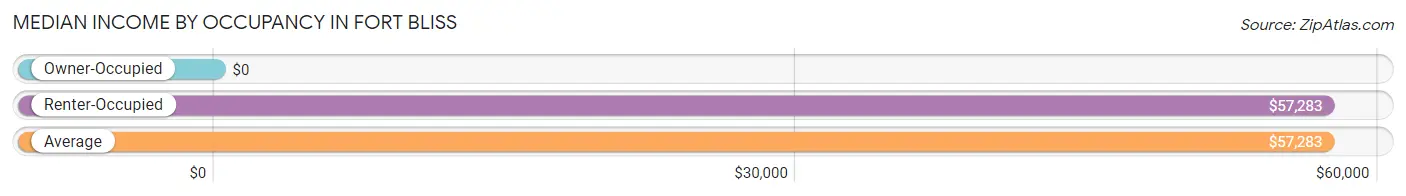
| Occupancy Type | # Households | Median Income |
| Owner-Occupied | 0 (0.0%) | $0 |
| Renter-Occupied | 2,282 (100.0%) | $57,283 |
| Average | 2,282 (100.0%) | $57,283 |
Occupancy by Householder Income Bracket in Fort Bliss
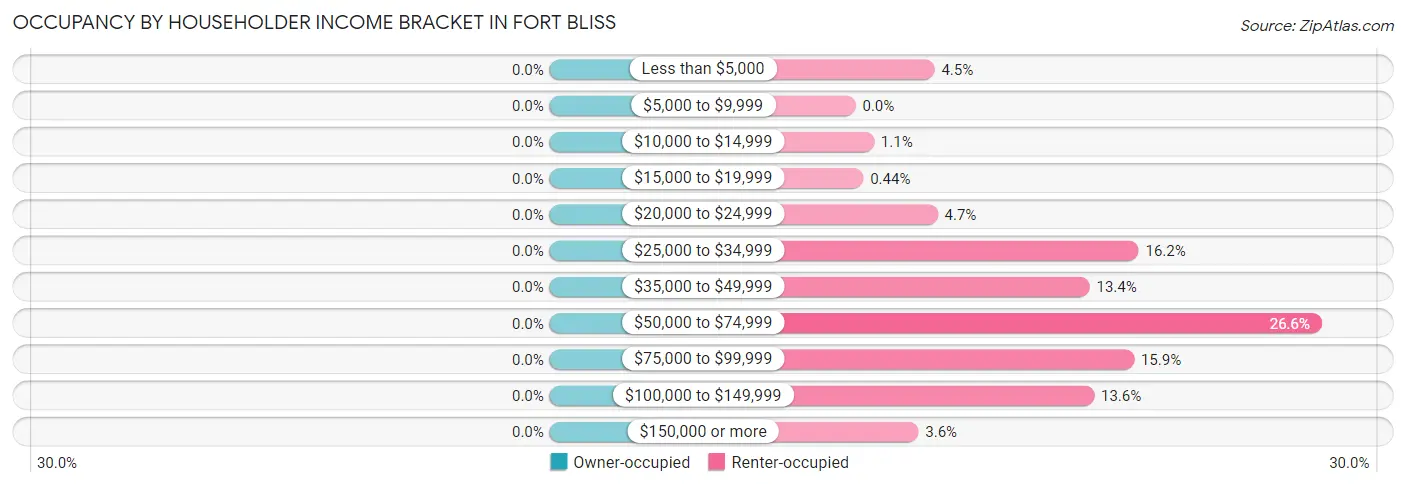
| Income Bracket | Owner-occupied | Renter-occupied |
| Less than $5,000 | 0 (0.0%) | 103 (4.5%) |
| $5,000 to $9,999 | 0 (0.0%) | 0 (0.0%) |
| $10,000 to $14,999 | 0 (0.0%) | 24 (1.1%) |
| $15,000 to $19,999 | 0 (0.0%) | 10 (0.4%) |
| $20,000 to $24,999 | 0 (0.0%) | 107 (4.7%) |
| $25,000 to $34,999 | 0 (0.0%) | 369 (16.2%) |
| $35,000 to $49,999 | 0 (0.0%) | 305 (13.4%) |
| $50,000 to $74,999 | 0 (0.0%) | 608 (26.6%) |
| $75,000 to $99,999 | 0 (0.0%) | 363 (15.9%) |
| $100,000 to $149,999 | 0 (0.0%) | 311 (13.6%) |
| $150,000 or more | 0 (0.0%) | 82 (3.6%) |
| Total | 0 (0.0%) | 2,282 (100.0%) |
Monthly Housing Cost Tiers in Fort Bliss
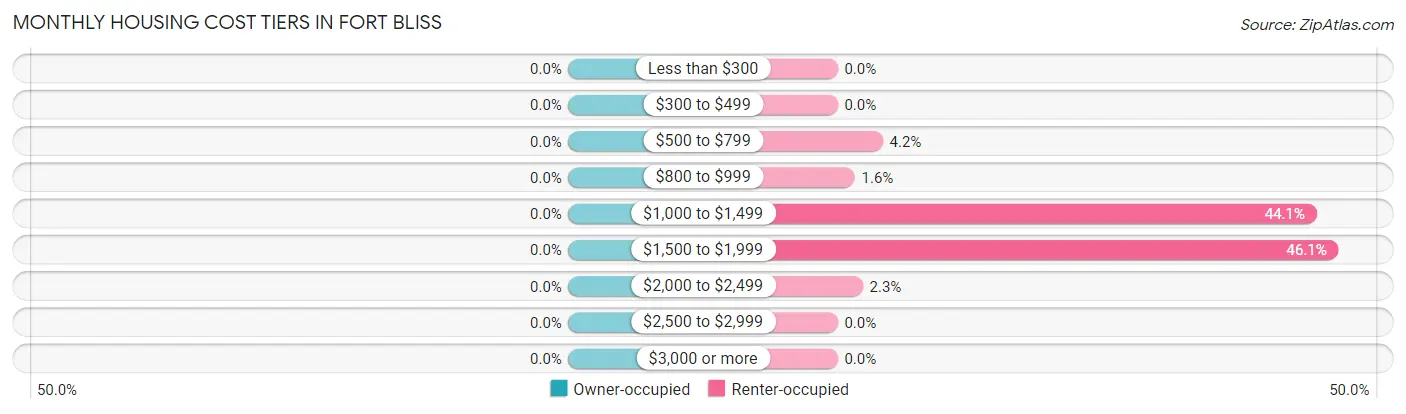
| Monthly Cost | Owner-occupied | Renter-occupied |
| Less than $300 | 0 (0.0%) | 0 (0.0%) |
| $300 to $499 | 0 (0.0%) | 0 (0.0%) |
| $500 to $799 | 0 (0.0%) | 95 (4.2%) |
| $800 to $999 | 0 (0.0%) | 36 (1.6%) |
| $1,000 to $1,499 | 0 (0.0%) | 1,007 (44.1%) |
| $1,500 to $1,999 | 0 (0.0%) | 1,053 (46.1%) |
| $2,000 to $2,499 | 0 (0.0%) | 53 (2.3%) |
| $2,500 to $2,999 | 0 (0.0%) | 0 (0.0%) |
| $3,000 or more | 0 (0.0%) | 0 (0.0%) |
| Total | 0 (0.0%) | 2,282 (100.0%) |
Physical Housing Characteristics in Fort Bliss
Housing Structures in Fort Bliss
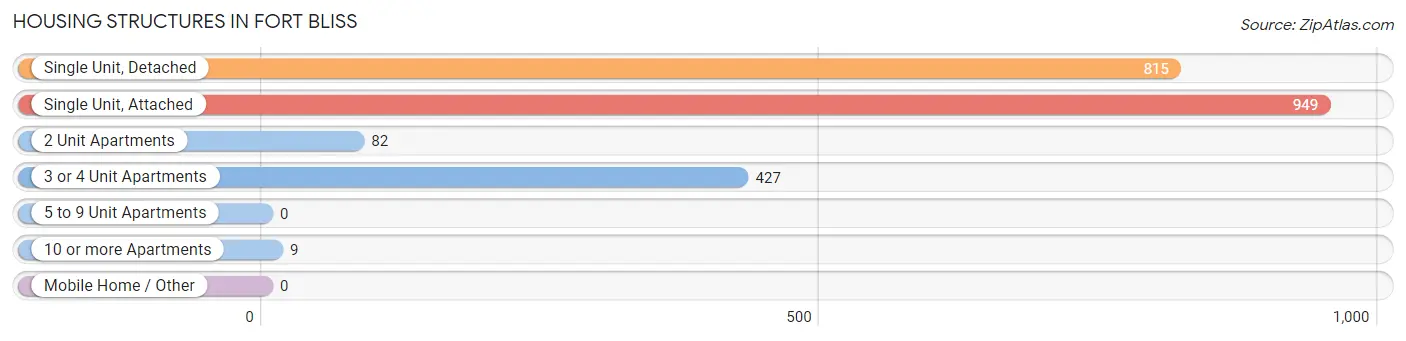
| Structure Type | # Housing Units | % Housing Units |
| Single Unit, Detached | 815 | 35.7% |
| Single Unit, Attached | 949 | 41.6% |
| 2 Unit Apartments | 82 | 3.6% |
| 3 or 4 Unit Apartments | 427 | 18.7% |
| 5 to 9 Unit Apartments | 0 | 0.0% |
| 10 or more Apartments | 9 | 0.4% |
| Mobile Home / Other | 0 | 0.0% |
| Total | 2,282 | 100.0% |
Housing Structures by Occupancy in Fort Bliss
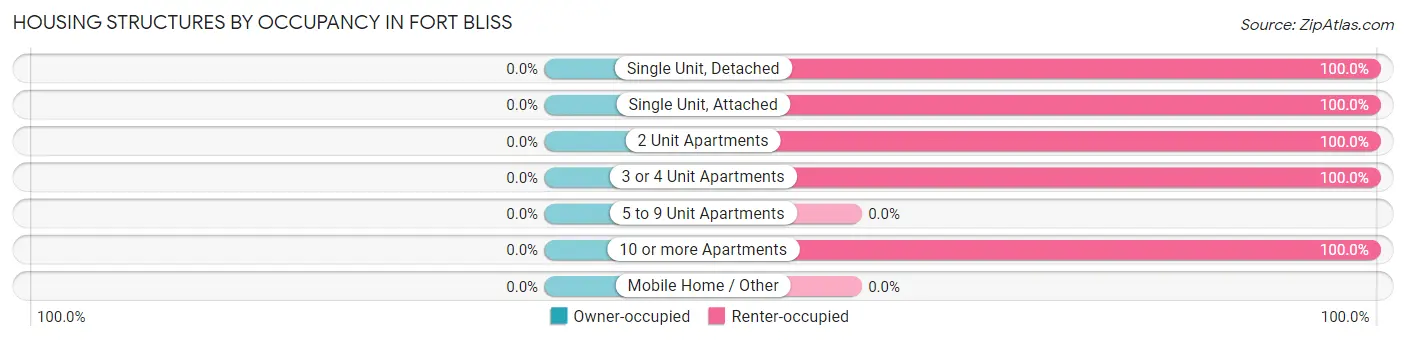
| Structure Type | Owner-occupied | Renter-occupied |
| Single Unit, Detached | 0 (0.0%) | 815 (100.0%) |
| Single Unit, Attached | 0 (0.0%) | 949 (100.0%) |
| 2 Unit Apartments | 0 (0.0%) | 82 (100.0%) |
| 3 or 4 Unit Apartments | 0 (0.0%) | 427 (100.0%) |
| 5 to 9 Unit Apartments | 0 (0.0%) | 0 (0.0%) |
| 10 or more Apartments | 0 (0.0%) | 9 (100.0%) |
| Mobile Home / Other | 0 (0.0%) | 0 (0.0%) |
| Total | 0 (0.0%) | 2,282 (100.0%) |
Housing Structures by Number of Rooms in Fort Bliss
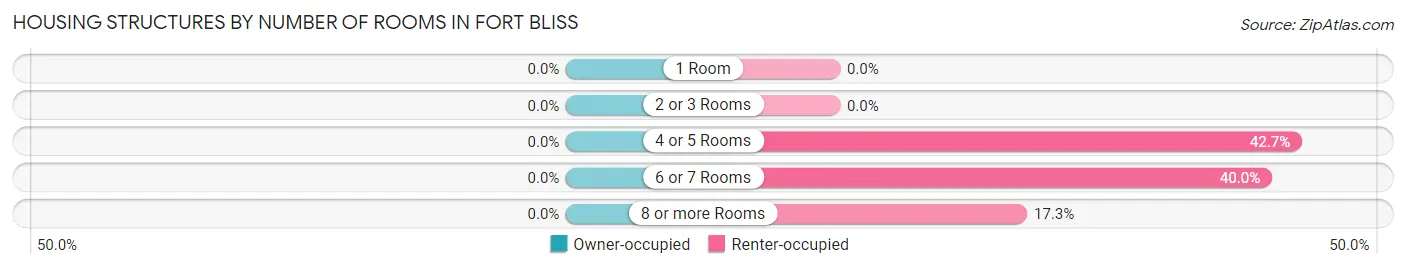
| Number of Rooms | Owner-occupied | Renter-occupied |
| 1 Room | 0 (0.0%) | 0 (0.0%) |
| 2 or 3 Rooms | 0 (0.0%) | 0 (0.0%) |
| 4 or 5 Rooms | 0 (0.0%) | 975 (42.7%) |
| 6 or 7 Rooms | 0 (0.0%) | 912 (40.0%) |
| 8 or more Rooms | 0 (0.0%) | 395 (17.3%) |
| Total | 0 (0.0%) | 2,282 (100.0%) |
Housing Structure by Heating Type in Fort Bliss
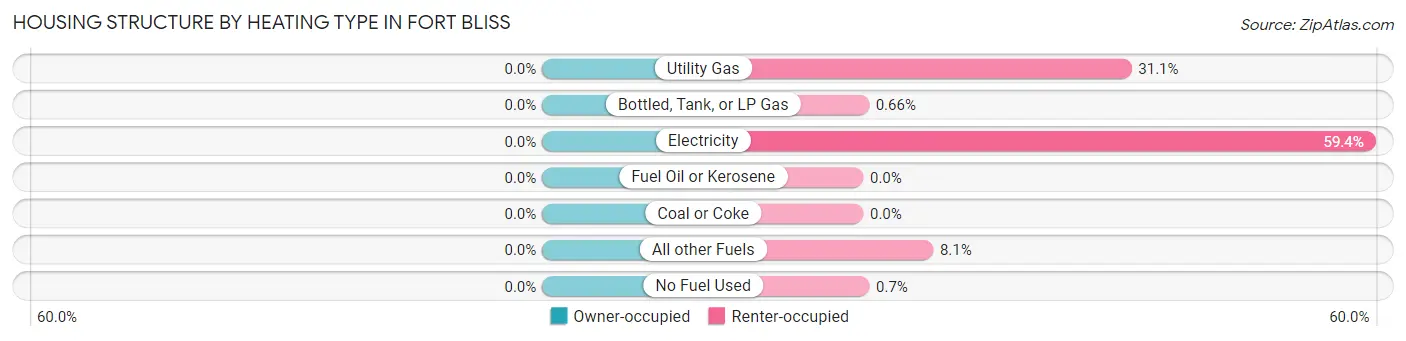
| Heating Type | Owner-occupied | Renter-occupied |
| Utility Gas | 0 (0.0%) | 710 (31.1%) |
| Bottled, Tank, or LP Gas | 0 (0.0%) | 15 (0.7%) |
| Electricity | 0 (0.0%) | 1,356 (59.4%) |
| Fuel Oil or Kerosene | 0 (0.0%) | 0 (0.0%) |
| Coal or Coke | 0 (0.0%) | 0 (0.0%) |
| All other Fuels | 0 (0.0%) | 185 (8.1%) |
| No Fuel Used | 0 (0.0%) | 16 (0.7%) |
| Total | 0 (0.0%) | 2,282 (100.0%) |
Household Vehicle Usage in Fort Bliss
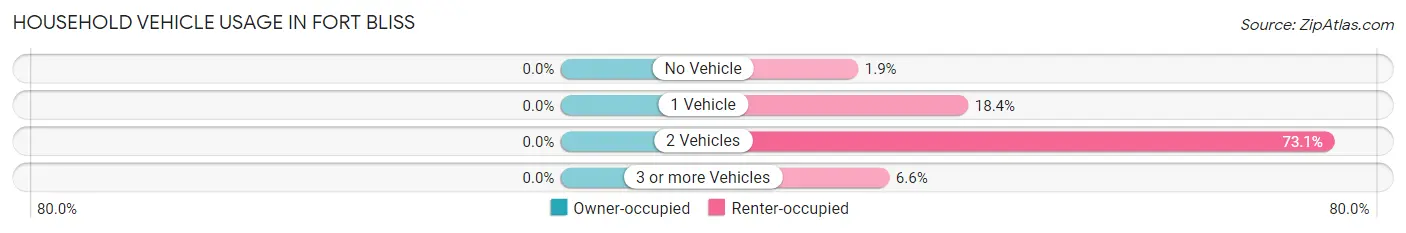
| Vehicles per Household | Owner-occupied | Renter-occupied |
| No Vehicle | 0 (0.0%) | 44 (1.9%) |
| 1 Vehicle | 0 (0.0%) | 419 (18.4%) |
| 2 Vehicles | 0 (0.0%) | 1,669 (73.1%) |
| 3 or more Vehicles | 0 (0.0%) | 150 (6.6%) |
| Total | 0 (0.0%) | 2,282 (100.0%) |
Real Estate & Mortgages in Fort Bliss
Real Estate and Mortgage Overview in Fort Bliss
| Characteristic | Without Mortgage | With Mortgage |
| Housing Units | 0 | 0 |
| Median Property Value | - | - |
| Median Household Income | - | - |
| Monthly Housing Costs | - | - |
| Real Estate Taxes | - | - |
Property Value by Mortgage Status in Fort Bliss
| Property Value | Without Mortgage | With Mortgage |
| Less than $50,000 | 0 (0.0%) | 0 (0.0%) |
| $50,000 to $99,999 | 0 (0.0%) | 0 (0.0%) |
| $100,000 to $299,999 | 0 (0.0%) | 0 (0.0%) |
| $300,000 to $499,999 | 0 (0.0%) | 0 (0.0%) |
| $500,000 to $749,999 | 0 (0.0%) | 0 (0.0%) |
| $750,000 to $999,999 | 0 (0.0%) | 0 (0.0%) |
| $1,000,000 or more | 0 (0.0%) | 0 (0.0%) |
| Total | 0 (0.0%) | 0 (0.0%) |
Household Income by Mortgage Status in Fort Bliss
| Household Income | Without Mortgage | With Mortgage |
| Less than $10,000 | 0 (0.0%) | 0 (0.0%) |
| $10,000 to $24,999 | 0 (0.0%) | 0 (0.0%) |
| $25,000 to $34,999 | 0 (0.0%) | 0 (0.0%) |
| $35,000 to $49,999 | 0 (0.0%) | 0 (0.0%) |
| $50,000 to $74,999 | 0 (0.0%) | 0 (0.0%) |
| $75,000 to $99,999 | 0 (0.0%) | 0 (0.0%) |
| $100,000 to $149,999 | 0 (0.0%) | 0 (0.0%) |
| $150,000 or more | 0 (0.0%) | 0 (0.0%) |
| Total | 0 (0.0%) | 0 (0.0%) |
Property Value to Household Income Ratio in Fort Bliss
| Value-to-Income Ratio | Without Mortgage | With Mortgage |
| Less than 2.0x | 0 (0.0%) | 0 (0.0%) |
| 2.0x to 2.9x | 0 (0.0%) | 0 (0.0%) |
| 3.0x to 3.9x | 0 (0.0%) | 0 (0.0%) |
| 4.0x or more | 0 (0.0%) | 0 (0.0%) |
| Total | 0 (0.0%) | 0 (0.0%) |
Real Estate Taxes by Mortgage Status in Fort Bliss
| Property Taxes | Without Mortgage | With Mortgage |
| Less than $800 | 0 (0.0%) | 0 (0.0%) |
| $800 to $1,499 | 0 (0.0%) | 0 (0.0%) |
| $800 to $1,499 | 0 (0.0%) | 0 (0.0%) |
| Total | 0 (0.0%) | 0 (0.0%) |
Health & Disability in Fort Bliss
Health Insurance Coverage by Age in Fort Bliss
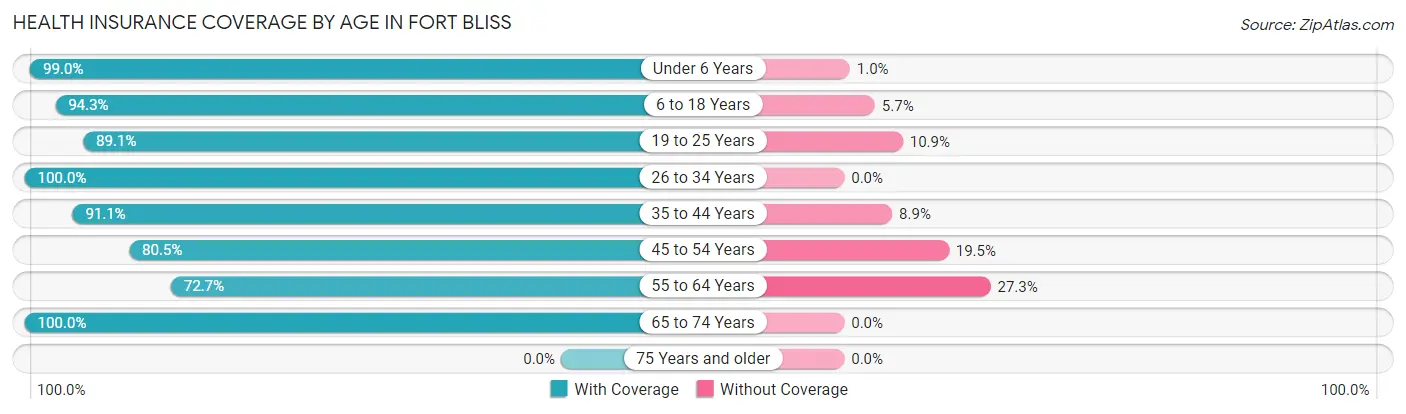
| Age Bracket | With Coverage | Without Coverage |
| Under 6 Years | 1,918 (99.0%) | 20 (1.0%) |
| 6 to 18 Years | 2,179 (94.3%) | 132 (5.7%) |
| 19 to 25 Years | 539 (89.1%) | 66 (10.9%) |
| 26 to 34 Years | 994 (100.0%) | 0 (0.0%) |
| 35 to 44 Years | 653 (91.1%) | 64 (8.9%) |
| 45 to 54 Years | 248 (80.5%) | 60 (19.5%) |
| 55 to 64 Years | 48 (72.7%) | 18 (27.3%) |
| 65 to 74 Years | 12 (100.0%) | 0 (0.0%) |
| 75 Years and older | 0 (0.0%) | 0 (0.0%) |
| Total | 6,591 (94.8%) | 360 (5.2%) |
Health Insurance Coverage by Citizenship Status in Fort Bliss
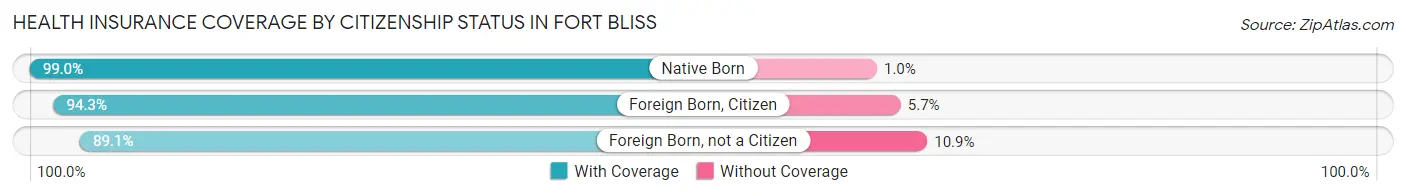
| Citizenship Status | With Coverage | Without Coverage |
| Native Born | 1,918 (99.0%) | 20 (1.0%) |
| Foreign Born, Citizen | 2,179 (94.3%) | 132 (5.7%) |
| Foreign Born, not a Citizen | 539 (89.1%) | 66 (10.9%) |
Health Insurance Coverage by Household Income in Fort Bliss
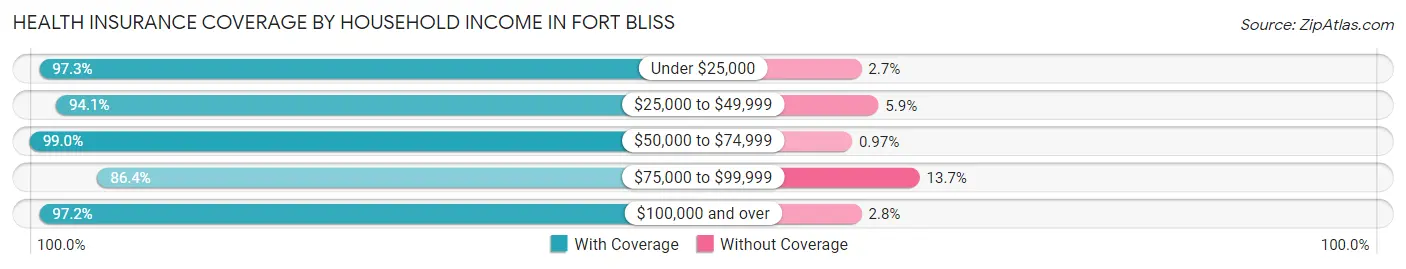
| Household Income | With Coverage | Without Coverage |
| Under $25,000 | 639 (97.3%) | 18 (2.7%) |
| $25,000 to $49,999 | 1,684 (94.1%) | 106 (5.9%) |
| $50,000 to $74,999 | 2,043 (99.0%) | 20 (1.0%) |
| $75,000 to $99,999 | 1,177 (86.4%) | 186 (13.7%) |
| $100,000 and over | 1,048 (97.2%) | 30 (2.8%) |
Public vs Private Health Insurance Coverage by Age in Fort Bliss
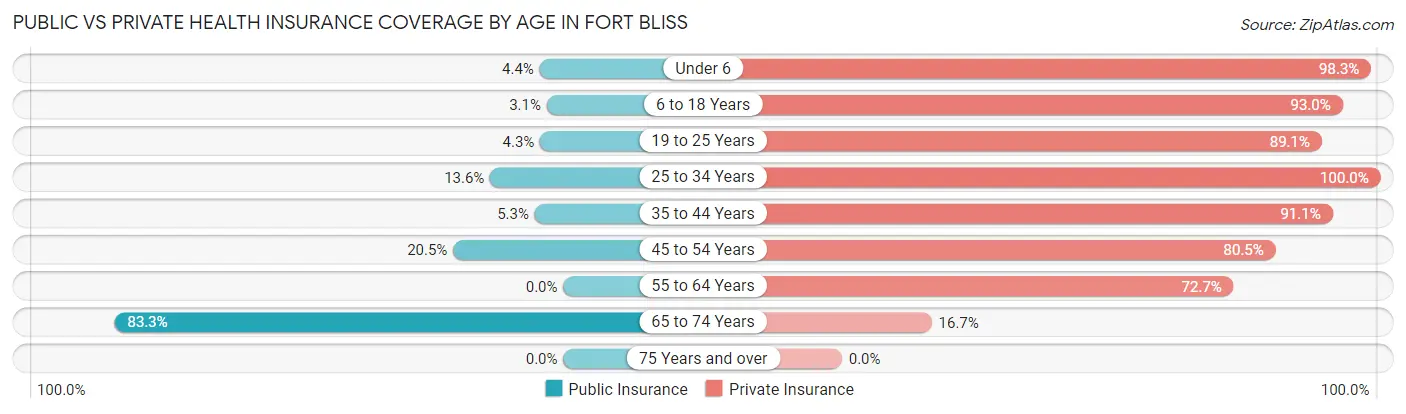
| Age Bracket | Public Insurance | Private Insurance |
| Under 6 | 85 (4.4%) | 1,904 (98.3%) |
| 6 to 18 Years | 71 (3.1%) | 2,148 (92.9%) |
| 19 to 25 Years | 26 (4.3%) | 539 (89.1%) |
| 25 to 34 Years | 135 (13.6%) | 994 (100.0%) |
| 35 to 44 Years | 38 (5.3%) | 653 (91.1%) |
| 45 to 54 Years | 63 (20.4%) | 248 (80.5%) |
| 55 to 64 Years | 0 (0.0%) | 48 (72.7%) |
| 65 to 74 Years | 10 (83.3%) | 2 (16.7%) |
| 75 Years and over | 0 (0.0%) | 0 (0.0%) |
| Total | 428 (6.2%) | 6,536 (94.0%) |
Disability Status by Sex by Age in Fort Bliss
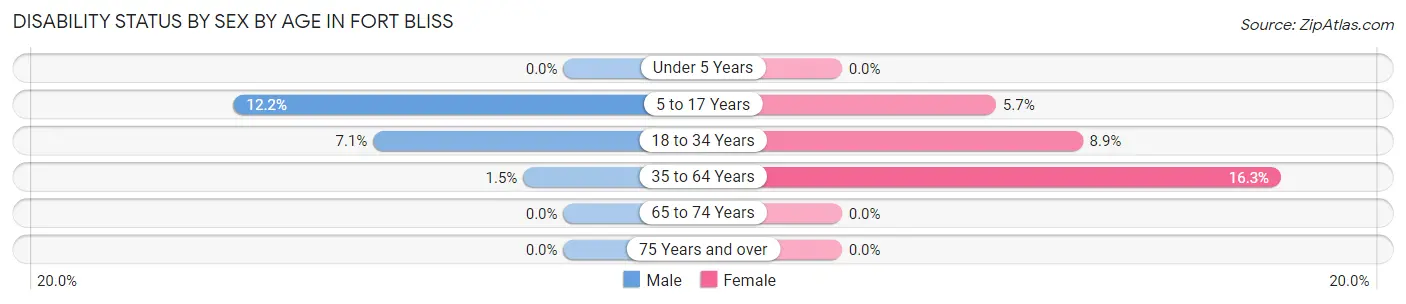
| Age Bracket | Male | Female |
| Under 5 Years | 0 (0.0%) | 0 (0.0%) |
| 5 to 17 Years | 161 (12.2%) | 77 (5.7%) |
| 18 to 34 Years | 19 (7.1%) | 122 (8.9%) |
| 35 to 64 Years | 4 (1.5%) | 134 (16.3%) |
| 65 to 74 Years | 0 (0.0%) | 0 (0.0%) |
| 75 Years and over | 0 (0.0%) | 0 (0.0%) |
Disability Class by Sex by Age in Fort Bliss
Disability Class: Hearing Difficulty
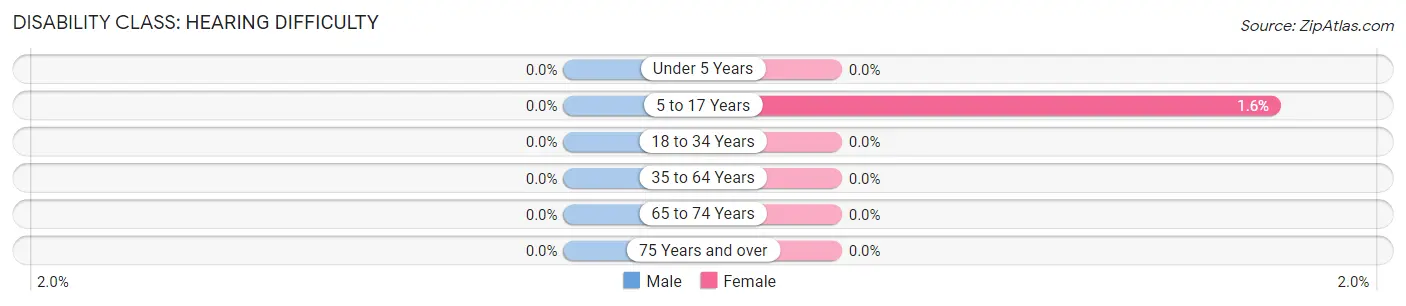
| Age Bracket | Male | Female |
| Under 5 Years | 0 (0.0%) | 0 (0.0%) |
| 5 to 17 Years | 0 (0.0%) | 22 (1.6%) |
| 18 to 34 Years | 0 (0.0%) | 0 (0.0%) |
| 35 to 64 Years | 0 (0.0%) | 0 (0.0%) |
| 65 to 74 Years | 0 (0.0%) | 0 (0.0%) |
| 75 Years and over | 0 (0.0%) | 0 (0.0%) |
Disability Class: Vision Difficulty
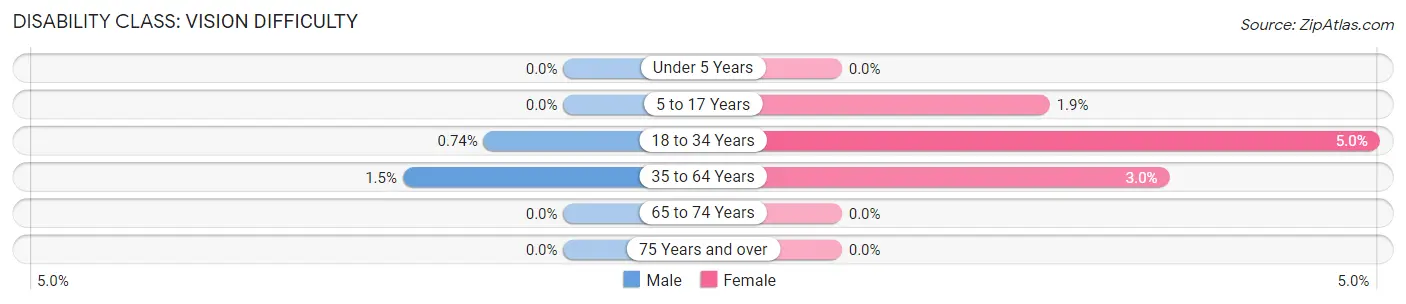
| Age Bracket | Male | Female |
| Under 5 Years | 0 (0.0%) | 0 (0.0%) |
| 5 to 17 Years | 0 (0.0%) | 26 (1.9%) |
| 18 to 34 Years | 2 (0.7%) | 68 (5.0%) |
| 35 to 64 Years | 4 (1.5%) | 25 (3.0%) |
| 65 to 74 Years | 0 (0.0%) | 0 (0.0%) |
| 75 Years and over | 0 (0.0%) | 0 (0.0%) |
Disability Class: Cognitive Difficulty
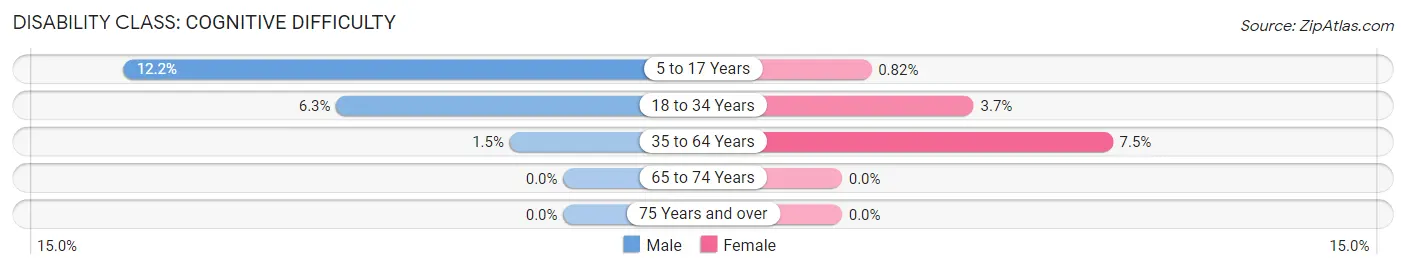
| Age Bracket | Male | Female |
| 5 to 17 Years | 161 (12.2%) | 11 (0.8%) |
| 18 to 34 Years | 17 (6.3%) | 50 (3.7%) |
| 35 to 64 Years | 4 (1.5%) | 62 (7.5%) |
| 65 to 74 Years | 0 (0.0%) | 0 (0.0%) |
| 75 Years and over | 0 (0.0%) | 0 (0.0%) |
Disability Class: Ambulatory Difficulty
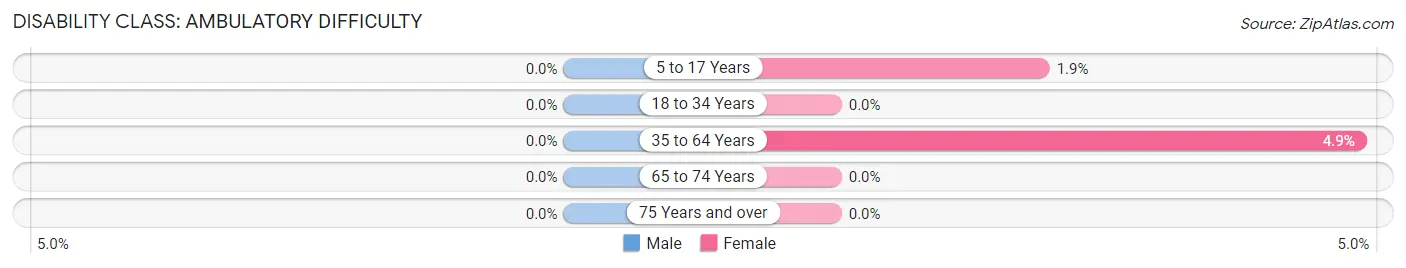
| Age Bracket | Male | Female |
| 5 to 17 Years | 0 (0.0%) | 26 (1.9%) |
| 18 to 34 Years | 0 (0.0%) | 0 (0.0%) |
| 35 to 64 Years | 0 (0.0%) | 40 (4.9%) |
| 65 to 74 Years | 0 (0.0%) | 0 (0.0%) |
| 75 Years and over | 0 (0.0%) | 0 (0.0%) |
Disability Class: Self-Care Difficulty
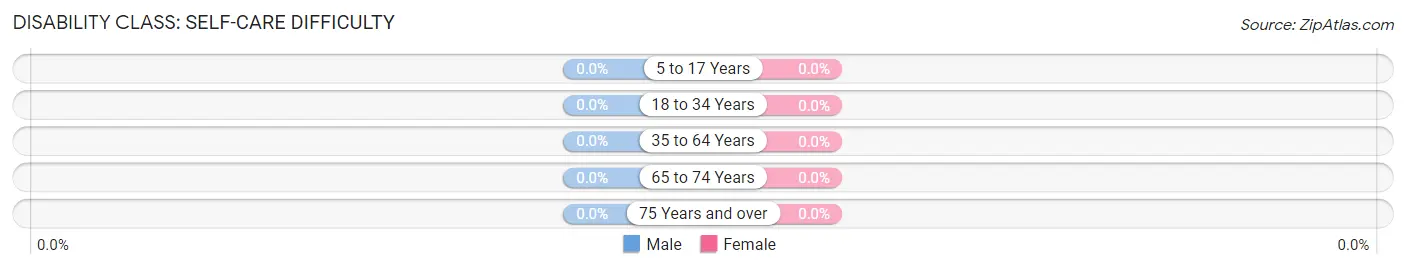
| Age Bracket | Male | Female |
| 5 to 17 Years | 0 (0.0%) | 0 (0.0%) |
| 18 to 34 Years | 0 (0.0%) | 0 (0.0%) |
| 35 to 64 Years | 0 (0.0%) | 0 (0.0%) |
| 65 to 74 Years | 0 (0.0%) | 0 (0.0%) |
| 75 Years and over | 0 (0.0%) | 0 (0.0%) |
Technology Access in Fort Bliss
Computing Device Access in Fort Bliss
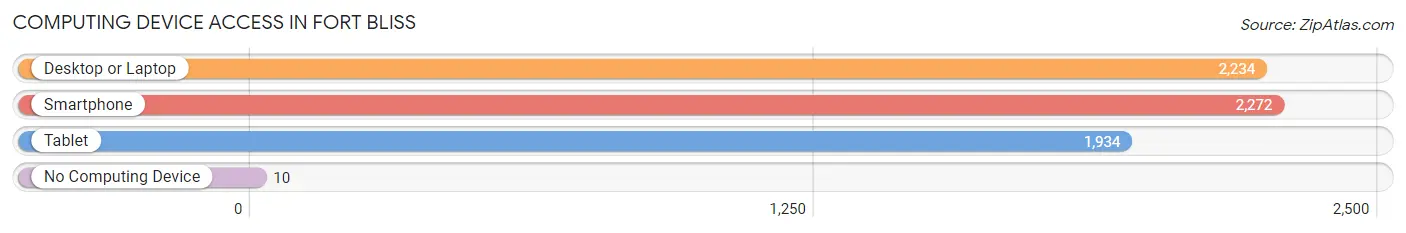
| Device Type | # Households | % Households |
| Desktop or Laptop | 2,234 | 97.9% |
| Smartphone | 2,272 | 99.6% |
| Tablet | 1,934 | 84.8% |
| No Computing Device | 10 | 0.4% |
| Total | 2,282 | 100.0% |
Internet Access in Fort Bliss
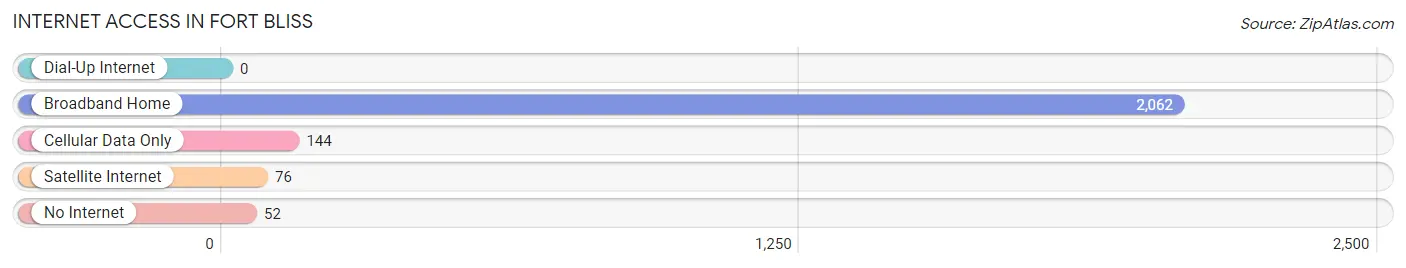
| Internet Type | # Households | % Households |
| Dial-Up Internet | 0 | 0.0% |
| Broadband Home | 2,062 | 90.4% |
| Cellular Data Only | 144 | 6.3% |
| Satellite Internet | 76 | 3.3% |
| No Internet | 52 | 2.3% |
| Total | 2,282 | 100.0% |
Fort Bliss Summary
Fort Bliss is a United States Army post located in El Paso, Texas. It is the largest military installation in the United States and is home to the 1st Armored Division, the 32nd Army Air and Missile Defense Command, and the 11th Air Defense Artillery Brigade. The post is located on the Rio Grande, near the Mexican border, and is part of the El Paso-Juarez metropolitan area.
History
Fort Bliss was established in 1848 as a military post to protect settlers in the area from Native American attacks. The post was named after Colonel William Bliss, a veteran of the Mexican-American War. In 1854, the post was moved to its current location, and in 1867, it was designated as a permanent military post.
During the Civil War, Fort Bliss was used as a staging area for Union troops. In 1877, the post was expanded to include a cavalry post, and in 1885, it was designated as a permanent cavalry post.
In the early 20th century, Fort Bliss was used as a training center for the U.S. Army. During World War I, the post was used as a mobilization center for troops heading to Europe. During World War II, the post was used as a training center for troops heading to the Pacific Theater.
In the 1950s, Fort Bliss was used as a training center for the newly formed U.S. Air Force. In the 1960s, the post was used as a staging area for troops heading to Vietnam. In the 1970s, the post was used as a training center for the newly formed U.S. Army Special Forces.
In the 1980s, Fort Bliss was used as a staging area for troops heading to the Persian Gulf War. In the 1990s, the post was used as a training center for troops heading to Iraq and Afghanistan.
Geography
Fort Bliss is located in El Paso County, Texas, on the Rio Grande, near the Mexican border. The post covers an area of 1,700 square miles and is the largest military installation in the United States.
The post is located in the Chihuahuan Desert, and the climate is arid and semi-arid. The average annual temperature is 68°F, and the average annual precipitation is 8.5 inches.
Economy
Fort Bliss is a major economic driver in El Paso County. The post has an estimated economic impact of $3.2 billion annually, and it is estimated that the post supports more than 40,000 jobs in the region.
The post is home to a variety of businesses, including retail stores, restaurants, hotels, and entertainment venues. The post also has a variety of recreational activities, including golf courses, swimming pools, and a bowling alley.
Demographics
As of 2019, Fort Bliss had an estimated population of 8,000. The post is home to a diverse population, including active duty military personnel, veterans, and civilian employees.
The post is home to a variety of ethnic and racial groups, including African Americans, Hispanics, and Native Americans. The post also has a large population of international students, as it is home to the Defense Language Institute Foreign Language Center.
Conclusion
Fort Bliss is a United States Army post located in El Paso, Texas. It is the largest military installation in the United States and is home to the 1st Armored Division, the 32nd Army Air and Missile Defense Command, and the 11th Air Defense Artillery Brigade. The post is located on the Rio Grande, near the Mexican border, and is part of the El Paso-Juarez metropolitan area. Fort Bliss has a long and storied history, and it is a major economic driver in El Paso County. The post is home to a diverse population, including active duty military personnel, veterans, and civilian employees.
Common Questions
What is Per Capita Income in Fort Bliss?
Per Capita income in Fort Bliss is $22,181.
What is the Median Family Income in Fort Bliss?
Median Family Income in Fort Bliss is $57,754.
What is the Median Household income in Fort Bliss?
Median Household Income in Fort Bliss is $57,283.
What is Income or Wage Gap in Fort Bliss?
Income or Wage Gap in Fort Bliss is 35.0%.
Women in Fort Bliss earn 65.0 cents for every dollar earned by a man.
What is Family Income Deficit in Fort Bliss?
Family Income Deficit in Fort Bliss is $10,212.
Families that are below poverty line in Fort Bliss earn $10,212 less on average than the poverty threshold level.
What is Inequality or Gini Index in Fort Bliss?
Inequality or Gini Index in Fort Bliss is 0.34.
What is the Total Population of Fort Bliss?
Total Population of Fort Bliss is 12,511.
What is the Total Male Population of Fort Bliss?
Total Male Population of Fort Bliss is 7,734.
What is the Total Female Population of Fort Bliss?
Total Female Population of Fort Bliss is 4,777.
What is the Ratio of Males per 100 Females in Fort Bliss?
There are 161.90 Males per 100 Females in Fort Bliss.
What is the Ratio of Females per 100 Males in Fort Bliss?
There are 61.77 Females per 100 Males in Fort Bliss.
What is the Median Population Age in Fort Bliss?
Median Population Age in Fort Bliss is 21.9 Years.
What is the Average Family Size in Fort Bliss
Average Family Size in Fort Bliss is 4.0 People.
What is the Average Household Size in Fort Bliss
Average Household Size in Fort Bliss is 3.8 People.
How Large is the Labor Force in Fort Bliss?
There are 6,531 People in the Labor Forcein in Fort Bliss.
What is the Percentage of People in the Labor Force in Fort Bliss?
76.5% of People are in the Labor Force in Fort Bliss.
What is the Unemployment Rate in Fort Bliss?
Unemployment Rate in Fort Bliss is 9.0%.