La Victoria, TX Map & Demographics
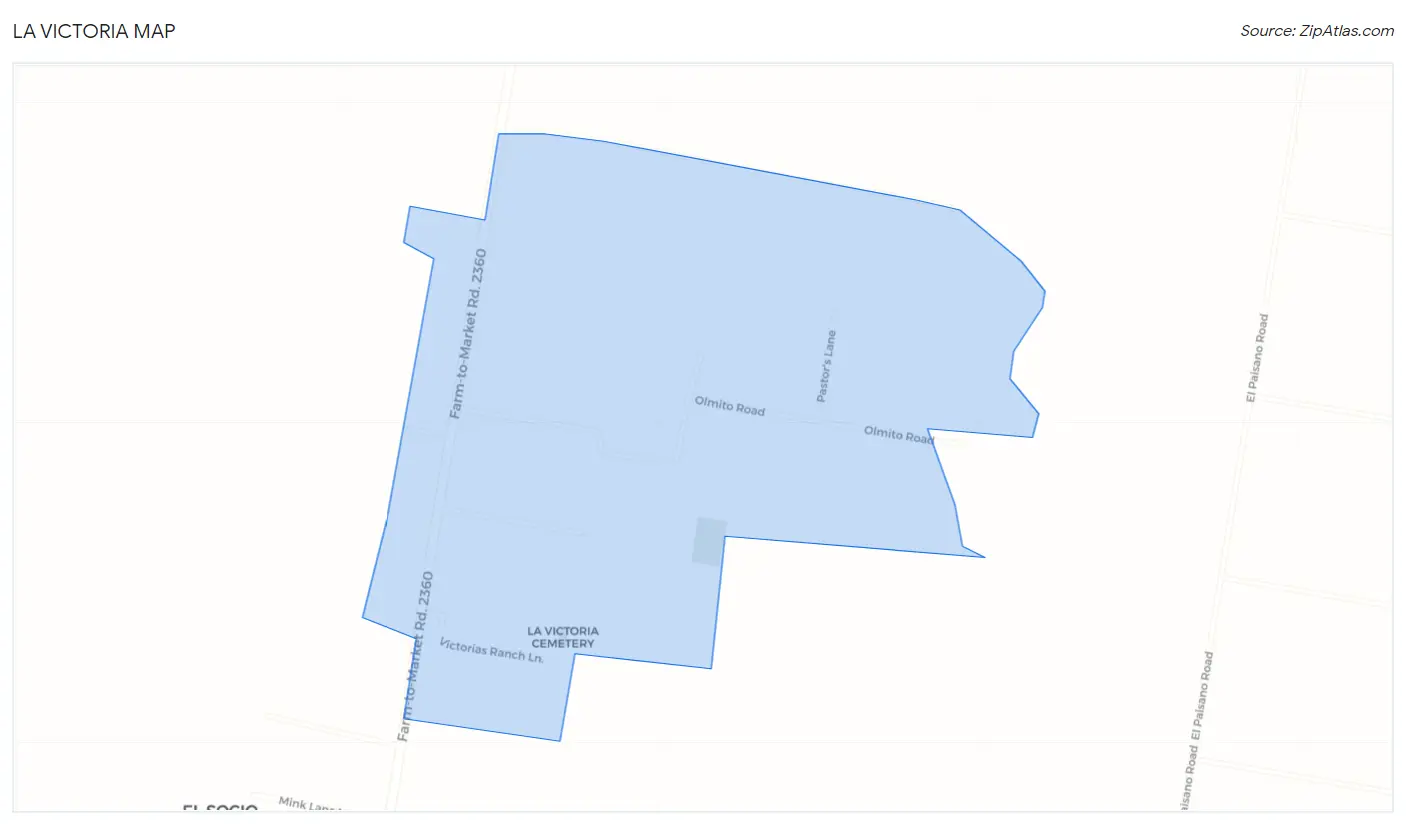
La Victoria Map
La Victoria Overview
$24,146
PER CAPITA INCOME
0.34
INEQUALITY / GINI INDEX
156
TOTAL POPULATION
65
MALE POPULATION
91
FEMALE POPULATION
71.43
MALES / 100 FEMALES
140.00
FEMALES / 100 MALES
62.3
MEDIAN AGE
3.0
AVG FAMILY SIZE
2.4
AVG HOUSEHOLD SIZE
44
LABOR FORCE [ PEOPLE ]
28.2%
PERCENT IN LABOR FORCE
Income in La Victoria
Income Overview in La Victoria
| Characteristic | Number | Measure |
| Per Capita Income | 156 | $24,146 |
| Median Family Income | 46 | $0 |
| Mean Family Income | 46 | $66,574 |
| Median Household Income | 65 | $0 |
| Mean Household Income | 65 | $57,238 |
| Income Deficit | 46 | $0 |
| Wage / Income Gap (%) | 156 | 0.00% |
| Wage / Income Gap ($) | 156 | 100.00¢ per $1 |
| Gini / Inequality Index | 156 | 0.34 |
Earnings by Sex in La Victoria
| Sex | Number | Average Earnings |
| Male | 10 (22.7%) | $0 |
| Female | 34 (77.3%) | $0 |
| Total | 44 (100.0%) | $0 |
Earnings by Sex by Income Bracket in La Victoria
The most common earnings brackets in La Victoria are $55,000 to $64,999 for men (10 | 100.0%) and $2,500 to $4,999 for women (27 | 79.4%).
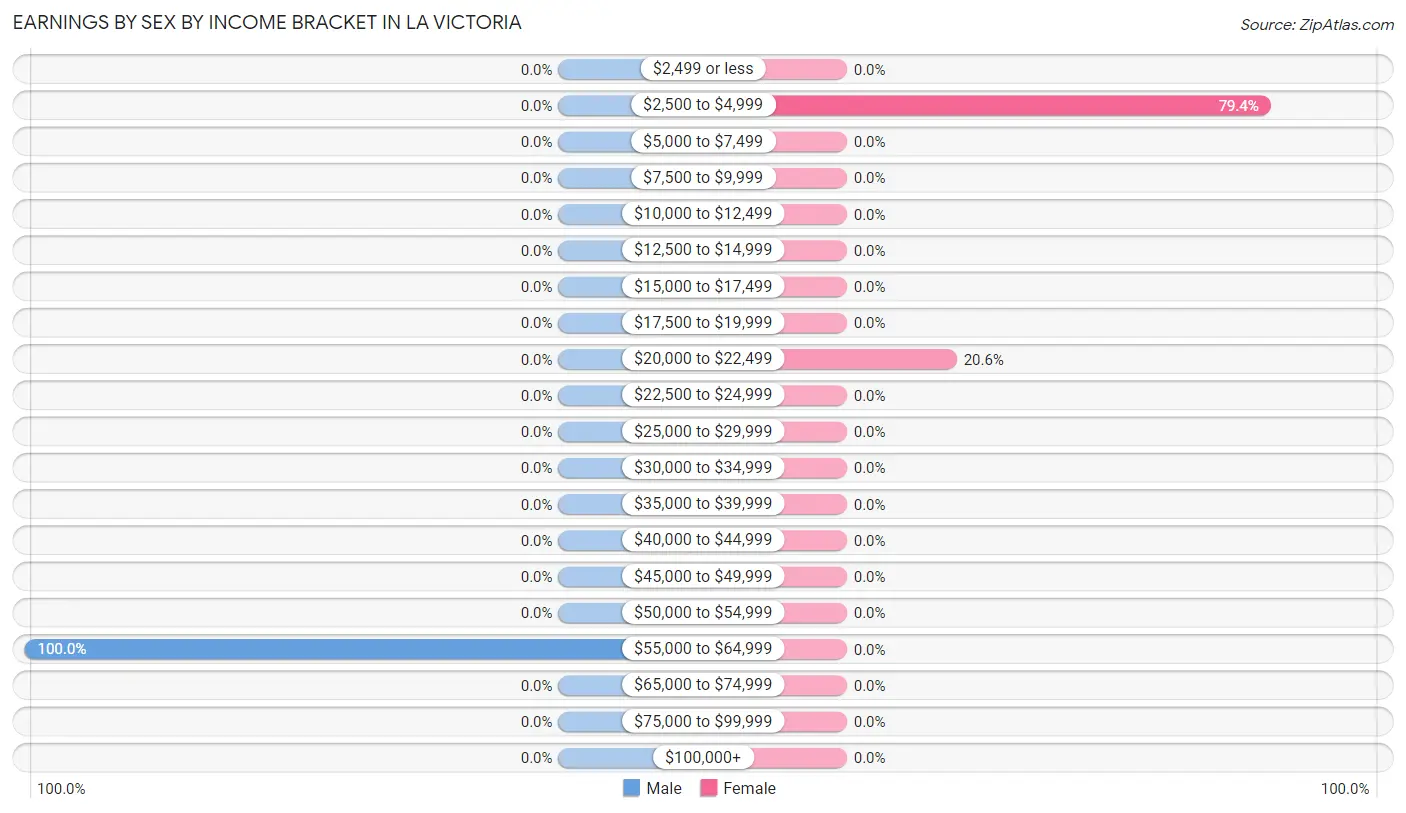
| Income | Male | Female |
| $2,499 or less | 0 (0.0%) | 0 (0.0%) |
| $2,500 to $4,999 | 0 (0.0%) | 27 (79.4%) |
| $5,000 to $7,499 | 0 (0.0%) | 0 (0.0%) |
| $7,500 to $9,999 | 0 (0.0%) | 0 (0.0%) |
| $10,000 to $12,499 | 0 (0.0%) | 0 (0.0%) |
| $12,500 to $14,999 | 0 (0.0%) | 0 (0.0%) |
| $15,000 to $17,499 | 0 (0.0%) | 0 (0.0%) |
| $17,500 to $19,999 | 0 (0.0%) | 0 (0.0%) |
| $20,000 to $22,499 | 0 (0.0%) | 7 (20.6%) |
| $22,500 to $24,999 | 0 (0.0%) | 0 (0.0%) |
| $25,000 to $29,999 | 0 (0.0%) | 0 (0.0%) |
| $30,000 to $34,999 | 0 (0.0%) | 0 (0.0%) |
| $35,000 to $39,999 | 0 (0.0%) | 0 (0.0%) |
| $40,000 to $44,999 | 0 (0.0%) | 0 (0.0%) |
| $45,000 to $49,999 | 0 (0.0%) | 0 (0.0%) |
| $50,000 to $54,999 | 0 (0.0%) | 0 (0.0%) |
| $55,000 to $64,999 | 10 (100.0%) | 0 (0.0%) |
| $65,000 to $74,999 | 0 (0.0%) | 0 (0.0%) |
| $75,000 to $99,999 | 0 (0.0%) | 0 (0.0%) |
| $100,000+ | 0 (0.0%) | 0 (0.0%) |
| Total | 10 (100.0%) | 34 (100.0%) |
Earnings by Sex by Educational Attainment in La Victoria
| Educational Attainment | Male Income | Female Income |
| Less than High School | - | - |
| High School Diploma | - | - |
| College or Associate's Degree | - | - |
| Bachelor's Degree | - | - |
| Graduate Degree | - | - |
| Total | - | - |
Family Income in La Victoria
Family Income Brackets in La Victoria
According to the La Victoria family income data, there are 27 families falling into the $75,000 to $99,999 income range, which is the most common income bracket and makes up 58.7% of all families.
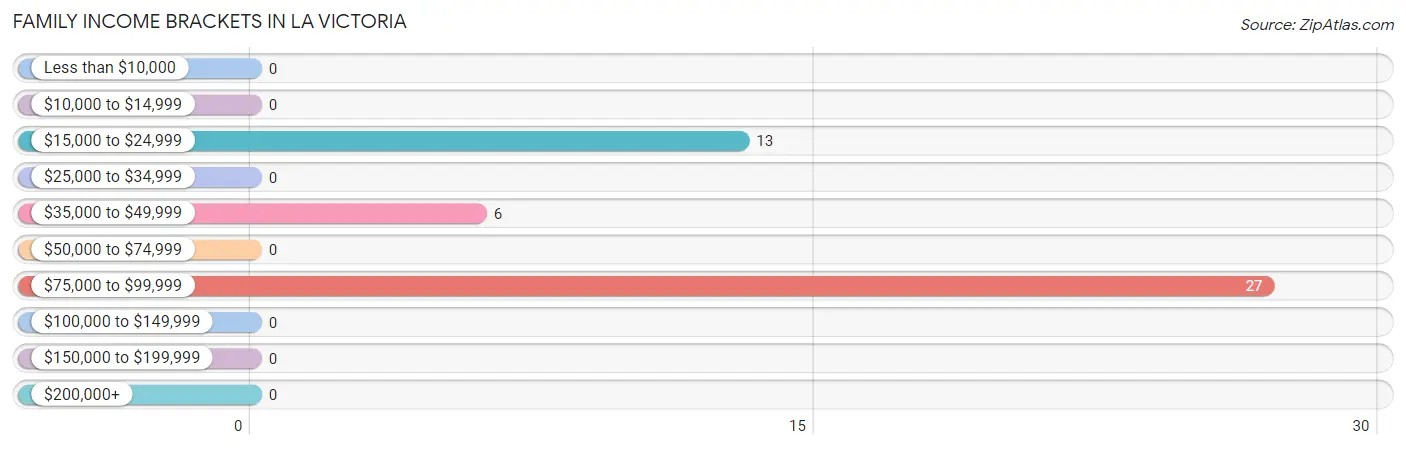
| Income Bracket | # Families | % Families |
| Less than $10,000 | 0 | 0.0% |
| $10,000 to $14,999 | 0 | 0.0% |
| $15,000 to $24,999 | 13 | 28.3% |
| $25,000 to $34,999 | 0 | 0.0% |
| $35,000 to $49,999 | 6 | 13.0% |
| $50,000 to $74,999 | 0 | 0.0% |
| $75,000 to $99,999 | 27 | 58.7% |
| $100,000 to $149,999 | 0 | 0.0% |
| $150,000 to $199,999 | 0 | 0.0% |
| $200,000+ | 0 | 0.0% |
Family Income by Famaliy Size in La Victoria
| Income Bracket | # Families | Median Income |
| 2-Person Families | 19 (41.3%) | $0 |
| 3-Person Families | 27 (58.7%) | $0 |
| 4-Person Families | 0 (0.0%) | $0 |
| 5-Person Families | 0 (0.0%) | $0 |
| 6-Person Families | 0 (0.0%) | $0 |
| 7+ Person Families | 0 (0.0%) | $0 |
| Total | 46 (100.0%) | $0 |
Family Income by Number of Earners in La Victoria
| Number of Earners | # Families | Median Income |
| No Earners | 13 (28.3%) | $0 |
| 1 Earner | 33 (71.7%) | $0 |
| 2 Earners | 0 (0.0%) | $0 |
| 3+ Earners | 0 (0.0%) | $0 |
| Total | 46 (100.0%) | $0 |
Household Income in La Victoria
Household Income Brackets in La Victoria
With 27 households falling in the category, the $75,000 to $99,999 income range is the most frequent in La Victoria, accounting for 41.5% of all households.
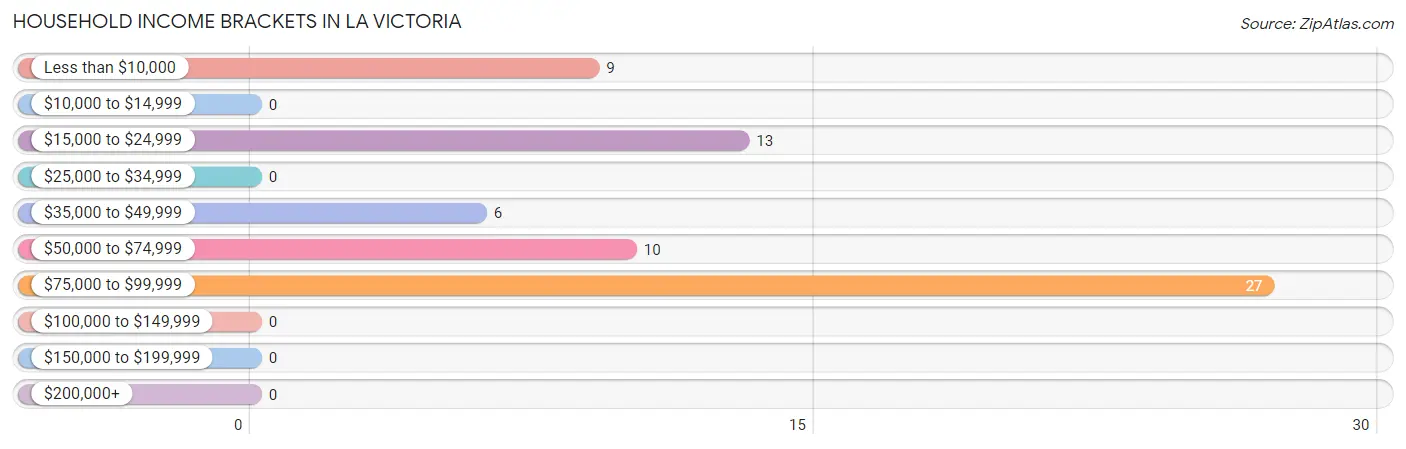
| Income Bracket | # Households | % Households |
| Less than $10,000 | 9 | 13.8% |
| $10,000 to $14,999 | 0 | 0.0% |
| $15,000 to $24,999 | 13 | 20.0% |
| $25,000 to $34,999 | 0 | 0.0% |
| $35,000 to $49,999 | 6 | 9.2% |
| $50,000 to $74,999 | 10 | 15.4% |
| $75,000 to $99,999 | 27 | 41.5% |
| $100,000 to $149,999 | 0 | 0.0% |
| $150,000 to $199,999 | 0 | 0.0% |
| $200,000+ | 0 | 0.0% |
Household Income by Householder Age in La Victoria
The median household income in La Victoria is $0, with the highest median household income of $95,370 found in the 45 to 64 years age bracket for the primary householder. A total of 46 households (70.8%) fall into this category.
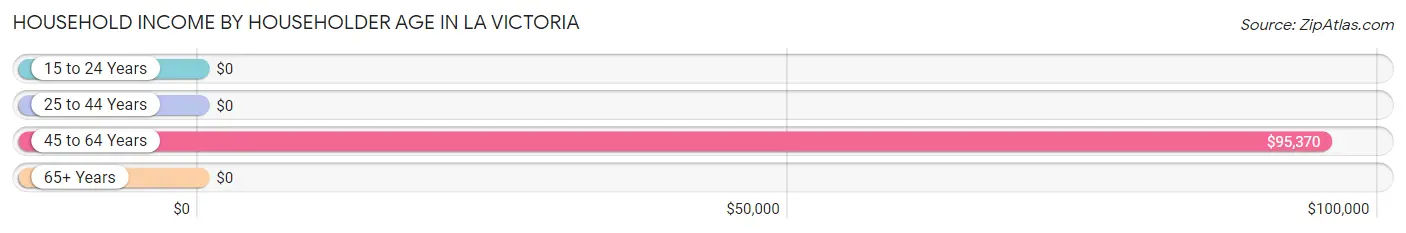
| Income Bracket | # Households | Median Income |
| 15 to 24 Years | 0 (0.0%) | $0 |
| 25 to 44 Years | 0 (0.0%) | $0 |
| 45 to 64 Years | 46 (70.8%) | $95,370 |
| 65+ Years | 19 (29.2%) | $0 |
| Total | 65 (100.0%) | $0 |
Poverty in La Victoria
Income Below Poverty by Sex and Age in La Victoria
With 33.9% poverty level for males and 18.7% for females among the residents of La Victoria, 75 year old and over males and 45 to 54 year old females are the most vulnerable to poverty, with 19 males (100.0%) and 4 females (100.0%) in their respective age groups living below the poverty level.
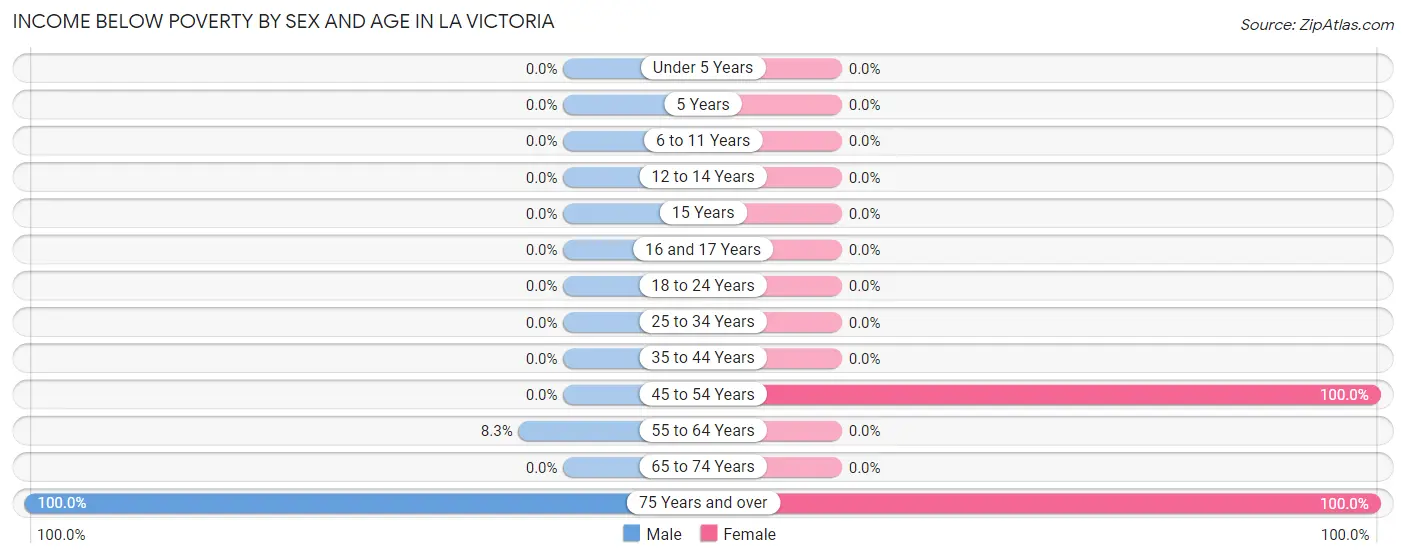
| Age Bracket | Male | Female |
| Under 5 Years | 0 (0.0%) | 0 (0.0%) |
| 5 Years | 0 (0.0%) | 0 (0.0%) |
| 6 to 11 Years | 0 (0.0%) | 0 (0.0%) |
| 12 to 14 Years | 0 (0.0%) | 0 (0.0%) |
| 15 Years | 0 (0.0%) | 0 (0.0%) |
| 16 and 17 Years | 0 (0.0%) | 0 (0.0%) |
| 18 to 24 Years | 0 (0.0%) | 0 (0.0%) |
| 25 to 34 Years | 0 (0.0%) | 0 (0.0%) |
| 35 to 44 Years | 0 (0.0%) | 0 (0.0%) |
| 45 to 54 Years | 0 (0.0%) | 4 (100.0%) |
| 55 to 64 Years | 3 (8.3%) | 0 (0.0%) |
| 65 to 74 Years | 0 (0.0%) | 0 (0.0%) |
| 75 Years and over | 19 (100.0%) | 13 (100.0%) |
| Total | 22 (33.9%) | 17 (18.7%) |
Income Above Poverty by Sex and Age in La Victoria
According to the poverty statistics in La Victoria, males aged 45 to 54 years and females aged 18 to 24 years are the age groups that are most secure financially, with 100.0% of males and 100.0% of females in these age groups living above the poverty line.
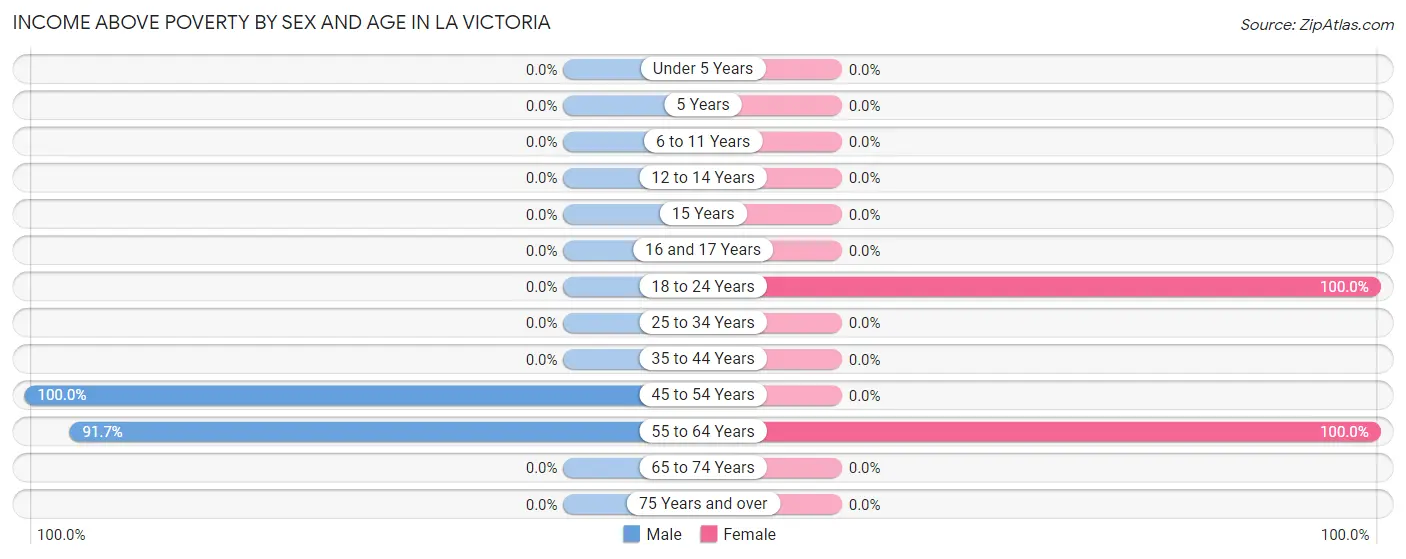
| Age Bracket | Male | Female |
| Under 5 Years | 0 (0.0%) | 0 (0.0%) |
| 5 Years | 0 (0.0%) | 0 (0.0%) |
| 6 to 11 Years | 0 (0.0%) | 0 (0.0%) |
| 12 to 14 Years | 0 (0.0%) | 0 (0.0%) |
| 15 Years | 0 (0.0%) | 0 (0.0%) |
| 16 and 17 Years | 0 (0.0%) | 0 (0.0%) |
| 18 to 24 Years | 0 (0.0%) | 40 (100.0%) |
| 25 to 34 Years | 0 (0.0%) | 0 (0.0%) |
| 35 to 44 Years | 0 (0.0%) | 0 (0.0%) |
| 45 to 54 Years | 10 (100.0%) | 0 (0.0%) |
| 55 to 64 Years | 33 (91.7%) | 34 (100.0%) |
| 65 to 74 Years | 0 (0.0%) | 0 (0.0%) |
| 75 Years and over | 0 (0.0%) | 0 (0.0%) |
| Total | 43 (66.1%) | 74 (81.3%) |
Income Below Poverty Among Married-Couple Families in La Victoria
The poverty statistics for married-couple families in La Victoria show that 28.3% or 13 of the total 46 families live below the poverty line. Families with no children have the highest poverty rate of 28.3%, comprising of 13 families. On the other hand, families with no children have the lowest poverty rate of 28.3%, which includes 13 families.
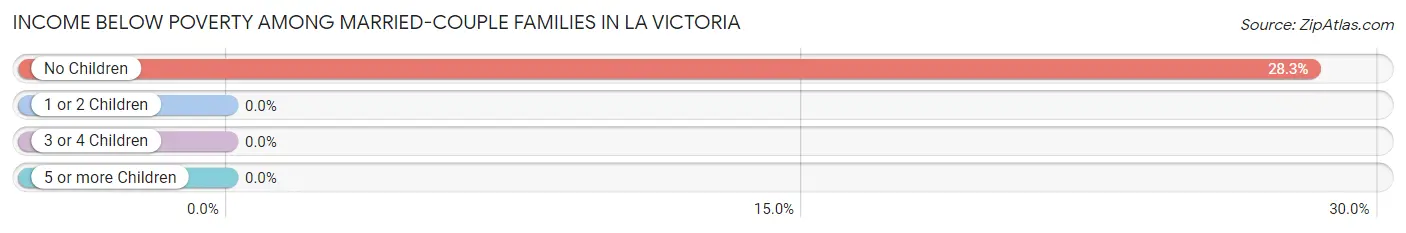
| Children | Above Poverty | Below Poverty |
| No Children | 33 (71.7%) | 13 (28.3%) |
| 1 or 2 Children | 0 (0.0%) | 0 (0.0%) |
| 3 or 4 Children | 0 (0.0%) | 0 (0.0%) |
| 5 or more Children | 0 (0.0%) | 0 (0.0%) |
| Total | 33 (71.7%) | 13 (28.3%) |
Income Below Poverty Among Single-Parent Households in La Victoria
| Children | Single Father | Single Mother |
| No Children | 0 (0.0%) | 0 (0.0%) |
| 1 or 2 Children | 0 (0.0%) | 0 (0.0%) |
| 3 or 4 Children | 0 (0.0%) | 0 (0.0%) |
| 5 or more Children | 0 (0.0%) | 0 (0.0%) |
| Total | 0 (0.0%) | 0 (0.0%) |
Income Below Poverty Among Married-Couple vs Single-Parent Households in La Victoria
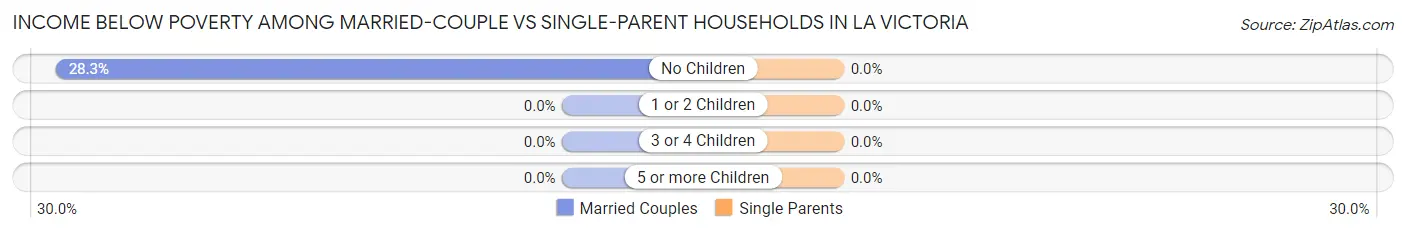
| Children | Married-Couple Families | Single-Parent Households |
| No Children | 13 (28.3%) | 0 (0.0%) |
| 1 or 2 Children | 0 (0.0%) | 0 (0.0%) |
| 3 or 4 Children | 0 (0.0%) | 0 (0.0%) |
| 5 or more Children | 0 (0.0%) | 0 (0.0%) |
| Total | 13 (28.3%) | 0 (0.0%) |
Race in La Victoria
The most populous races in La Victoria are White / Caucasian (119 | 76.3%), Hispanic or Latino (62 | 39.7%), and Two or more Races (37 | 23.7%).
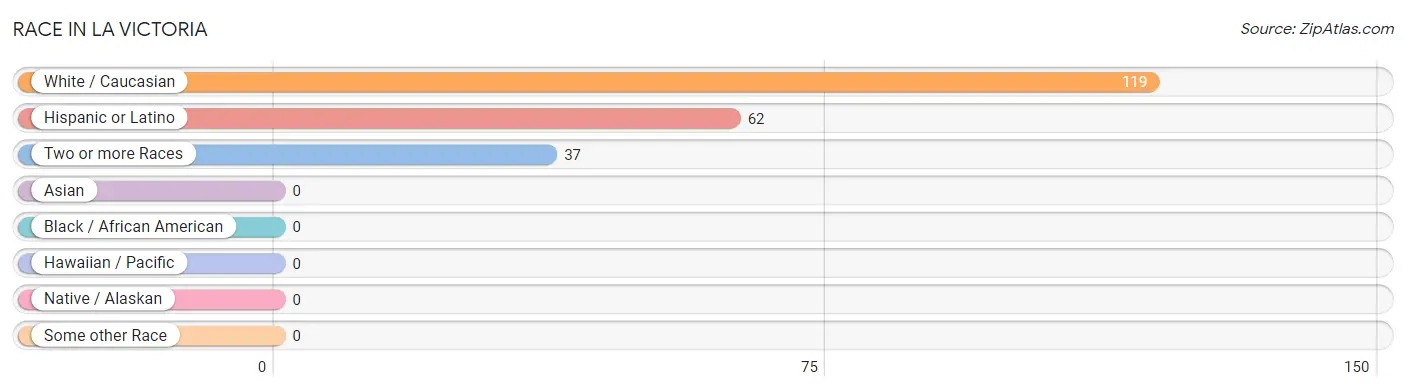
| Race | # Population | % Population |
| Asian | 0 | 0.0% |
| Black / African American | 0 | 0.0% |
| Hawaiian / Pacific | 0 | 0.0% |
| Hispanic or Latino | 62 | 39.7% |
| Native / Alaskan | 0 | 0.0% |
| White / Caucasian | 119 | 76.3% |
| Two or more Races | 37 | 23.7% |
| Some other Race | 0 | 0.0% |
| Total | 156 | 100.0% |
Ancestry in La Victoria
The most populous ancestries reported in La Victoria are , and Mexican (62 | 39.7%), together accounting for 39.7% of all La Victoria residents.

| Ancestry | # Population | % Population |
| Mexican | 62 | 39.7% | View All 1 Rows |
Immigrants in La Victoria
The most numerous immigrant groups reported in La Victoria came from Central America (16 | 10.3%), Latin America (16 | 10.3%), and Mexico (16 | 10.3%), together accounting for 30.8% of all La Victoria residents.
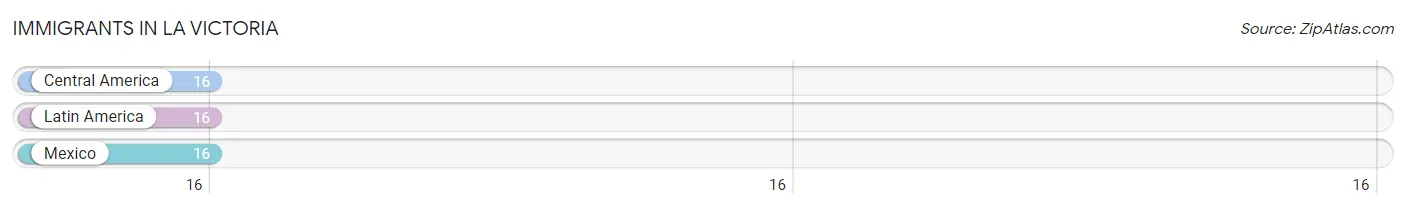
| Immigration Origin | # Population | % Population |
| Central America | 16 | 10.3% |
| Latin America | 16 | 10.3% |
| Mexico | 16 | 10.3% | View All 3 Rows |
Sex and Age in La Victoria
Sex and Age in La Victoria
The most populous age groups in La Victoria are 60 to 64 Years (36 | 55.4%) for men and 20 to 24 Years (40 | 44.0%) for women.
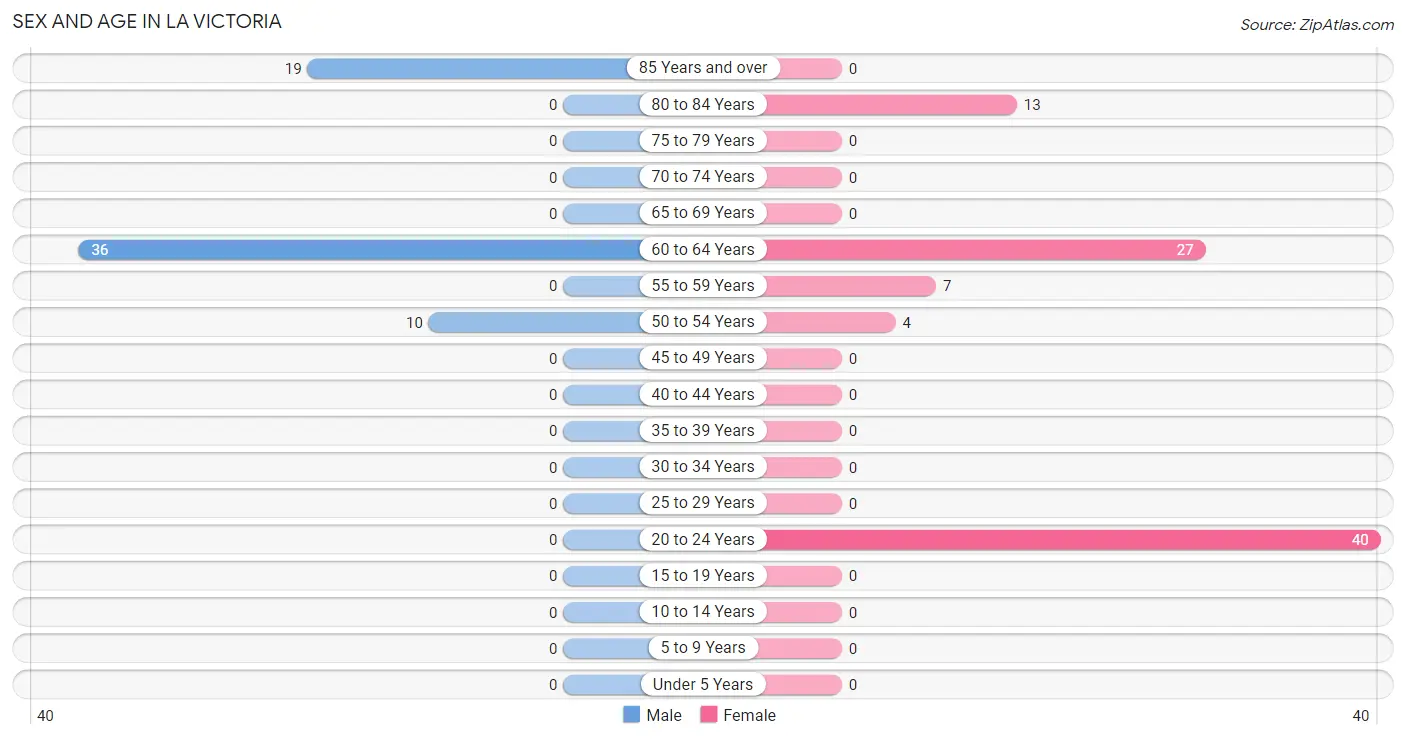
| Age Bracket | Male | Female |
| Under 5 Years | 0 (0.0%) | 0 (0.0%) |
| 5 to 9 Years | 0 (0.0%) | 0 (0.0%) |
| 10 to 14 Years | 0 (0.0%) | 0 (0.0%) |
| 15 to 19 Years | 0 (0.0%) | 0 (0.0%) |
| 20 to 24 Years | 0 (0.0%) | 40 (44.0%) |
| 25 to 29 Years | 0 (0.0%) | 0 (0.0%) |
| 30 to 34 Years | 0 (0.0%) | 0 (0.0%) |
| 35 to 39 Years | 0 (0.0%) | 0 (0.0%) |
| 40 to 44 Years | 0 (0.0%) | 0 (0.0%) |
| 45 to 49 Years | 0 (0.0%) | 0 (0.0%) |
| 50 to 54 Years | 10 (15.4%) | 4 (4.4%) |
| 55 to 59 Years | 0 (0.0%) | 7 (7.7%) |
| 60 to 64 Years | 36 (55.4%) | 27 (29.7%) |
| 65 to 69 Years | 0 (0.0%) | 0 (0.0%) |
| 70 to 74 Years | 0 (0.0%) | 0 (0.0%) |
| 75 to 79 Years | 0 (0.0%) | 0 (0.0%) |
| 80 to 84 Years | 0 (0.0%) | 13 (14.3%) |
| 85 Years and over | 19 (29.2%) | 0 (0.0%) |
| Total | 65 (100.0%) | 91 (100.0%) |
Families and Households in La Victoria
Median Family Size in La Victoria
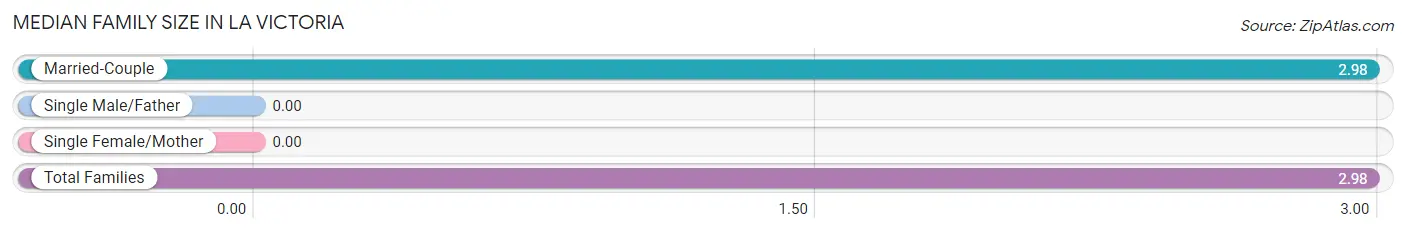
| Family Type | # Families | Family Size |
| Married-Couple | 46 (100.0%) | 2.98 |
| Single Male/Father | 0 (0.0%) | - |
| Single Female/Mother | 0 (0.0%) | - |
| Total Families | 46 (100.0%) | 2.98 |
Median Household Size in La Victoria
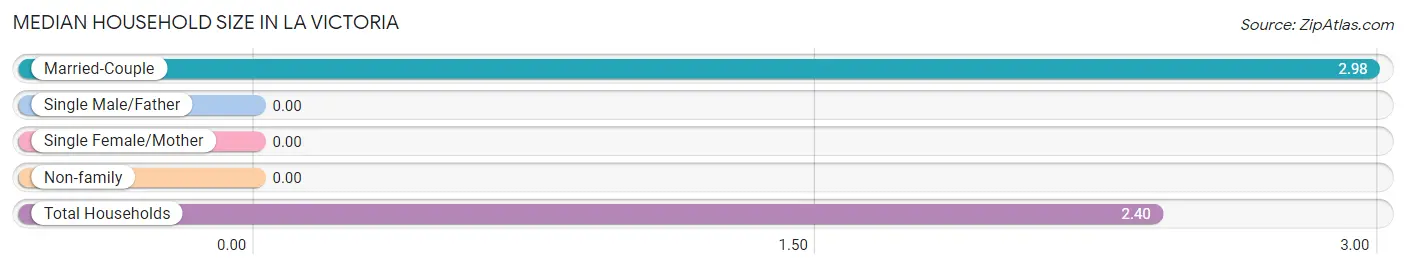
| Household Type | # Households | Household Size |
| Married-Couple | 46 (70.8%) | 2.98 |
| Single Male/Father | 0 (0.0%) | - |
| Single Female/Mother | 0 (0.0%) | - |
| Non-family | 19 (29.2%) | - |
| Total Households | 65 (100.0%) | 2.40 |
Household Size by Marriage Status in La Victoria
Out of a total of 65 households in La Victoria, 46 (70.8%) are family households, while 19 (29.2%) are nonfamily households. The most numerous type of family households are 3-person households, comprising 27, and the most common type of nonfamily households are 1-person households, comprising 19.
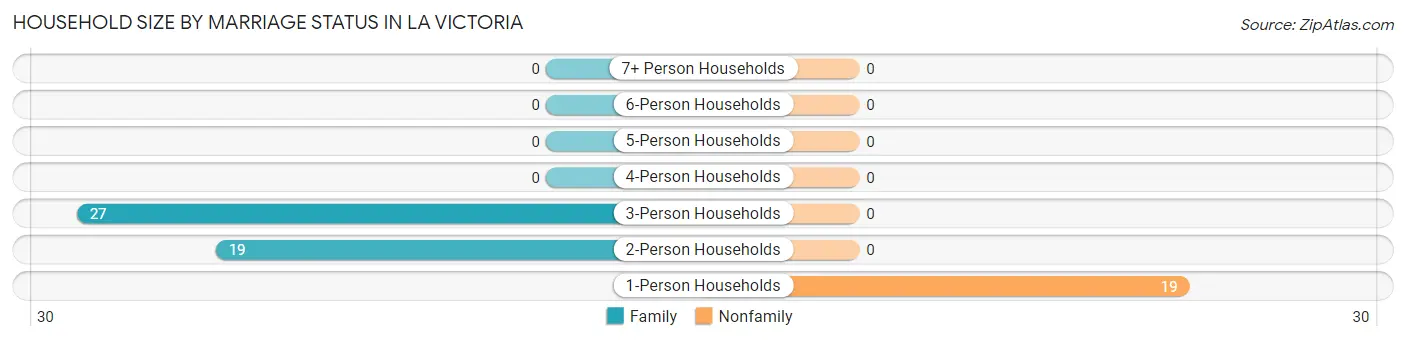
| Household Size | Family Households | Nonfamily Households |
| 1-Person Households | - | 19 (29.2%) |
| 2-Person Households | 19 (29.2%) | 0 (0.0%) |
| 3-Person Households | 27 (41.5%) | 0 (0.0%) |
| 4-Person Households | 0 (0.0%) | 0 (0.0%) |
| 5-Person Households | 0 (0.0%) | 0 (0.0%) |
| 6-Person Households | 0 (0.0%) | 0 (0.0%) |
| 7+ Person Households | 0 (0.0%) | 0 (0.0%) |
| Total | 46 (70.8%) | 19 (29.2%) |
Female Fertility in La Victoria
Fertility by Age in La Victoria
| Age Bracket | Women with Births | Births / 1,000 Women |
| 15 to 19 years | 0 (0.0%) | 0.0 |
| 20 to 34 years | 0 (0.0%) | 0.0 |
| 35 to 50 years | 0 (0.0%) | 0.0 |
| Total | 0 (0.0%) | 0.0 |
Fertility by Age by Marriage Status in La Victoria
| Age Bracket | Married | Unmarried |
| 15 to 19 years | 0 (0.0%) | 0 (0.0%) |
| 20 to 34 years | 0 (0.0%) | 0 (0.0%) |
| 35 to 50 years | 0 (0.0%) | 0 (0.0%) |
| Total | 0 (0.0%) | 0 (0.0%) |
Fertility by Education in La Victoria
| Educational Attainment | Women with Births | Births / 1,000 Women |
| Less than High School | 0 (0.0%) | 0.0 |
| High School Diploma | 0 (0.0%) | 0.0 |
| College or Associate's Degree | 0 (0.0%) | 0.0 |
| Bachelor's Degree | 0 (0.0%) | 0.0 |
| Graduate Degree | 0 (0.0%) | 0.0 |
| Total | 0 (0.0%) | 0.0 |
Fertility by Education by Marriage Status in La Victoria
| Educational Attainment | Married | Unmarried |
| Less than High School | 0 (0.0%) | 0 (0.0%) |
| High School Diploma | 0 (0.0%) | 0 (0.0%) |
| College or Associate's Degree | 0 (0.0%) | 0 (0.0%) |
| Bachelor's Degree | 0 (0.0%) | 0 (0.0%) |
| Graduate Degree | 0 (0.0%) | 0 (0.0%) |
| Total | 0 (0.0%) | 0 (0.0%) |
Employment Characteristics in La Victoria
Employment by Class of Employer in La Victoria
Among the 34 employed individuals in La Victoria, private company employees (27 | 79.4%), and state government employees (7 | 20.6%) make up the most common classes of employment.
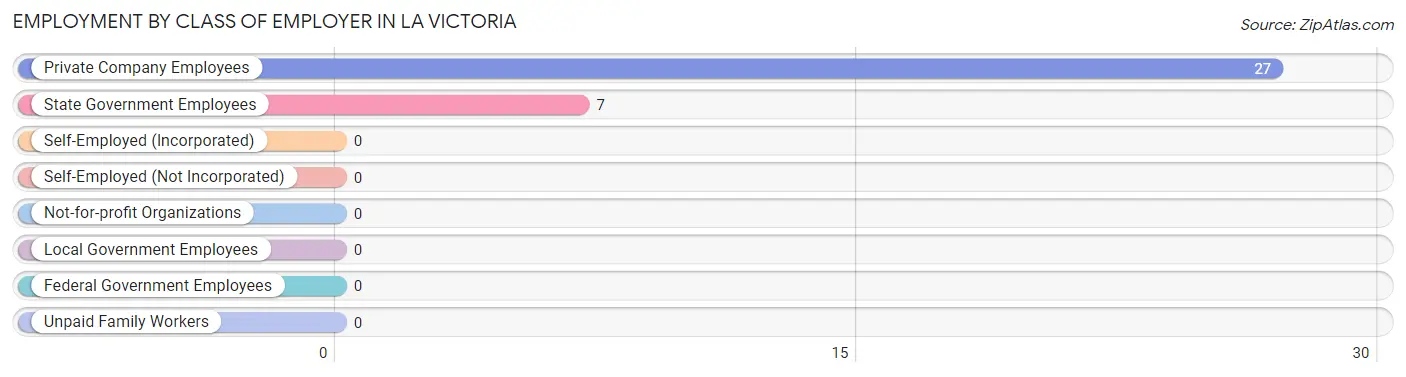
| Employer Class | # Employees | % Employees |
| Private Company Employees | 27 | 79.4% |
| Self-Employed (Incorporated) | 0 | 0.0% |
| Self-Employed (Not Incorporated) | 0 | 0.0% |
| Not-for-profit Organizations | 0 | 0.0% |
| Local Government Employees | 0 | 0.0% |
| State Government Employees | 7 | 20.6% |
| Federal Government Employees | 0 | 0.0% |
| Unpaid Family Workers | 0 | 0.0% |
| Total | 34 | 100.0% |
Employment Status by Age in La Victoria
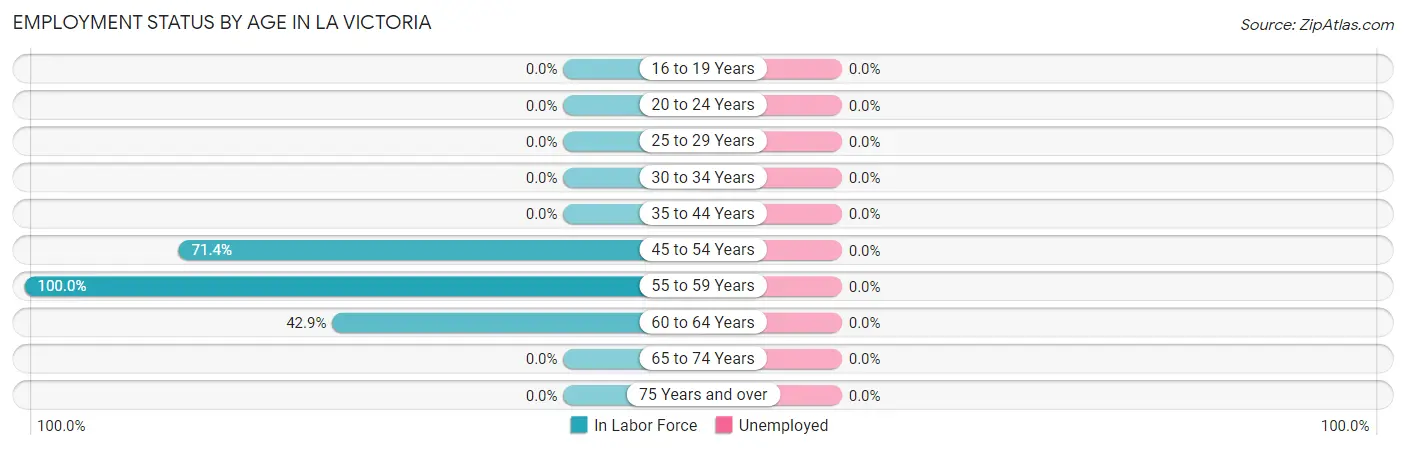
| Age Bracket | In Labor Force | Unemployed |
| 16 to 19 Years | 0 (0.0%) | 0 (0.0%) |
| 20 to 24 Years | 0 (0.0%) | 0 (0.0%) |
| 25 to 29 Years | 0 (0.0%) | 0 (0.0%) |
| 30 to 34 Years | 0 (0.0%) | 0 (0.0%) |
| 35 to 44 Years | 0 (0.0%) | 0 (0.0%) |
| 45 to 54 Years | 10 (71.4%) | 0 (0.0%) |
| 55 to 59 Years | 7 (100.0%) | 0 (0.0%) |
| 60 to 64 Years | 27 (42.9%) | 0 (0.0%) |
| 65 to 74 Years | 0 (0.0%) | 0 (0.0%) |
| 75 Years and over | 0 (0.0%) | 0 (0.0%) |
| Total | 44 (28.2%) | 0 (0.0%) |
Employment Status by Educational Attainment in La Victoria
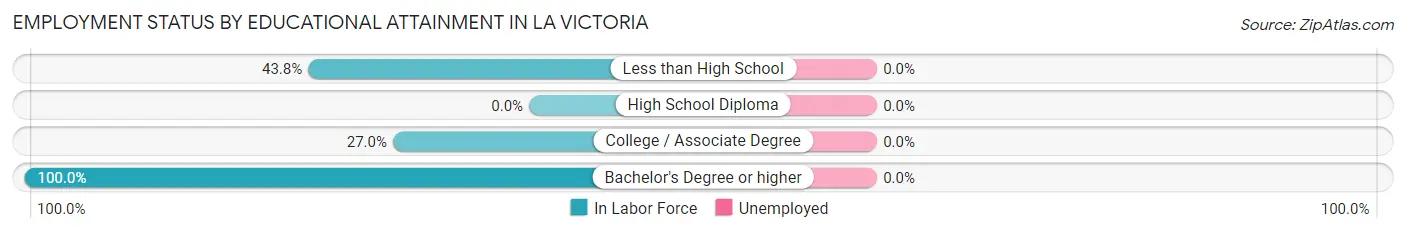
| Educational Attainment | In Labor Force | Unemployed |
| Less than High School | 7 (43.8%) | 0 (0.0%) |
| High School Diploma | 0 (0.0%) | 0 (0.0%) |
| College / Associate Degree | 10 (27.0%) | 0 (0.0%) |
| Bachelor's Degree or higher | 27 (100.0%) | 0 (0.0%) |
| Total | 44 (52.4%) | 0 (0.0%) |
Employment Occupations by Sex in La Victoria
Management, Business, Science and Arts Occupations
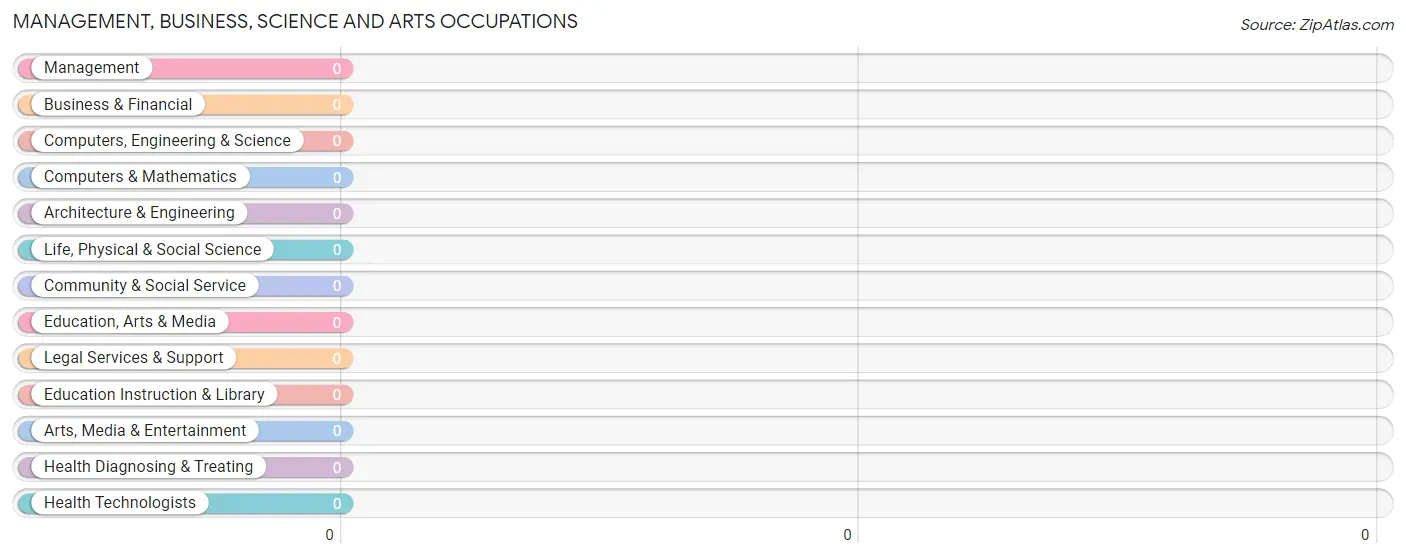
Management, Business, Science and Arts Occupations by Sex
| Occupation | Male | Female |
| Management | 0 (0.0%) | 0 (0.0%) |
| Business & Financial | 0 (0.0%) | 0 (0.0%) |
| Computers, Engineering & Science | 0 (0.0%) | 0 (0.0%) |
| Computers & Mathematics | 0 (0.0%) | 0 (0.0%) |
| Architecture & Engineering | 0 (0.0%) | 0 (0.0%) |
| Life, Physical & Social Science | 0 (0.0%) | 0 (0.0%) |
| Community & Social Service | 0 (0.0%) | 0 (0.0%) |
| Education, Arts & Media | 0 (0.0%) | 0 (0.0%) |
| Legal Services & Support | 0 (0.0%) | 0 (0.0%) |
| Education Instruction & Library | 0 (0.0%) | 0 (0.0%) |
| Arts, Media & Entertainment | 0 (0.0%) | 0 (0.0%) |
| Health Diagnosing & Treating | 0 (0.0%) | 0 (0.0%) |
| Health Technologists | 0 (0.0%) | 0 (0.0%) |
| Total (Category) | 0 (0.0%) | 0 (0.0%) |
| Total (Overall) | 10 (22.7%) | 34 (77.3%) |
Services Occupations
The most common Services occupations in La Victoria are Healthcare Support (27 | 61.4%), and Food Preparation & Serving (7 | 15.9%).
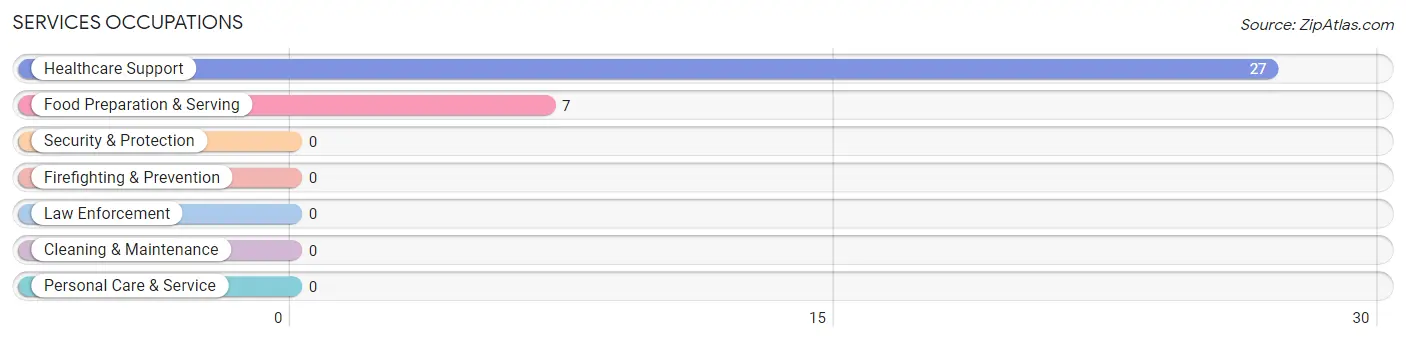
Services Occupations by Sex
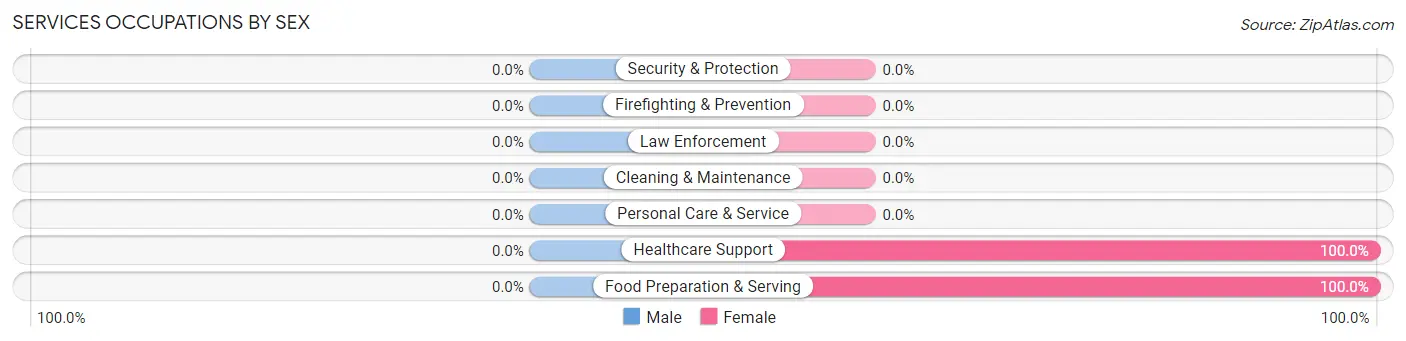
| Occupation | Male | Female |
| Healthcare Support | 0 (0.0%) | 27 (100.0%) |
| Security & Protection | 0 (0.0%) | 0 (0.0%) |
| Firefighting & Prevention | 0 (0.0%) | 0 (0.0%) |
| Law Enforcement | 0 (0.0%) | 0 (0.0%) |
| Food Preparation & Serving | 0 (0.0%) | 7 (100.0%) |
| Cleaning & Maintenance | 0 (0.0%) | 0 (0.0%) |
| Personal Care & Service | 0 (0.0%) | 0 (0.0%) |
| Total (Category) | 0 (0.0%) | 34 (100.0%) |
| Total (Overall) | 10 (22.7%) | 34 (77.3%) |
Sales and Office Occupations
Sales and Office Occupations by Sex
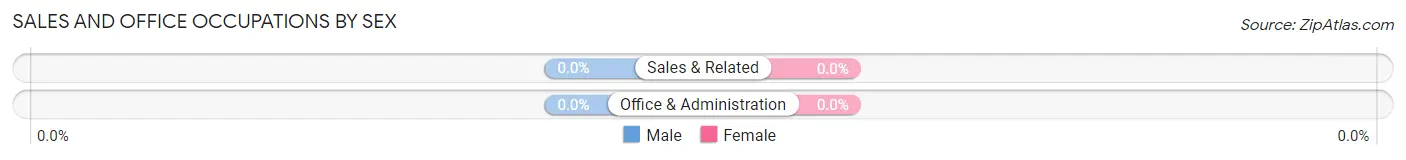
| Occupation | Male | Female |
| Sales & Related | 0 (0.0%) | 0 (0.0%) |
| Office & Administration | 0 (0.0%) | 0 (0.0%) |
| Total (Category) | 0 (0.0%) | 0 (0.0%) |
| Total (Overall) | 10 (22.7%) | 34 (77.3%) |
Natural Resources, Construction and Maintenance Occupations
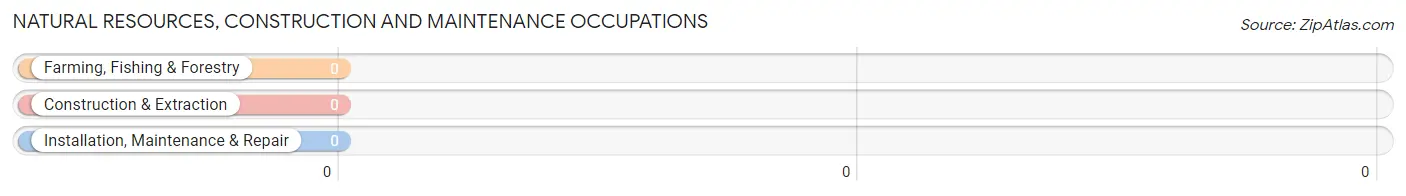
Natural Resources, Construction and Maintenance Occupations by Sex
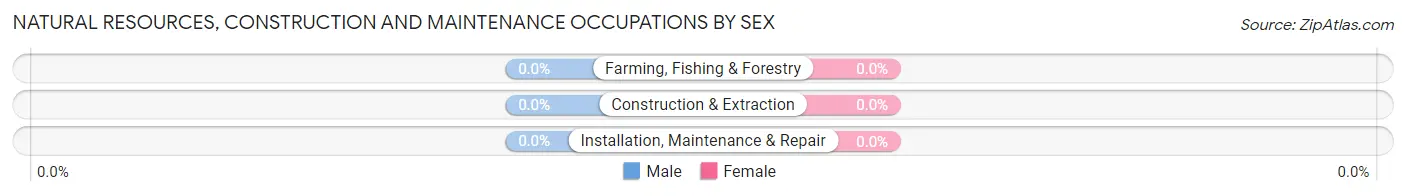
| Occupation | Male | Female |
| Farming, Fishing & Forestry | 0 (0.0%) | 0 (0.0%) |
| Construction & Extraction | 0 (0.0%) | 0 (0.0%) |
| Installation, Maintenance & Repair | 0 (0.0%) | 0 (0.0%) |
| Total (Category) | 0 (0.0%) | 0 (0.0%) |
| Total (Overall) | 10 (22.7%) | 34 (77.3%) |
Production, Transportation and Moving Occupations
The most common Production, Transportation and Moving occupations in La Victoria are , and Material Moving (10 | 22.7%).
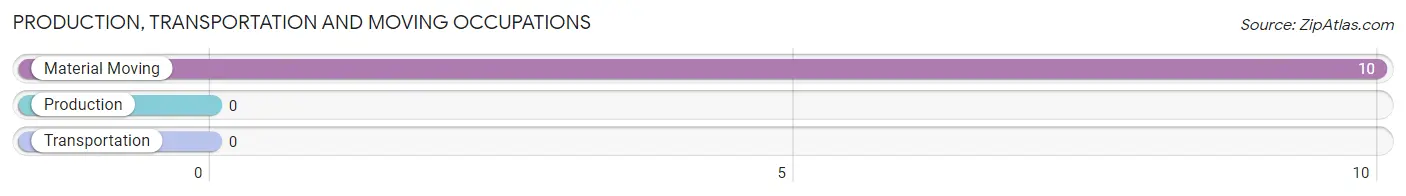
Production, Transportation and Moving Occupations by Sex
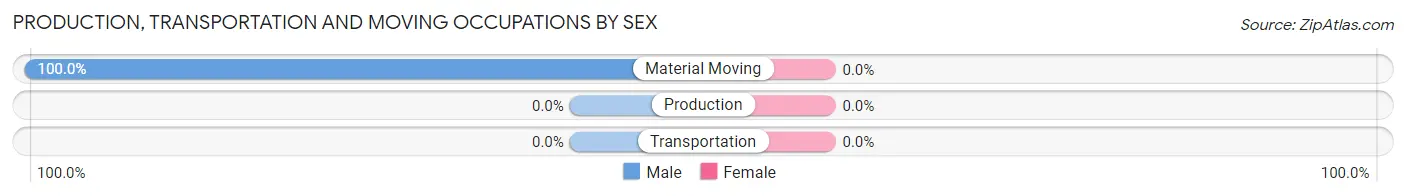
| Occupation | Male | Female |
| Production | 0 (0.0%) | 0 (0.0%) |
| Transportation | 0 (0.0%) | 0 (0.0%) |
| Material Moving | 10 (100.0%) | 0 (0.0%) |
| Total (Category) | 10 (100.0%) | 0 (0.0%) |
| Total (Overall) | 10 (22.7%) | 34 (77.3%) |
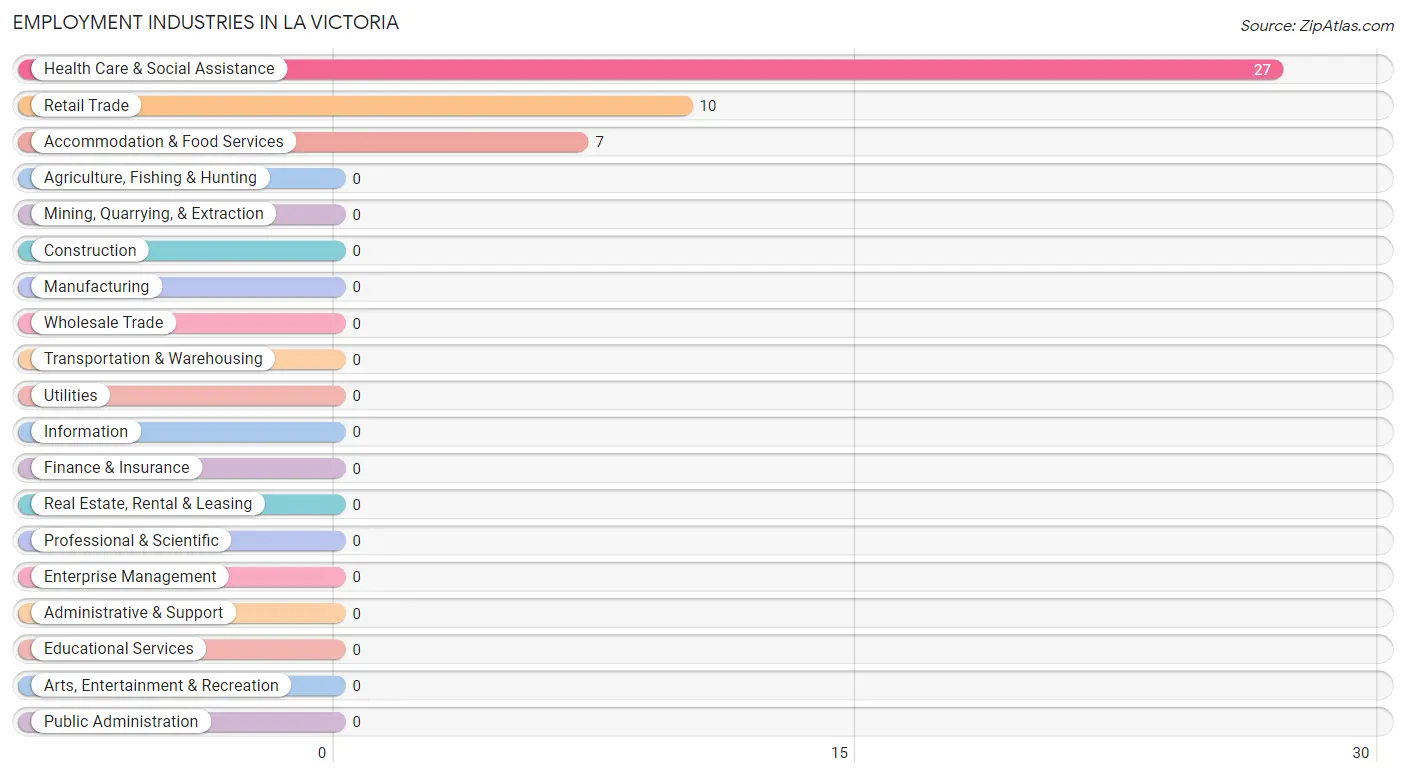
Employment Industries by Sex in La Victoria
Employment Industries in La Victoria
The major employment industries in La Victoria include Health Care & Social Assistance (27 | 61.4%), Retail Trade (10 | 22.7%), and Accommodation & Food Services (7 | 15.9%).
Employment Industries by Sex in La Victoria
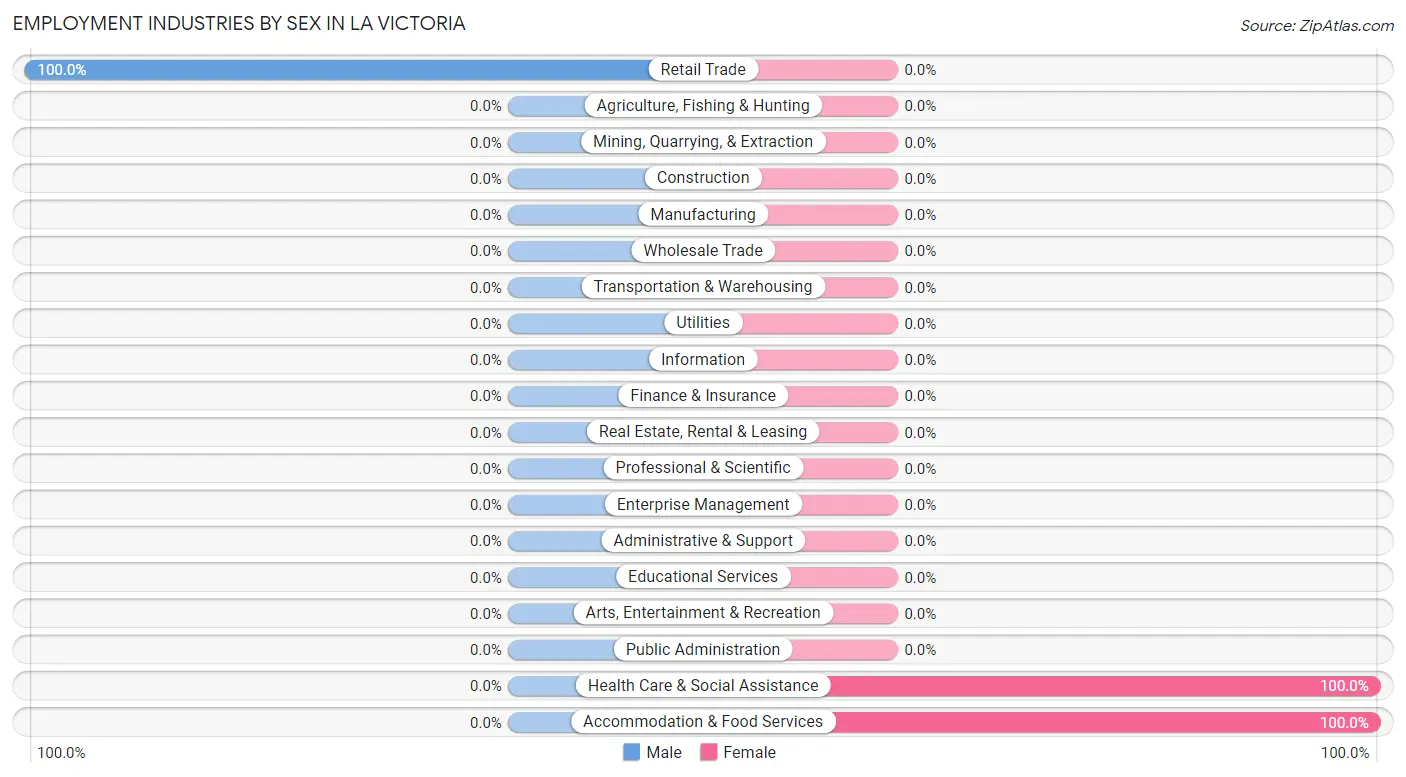
| Industry | Male | Female |
| Agriculture, Fishing & Hunting | 0 (0.0%) | 0 (0.0%) |
| Mining, Quarrying, & Extraction | 0 (0.0%) | 0 (0.0%) |
| Construction | 0 (0.0%) | 0 (0.0%) |
| Manufacturing | 0 (0.0%) | 0 (0.0%) |
| Wholesale Trade | 0 (0.0%) | 0 (0.0%) |
| Retail Trade | 10 (100.0%) | 0 (0.0%) |
| Transportation & Warehousing | 0 (0.0%) | 0 (0.0%) |
| Utilities | 0 (0.0%) | 0 (0.0%) |
| Information | 0 (0.0%) | 0 (0.0%) |
| Finance & Insurance | 0 (0.0%) | 0 (0.0%) |
| Real Estate, Rental & Leasing | 0 (0.0%) | 0 (0.0%) |
| Professional & Scientific | 0 (0.0%) | 0 (0.0%) |
| Enterprise Management | 0 (0.0%) | 0 (0.0%) |
| Administrative & Support | 0 (0.0%) | 0 (0.0%) |
| Educational Services | 0 (0.0%) | 0 (0.0%) |
| Health Care & Social Assistance | 0 (0.0%) | 27 (100.0%) |
| Arts, Entertainment & Recreation | 0 (0.0%) | 0 (0.0%) |
| Accommodation & Food Services | 0 (0.0%) | 7 (100.0%) |
| Public Administration | 0 (0.0%) | 0 (0.0%) |
| Total | 10 (22.7%) | 34 (77.3%) |
Education in La Victoria
School Enrollment in La Victoria
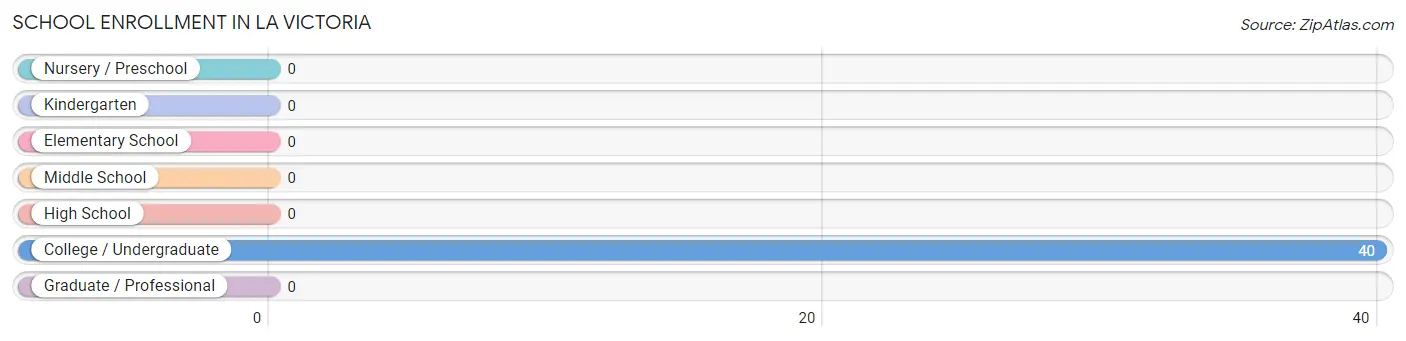
| School Level | # Students | % Students |
| Nursery / Preschool | 0 | 0.0% |
| Kindergarten | 0 | 0.0% |
| Elementary School | 0 | 0.0% |
| Middle School | 0 | 0.0% |
| High School | 0 | 0.0% |
| College / Undergraduate | 40 | 100.0% |
| Graduate / Professional | 0 | 0.0% |
| Total | 40 | 100.0% |
School Enrollment by Age by Funding Source in La Victoria
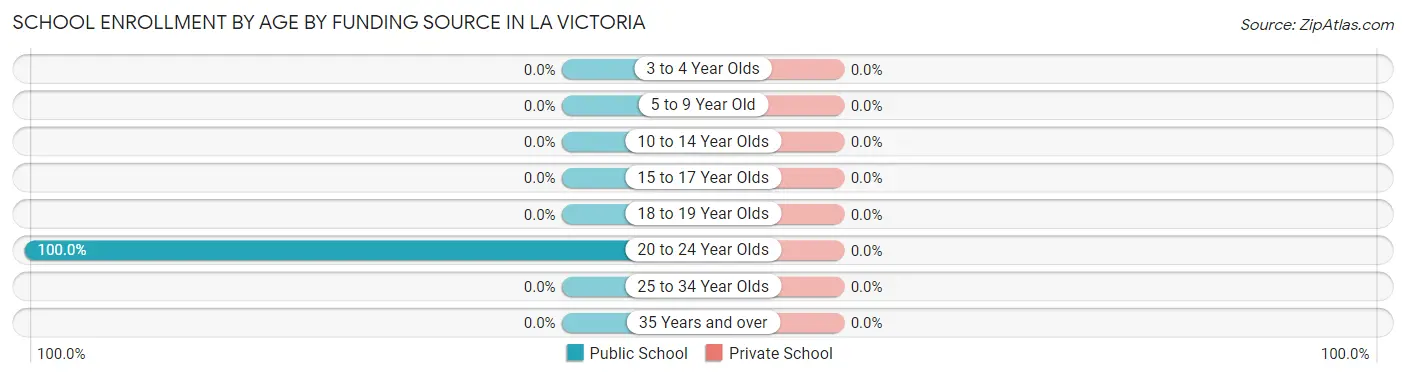
| Age Bracket | Public School | Private School |
| 3 to 4 Year Olds | 0 (0.0%) | 0 (0.0%) |
| 5 to 9 Year Old | 0 (0.0%) | 0 (0.0%) |
| 10 to 14 Year Olds | 0 (0.0%) | 0 (0.0%) |
| 15 to 17 Year Olds | 0 (0.0%) | 0 (0.0%) |
| 18 to 19 Year Olds | 0 (0.0%) | 0 (0.0%) |
| 20 to 24 Year Olds | 40 (100.0%) | 0 (0.0%) |
| 25 to 34 Year Olds | 0 (0.0%) | 0 (0.0%) |
| 35 Years and over | 0 (0.0%) | 0 (0.0%) |
| Total | 40 (100.0%) | 0 (0.0%) |
Educational Attainment by Field of Study in La Victoria
, and arts & humanities (27 | 100.0%) are the most common fields of study among 27 individuals in La Victoria who have obtained a bachelor's degree or higher.
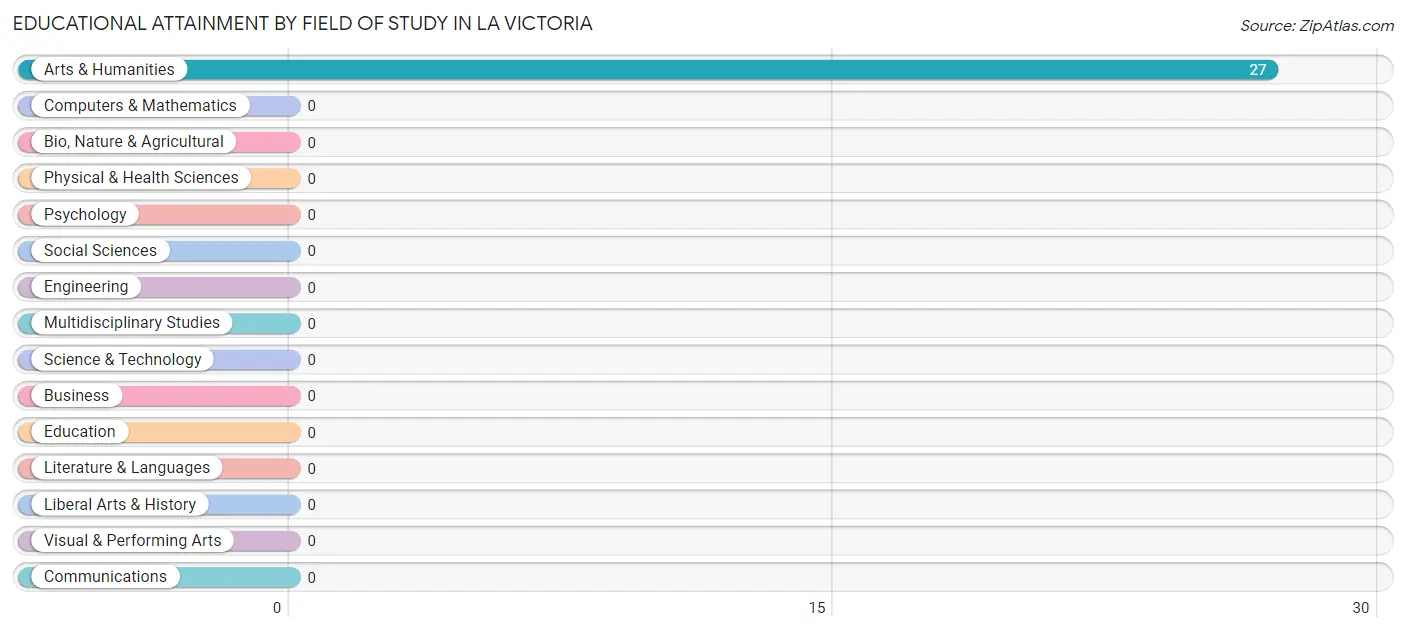
| Field of Study | # Graduates | % Graduates |
| Computers & Mathematics | 0 | 0.0% |
| Bio, Nature & Agricultural | 0 | 0.0% |
| Physical & Health Sciences | 0 | 0.0% |
| Psychology | 0 | 0.0% |
| Social Sciences | 0 | 0.0% |
| Engineering | 0 | 0.0% |
| Multidisciplinary Studies | 0 | 0.0% |
| Science & Technology | 0 | 0.0% |
| Business | 0 | 0.0% |
| Education | 0 | 0.0% |
| Literature & Languages | 0 | 0.0% |
| Liberal Arts & History | 0 | 0.0% |
| Visual & Performing Arts | 0 | 0.0% |
| Communications | 0 | 0.0% |
| Arts & Humanities | 27 | 100.0% |
| Total | 27 | 100.0% |
Transportation & Commute in La Victoria
Vehicle Availability by Sex in La Victoria
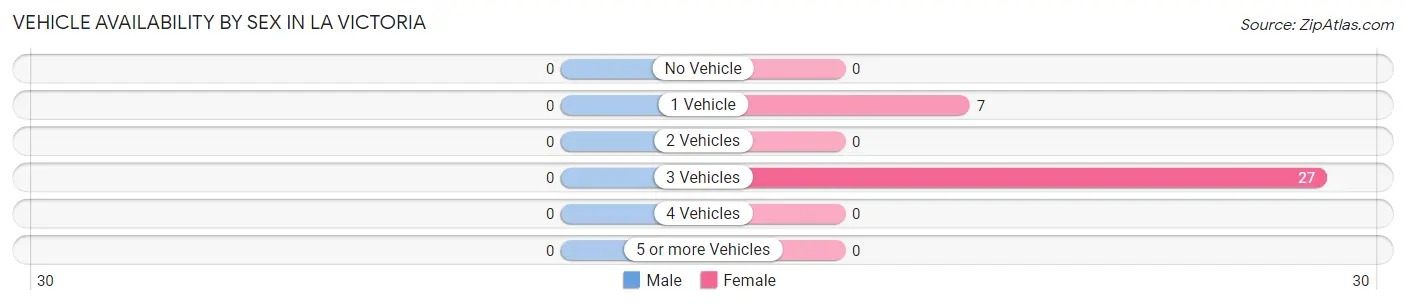
| Vehicles Available | Male | Female |
| No Vehicle | 0 (0.0%) | 0 (0.0%) |
| 1 Vehicle | 0 (0.0%) | 7 (20.6%) |
| 2 Vehicles | 0 (0.0%) | 0 (0.0%) |
| 3 Vehicles | 0 (0.0%) | 27 (79.4%) |
| 4 Vehicles | 0 (0.0%) | 0 (0.0%) |
| 5 or more Vehicles | 0 (0.0%) | 0 (0.0%) |
| Total | 0 (0.0%) | 34 (100.0%) |
Commute Time in La Victoria
The most frequently occuring commute durations in La Victoria are 20 to 24 minutes (27 commuters, 79.4%), 25 to 29 minutes (7 commuters, 20.6%), and less than 5 minutes (0 commuters, 0.0%).
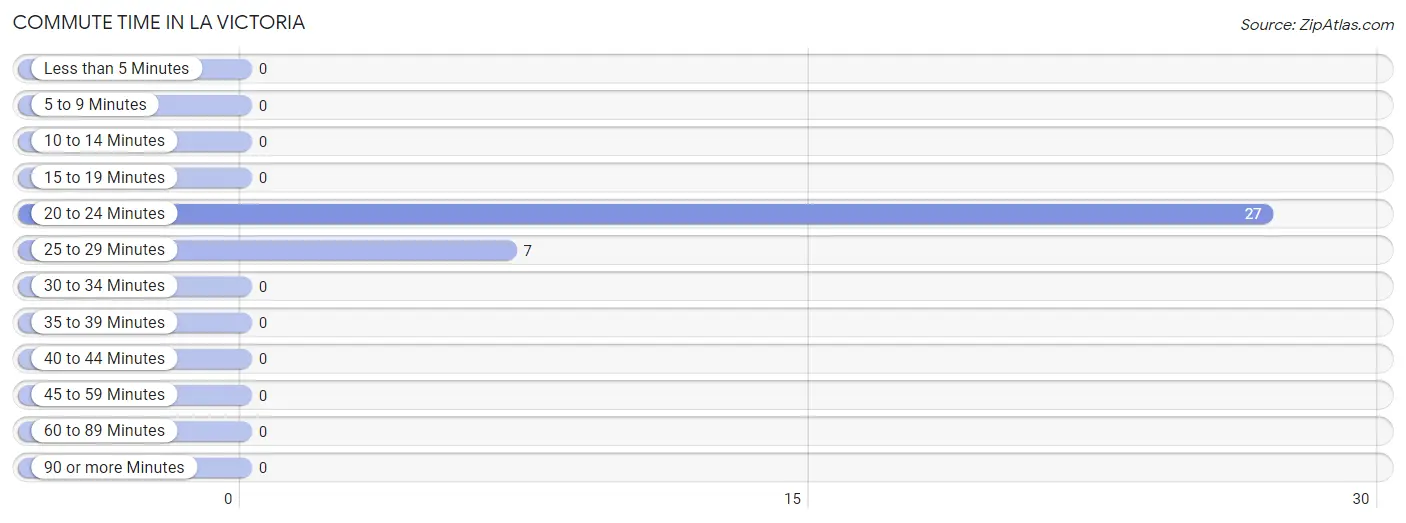
| Commute Time | # Commuters | % Commuters |
| Less than 5 Minutes | 0 | 0.0% |
| 5 to 9 Minutes | 0 | 0.0% |
| 10 to 14 Minutes | 0 | 0.0% |
| 15 to 19 Minutes | 0 | 0.0% |
| 20 to 24 Minutes | 27 | 79.4% |
| 25 to 29 Minutes | 7 | 20.6% |
| 30 to 34 Minutes | 0 | 0.0% |
| 35 to 39 Minutes | 0 | 0.0% |
| 40 to 44 Minutes | 0 | 0.0% |
| 45 to 59 Minutes | 0 | 0.0% |
| 60 to 89 Minutes | 0 | 0.0% |
| 90 or more Minutes | 0 | 0.0% |
Commute Time by Sex in La Victoria
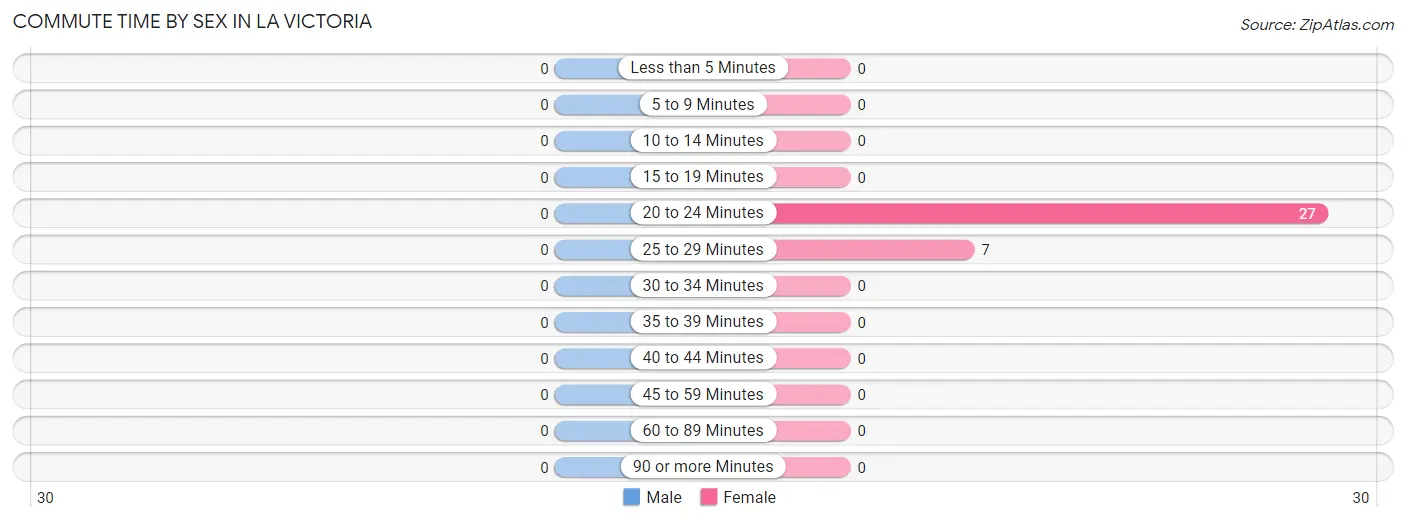
| Commute Time | Male | Female |
| Less than 5 Minutes | 0 (0.0%) | 0 (0.0%) |
| 5 to 9 Minutes | 0 (0.0%) | 0 (0.0%) |
| 10 to 14 Minutes | 0 (0.0%) | 0 (0.0%) |
| 15 to 19 Minutes | 0 (0.0%) | 0 (0.0%) |
| 20 to 24 Minutes | 0 (0.0%) | 27 (79.4%) |
| 25 to 29 Minutes | 0 (0.0%) | 7 (20.6%) |
| 30 to 34 Minutes | 0 (0.0%) | 0 (0.0%) |
| 35 to 39 Minutes | 0 (0.0%) | 0 (0.0%) |
| 40 to 44 Minutes | 0 (0.0%) | 0 (0.0%) |
| 45 to 59 Minutes | 0 (0.0%) | 0 (0.0%) |
| 60 to 89 Minutes | 0 (0.0%) | 0 (0.0%) |
| 90 or more Minutes | 0 (0.0%) | 0 (0.0%) |
Time of Departure to Work by Sex in La Victoria
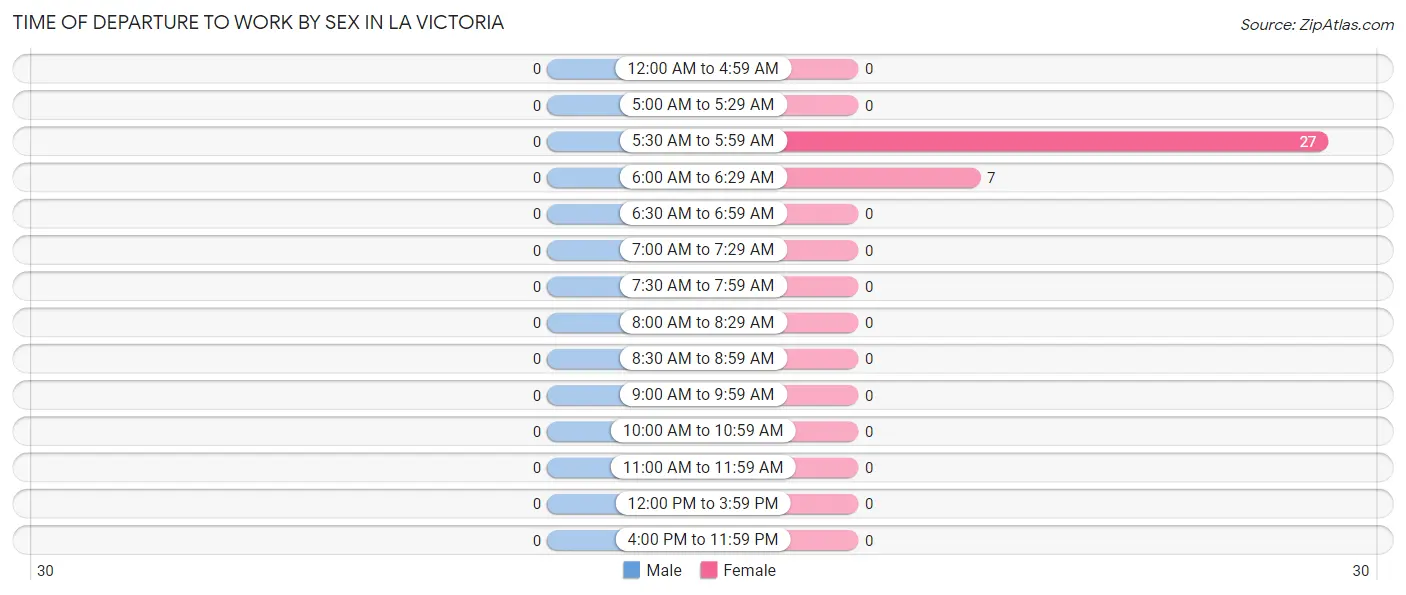
| Time of Departure | Male | Female |
| 12:00 AM to 4:59 AM | 0 (0.0%) | 0 (0.0%) |
| 5:00 AM to 5:29 AM | 0 (0.0%) | 0 (0.0%) |
| 5:30 AM to 5:59 AM | 0 (0.0%) | 27 (79.4%) |
| 6:00 AM to 6:29 AM | 0 (0.0%) | 7 (20.6%) |
| 6:30 AM to 6:59 AM | 0 (0.0%) | 0 (0.0%) |
| 7:00 AM to 7:29 AM | 0 (0.0%) | 0 (0.0%) |
| 7:30 AM to 7:59 AM | 0 (0.0%) | 0 (0.0%) |
| 8:00 AM to 8:29 AM | 0 (0.0%) | 0 (0.0%) |
| 8:30 AM to 8:59 AM | 0 (0.0%) | 0 (0.0%) |
| 9:00 AM to 9:59 AM | 0 (0.0%) | 0 (0.0%) |
| 10:00 AM to 10:59 AM | 0 (0.0%) | 0 (0.0%) |
| 11:00 AM to 11:59 AM | 0 (0.0%) | 0 (0.0%) |
| 12:00 PM to 3:59 PM | 0 (0.0%) | 0 (0.0%) |
| 4:00 PM to 11:59 PM | 0 (0.0%) | 0 (0.0%) |
| Total | 0 (0.0%) | 34 (100.0%) |
Housing Occupancy in La Victoria
Occupancy by Ownership in La Victoria
Of the total 65 dwellings in La Victoria, owner-occupied units account for 65 (100.0%), while renter-occupied units make up 0 (0.0%).
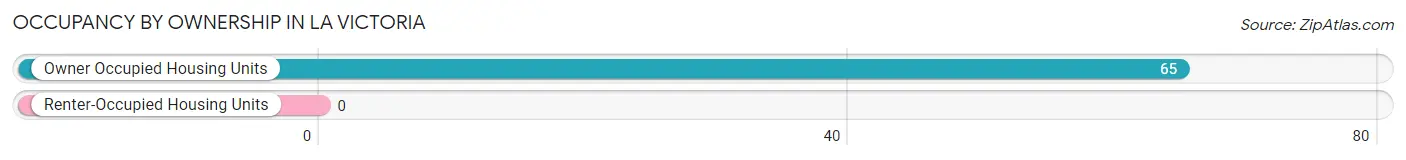
| Occupancy | # Housing Units | % Housing Units |
| Owner Occupied Housing Units | 65 | 100.0% |
| Renter-Occupied Housing Units | 0 | 0.0% |
| Total Occupied Housing Units | 65 | 100.0% |
Occupancy by Household Size in La Victoria
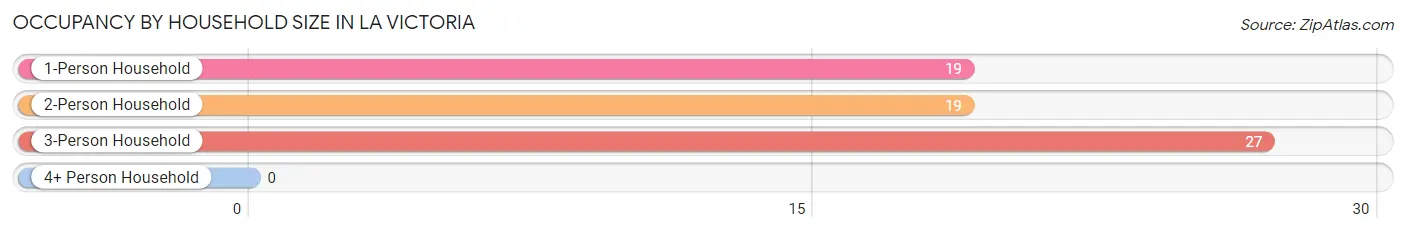
| Household Size | # Housing Units | % Housing Units |
| 1-Person Household | 19 | 29.2% |
| 2-Person Household | 19 | 29.2% |
| 3-Person Household | 27 | 41.5% |
| 4+ Person Household | 0 | 0.0% |
| Total Housing Units | 65 | 100.0% |
Occupancy by Ownership by Household Size in La Victoria
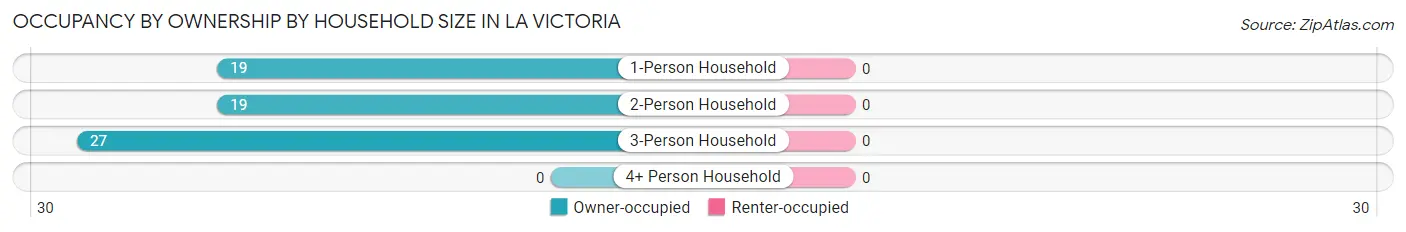
| Household Size | Owner-occupied | Renter-occupied |
| 1-Person Household | 19 (100.0%) | 0 (0.0%) |
| 2-Person Household | 19 (100.0%) | 0 (0.0%) |
| 3-Person Household | 27 (100.0%) | 0 (0.0%) |
| 4+ Person Household | 0 (0.0%) | 0 (0.0%) |
| Total Housing Units | 65 (100.0%) | 0 (0.0%) |
Occupancy by Educational Attainment in La Victoria
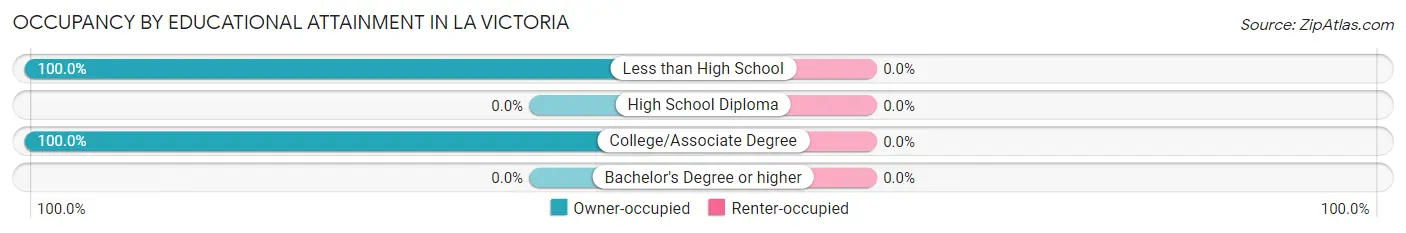
| Household Size | Owner-occupied | Renter-occupied |
| Less than High School | 28 (100.0%) | 0 (0.0%) |
| High School Diploma | 0 (0.0%) | 0 (0.0%) |
| College/Associate Degree | 37 (100.0%) | 0 (0.0%) |
| Bachelor's Degree or higher | 0 (0.0%) | 0 (0.0%) |
Occupancy by Age of Householder in La Victoria
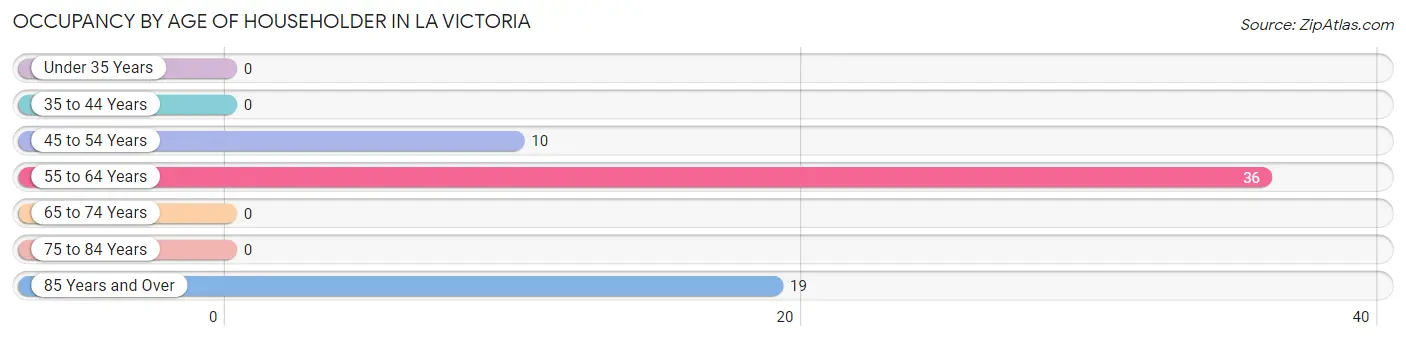
| Age Bracket | # Households | % Households |
| Under 35 Years | 0 | 0.0% |
| 35 to 44 Years | 0 | 0.0% |
| 45 to 54 Years | 10 | 15.4% |
| 55 to 64 Years | 36 | 55.4% |
| 65 to 74 Years | 0 | 0.0% |
| 75 to 84 Years | 0 | 0.0% |
| 85 Years and Over | 19 | 29.2% |
| Total | 65 | 100.0% |
Housing Finances in La Victoria
Median Income by Occupancy in La Victoria
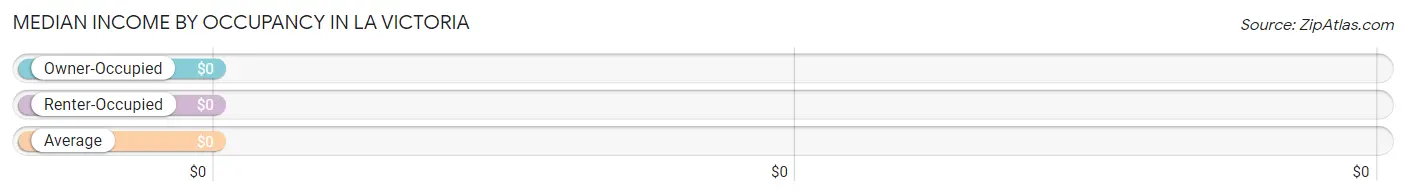
| Occupancy Type | # Households | Median Income |
| Owner-Occupied | 65 (100.0%) | $0 |
| Renter-Occupied | 0 (0.0%) | $0 |
| Average | 65 (100.0%) | $0 |
Occupancy by Householder Income Bracket in La Victoria
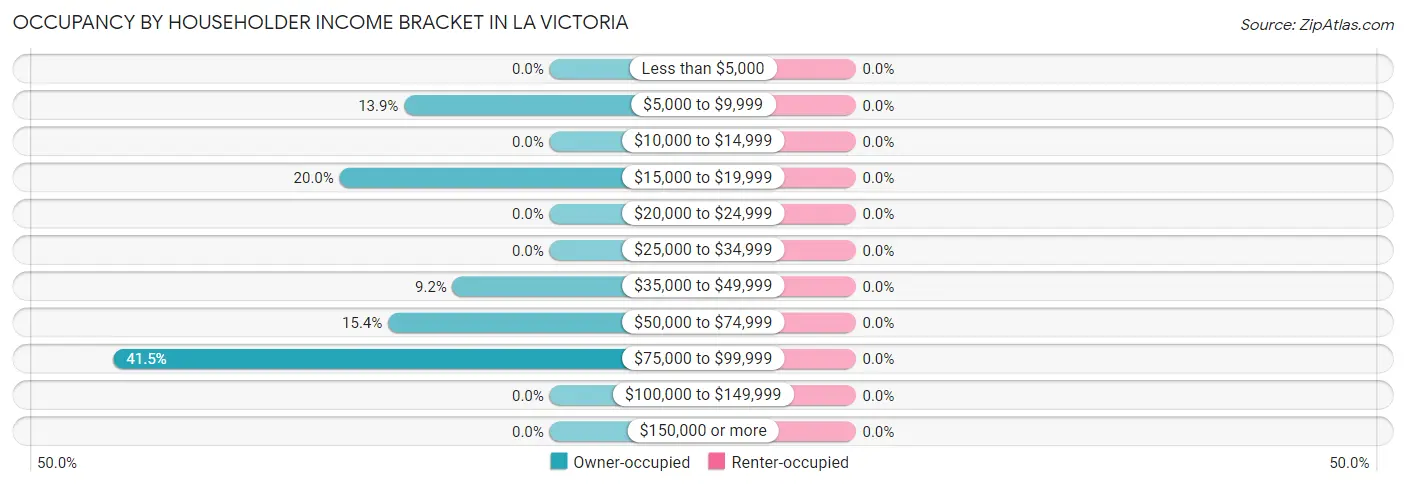
| Income Bracket | Owner-occupied | Renter-occupied |
| Less than $5,000 | 0 (0.0%) | 0 (0.0%) |
| $5,000 to $9,999 | 9 (13.9%) | 0 (0.0%) |
| $10,000 to $14,999 | 0 (0.0%) | 0 (0.0%) |
| $15,000 to $19,999 | 13 (20.0%) | 0 (0.0%) |
| $20,000 to $24,999 | 0 (0.0%) | 0 (0.0%) |
| $25,000 to $34,999 | 0 (0.0%) | 0 (0.0%) |
| $35,000 to $49,999 | 6 (9.2%) | 0 (0.0%) |
| $50,000 to $74,999 | 10 (15.4%) | 0 (0.0%) |
| $75,000 to $99,999 | 27 (41.5%) | 0 (0.0%) |
| $100,000 to $149,999 | 0 (0.0%) | 0 (0.0%) |
| $150,000 or more | 0 (0.0%) | 0 (0.0%) |
| Total | 65 (100.0%) | 0 (0.0%) |
Monthly Housing Cost Tiers in La Victoria
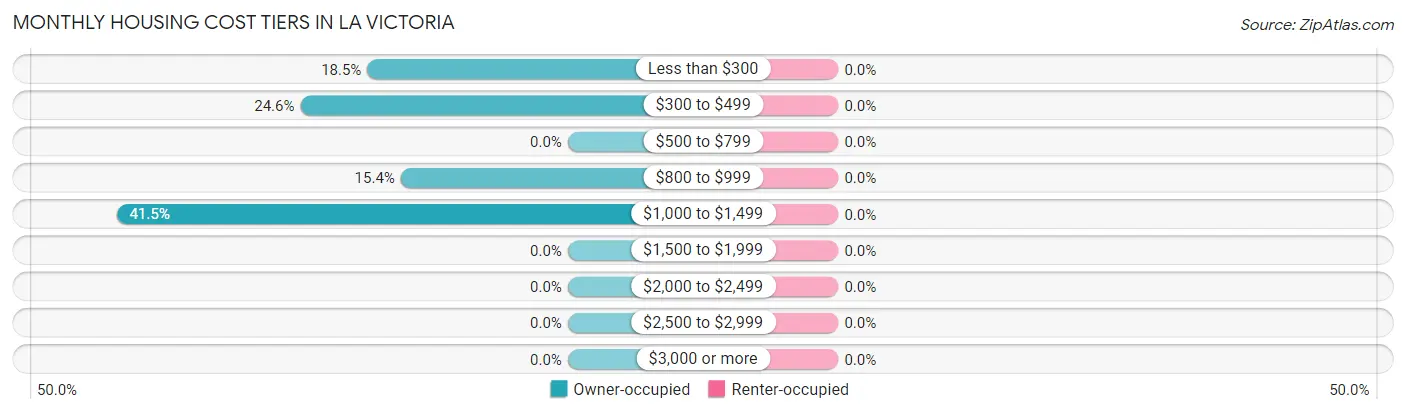
| Monthly Cost | Owner-occupied | Renter-occupied |
| Less than $300 | 12 (18.5%) | 0 (0.0%) |
| $300 to $499 | 16 (24.6%) | 0 (0.0%) |
| $500 to $799 | 0 (0.0%) | 0 (0.0%) |
| $800 to $999 | 10 (15.4%) | 0 (0.0%) |
| $1,000 to $1,499 | 27 (41.5%) | 0 (0.0%) |
| $1,500 to $1,999 | 0 (0.0%) | 0 (0.0%) |
| $2,000 to $2,499 | 0 (0.0%) | 0 (0.0%) |
| $2,500 to $2,999 | 0 (0.0%) | 0 (0.0%) |
| $3,000 or more | 0 (0.0%) | 0 (0.0%) |
| Total | 65 (100.0%) | 0 (0.0%) |
Physical Housing Characteristics in La Victoria
Housing Structures in La Victoria
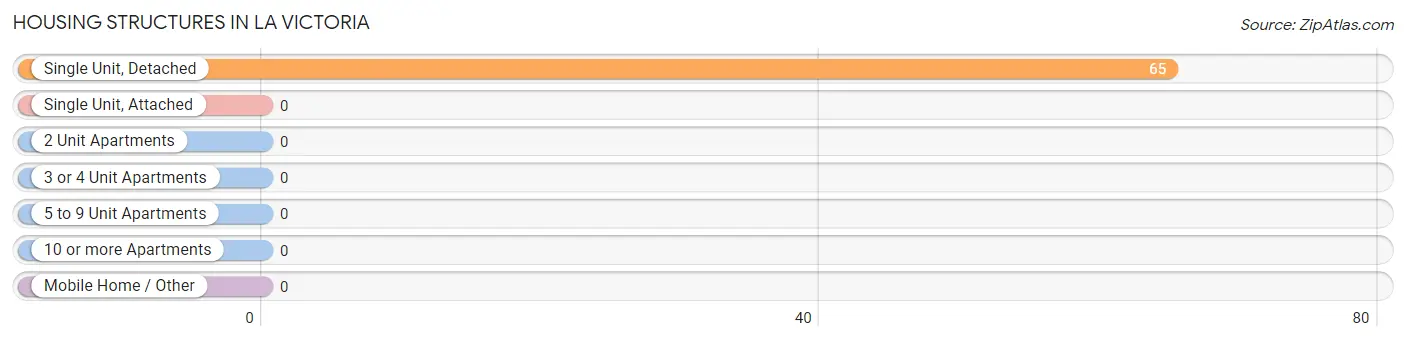
| Structure Type | # Housing Units | % Housing Units |
| Single Unit, Detached | 65 | 100.0% |
| Single Unit, Attached | 0 | 0.0% |
| 2 Unit Apartments | 0 | 0.0% |
| 3 or 4 Unit Apartments | 0 | 0.0% |
| 5 to 9 Unit Apartments | 0 | 0.0% |
| 10 or more Apartments | 0 | 0.0% |
| Mobile Home / Other | 0 | 0.0% |
| Total | 65 | 100.0% |
Housing Structures by Occupancy in La Victoria
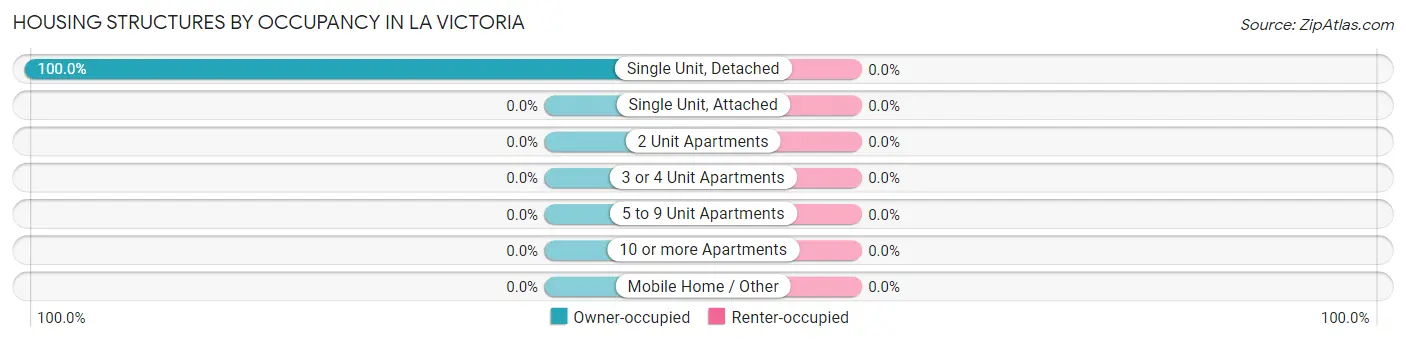
| Structure Type | Owner-occupied | Renter-occupied |
| Single Unit, Detached | 65 (100.0%) | 0 (0.0%) |
| Single Unit, Attached | 0 (0.0%) | 0 (0.0%) |
| 2 Unit Apartments | 0 (0.0%) | 0 (0.0%) |
| 3 or 4 Unit Apartments | 0 (0.0%) | 0 (0.0%) |
| 5 to 9 Unit Apartments | 0 (0.0%) | 0 (0.0%) |
| 10 or more Apartments | 0 (0.0%) | 0 (0.0%) |
| Mobile Home / Other | 0 (0.0%) | 0 (0.0%) |
| Total | 65 (100.0%) | 0 (0.0%) |
Housing Structures by Number of Rooms in La Victoria
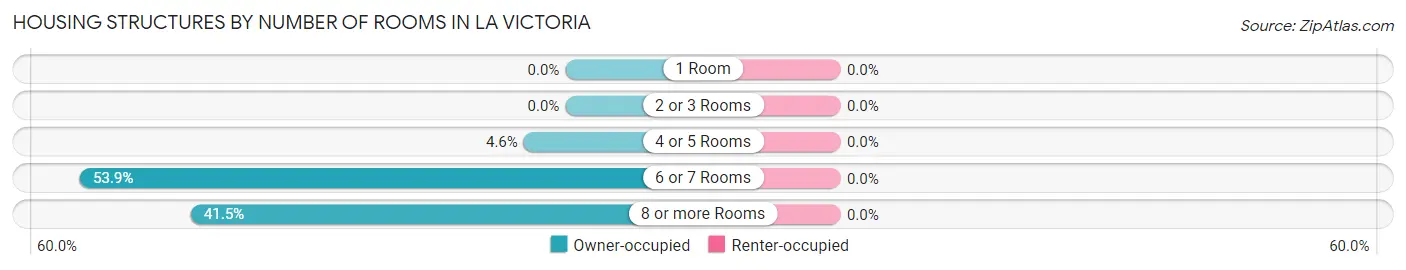
| Number of Rooms | Owner-occupied | Renter-occupied |
| 1 Room | 0 (0.0%) | 0 (0.0%) |
| 2 or 3 Rooms | 0 (0.0%) | 0 (0.0%) |
| 4 or 5 Rooms | 3 (4.6%) | 0 (0.0%) |
| 6 or 7 Rooms | 35 (53.8%) | 0 (0.0%) |
| 8 or more Rooms | 27 (41.5%) | 0 (0.0%) |
| Total | 65 (100.0%) | 0 (0.0%) |
Housing Structure by Heating Type in La Victoria
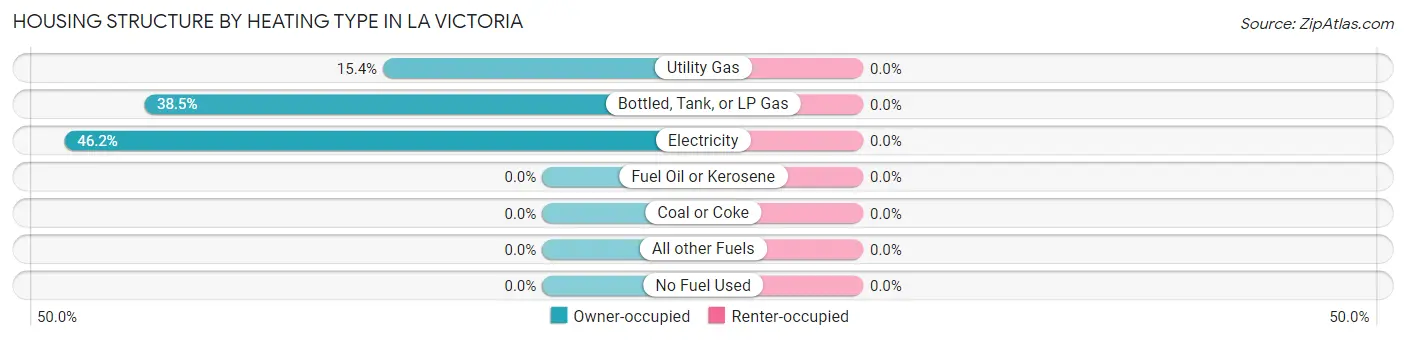
| Heating Type | Owner-occupied | Renter-occupied |
| Utility Gas | 10 (15.4%) | 0 (0.0%) |
| Bottled, Tank, or LP Gas | 25 (38.5%) | 0 (0.0%) |
| Electricity | 30 (46.2%) | 0 (0.0%) |
| Fuel Oil or Kerosene | 0 (0.0%) | 0 (0.0%) |
| Coal or Coke | 0 (0.0%) | 0 (0.0%) |
| All other Fuels | 0 (0.0%) | 0 (0.0%) |
| No Fuel Used | 0 (0.0%) | 0 (0.0%) |
| Total | 65 (100.0%) | 0 (0.0%) |
Household Vehicle Usage in La Victoria
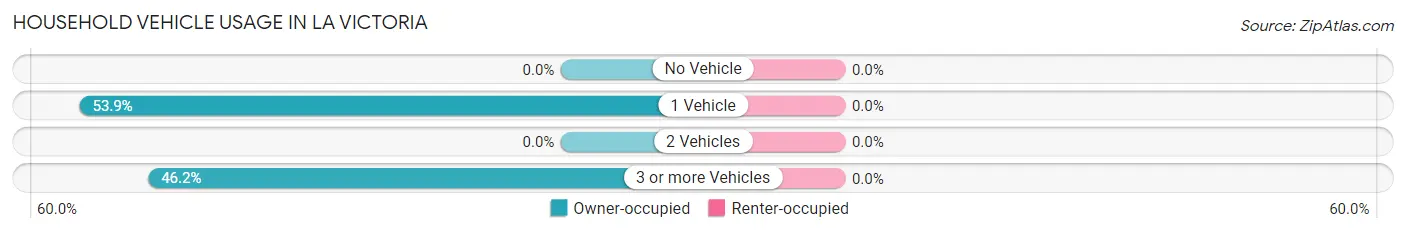
| Vehicles per Household | Owner-occupied | Renter-occupied |
| No Vehicle | 0 (0.0%) | 0 (0.0%) |
| 1 Vehicle | 35 (53.8%) | 0 (0.0%) |
| 2 Vehicles | 0 (0.0%) | 0 (0.0%) |
| 3 or more Vehicles | 30 (46.2%) | 0 (0.0%) |
| Total | 65 (100.0%) | 0 (0.0%) |
Real Estate & Mortgages in La Victoria
Real Estate and Mortgage Overview in La Victoria
| Characteristic | Without Mortgage | With Mortgage |
| Housing Units | 28 | 37 |
| Median Property Value | - | - |
| Median Household Income | $18,000 | $0 |
| Monthly Housing Costs | $306 | $0 |
| Real Estate Taxes | $356 | $0 |
Property Value by Mortgage Status in La Victoria
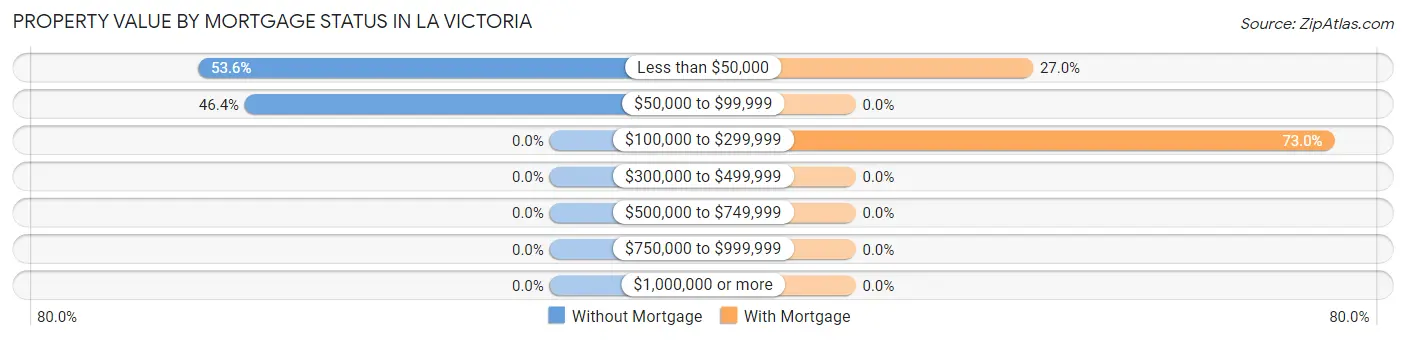
| Property Value | Without Mortgage | With Mortgage |
| Less than $50,000 | 15 (53.6%) | 10 (27.0%) |
| $50,000 to $99,999 | 13 (46.4%) | 0 (0.0%) |
| $100,000 to $299,999 | 0 (0.0%) | 27 (73.0%) |
| $300,000 to $499,999 | 0 (0.0%) | 0 (0.0%) |
| $500,000 to $749,999 | 0 (0.0%) | 0 (0.0%) |
| $750,000 to $999,999 | 0 (0.0%) | 0 (0.0%) |
| $1,000,000 or more | 0 (0.0%) | 0 (0.0%) |
| Total | 28 (100.0%) | 37 (100.0%) |
Household Income by Mortgage Status in La Victoria
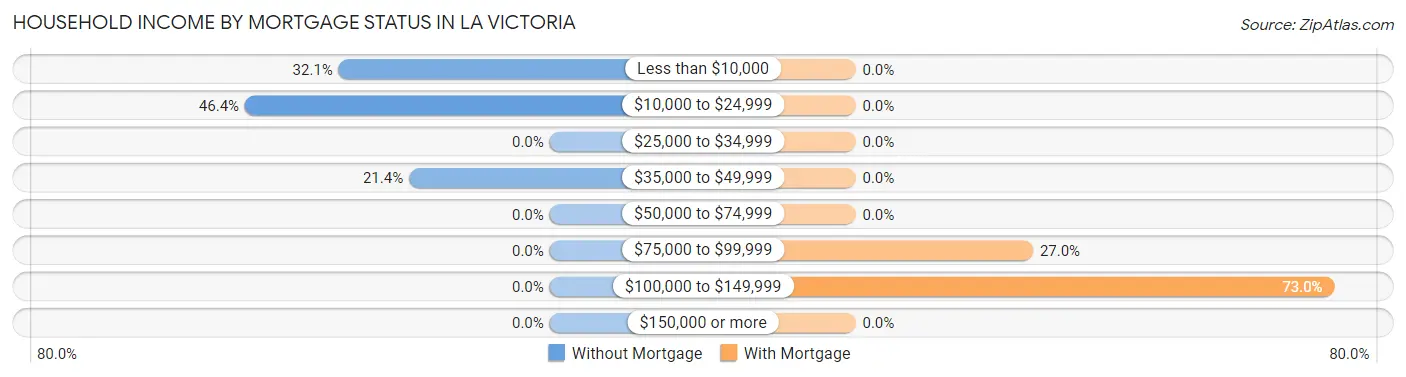
| Household Income | Without Mortgage | With Mortgage |
| Less than $10,000 | 9 (32.1%) | 0 (0.0%) |
| $10,000 to $24,999 | 13 (46.4%) | 0 (0.0%) |
| $25,000 to $34,999 | 0 (0.0%) | 0 (0.0%) |
| $35,000 to $49,999 | 6 (21.4%) | 0 (0.0%) |
| $50,000 to $74,999 | 0 (0.0%) | 0 (0.0%) |
| $75,000 to $99,999 | 0 (0.0%) | 10 (27.0%) |
| $100,000 to $149,999 | 0 (0.0%) | 27 (73.0%) |
| $150,000 or more | 0 (0.0%) | 0 (0.0%) |
| Total | 28 (100.0%) | 37 (100.0%) |
Property Value to Household Income Ratio in La Victoria
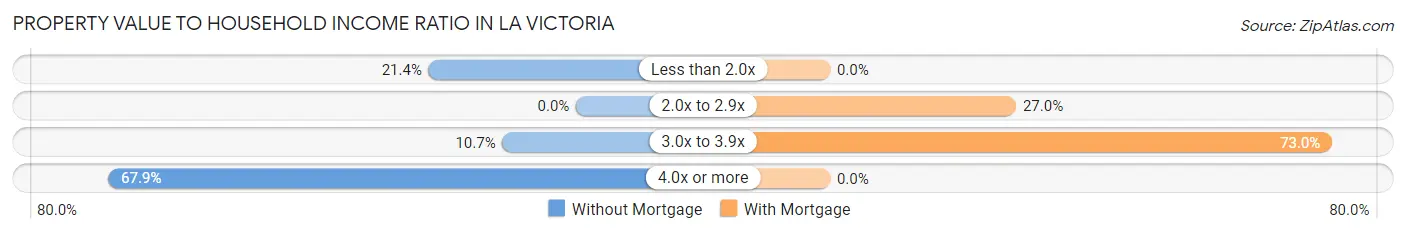
| Value-to-Income Ratio | Without Mortgage | With Mortgage |
| Less than 2.0x | 6 (21.4%) | 0 (0.0%) |
| 2.0x to 2.9x | 0 (0.0%) | 10 (27.0%) |
| 3.0x to 3.9x | 3 (10.7%) | 27 (73.0%) |
| 4.0x or more | 19 (67.9%) | 0 (0.0%) |
| Total | 28 (100.0%) | 37 (100.0%) |
Real Estate Taxes by Mortgage Status in La Victoria
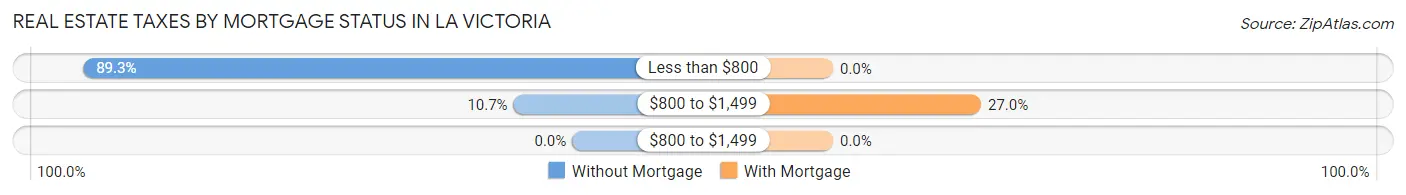
| Property Taxes | Without Mortgage | With Mortgage |
| Less than $800 | 25 (89.3%) | 0 (0.0%) |
| $800 to $1,499 | 3 (10.7%) | 10 (27.0%) |
| $800 to $1,499 | 0 (0.0%) | 0 (0.0%) |
| Total | 28 (100.0%) | 37 (100.0%) |
Health & Disability in La Victoria
Health Insurance Coverage by Age in La Victoria
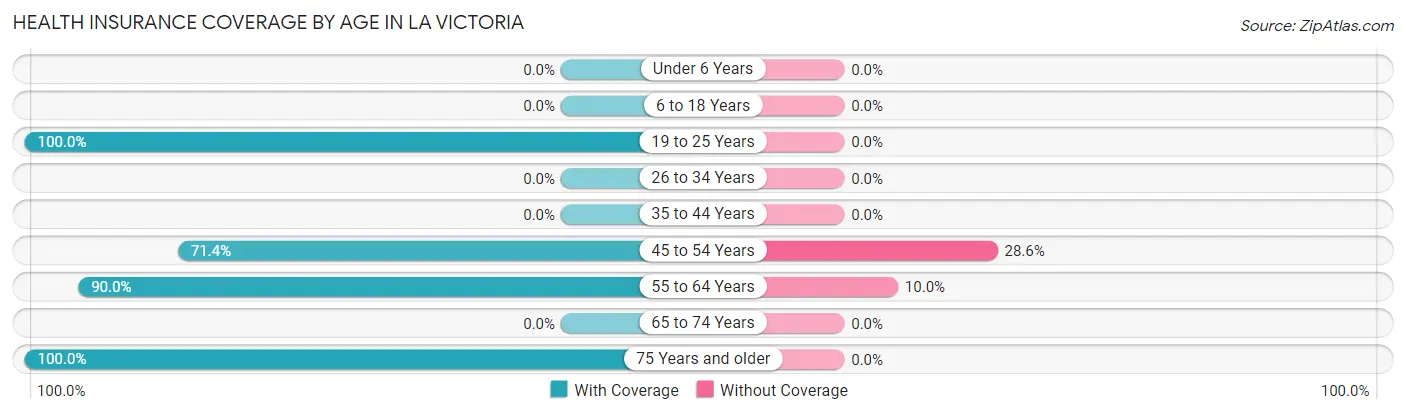
| Age Bracket | With Coverage | Without Coverage |
| Under 6 Years | 0 (0.0%) | 0 (0.0%) |
| 6 to 18 Years | 0 (0.0%) | 0 (0.0%) |
| 19 to 25 Years | 40 (100.0%) | 0 (0.0%) |
| 26 to 34 Years | 0 (0.0%) | 0 (0.0%) |
| 35 to 44 Years | 0 (0.0%) | 0 (0.0%) |
| 45 to 54 Years | 10 (71.4%) | 4 (28.6%) |
| 55 to 64 Years | 63 (90.0%) | 7 (10.0%) |
| 65 to 74 Years | 0 (0.0%) | 0 (0.0%) |
| 75 Years and older | 32 (100.0%) | 0 (0.0%) |
| Total | 145 (92.9%) | 11 (7.0%) |
Health Insurance Coverage by Citizenship Status in La Victoria
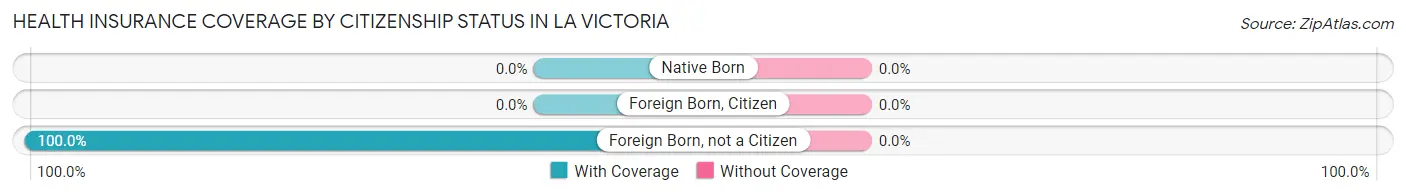
| Citizenship Status | With Coverage | Without Coverage |
| Native Born | 0 (0.0%) | 0 (0.0%) |
| Foreign Born, Citizen | 0 (0.0%) | 0 (0.0%) |
| Foreign Born, not a Citizen | 40 (100.0%) | 0 (0.0%) |
Health Insurance Coverage by Household Income in La Victoria
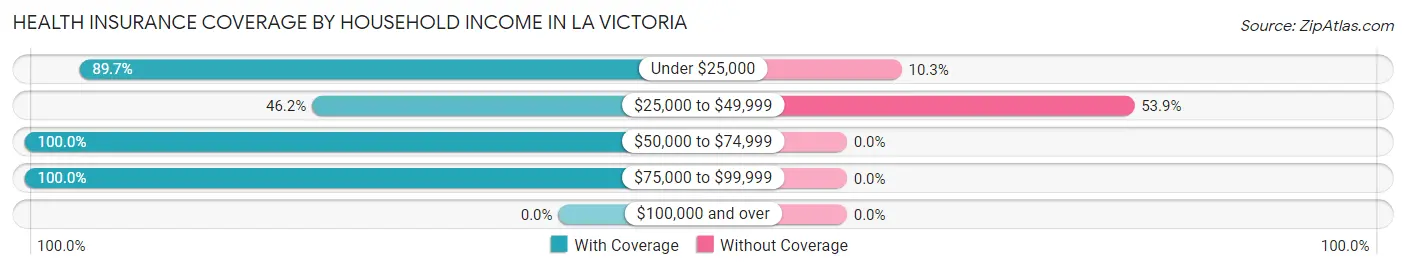
| Household Income | With Coverage | Without Coverage |
| Under $25,000 | 35 (89.7%) | 4 (10.3%) |
| $25,000 to $49,999 | 6 (46.2%) | 7 (53.8%) |
| $50,000 to $74,999 | 10 (100.0%) | 0 (0.0%) |
| $75,000 to $99,999 | 94 (100.0%) | 0 (0.0%) |
| $100,000 and over | 0 (0.0%) | 0 (0.0%) |
Public vs Private Health Insurance Coverage by Age in La Victoria
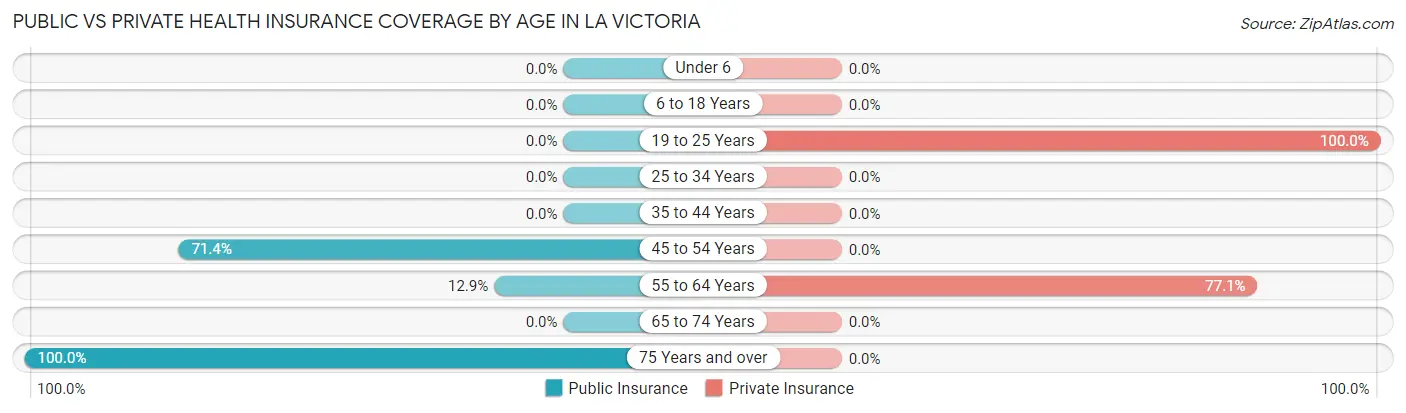
| Age Bracket | Public Insurance | Private Insurance |
| Under 6 | 0 (0.0%) | 0 (0.0%) |
| 6 to 18 Years | 0 (0.0%) | 0 (0.0%) |
| 19 to 25 Years | 0 (0.0%) | 40 (100.0%) |
| 25 to 34 Years | 0 (0.0%) | 0 (0.0%) |
| 35 to 44 Years | 0 (0.0%) | 0 (0.0%) |
| 45 to 54 Years | 10 (71.4%) | 0 (0.0%) |
| 55 to 64 Years | 9 (12.9%) | 54 (77.1%) |
| 65 to 74 Years | 0 (0.0%) | 0 (0.0%) |
| 75 Years and over | 32 (100.0%) | 0 (0.0%) |
| Total | 51 (32.7%) | 94 (60.3%) |
Disability Status by Sex by Age in La Victoria
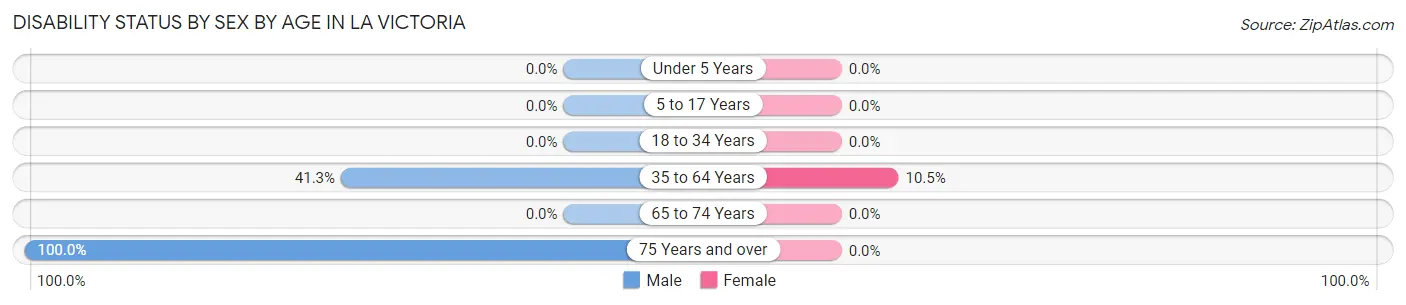
| Age Bracket | Male | Female |
| Under 5 Years | 0 (0.0%) | 0 (0.0%) |
| 5 to 17 Years | 0 (0.0%) | 0 (0.0%) |
| 18 to 34 Years | 0 (0.0%) | 0 (0.0%) |
| 35 to 64 Years | 19 (41.3%) | 4 (10.5%) |
| 65 to 74 Years | 0 (0.0%) | 0 (0.0%) |
| 75 Years and over | 19 (100.0%) | 0 (0.0%) |
Disability Class by Sex by Age in La Victoria
Disability Class: Hearing Difficulty
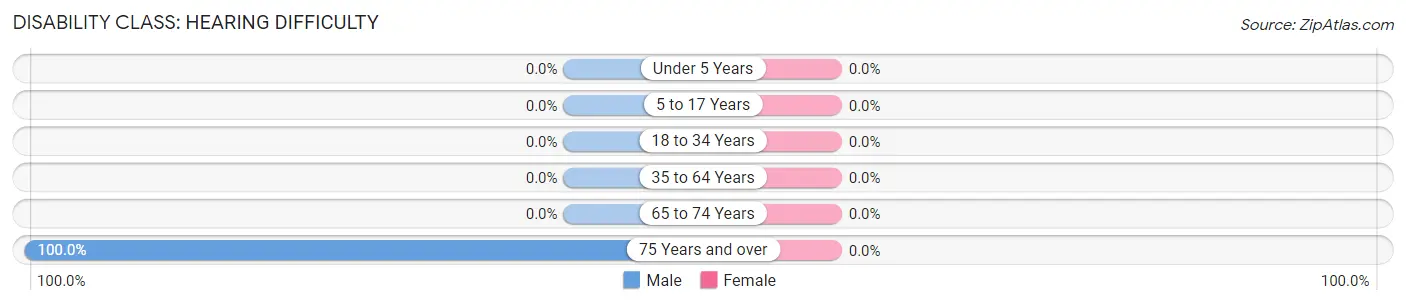
| Age Bracket | Male | Female |
| Under 5 Years | 0 (0.0%) | 0 (0.0%) |
| 5 to 17 Years | 0 (0.0%) | 0 (0.0%) |
| 18 to 34 Years | 0 (0.0%) | 0 (0.0%) |
| 35 to 64 Years | 0 (0.0%) | 0 (0.0%) |
| 65 to 74 Years | 0 (0.0%) | 0 (0.0%) |
| 75 Years and over | 19 (100.0%) | 0 (0.0%) |
Disability Class: Vision Difficulty
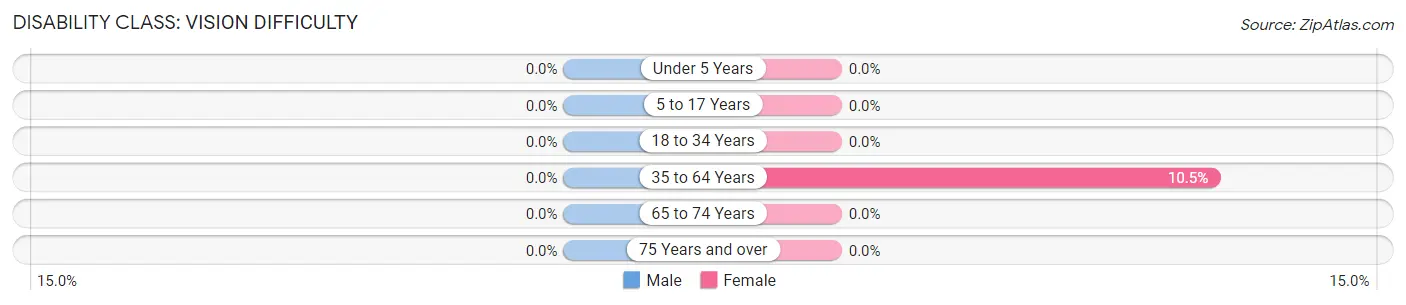
| Age Bracket | Male | Female |
| Under 5 Years | 0 (0.0%) | 0 (0.0%) |
| 5 to 17 Years | 0 (0.0%) | 0 (0.0%) |
| 18 to 34 Years | 0 (0.0%) | 0 (0.0%) |
| 35 to 64 Years | 0 (0.0%) | 4 (10.5%) |
| 65 to 74 Years | 0 (0.0%) | 0 (0.0%) |
| 75 Years and over | 0 (0.0%) | 0 (0.0%) |
Disability Class: Cognitive Difficulty
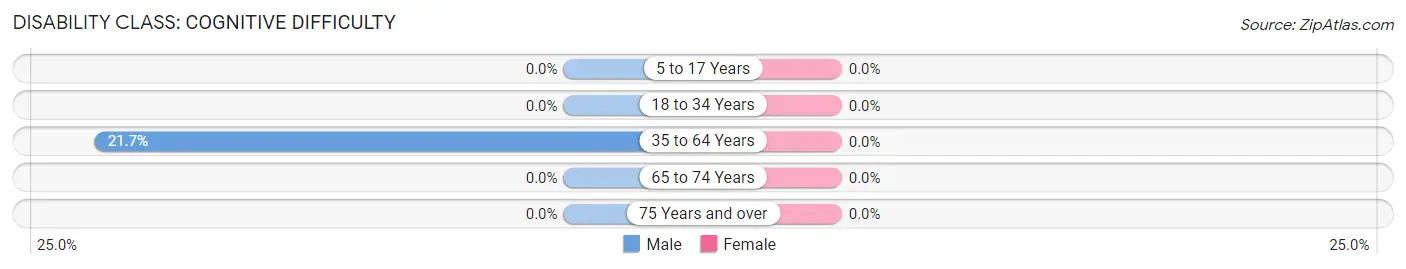
| Age Bracket | Male | Female |
| 5 to 17 Years | 0 (0.0%) | 0 (0.0%) |
| 18 to 34 Years | 0 (0.0%) | 0 (0.0%) |
| 35 to 64 Years | 10 (21.7%) | 0 (0.0%) |
| 65 to 74 Years | 0 (0.0%) | 0 (0.0%) |
| 75 Years and over | 0 (0.0%) | 0 (0.0%) |
Disability Class: Ambulatory Difficulty
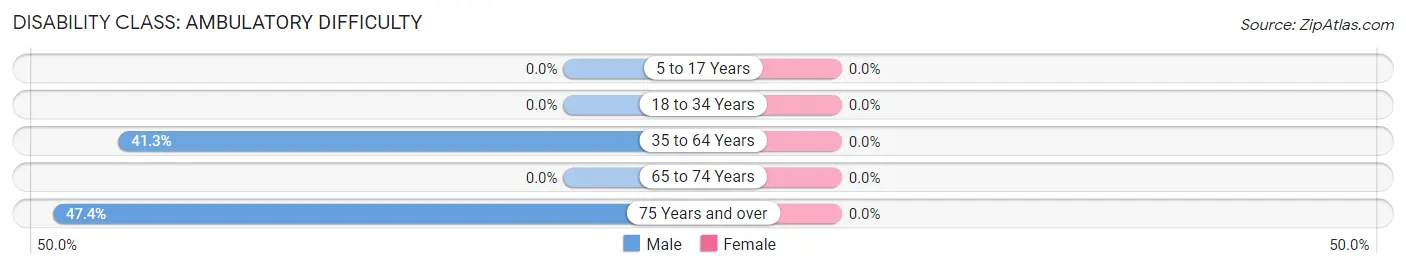
| Age Bracket | Male | Female |
| 5 to 17 Years | 0 (0.0%) | 0 (0.0%) |
| 18 to 34 Years | 0 (0.0%) | 0 (0.0%) |
| 35 to 64 Years | 19 (41.3%) | 0 (0.0%) |
| 65 to 74 Years | 0 (0.0%) | 0 (0.0%) |
| 75 Years and over | 9 (47.4%) | 0 (0.0%) |
Disability Class: Self-Care Difficulty
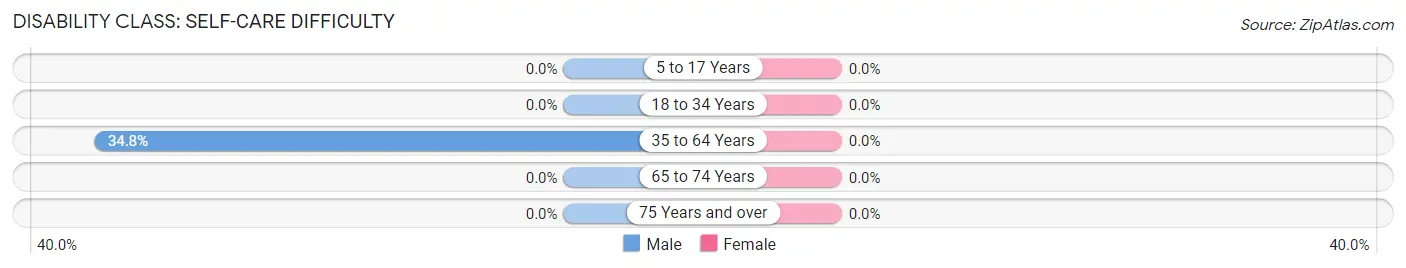
| Age Bracket | Male | Female |
| 5 to 17 Years | 0 (0.0%) | 0 (0.0%) |
| 18 to 34 Years | 0 (0.0%) | 0 (0.0%) |
| 35 to 64 Years | 16 (34.8%) | 0 (0.0%) |
| 65 to 74 Years | 0 (0.0%) | 0 (0.0%) |
| 75 Years and over | 0 (0.0%) | 0 (0.0%) |
Technology Access in La Victoria
Computing Device Access in La Victoria
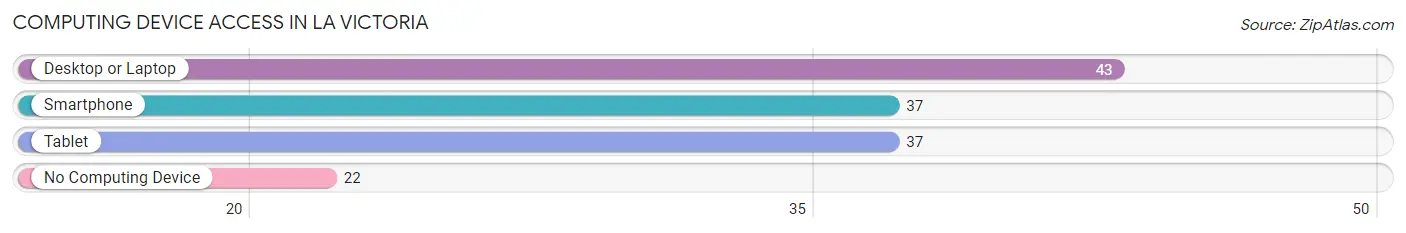
| Device Type | # Households | % Households |
| Desktop or Laptop | 43 | 66.1% |
| Smartphone | 37 | 56.9% |
| Tablet | 37 | 56.9% |
| No Computing Device | 22 | 33.9% |
| Total | 65 | 100.0% |
Internet Access in La Victoria
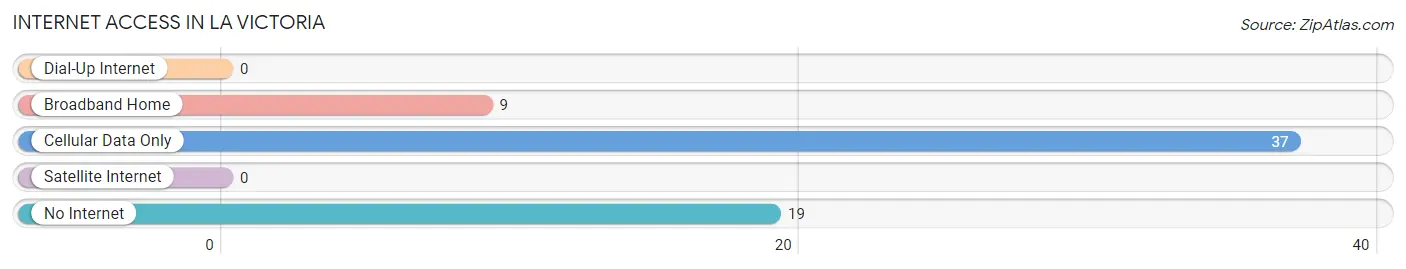
| Internet Type | # Households | % Households |
| Dial-Up Internet | 0 | 0.0% |
| Broadband Home | 9 | 13.9% |
| Cellular Data Only | 37 | 56.9% |
| Satellite Internet | 0 | 0.0% |
| No Internet | 19 | 29.2% |
| Total | 65 | 100.0% |
La Victoria Summary
Victoria, Texas is a city located in the south-central part of the state, in Victoria County. It is the county seat and the largest city in the county. The city is located on the Guadalupe River, about 30 miles inland from the Gulf of Mexico. The population of Victoria was estimated to be 62,592 in 2019.
History
The area that is now Victoria was first settled by Europeans in 1722, when Spanish explorer Martin de Leon established a settlement near the Guadalupe River. The settlement was named Nuestra Senora de Guadalupe de Jesus Victoria, after the patron saint of Spain. The settlement was abandoned in 1726, but was re-established in 1824 by Mexican settlers.
In 1836, the Republic of Texas was established, and the settlement was renamed Victoria. The city was incorporated in 1839, and was named the county seat of Victoria County.
In the late 19th century, Victoria became an important center for the cattle industry. The city was also a major port for cotton exports.
In the early 20th century, Victoria was a major center for oil production. The city was also a major center for the manufacture of military equipment during World War II.
Geography
Victoria is located in the south-central part of Texas, in Victoria County. The city is located on the Guadalupe River, about 30 miles inland from the Gulf of Mexico. The city is located at the intersection of U.S. Highway 59 and U.S. Highway 77.
The climate in Victoria is humid subtropical, with hot summers and mild winters. The average annual temperature is 68°F (20°C). The average annual precipitation is 33 inches (84 cm).
Economy
Victoria's economy is largely based on agriculture, manufacturing, and tourism. The city is home to several large manufacturing companies, including Caterpillar, Inc., and Formosa Plastics.
Agriculture is an important part of the local economy. The area is known for its production of cotton, corn, sorghum, and hay.
Tourism is also an important part of the local economy. The city is home to several attractions, including the Museum of the Coastal Bend, the Texas Zoo, and the Riverside Park.
Demographics
Victoria has a population of 62,592, according to the 2019 U.S. Census. The racial makeup of the city is 63.3% White, 28.2% Hispanic or Latino, 5.2% African American, and 3.3% other.
The median household income in Victoria is $45,845, and the median home value is $128,400. The city has a poverty rate of 17.3%.
Victoria is served by the Victoria Independent School District. The city is also home to several higher education institutions, including the University of Houston-Victoria, Victoria College, and Texas A&M University-Kingsville.
Common Questions
What is Per Capita Income in La Victoria?
Per Capita income in La Victoria is $24,146.
What is Inequality or Gini Index in La Victoria?
Inequality or Gini Index in La Victoria is 0.34.
What is the Total Population of La Victoria?
Total Population of La Victoria is 156.
What is the Total Male Population of La Victoria?
Total Male Population of La Victoria is 65.
What is the Total Female Population of La Victoria?
Total Female Population of La Victoria is 91.
What is the Ratio of Males per 100 Females in La Victoria?
There are 71.43 Males per 100 Females in La Victoria.
What is the Ratio of Females per 100 Males in La Victoria?
There are 140.00 Females per 100 Males in La Victoria.
What is the Median Population Age in La Victoria?
Median Population Age in La Victoria is 62.3 Years.
What is the Average Family Size in La Victoria
Average Family Size in La Victoria is 3.0 People.
What is the Average Household Size in La Victoria
Average Household Size in La Victoria is 2.4 People.
How Large is the Labor Force in La Victoria?
There are 44 People in the Labor Forcein in La Victoria.
What is the Percentage of People in the Labor Force in La Victoria?
28.2% of People are in the Labor Force in La Victoria.