Fairfield, TX Map & Demographics
Fairfield Map
Fairfield Overview
$27,665
PER CAPITA INCOME
$78,036
AVG FAMILY INCOME
$48,512
AVG HOUSEHOLD INCOME
35.1%
WAGE / INCOME GAP [ % ]
64.9¢/ $1
WAGE / INCOME GAP [ $ ]
0.45
INEQUALITY / GINI INDEX
2,867
TOTAL POPULATION
1,348
MALE POPULATION
1,519
FEMALE POPULATION
88.74
MALES / 100 FEMALES
112.69
FEMALES / 100 MALES
33.1
MEDIAN AGE
3.4
AVG FAMILY SIZE
2.5
AVG HOUSEHOLD SIZE
1,285
LABOR FORCE [ PEOPLE ]
56.5%
PERCENT IN LABOR FORCE
3.6%
UNEMPLOYMENT RATE
Fairfield Zip Codes
Fairfield Area Codes
Income in Fairfield
Income Overview in Fairfield
Per Capita Income in Fairfield is $27,665, while median incomes of families and households are $78,036 and $48,512 respectively.
| Characteristic | Number | Measure |
| Per Capita Income | 2,867 | $27,665 |
| Median Family Income | 656 | $78,036 |
| Mean Family Income | 656 | $83,468 |
| Median Household Income | 1,059 | $48,512 |
| Mean Household Income | 1,059 | $67,024 |
| Income Deficit | 656 | $0 |
| Wage / Income Gap (%) | 2,867 | 35.11% |
| Wage / Income Gap ($) | 2,867 | 64.89¢ per $1 |
| Gini / Inequality Index | 2,867 | 0.45 |
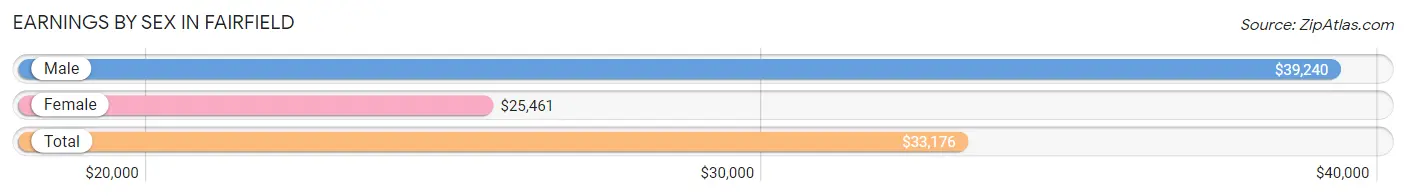
Earnings by Sex in Fairfield
Average Earnings in Fairfield are $33,176, $39,240 for men and $25,461 for women, a difference of 35.1%.
| Sex | Number | Average Earnings |
| Male | 695 (51.7%) | $39,240 |
| Female | 649 (48.3%) | $25,461 |
| Total | 1,344 (100.0%) | $33,176 |
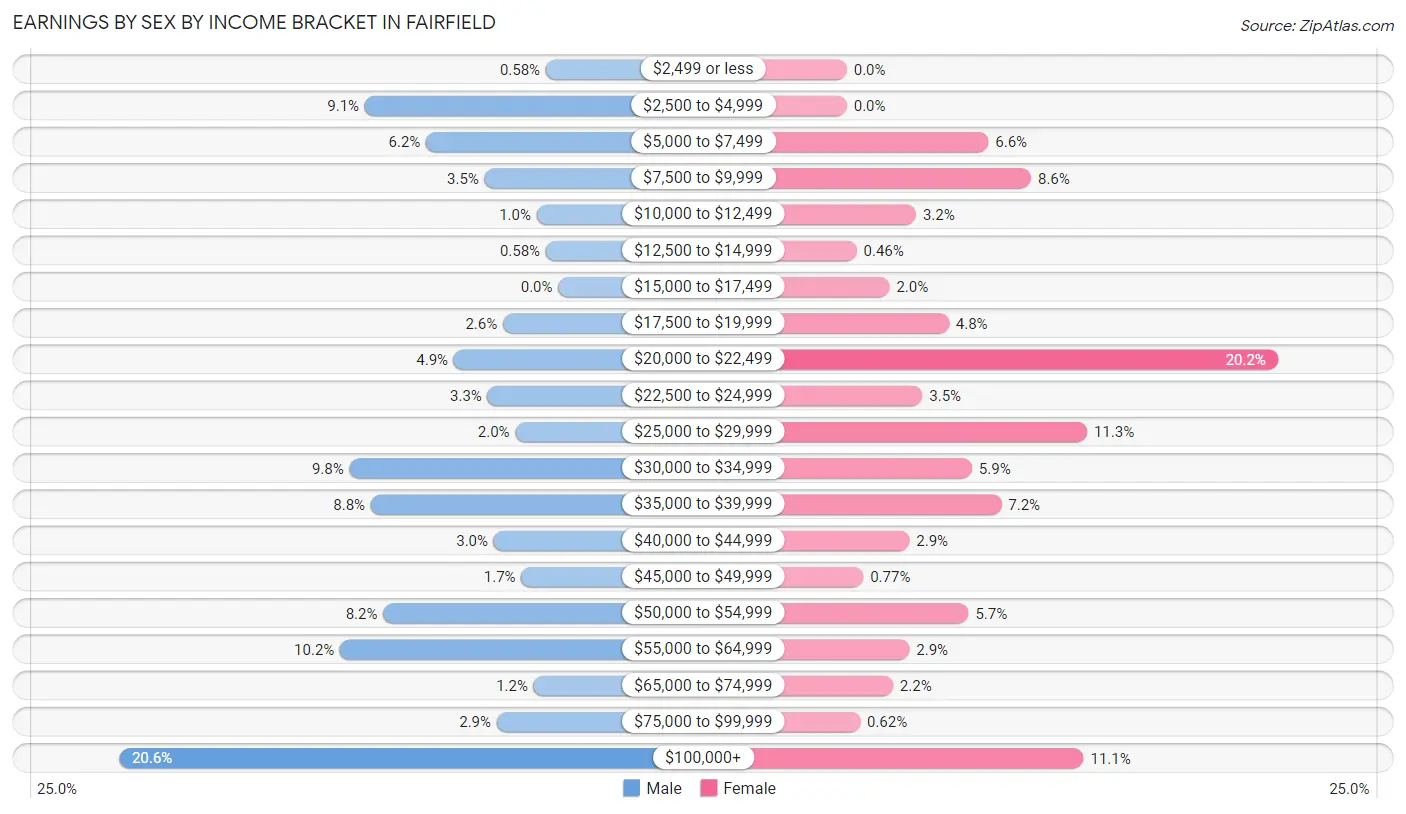
Earnings by Sex by Income Bracket in Fairfield
The most common earnings brackets in Fairfield are $100,000+ for men (143 | 20.6%) and $20,000 to $22,499 for women (131 | 20.2%).
| Income | Male | Female |
| $2,499 or less | 4 (0.6%) | 0 (0.0%) |
| $2,500 to $4,999 | 63 (9.1%) | 0 (0.0%) |
| $5,000 to $7,499 | 43 (6.2%) | 43 (6.6%) |
| $7,500 to $9,999 | 24 (3.5%) | 56 (8.6%) |
| $10,000 to $12,499 | 7 (1.0%) | 21 (3.2%) |
| $12,500 to $14,999 | 4 (0.6%) | 3 (0.5%) |
| $15,000 to $17,499 | 0 (0.0%) | 13 (2.0%) |
| $17,500 to $19,999 | 18 (2.6%) | 31 (4.8%) |
| $20,000 to $22,499 | 34 (4.9%) | 131 (20.2%) |
| $22,500 to $24,999 | 23 (3.3%) | 23 (3.5%) |
| $25,000 to $29,999 | 14 (2.0%) | 73 (11.3%) |
| $30,000 to $34,999 | 68 (9.8%) | 38 (5.9%) |
| $35,000 to $39,999 | 61 (8.8%) | 47 (7.2%) |
| $40,000 to $44,999 | 21 (3.0%) | 19 (2.9%) |
| $45,000 to $49,999 | 12 (1.7%) | 5 (0.8%) |
| $50,000 to $54,999 | 57 (8.2%) | 37 (5.7%) |
| $55,000 to $64,999 | 71 (10.2%) | 19 (2.9%) |
| $65,000 to $74,999 | 8 (1.1%) | 14 (2.2%) |
| $75,000 to $99,999 | 20 (2.9%) | 4 (0.6%) |
| $100,000+ | 143 (20.6%) | 72 (11.1%) |
| Total | 695 (100.0%) | 649 (100.0%) |
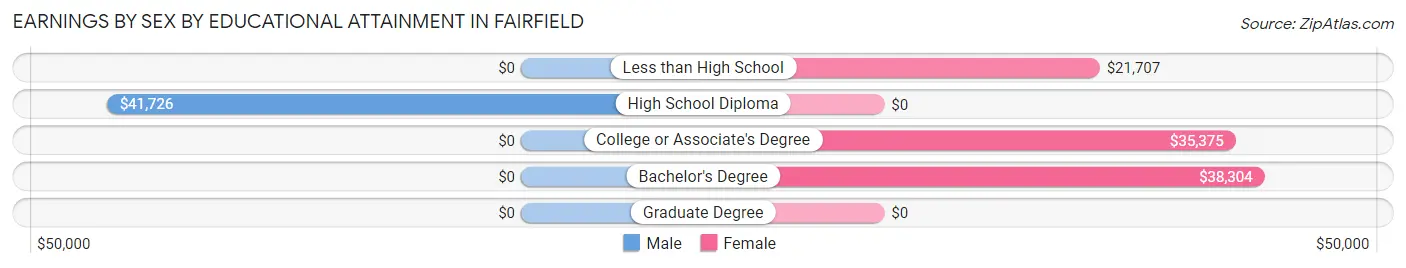
Earnings by Sex by Educational Attainment in Fairfield
Average earnings in Fairfield are $41,964 for men and $29,792 for women, a difference of 29.0%. Men with an educational attainment of high school diploma enjoy the highest average annual earnings of $41,726, while those with high school diploma education earn the least with $41,726. Women with an educational attainment of bachelor's degree earn the most with the average annual earnings of $38,304, while those with less than high school education have the smallest earnings of $21,707.
| Educational Attainment | Male Income | Female Income |
| Less than High School | - | - |
| High School Diploma | $41,726 | $0 |
| College or Associate's Degree | - | - |
| Bachelor's Degree | - | - |
| Graduate Degree | - | - |
| Total | $41,964 | $29,792 |
Family Income in Fairfield
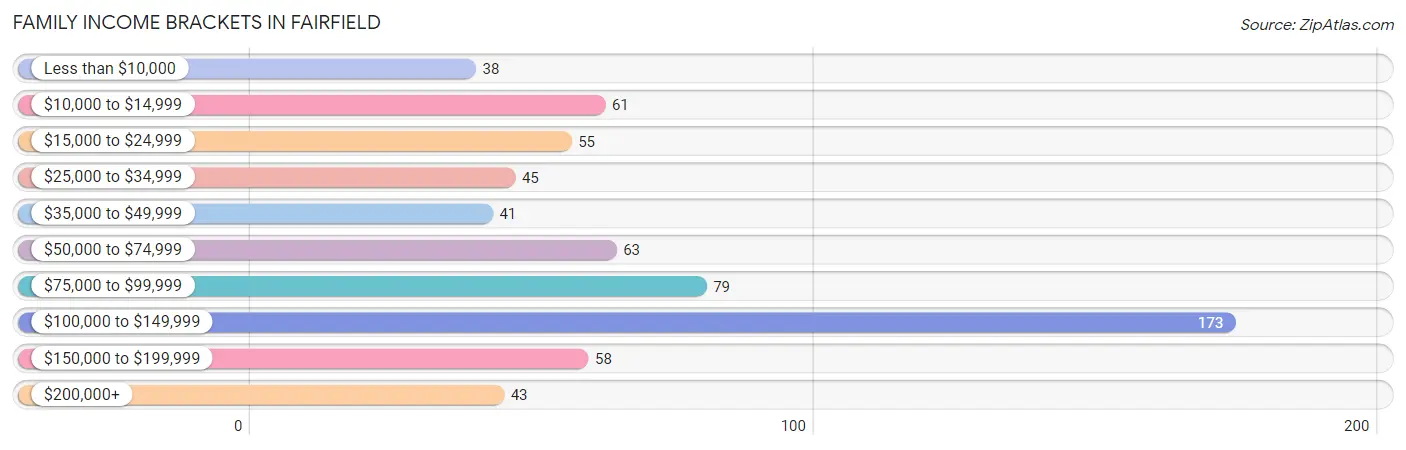
Family Income Brackets in Fairfield
According to the Fairfield family income data, there are 173 families falling into the $100,000 to $149,999 income range, which is the most common income bracket and makes up 26.4% of all families. Conversely, the less than $10,000 income bracket is the least frequent group with only 38 families (5.8%) belonging to this category.
| Income Bracket | # Families | % Families |
| Less than $10,000 | 38 | 5.8% |
| $10,000 to $14,999 | 61 | 9.3% |
| $15,000 to $24,999 | 55 | 8.4% |
| $25,000 to $34,999 | 45 | 6.9% |
| $35,000 to $49,999 | 41 | 6.3% |
| $50,000 to $74,999 | 63 | 9.6% |
| $75,000 to $99,999 | 79 | 12.0% |
| $100,000 to $149,999 | 173 | 26.4% |
| $150,000 to $199,999 | 58 | 8.8% |
| $200,000+ | 43 | 6.6% |
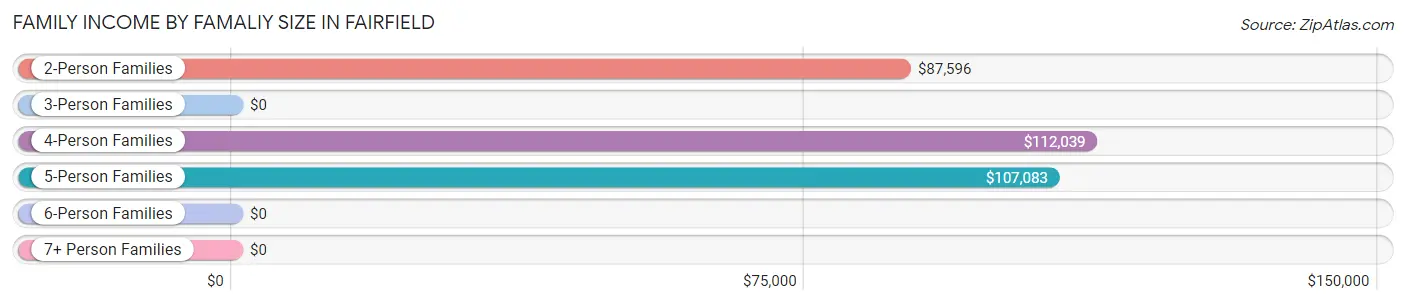
Family Income by Famaliy Size in Fairfield
4-person families (101 | 15.4%) account for the highest median family income in Fairfield with $112,039 per family, while 2-person families (329 | 50.1%) have the highest median income of $43,798 per family member.
| Income Bracket | # Families | Median Income |
| 2-Person Families | 329 (50.1%) | $87,596 |
| 3-Person Families | 157 (23.9%) | $0 |
| 4-Person Families | 101 (15.4%) | $112,039 |
| 5-Person Families | 48 (7.3%) | $107,083 |
| 6-Person Families | 21 (3.2%) | $0 |
| 7+ Person Families | 0 (0.0%) | $0 |
| Total | 656 (100.0%) | $78,036 |
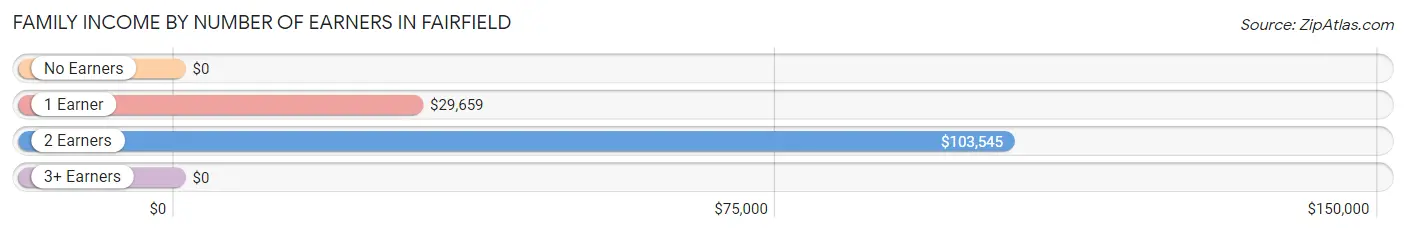
Family Income by Number of Earners in Fairfield
| Number of Earners | # Families | Median Income |
| No Earners | 120 (18.3%) | $0 |
| 1 Earner | 233 (35.5%) | $29,659 |
| 2 Earners | 259 (39.5%) | $103,545 |
| 3+ Earners | 44 (6.7%) | $0 |
| Total | 656 (100.0%) | $78,036 |
Household Income in Fairfield
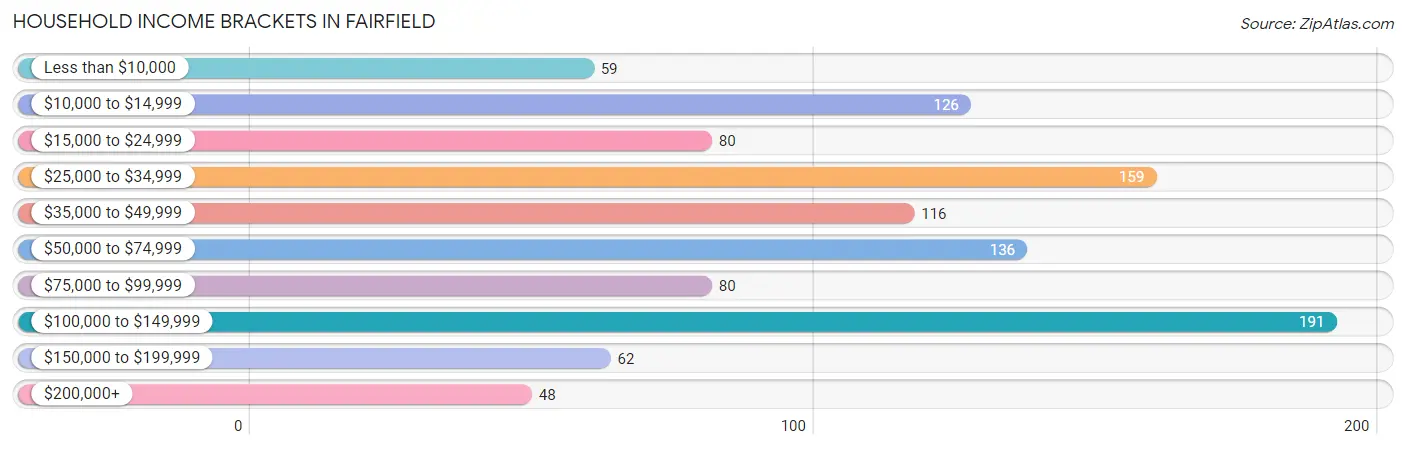
Household Income Brackets in Fairfield
With 191 households falling in the category, the $100,000 to $149,999 income range is the most frequent in Fairfield, accounting for 18.0% of all households. In contrast, only 48 households (4.5%) fall into the $200,000+ income bracket, making it the least populous group.
| Income Bracket | # Households | % Households |
| Less than $10,000 | 59 | 5.6% |
| $10,000 to $14,999 | 126 | 11.9% |
| $15,000 to $24,999 | 80 | 7.6% |
| $25,000 to $34,999 | 159 | 15.0% |
| $35,000 to $49,999 | 116 | 11.0% |
| $50,000 to $74,999 | 136 | 12.8% |
| $75,000 to $99,999 | 80 | 7.6% |
| $100,000 to $149,999 | 191 | 18.0% |
| $150,000 to $199,999 | 62 | 5.9% |
| $200,000+ | 48 | 4.5% |
Household Income by Householder Age in Fairfield
The median household income in Fairfield is $48,512, with the highest median household income of $60,500 found in the 45 to 64 years age bracket for the primary householder. A total of 334 households (31.5%) fall into this category. Meanwhile, the 15 to 24 years age bracket for the primary householder has the lowest median household income of $0, with 69 households (6.5%) in this group.
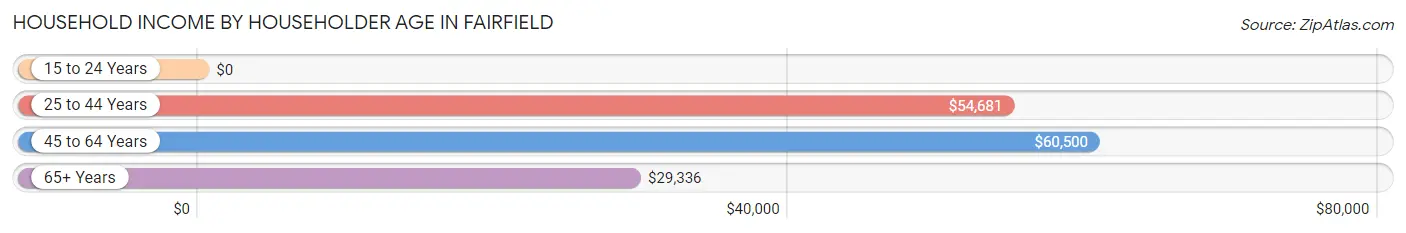
| Income Bracket | # Households | Median Income |
| 15 to 24 Years | 69 (6.5%) | $0 |
| 25 to 44 Years | 377 (35.6%) | $54,681 |
| 45 to 64 Years | 334 (31.5%) | $60,500 |
| 65+ Years | 279 (26.4%) | $29,336 |
| Total | 1,059 (100.0%) | $48,512 |
Poverty in Fairfield
Income Below Poverty by Sex and Age in Fairfield
With 19.8% poverty level for males and 31.1% for females among the residents of Fairfield, 5 year old males and 12 to 14 year old females are the most vulnerable to poverty, with 41 males (71.9%) and 59 females (76.6%) in their respective age groups living below the poverty level.
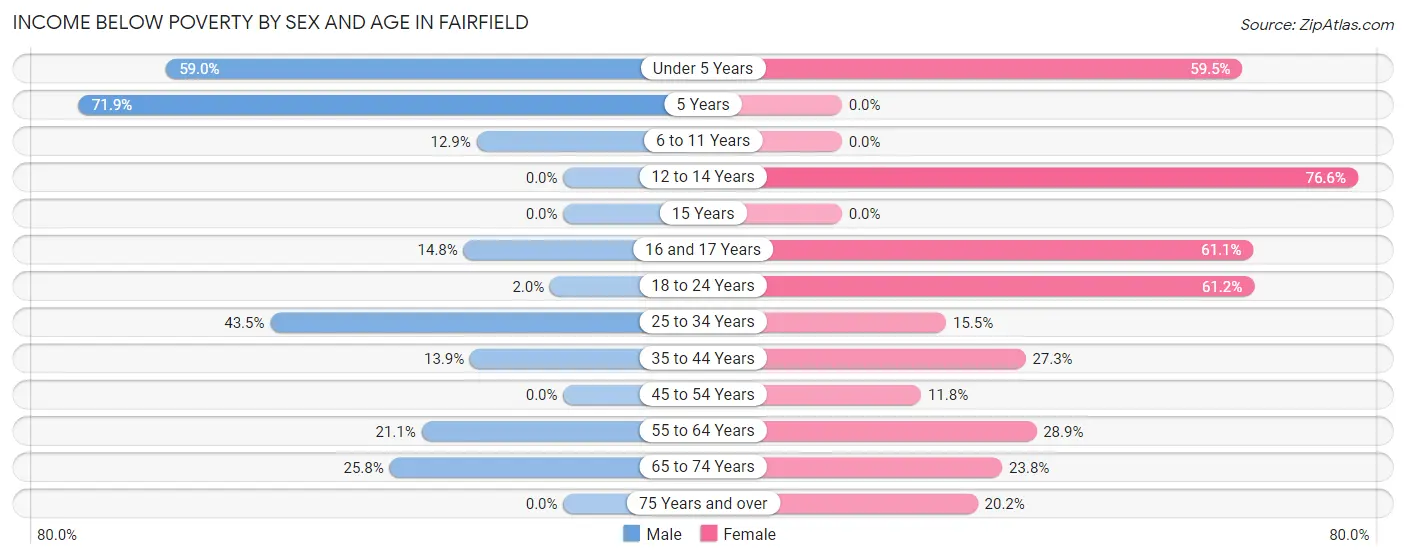
| Age Bracket | Male | Female |
| Under 5 Years | 23 (59.0%) | 69 (59.5%) |
| 5 Years | 41 (71.9%) | 0 (0.0%) |
| 6 to 11 Years | 21 (12.9%) | 0 (0.0%) |
| 12 to 14 Years | 0 (0.0%) | 59 (76.6%) |
| 15 Years | 0 (0.0%) | 0 (0.0%) |
| 16 and 17 Years | 12 (14.8%) | 22 (61.1%) |
| 18 to 24 Years | 3 (2.0%) | 101 (61.2%) |
| 25 to 34 Years | 84 (43.5%) | 37 (15.5%) |
| 35 to 44 Years | 23 (13.9%) | 42 (27.3%) |
| 45 to 54 Years | 0 (0.0%) | 16 (11.8%) |
| 55 to 64 Years | 20 (21.0%) | 41 (28.9%) |
| 65 to 74 Years | 24 (25.8%) | 20 (23.8%) |
| 75 Years and over | 0 (0.0%) | 24 (20.2%) |
| Total | 251 (19.8%) | 431 (31.1%) |
Income Above Poverty by Sex and Age in Fairfield
According to the poverty statistics in Fairfield, males aged 12 to 14 years and females aged 5 years are the age groups that are most secure financially, with 100.0% of males and 100.0% of females in these age groups living above the poverty line.
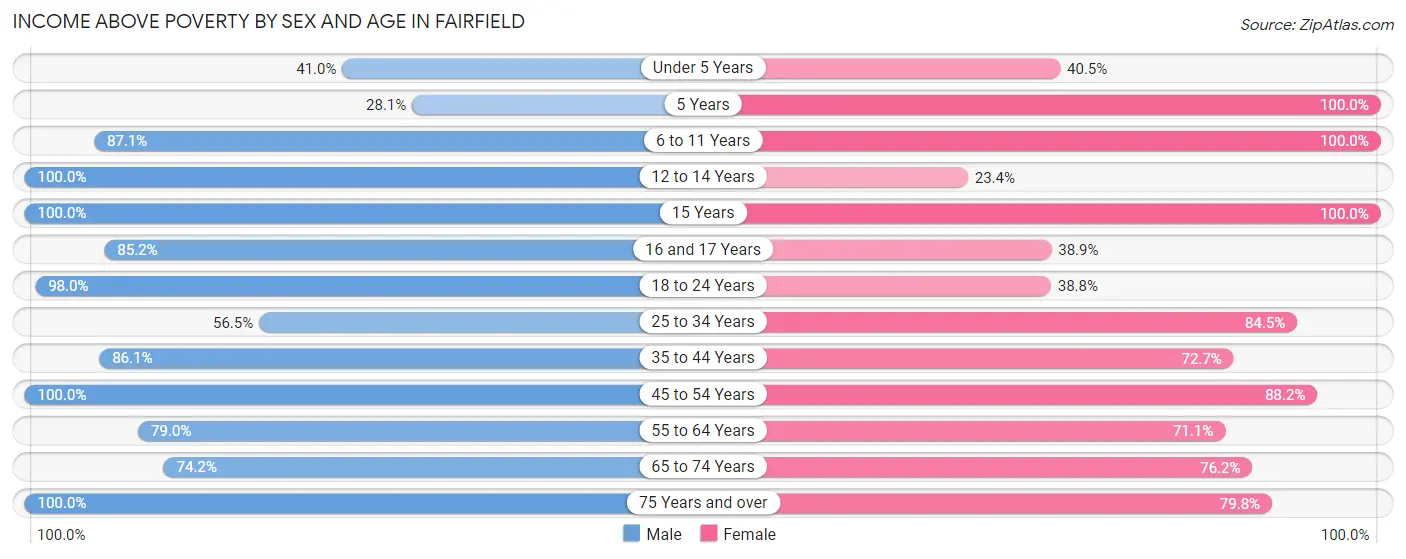
| Age Bracket | Male | Female |
| Under 5 Years | 16 (41.0%) | 47 (40.5%) |
| 5 Years | 16 (28.1%) | 29 (100.0%) |
| 6 to 11 Years | 142 (87.1%) | 61 (100.0%) |
| 12 to 14 Years | 9 (100.0%) | 18 (23.4%) |
| 15 Years | 6 (100.0%) | 28 (100.0%) |
| 16 and 17 Years | 69 (85.2%) | 14 (38.9%) |
| 18 to 24 Years | 149 (98.0%) | 64 (38.8%) |
| 25 to 34 Years | 109 (56.5%) | 202 (84.5%) |
| 35 to 44 Years | 143 (86.1%) | 112 (72.7%) |
| 45 to 54 Years | 151 (100.0%) | 120 (88.2%) |
| 55 to 64 Years | 75 (78.9%) | 101 (71.1%) |
| 65 to 74 Years | 69 (74.2%) | 64 (76.2%) |
| 75 Years and over | 60 (100.0%) | 95 (79.8%) |
| Total | 1,014 (80.2%) | 955 (68.9%) |
Income Below Poverty Among Married-Couple Families in Fairfield
The poverty statistics for married-couple families in Fairfield show that 5.5% or 18 of the total 329 families live below the poverty line. Families with 1 or 2 children have the highest poverty rate of 7.8%, comprising of 9 families. On the other hand, families with 3 or 4 children have the lowest poverty rate of 0.0%, which includes 0 families.
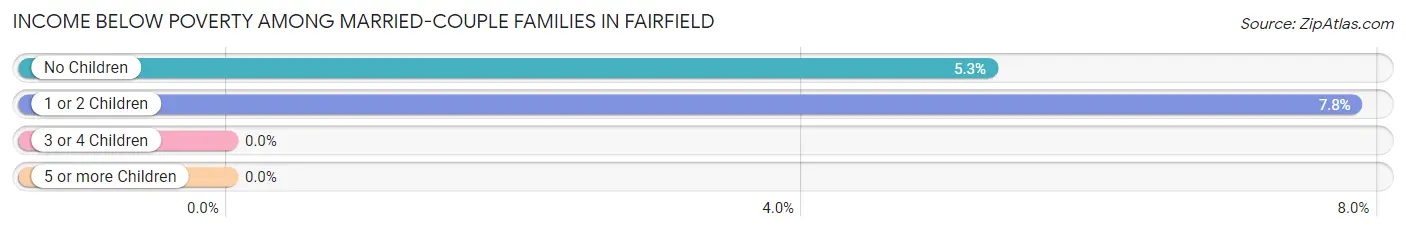
| Children | Above Poverty | Below Poverty |
| No Children | 161 (94.7%) | 9 (5.3%) |
| 1 or 2 Children | 106 (92.2%) | 9 (7.8%) |
| 3 or 4 Children | 44 (100.0%) | 0 (0.0%) |
| 5 or more Children | 0 (0.0%) | 0 (0.0%) |
| Total | 311 (94.5%) | 18 (5.5%) |
Income Below Poverty Among Single-Parent Households in Fairfield
According to the poverty data in Fairfield, 22.6% or 12 single-father households and 47.8% or 131 single-mother households are living below the poverty line. Among single-father households, those with 1 or 2 children have the highest poverty rate, with 12 households (35.3%) experiencing poverty. Likewise, among single-mother households, those with 3 or 4 children have the highest poverty rate, with 35 households (100.0%) falling below the poverty line.
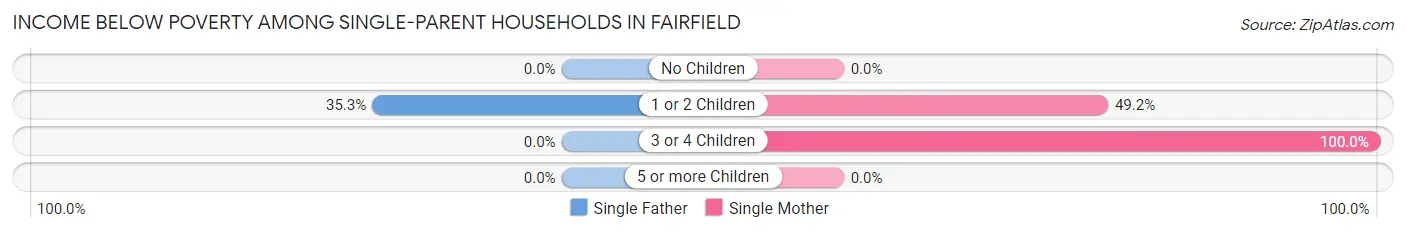
| Children | Single Father | Single Mother |
| No Children | 0 (0.0%) | 0 (0.0%) |
| 1 or 2 Children | 12 (35.3%) | 96 (49.2%) |
| 3 or 4 Children | 0 (0.0%) | 35 (100.0%) |
| 5 or more Children | 0 (0.0%) | 0 (0.0%) |
| Total | 12 (22.6%) | 131 (47.8%) |
Income Below Poverty Among Married-Couple vs Single-Parent Households in Fairfield
The poverty data for Fairfield shows that 18 of the married-couple family households (5.5%) and 143 of the single-parent households (43.7%) are living below the poverty level. Within the married-couple family households, those with 1 or 2 children have the highest poverty rate, with 9 households (7.8%) falling below the poverty line. Among the single-parent households, those with 3 or 4 children have the highest poverty rate, with 35 household (89.7%) living below poverty.
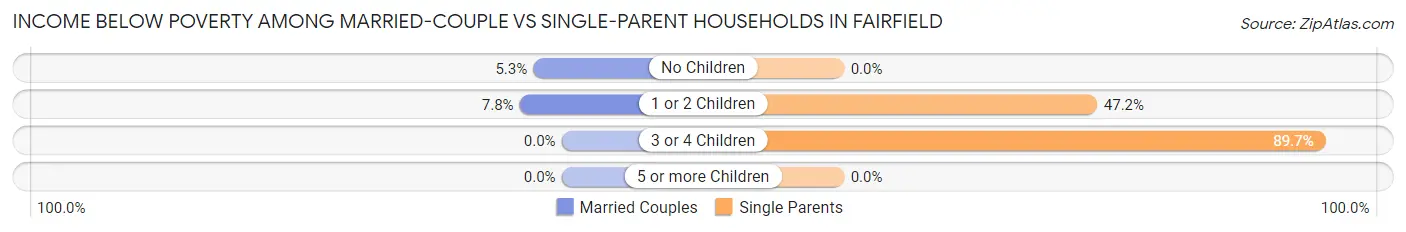
| Children | Married-Couple Families | Single-Parent Households |
| No Children | 9 (5.3%) | 0 (0.0%) |
| 1 or 2 Children | 9 (7.8%) | 108 (47.2%) |
| 3 or 4 Children | 0 (0.0%) | 35 (89.7%) |
| 5 or more Children | 0 (0.0%) | 0 (0.0%) |
| Total | 18 (5.5%) | 143 (43.7%) |
Race in Fairfield
The most populous races in Fairfield are White / Caucasian (1,943 | 67.8%), Hispanic or Latino (801 | 27.9%), and Black / African American (427 | 14.9%).
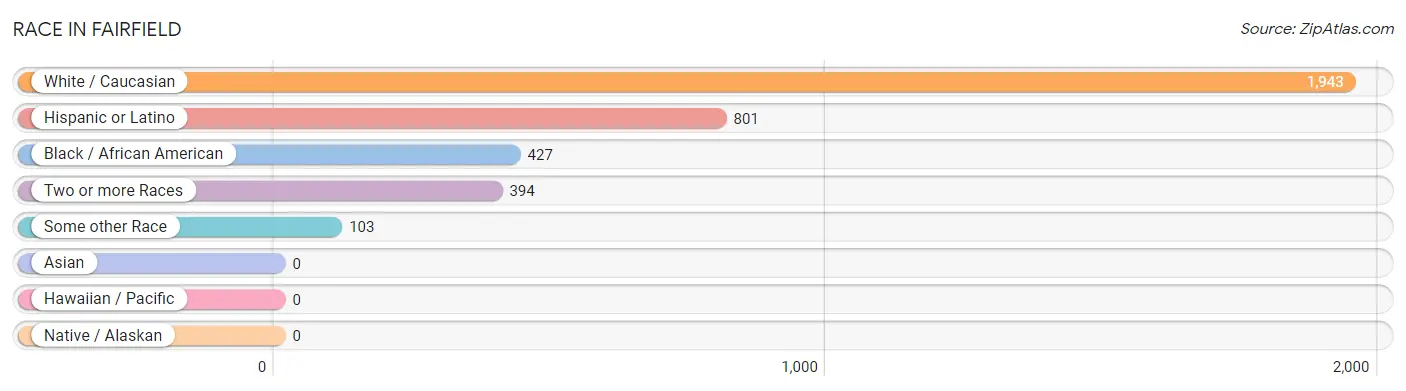
| Race | # Population | % Population |
| Asian | 0 | 0.0% |
| Black / African American | 427 | 14.9% |
| Hawaiian / Pacific | 0 | 0.0% |
| Hispanic or Latino | 801 | 27.9% |
| Native / Alaskan | 0 | 0.0% |
| White / Caucasian | 1,943 | 67.8% |
| Two or more Races | 394 | 13.7% |
| Some other Race | 103 | 3.6% |
| Total | 2,867 | 100.0% |
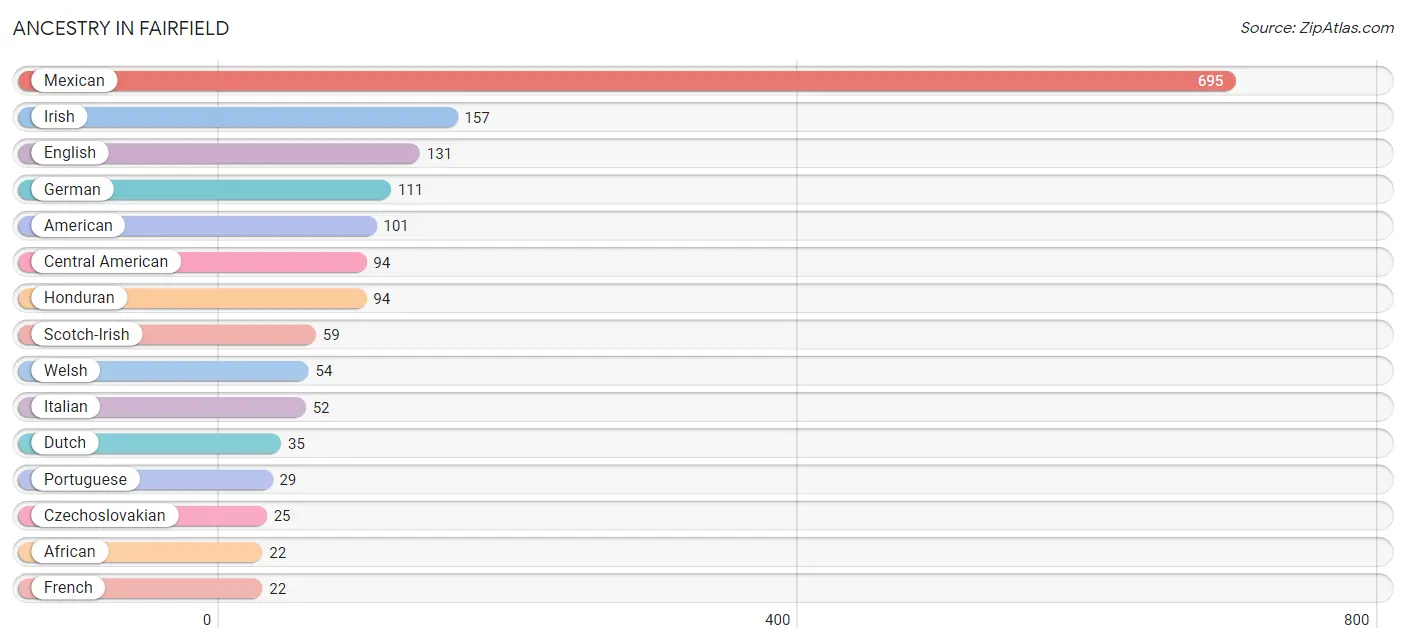
Ancestry in Fairfield
The most populous ancestries reported in Fairfield are Mexican (695 | 24.2%), Irish (157 | 5.5%), English (131 | 4.6%), German (111 | 3.9%), and American (101 | 3.5%), together accounting for 41.7% of all Fairfield residents.
| Ancestry | # Population | % Population |
| African | 22 | 0.8% |
| American | 101 | 3.5% |
| Austrian | 8 | 0.3% |
| British | 20 | 0.7% |
| Central American | 94 | 3.3% |
| Choctaw | 4 | 0.1% |
| Cuban | 5 | 0.2% |
| Czech | 14 | 0.5% |
| Czechoslovakian | 25 | 0.9% |
| Dutch | 35 | 1.2% |
| English | 131 | 4.6% |
| European | 18 | 0.6% |
| French | 22 | 0.8% |
| French Canadian | 13 | 0.4% |
| German | 111 | 3.9% |
| Honduran | 94 | 3.3% |
| Irish | 157 | 5.5% |
| Italian | 52 | 1.8% |
| Jamaican | 9 | 0.3% |
| Mexican | 695 | 24.2% |
| Norwegian | 13 | 0.4% |
| Polish | 12 | 0.4% |
| Portuguese | 29 | 1.0% |
| Scotch-Irish | 59 | 2.1% |
| Scottish | 10 | 0.4% |
| Spaniard | 3 | 0.1% |
| Subsaharan African | 22 | 0.8% |
| Welsh | 54 | 1.9% | View All 28 Rows |
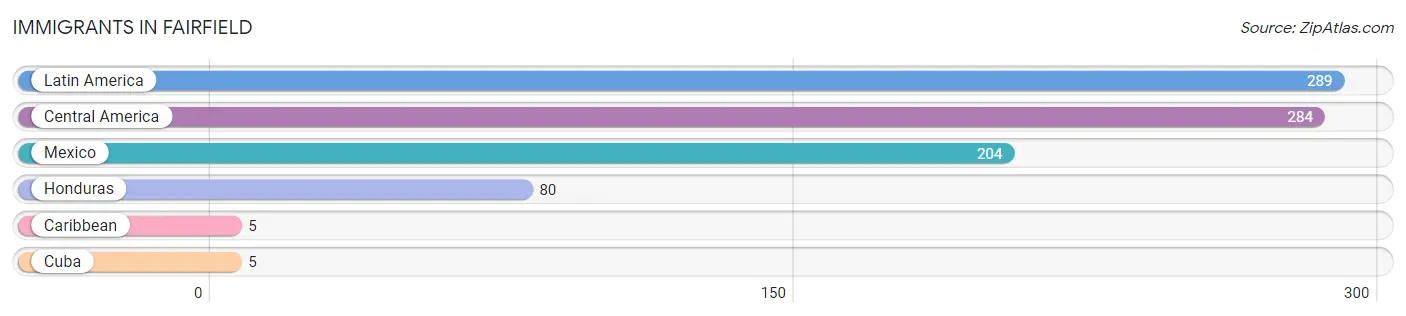
Immigrants in Fairfield
The most numerous immigrant groups reported in Fairfield came from Latin America (289 | 10.1%), Central America (284 | 9.9%), Mexico (204 | 7.1%), Honduras (80 | 2.8%), and Caribbean (5 | 0.2%), together accounting for 30.1% of all Fairfield residents.
| Immigration Origin | # Population | % Population |
| Caribbean | 5 | 0.2% |
| Central America | 284 | 9.9% |
| Cuba | 5 | 0.2% |
| Honduras | 80 | 2.8% |
| Latin America | 289 | 10.1% |
| Mexico | 204 | 7.1% | View All 6 Rows |
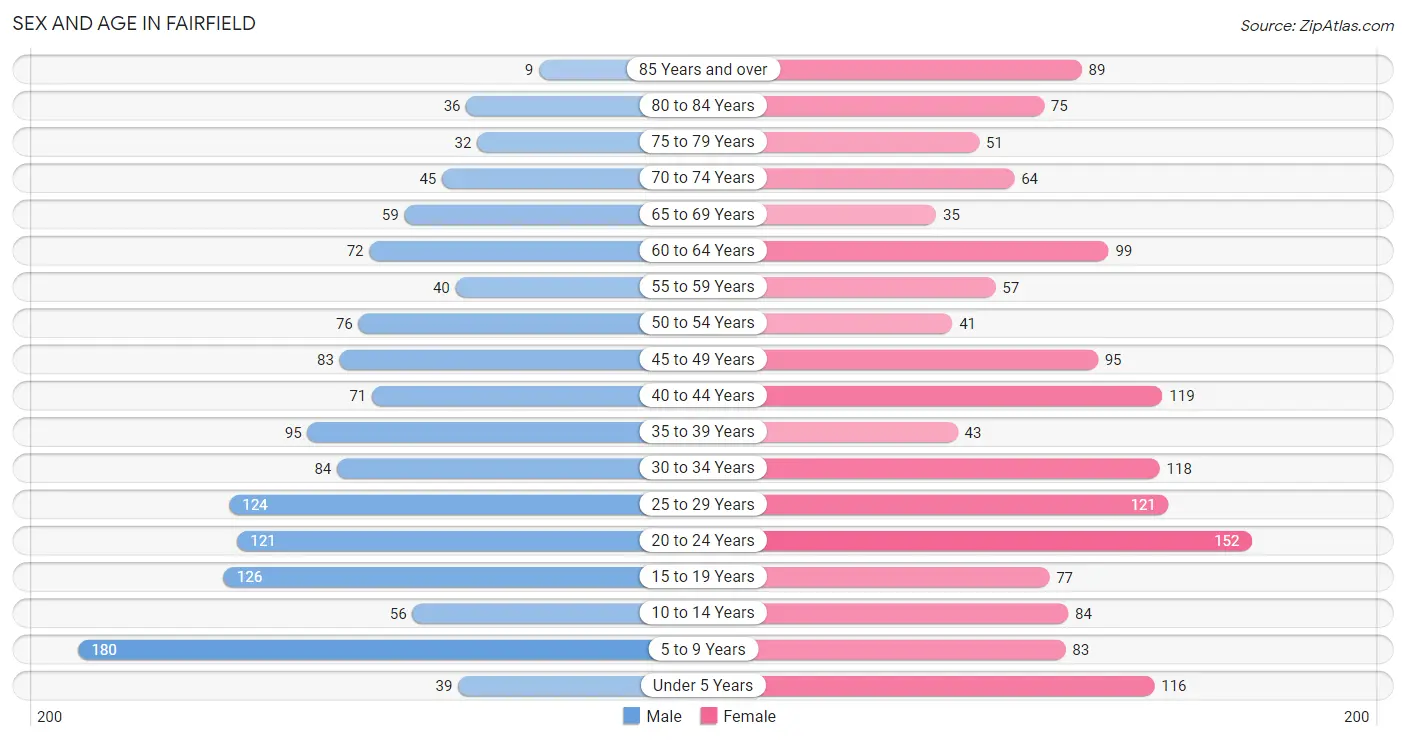
Sex and Age in Fairfield
Sex and Age in Fairfield
The most populous age groups in Fairfield are 5 to 9 Years (180 | 13.4%) for men and 20 to 24 Years (152 | 10.0%) for women.
| Age Bracket | Male | Female |
| Under 5 Years | 39 (2.9%) | 116 (7.6%) |
| 5 to 9 Years | 180 (13.4%) | 83 (5.5%) |
| 10 to 14 Years | 56 (4.2%) | 84 (5.5%) |
| 15 to 19 Years | 126 (9.3%) | 77 (5.1%) |
| 20 to 24 Years | 121 (9.0%) | 152 (10.0%) |
| 25 to 29 Years | 124 (9.2%) | 121 (8.0%) |
| 30 to 34 Years | 84 (6.2%) | 118 (7.8%) |
| 35 to 39 Years | 95 (7.0%) | 43 (2.8%) |
| 40 to 44 Years | 71 (5.3%) | 119 (7.8%) |
| 45 to 49 Years | 83 (6.2%) | 95 (6.2%) |
| 50 to 54 Years | 76 (5.6%) | 41 (2.7%) |
| 55 to 59 Years | 40 (3.0%) | 57 (3.7%) |
| 60 to 64 Years | 72 (5.3%) | 99 (6.5%) |
| 65 to 69 Years | 59 (4.4%) | 35 (2.3%) |
| 70 to 74 Years | 45 (3.3%) | 64 (4.2%) |
| 75 to 79 Years | 32 (2.4%) | 51 (3.4%) |
| 80 to 84 Years | 36 (2.7%) | 75 (4.9%) |
| 85 Years and over | 9 (0.7%) | 89 (5.9%) |
| Total | 1,348 (100.0%) | 1,519 (100.0%) |
Families and Households in Fairfield
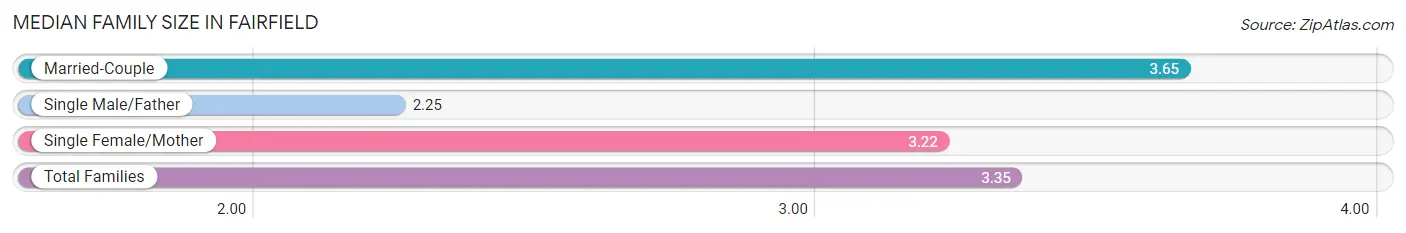
Median Family Size in Fairfield
The median family size in Fairfield is 3.35 persons per family, with married-couple families (329 | 50.1%) accounting for the largest median family size of 3.65 persons per family. On the other hand, single male/father families (53 | 8.1%) represent the smallest median family size with 2.25 persons per family.
| Family Type | # Families | Family Size |
| Married-Couple | 329 (50.1%) | 3.65 |
| Single Male/Father | 53 (8.1%) | 2.25 |
| Single Female/Mother | 274 (41.8%) | 3.22 |
| Total Families | 656 (100.0%) | 3.35 |
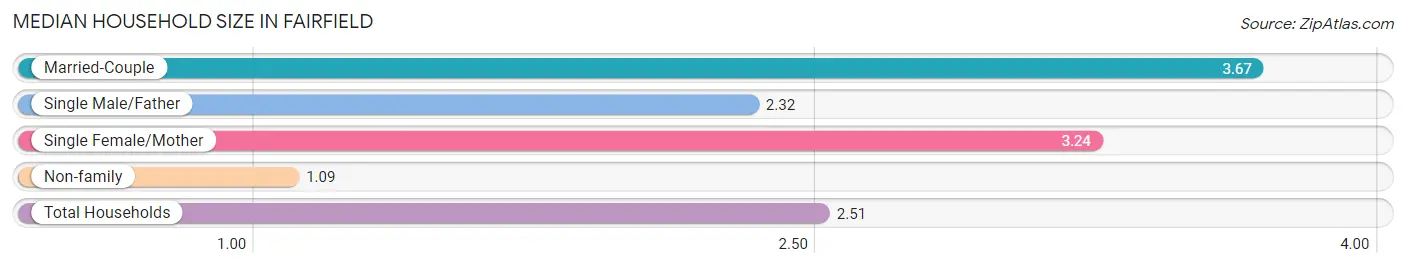
Median Household Size in Fairfield
The median household size in Fairfield is 2.51 persons per household, with married-couple households (329 | 31.1%) accounting for the largest median household size of 3.67 persons per household. non-family households (403 | 38.1%) represent the smallest median household size with 1.09 persons per household.
| Household Type | # Households | Household Size |
| Married-Couple | 329 (31.1%) | 3.67 |
| Single Male/Father | 53 (5.0%) | 2.32 |
| Single Female/Mother | 274 (25.9%) | 3.24 |
| Non-family | 403 (38.1%) | 1.09 |
| Total Households | 1,059 (100.0%) | 2.51 |
Household Size by Marriage Status in Fairfield
Out of a total of 1,059 households in Fairfield, 656 (62.0%) are family households, while 403 (38.1%) are nonfamily households. The most numerous type of family households are 2-person households, comprising 317, and the most common type of nonfamily households are 1-person households, comprising 384.
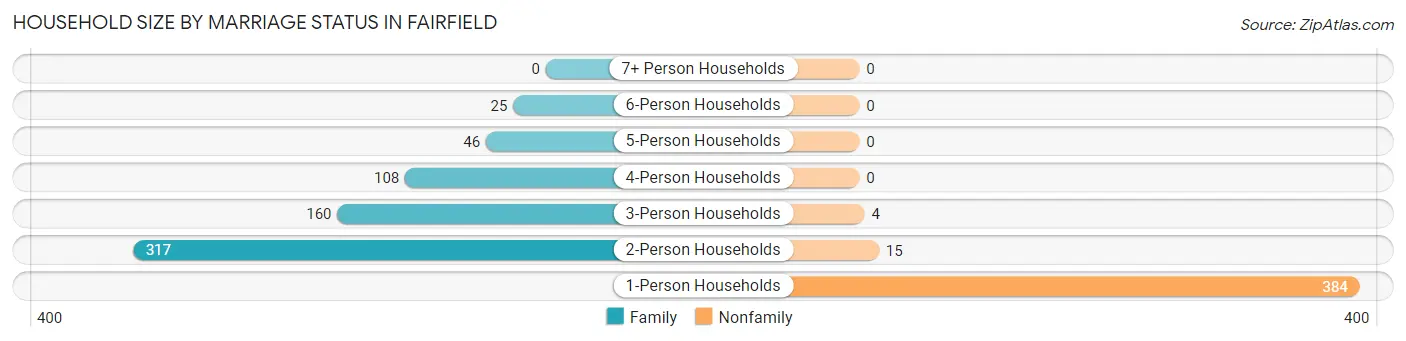
| Household Size | Family Households | Nonfamily Households |
| 1-Person Households | - | 384 (36.3%) |
| 2-Person Households | 317 (29.9%) | 15 (1.4%) |
| 3-Person Households | 160 (15.1%) | 4 (0.4%) |
| 4-Person Households | 108 (10.2%) | 0 (0.0%) |
| 5-Person Households | 46 (4.3%) | 0 (0.0%) |
| 6-Person Households | 25 (2.4%) | 0 (0.0%) |
| 7+ Person Households | 0 (0.0%) | 0 (0.0%) |
| Total | 656 (62.0%) | 403 (38.1%) |
Female Fertility in Fairfield
Fertility by Age in Fairfield
Average fertility rate in Fairfield is 93.0 births per 1,000 women. Women in the age bracket of 20 to 34 years have the highest fertility rate with 176.0 births per 1,000 women. Women in the age bracket of 20 to 34 years acount for 100.0% of all women with births.
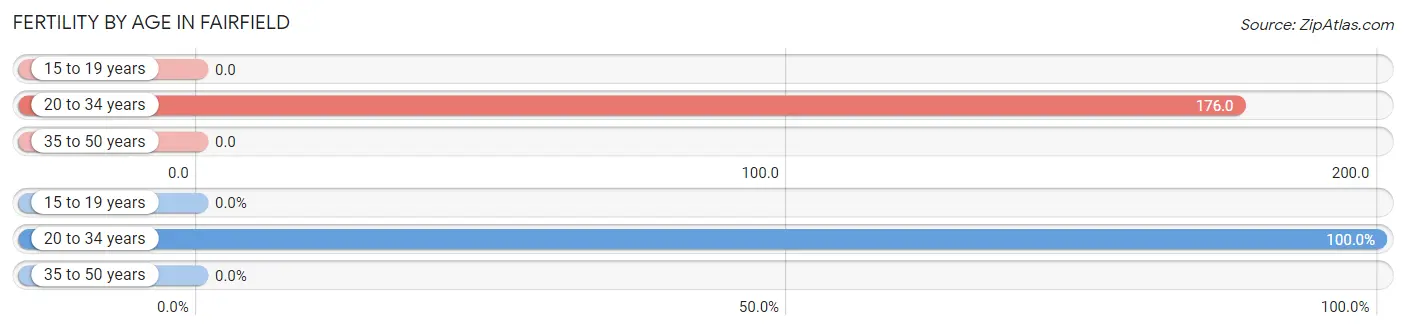
| Age Bracket | Women with Births | Births / 1,000 Women |
| 15 to 19 years | 0 (0.0%) | 0.0 |
| 20 to 34 years | 69 (100.0%) | 176.0 |
| 35 to 50 years | 0 (0.0%) | 0.0 |
| Total | 69 (100.0%) | 93.0 |
Fertility by Age by Marriage Status in Fairfield
55.1% of women with births (69) in Fairfield are married. The highest percentage of unmarried women with births falls into 20 to 34 years age bracket with 44.9% of them unmarried at the time of birth, while the lowest percentage of unmarried women with births belong to 20 to 34 years age bracket with 44.9% of them unmarried.
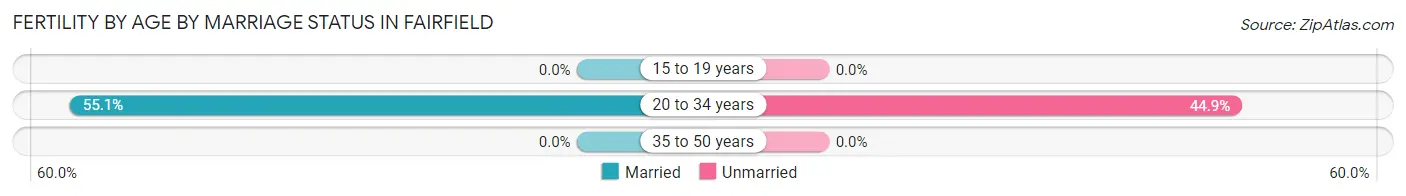
| Age Bracket | Married | Unmarried |
| 15 to 19 years | 0 (0.0%) | 0 (0.0%) |
| 20 to 34 years | 38 (55.1%) | 31 (44.9%) |
| 35 to 50 years | 0 (0.0%) | 0 (0.0%) |
| Total | 38 (55.1%) | 31 (44.9%) |
Fertility by Education in Fairfield
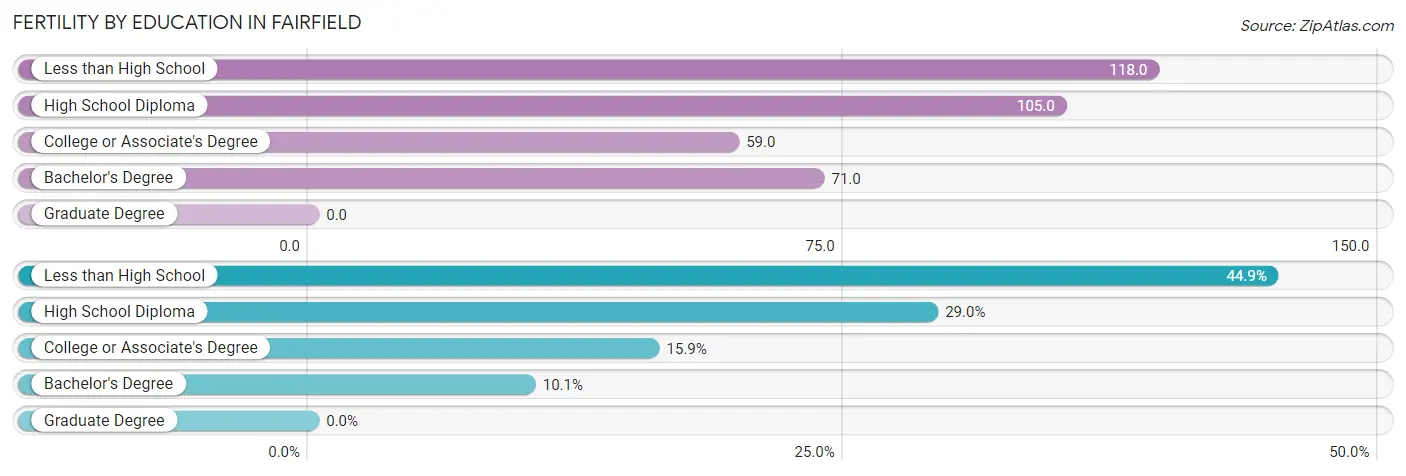
| Educational Attainment | Women with Births | Births / 1,000 Women |
| Less than High School | 31 (44.9%) | 118.0 |
| High School Diploma | 20 (29.0%) | 105.0 |
| College or Associate's Degree | 11 (15.9%) | 59.0 |
| Bachelor's Degree | 7 (10.1%) | 71.0 |
| Graduate Degree | 0 (0.0%) | 0.0 |
| Total | 69 (100.0%) | 93.0 |
Fertility by Education by Marriage Status in Fairfield
44.9% of women with births in Fairfield are unmarried. Women with the educational attainment of high school diploma are most likely to be married with 100.0% of them married at childbirth, while women with the educational attainment of less than high school are least likely to be married with 100.0% of them unmarried at childbirth.
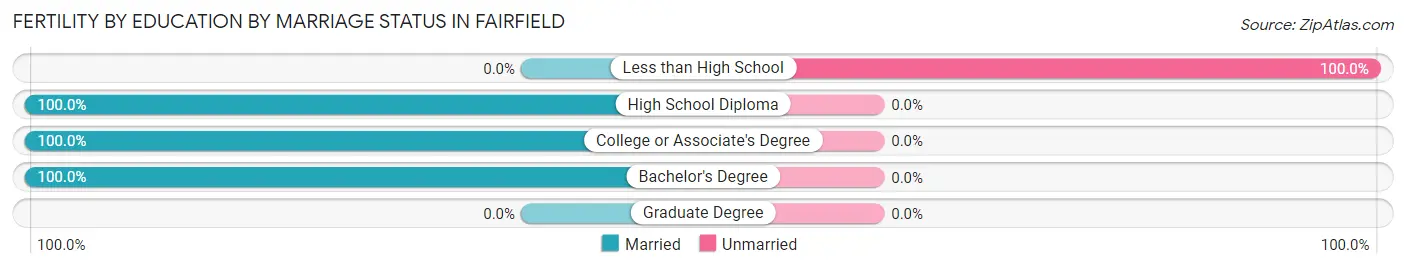
| Educational Attainment | Married | Unmarried |
| Less than High School | 0 (0.0%) | 31 (100.0%) |
| High School Diploma | 20 (100.0%) | 0 (0.0%) |
| College or Associate's Degree | 11 (100.0%) | 0 (0.0%) |
| Bachelor's Degree | 7 (100.0%) | 0 (0.0%) |
| Graduate Degree | 0 (0.0%) | 0 (0.0%) |
| Total | 38 (55.1%) | 31 (44.9%) |
Employment Characteristics in Fairfield
Employment by Class of Employer in Fairfield
Among the 1,227 employed individuals in Fairfield, private company employees (917 | 74.7%), unpaid family workers (108 | 8.8%), and self-employed (not incorporated) (105 | 8.6%) make up the most common classes of employment.
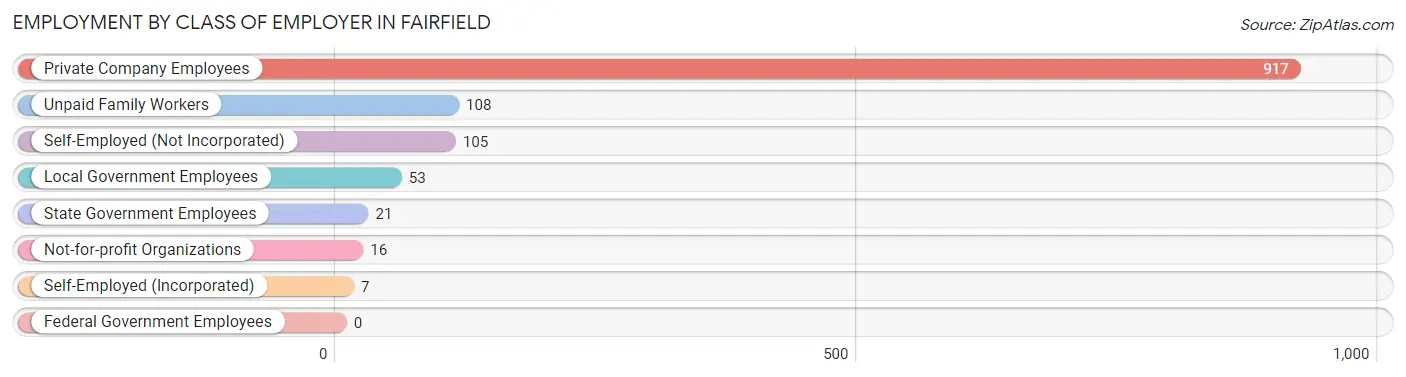
| Employer Class | # Employees | % Employees |
| Private Company Employees | 917 | 74.7% |
| Self-Employed (Incorporated) | 7 | 0.6% |
| Self-Employed (Not Incorporated) | 105 | 8.6% |
| Not-for-profit Organizations | 16 | 1.3% |
| Local Government Employees | 53 | 4.3% |
| State Government Employees | 21 | 1.7% |
| Federal Government Employees | 0 | 0.0% |
| Unpaid Family Workers | 108 | 8.8% |
| Total | 1,227 | 100.0% |
Employment Status by Age in Fairfield
According to the labor force statistics for Fairfield, out of the total population over 16 years of age (2,275), 56.5% or 1,285 individuals are in the labor force, with 3.6% or 46 of them unemployed. The age group with the highest labor force participation rate is 20 to 24 years, with 89.7% or 245 individuals in the labor force. Within the labor force, the 25 to 29 years age range has the highest percentage of unemployed individuals, with 25.6% or 33 of them being unemployed.
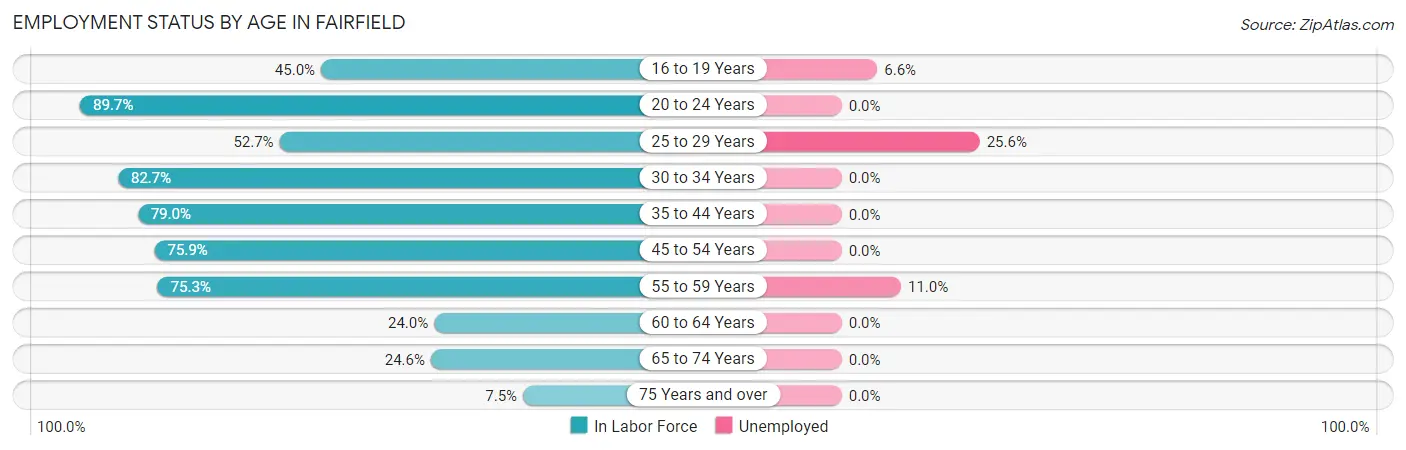
| Age Bracket | In Labor Force | Unemployed |
| 16 to 19 Years | 76 (45.0%) | 5 (6.6%) |
| 20 to 24 Years | 245 (89.7%) | 0 (0.0%) |
| 25 to 29 Years | 129 (52.7%) | 33 (25.6%) |
| 30 to 34 Years | 167 (82.7%) | 0 (0.0%) |
| 35 to 44 Years | 259 (79.0%) | 0 (0.0%) |
| 45 to 54 Years | 224 (75.9%) | 0 (0.0%) |
| 55 to 59 Years | 73 (75.3%) | 8 (11.0%) |
| 60 to 64 Years | 41 (24.0%) | 0 (0.0%) |
| 65 to 74 Years | 50 (24.6%) | 0 (0.0%) |
| 75 Years and over | 22 (7.5%) | 0 (0.0%) |
| Total | 1,285 (56.5%) | 46 (3.6%) |
Employment Status by Educational Attainment in Fairfield
According to labor force statistics for Fairfield, 66.7% of individuals (892) out of the total population between 25 and 64 years of age (1,338) are in the labor force, with 4.6% or 41 of them being unemployed. The group with the highest labor force participation rate are those with the educational attainment of college / associate degree, with 73.8% or 253 individuals in the labor force. Within the labor force, individuals with high school diploma education have the highest percentage of unemployment, with 16.3% or 41 of them being unemployed.
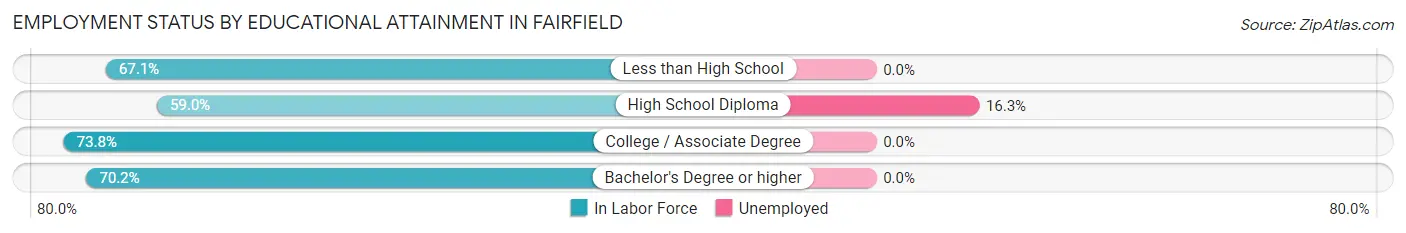
| Educational Attainment | In Labor Force | Unemployed |
| Less than High School | 230 (67.1%) | 0 (0.0%) |
| High School Diploma | 252 (59.0%) | 70 (16.3%) |
| College / Associate Degree | 253 (73.8%) | 0 (0.0%) |
| Bachelor's Degree or higher | 158 (70.2%) | 0 (0.0%) |
| Total | 892 (66.7%) | 62 (4.6%) |
Employment Occupations by Sex in Fairfield
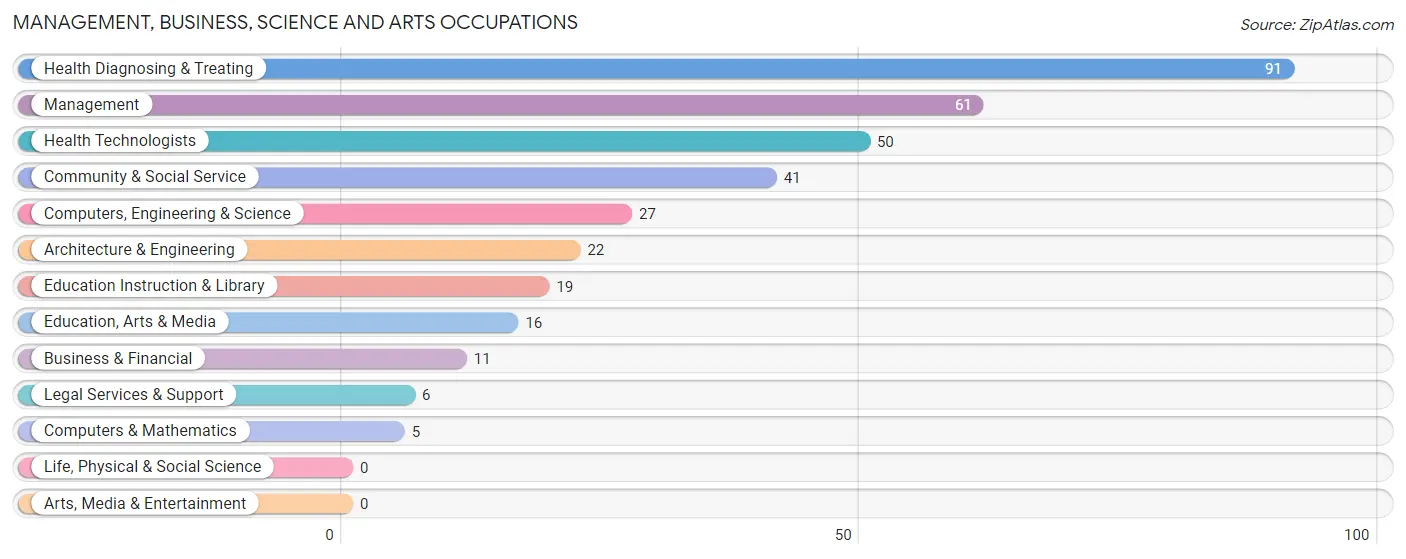
Management, Business, Science and Arts Occupations
The most common Management, Business, Science and Arts occupations in Fairfield are Health Diagnosing & Treating (91 | 7.3%), Management (61 | 4.9%), Health Technologists (50 | 4.0%), Community & Social Service (41 | 3.3%), and Computers, Engineering & Science (27 | 2.2%).
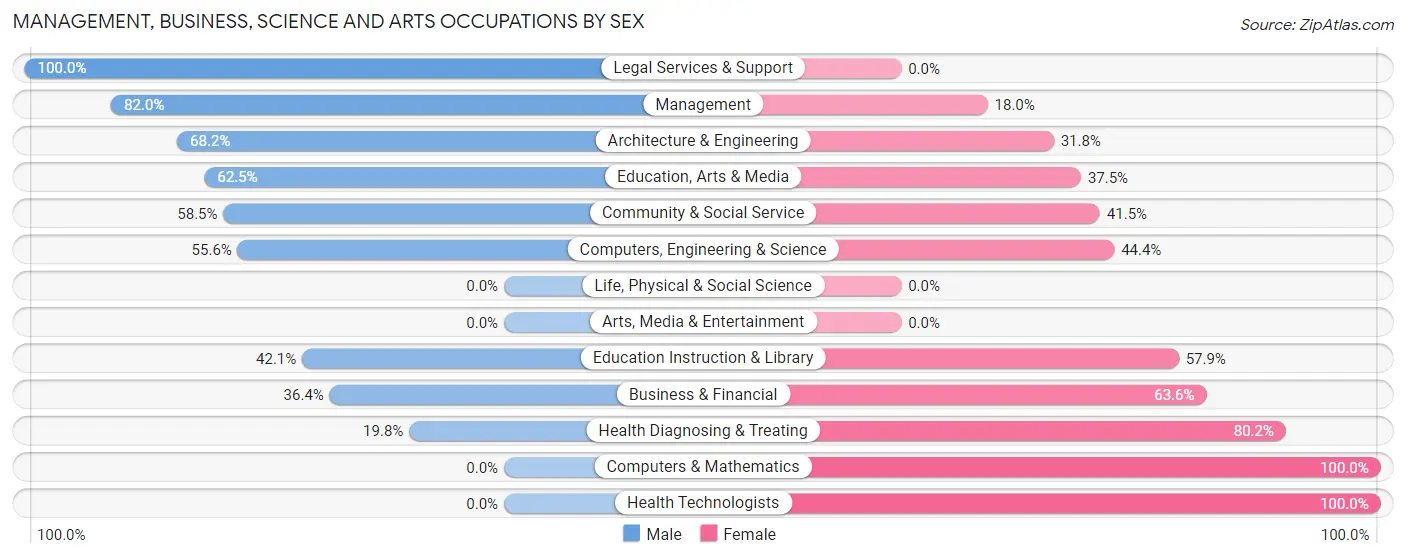
Management, Business, Science and Arts Occupations by Sex
Within the Management, Business, Science and Arts occupations in Fairfield, the most male-oriented occupations are Legal Services & Support (100.0%), Management (82.0%), and Architecture & Engineering (68.2%), while the most female-oriented occupations are Computers & Mathematics (100.0%), Health Technologists (100.0%), and Health Diagnosing & Treating (80.2%).
| Occupation | Male | Female |
| Management | 50 (82.0%) | 11 (18.0%) |
| Business & Financial | 4 (36.4%) | 7 (63.6%) |
| Computers, Engineering & Science | 15 (55.6%) | 12 (44.4%) |
| Computers & Mathematics | 0 (0.0%) | 5 (100.0%) |
| Architecture & Engineering | 15 (68.2%) | 7 (31.8%) |
| Life, Physical & Social Science | 0 (0.0%) | 0 (0.0%) |
| Community & Social Service | 24 (58.5%) | 17 (41.5%) |
| Education, Arts & Media | 10 (62.5%) | 6 (37.5%) |
| Legal Services & Support | 6 (100.0%) | 0 (0.0%) |
| Education Instruction & Library | 8 (42.1%) | 11 (57.9%) |
| Arts, Media & Entertainment | 0 (0.0%) | 0 (0.0%) |
| Health Diagnosing & Treating | 18 (19.8%) | 73 (80.2%) |
| Health Technologists | 0 (0.0%) | 50 (100.0%) |
| Total (Category) | 111 (48.0%) | 120 (51.9%) |
| Total (Overall) | 594 (47.9%) | 646 (52.1%) |
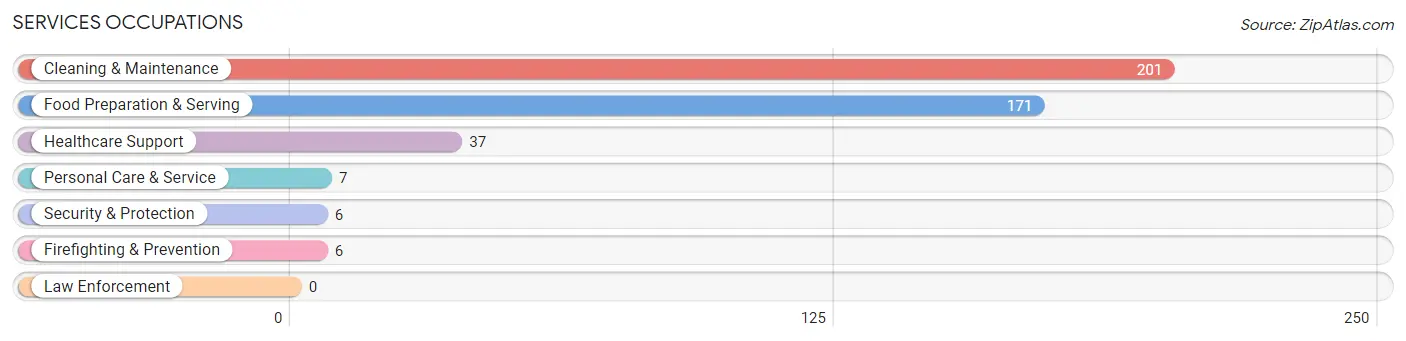
Services Occupations
The most common Services occupations in Fairfield are Cleaning & Maintenance (201 | 16.2%), Food Preparation & Serving (171 | 13.8%), Healthcare Support (37 | 3.0%), Personal Care & Service (7 | 0.6%), and Security & Protection (6 | 0.5%).
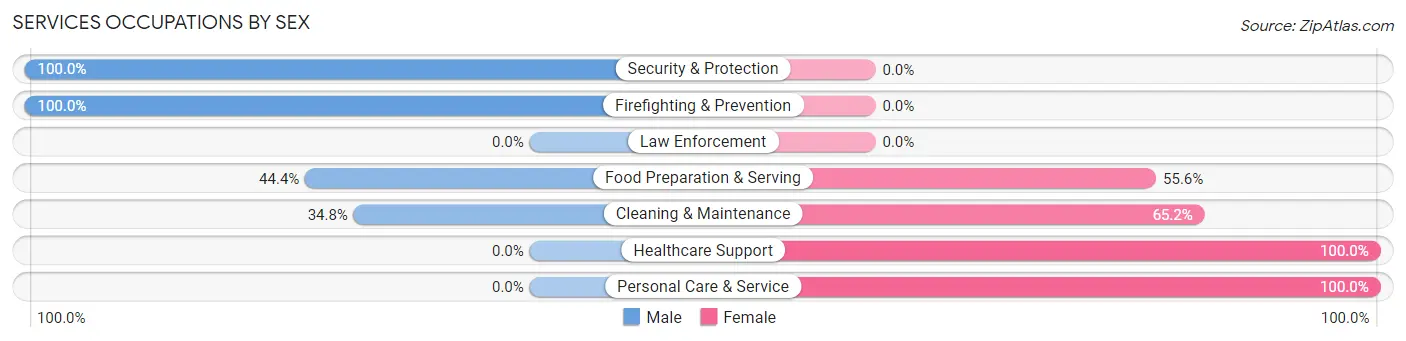
Services Occupations by Sex
Within the Services occupations in Fairfield, the most male-oriented occupations are Security & Protection (100.0%), Firefighting & Prevention (100.0%), and Food Preparation & Serving (44.4%), while the most female-oriented occupations are Healthcare Support (100.0%), Personal Care & Service (100.0%), and Cleaning & Maintenance (65.2%).
| Occupation | Male | Female |
| Healthcare Support | 0 (0.0%) | 37 (100.0%) |
| Security & Protection | 6 (100.0%) | 0 (0.0%) |
| Firefighting & Prevention | 6 (100.0%) | 0 (0.0%) |
| Law Enforcement | 0 (0.0%) | 0 (0.0%) |
| Food Preparation & Serving | 76 (44.4%) | 95 (55.6%) |
| Cleaning & Maintenance | 70 (34.8%) | 131 (65.2%) |
| Personal Care & Service | 0 (0.0%) | 7 (100.0%) |
| Total (Category) | 152 (36.0%) | 270 (64.0%) |
| Total (Overall) | 594 (47.9%) | 646 (52.1%) |
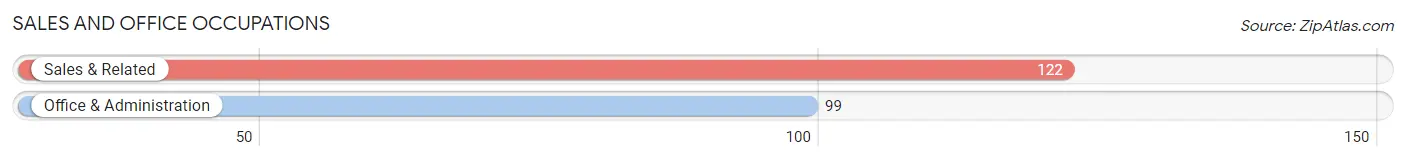
Sales and Office Occupations
The most common Sales and Office occupations in Fairfield are Sales & Related (122 | 9.8%), and Office & Administration (99 | 8.0%).
Sales and Office Occupations by Sex
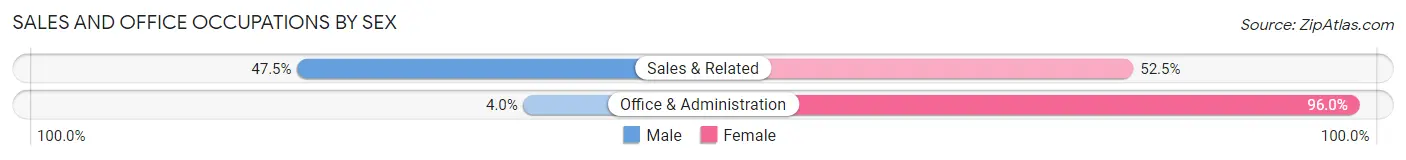
| Occupation | Male | Female |
| Sales & Related | 58 (47.5%) | 64 (52.5%) |
| Office & Administration | 4 (4.0%) | 95 (96.0%) |
| Total (Category) | 62 (28.1%) | 159 (72.0%) |
| Total (Overall) | 594 (47.9%) | 646 (52.1%) |
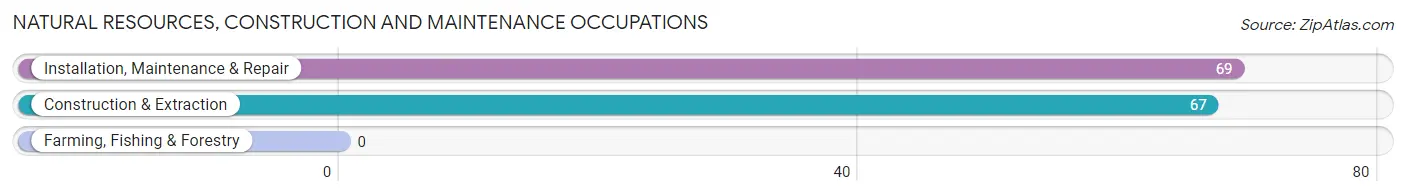
Natural Resources, Construction and Maintenance Occupations
The most common Natural Resources, Construction and Maintenance occupations in Fairfield are Installation, Maintenance & Repair (69 | 5.6%), and Construction & Extraction (67 | 5.4%).
Natural Resources, Construction and Maintenance Occupations by Sex
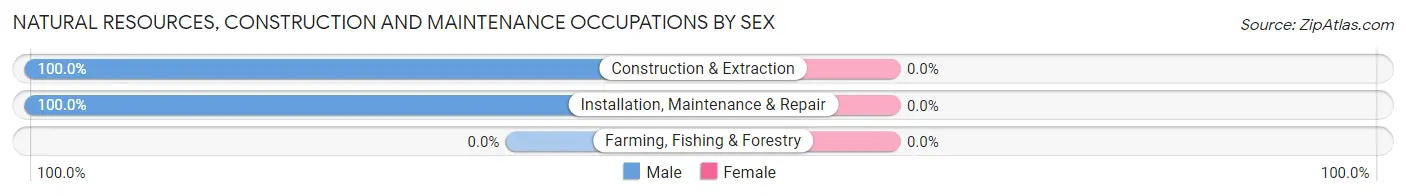
| Occupation | Male | Female |
| Farming, Fishing & Forestry | 0 (0.0%) | 0 (0.0%) |
| Construction & Extraction | 67 (100.0%) | 0 (0.0%) |
| Installation, Maintenance & Repair | 69 (100.0%) | 0 (0.0%) |
| Total (Category) | 136 (100.0%) | 0 (0.0%) |
| Total (Overall) | 594 (47.9%) | 646 (52.1%) |
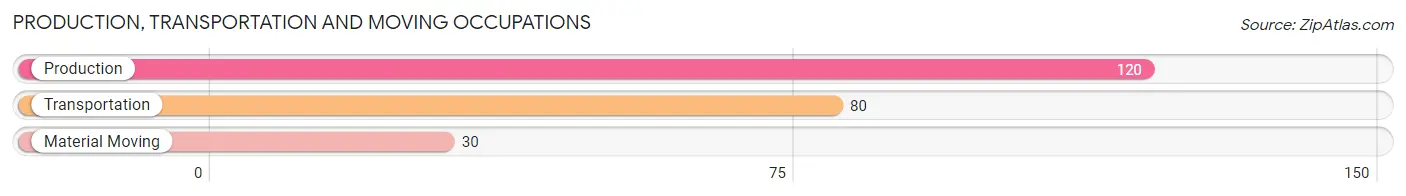
Production, Transportation and Moving Occupations
The most common Production, Transportation and Moving occupations in Fairfield are Production (120 | 9.7%), Transportation (80 | 6.5%), and Material Moving (30 | 2.4%).
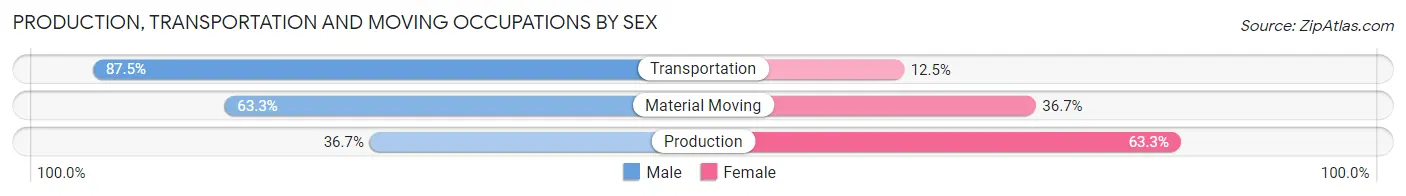
Production, Transportation and Moving Occupations by Sex
| Occupation | Male | Female |
| Production | 44 (36.7%) | 76 (63.3%) |
| Transportation | 70 (87.5%) | 10 (12.5%) |
| Material Moving | 19 (63.3%) | 11 (36.7%) |
| Total (Category) | 133 (57.8%) | 97 (42.2%) |
| Total (Overall) | 594 (47.9%) | 646 (52.1%) |
Employment Industries by Sex in Fairfield
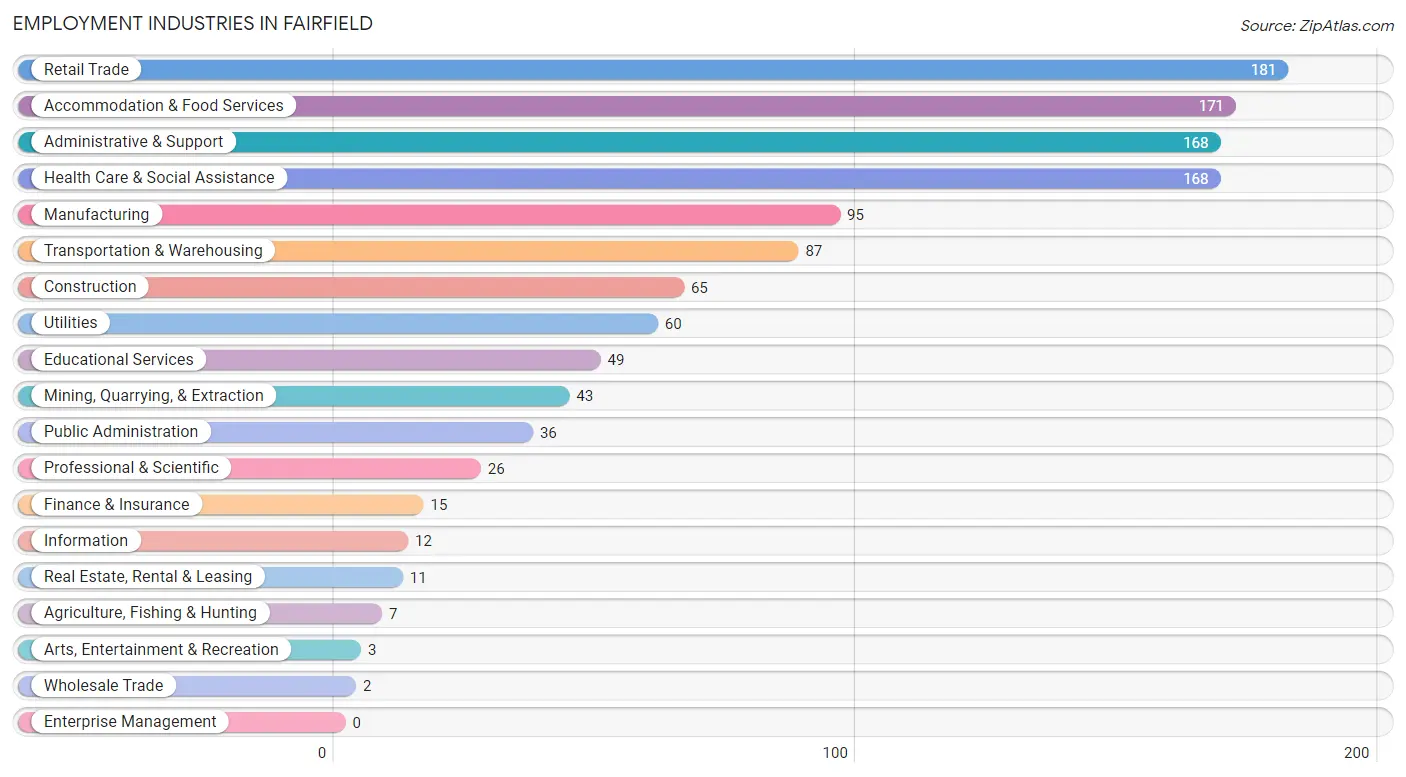
Employment Industries in Fairfield
The major employment industries in Fairfield include Retail Trade (181 | 14.6%), Accommodation & Food Services (171 | 13.8%), Administrative & Support (168 | 13.6%), Health Care & Social Assistance (168 | 13.6%), and Manufacturing (95 | 7.7%).
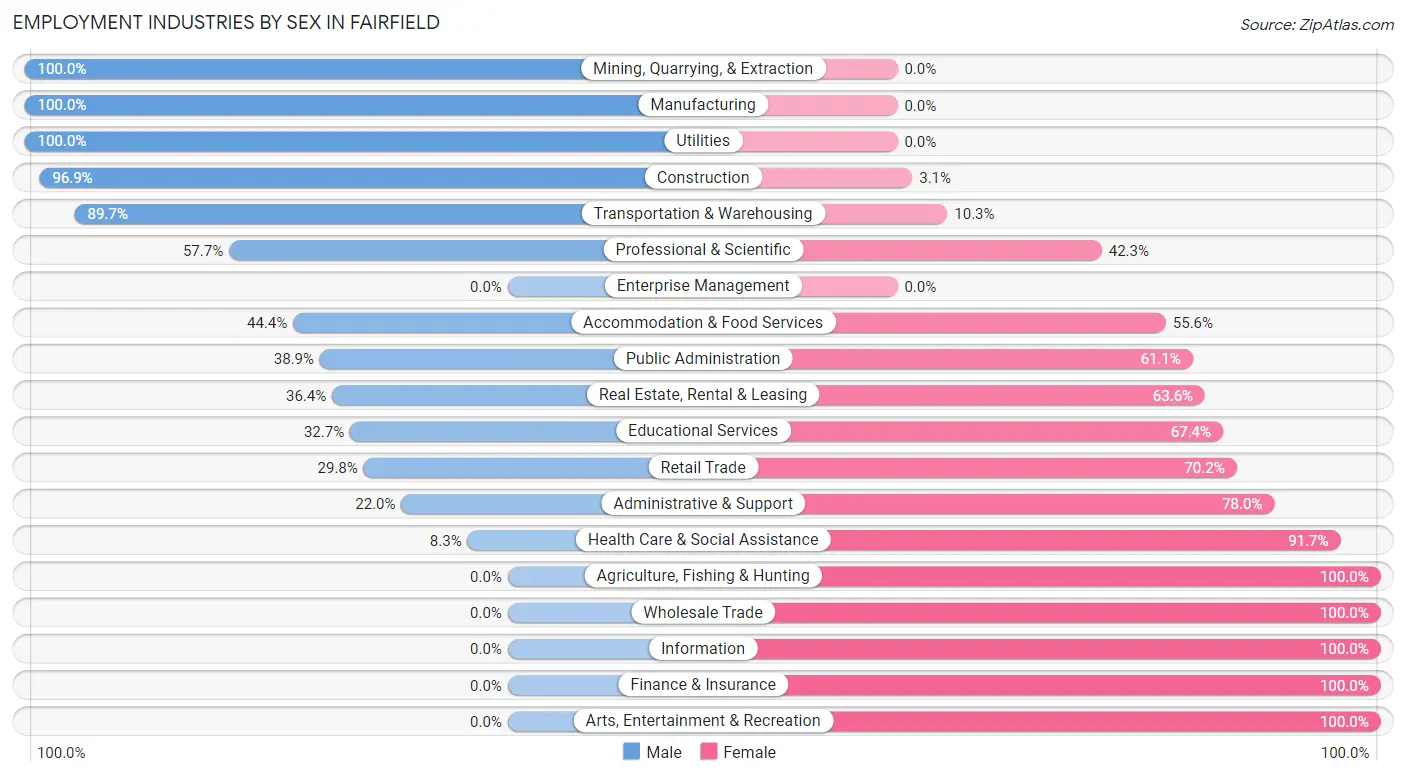
Employment Industries by Sex in Fairfield
The Fairfield industries that see more men than women are Mining, Quarrying, & Extraction (100.0%), Manufacturing (100.0%), and Utilities (100.0%), whereas the industries that tend to have a higher number of women are Agriculture, Fishing & Hunting (100.0%), Wholesale Trade (100.0%), and Information (100.0%).
| Industry | Male | Female |
| Agriculture, Fishing & Hunting | 0 (0.0%) | 7 (100.0%) |
| Mining, Quarrying, & Extraction | 43 (100.0%) | 0 (0.0%) |
| Construction | 63 (96.9%) | 2 (3.1%) |
| Manufacturing | 95 (100.0%) | 0 (0.0%) |
| Wholesale Trade | 0 (0.0%) | 2 (100.0%) |
| Retail Trade | 54 (29.8%) | 127 (70.2%) |
| Transportation & Warehousing | 78 (89.7%) | 9 (10.3%) |
| Utilities | 60 (100.0%) | 0 (0.0%) |
| Information | 0 (0.0%) | 12 (100.0%) |
| Finance & Insurance | 0 (0.0%) | 15 (100.0%) |
| Real Estate, Rental & Leasing | 4 (36.4%) | 7 (63.6%) |
| Professional & Scientific | 15 (57.7%) | 11 (42.3%) |
| Enterprise Management | 0 (0.0%) | 0 (0.0%) |
| Administrative & Support | 37 (22.0%) | 131 (78.0%) |
| Educational Services | 16 (32.7%) | 33 (67.3%) |
| Health Care & Social Assistance | 14 (8.3%) | 154 (91.7%) |
| Arts, Entertainment & Recreation | 0 (0.0%) | 3 (100.0%) |
| Accommodation & Food Services | 76 (44.4%) | 95 (55.6%) |
| Public Administration | 14 (38.9%) | 22 (61.1%) |
| Total | 594 (47.9%) | 646 (52.1%) |
Education in Fairfield
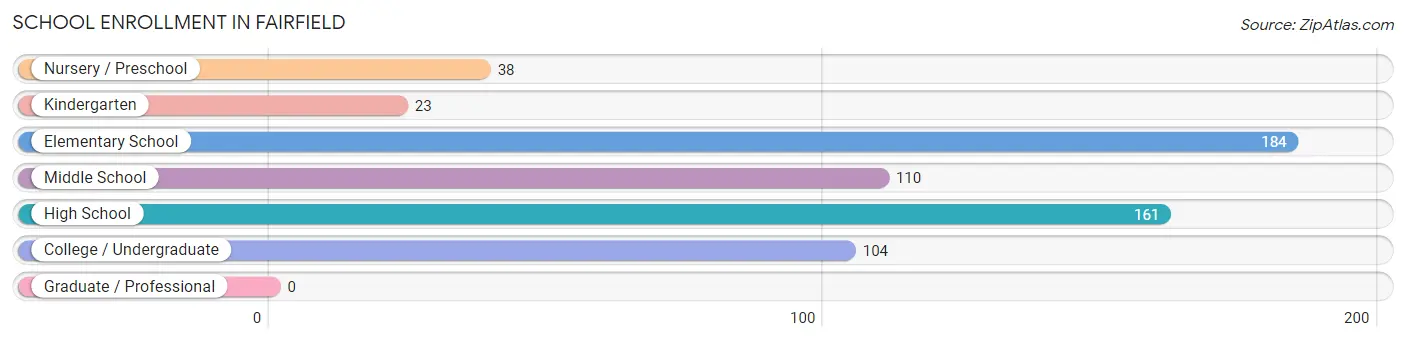
School Enrollment in Fairfield
The most common levels of schooling among the 620 students in Fairfield are elementary school (184 | 29.7%), high school (161 | 26.0%), and middle school (110 | 17.7%).
| School Level | # Students | % Students |
| Nursery / Preschool | 38 | 6.1% |
| Kindergarten | 23 | 3.7% |
| Elementary School | 184 | 29.7% |
| Middle School | 110 | 17.7% |
| High School | 161 | 26.0% |
| College / Undergraduate | 104 | 16.8% |
| Graduate / Professional | 0 | 0.0% |
| Total | 620 | 100.0% |
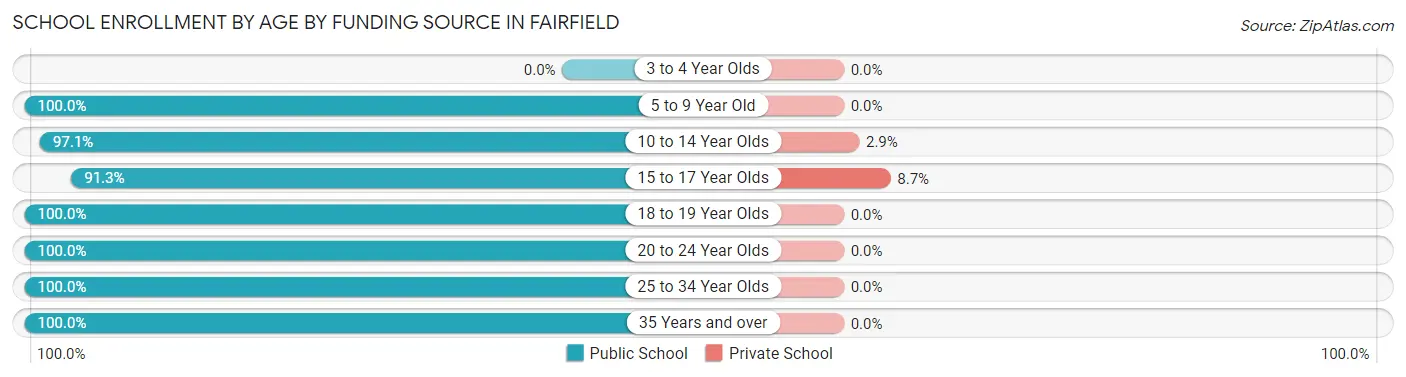
School Enrollment by Age by Funding Source in Fairfield
Out of a total of 620 students who are enrolled in schools in Fairfield, 16 (2.6%) attend a private institution, while the remaining 604 (97.4%) are enrolled in public schools. The age group of 15 to 17 year olds has the highest likelihood of being enrolled in private schools, with 12 (8.7% in the age bracket) enrolled. Conversely, the age group of 5 to 9 year old has the lowest likelihood of being enrolled in a private school, with 238 (100.0% in the age bracket) attending a public institution.
| Age Bracket | Public School | Private School |
| 3 to 4 Year Olds | 0 (0.0%) | 0 (0.0%) |
| 5 to 9 Year Old | 238 (100.0%) | 0 (0.0%) |
| 10 to 14 Year Olds | 136 (97.1%) | 4 (2.9%) |
| 15 to 17 Year Olds | 126 (91.3%) | 12 (8.7%) |
| 18 to 19 Year Olds | 8 (100.0%) | 0 (0.0%) |
| 20 to 24 Year Olds | 80 (100.0%) | 0 (0.0%) |
| 25 to 34 Year Olds | 4 (100.0%) | 0 (0.0%) |
| 35 Years and over | 12 (100.0%) | 0 (0.0%) |
| Total | 604 (97.4%) | 16 (2.6%) |
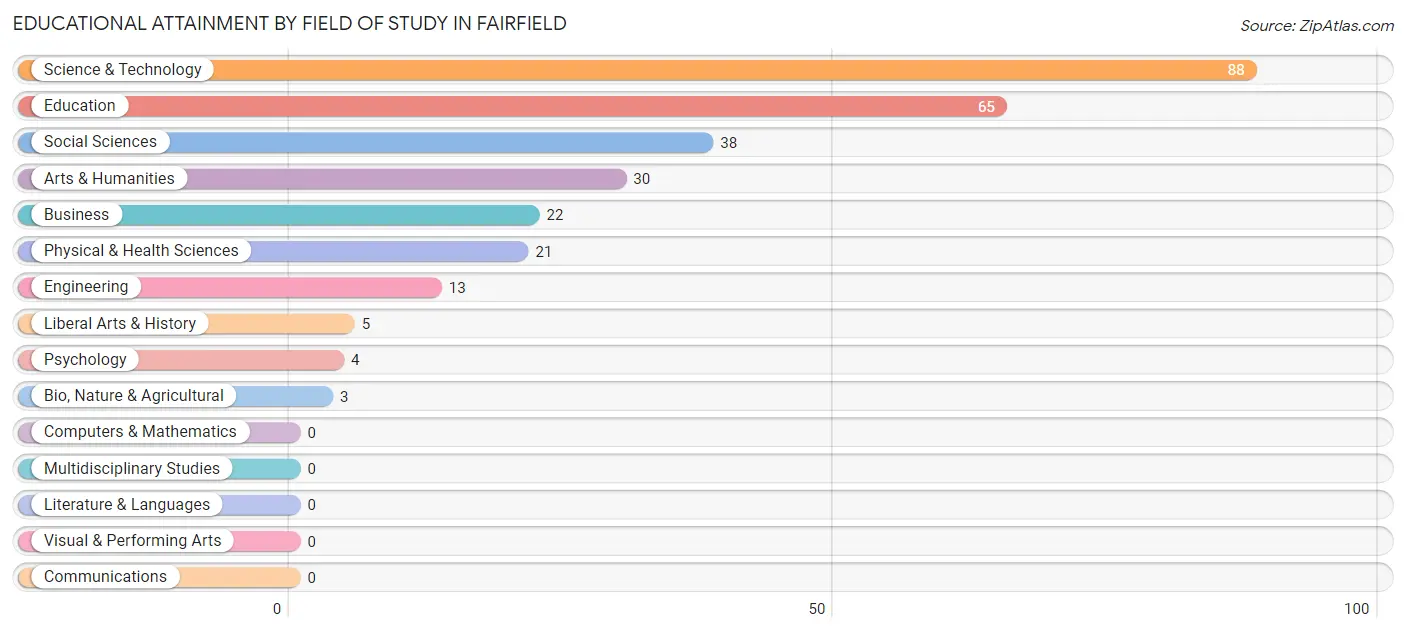
Educational Attainment by Field of Study in Fairfield
Science & technology (88 | 30.4%), education (65 | 22.5%), social sciences (38 | 13.2%), arts & humanities (30 | 10.4%), and business (22 | 7.6%) are the most common fields of study among 289 individuals in Fairfield who have obtained a bachelor's degree or higher.
| Field of Study | # Graduates | % Graduates |
| Computers & Mathematics | 0 | 0.0% |
| Bio, Nature & Agricultural | 3 | 1.0% |
| Physical & Health Sciences | 21 | 7.3% |
| Psychology | 4 | 1.4% |
| Social Sciences | 38 | 13.2% |
| Engineering | 13 | 4.5% |
| Multidisciplinary Studies | 0 | 0.0% |
| Science & Technology | 88 | 30.4% |
| Business | 22 | 7.6% |
| Education | 65 | 22.5% |
| Literature & Languages | 0 | 0.0% |
| Liberal Arts & History | 5 | 1.7% |
| Visual & Performing Arts | 0 | 0.0% |
| Communications | 0 | 0.0% |
| Arts & Humanities | 30 | 10.4% |
| Total | 289 | 100.0% |
Transportation & Commute in Fairfield
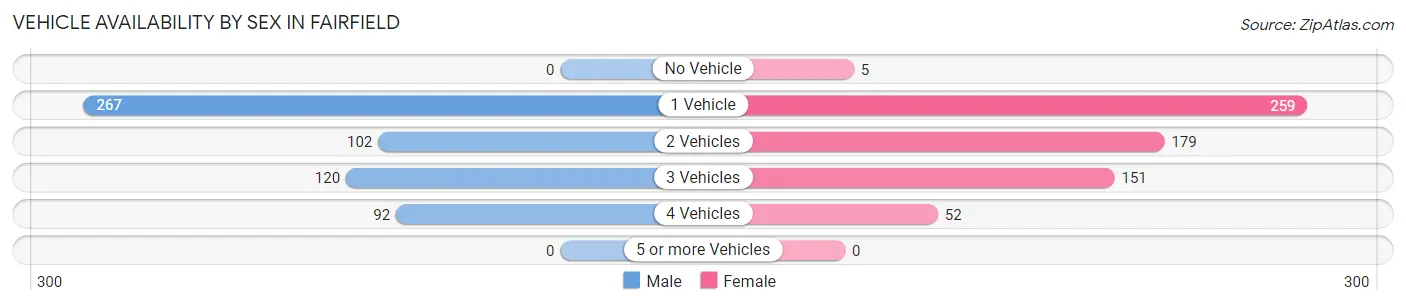
Vehicle Availability by Sex in Fairfield
The most prevalent vehicle ownership categories in Fairfield are males with 1 vehicle (267, accounting for 46.0%) and females with 1 vehicle (259, making up 41.3%).
| Vehicles Available | Male | Female |
| No Vehicle | 0 (0.0%) | 5 (0.8%) |
| 1 Vehicle | 267 (46.0%) | 259 (40.1%) |
| 2 Vehicles | 102 (17.6%) | 179 (27.7%) |
| 3 Vehicles | 120 (20.6%) | 151 (23.4%) |
| 4 Vehicles | 92 (15.8%) | 52 (8.1%) |
| 5 or more Vehicles | 0 (0.0%) | 0 (0.0%) |
| Total | 581 (100.0%) | 646 (100.0%) |
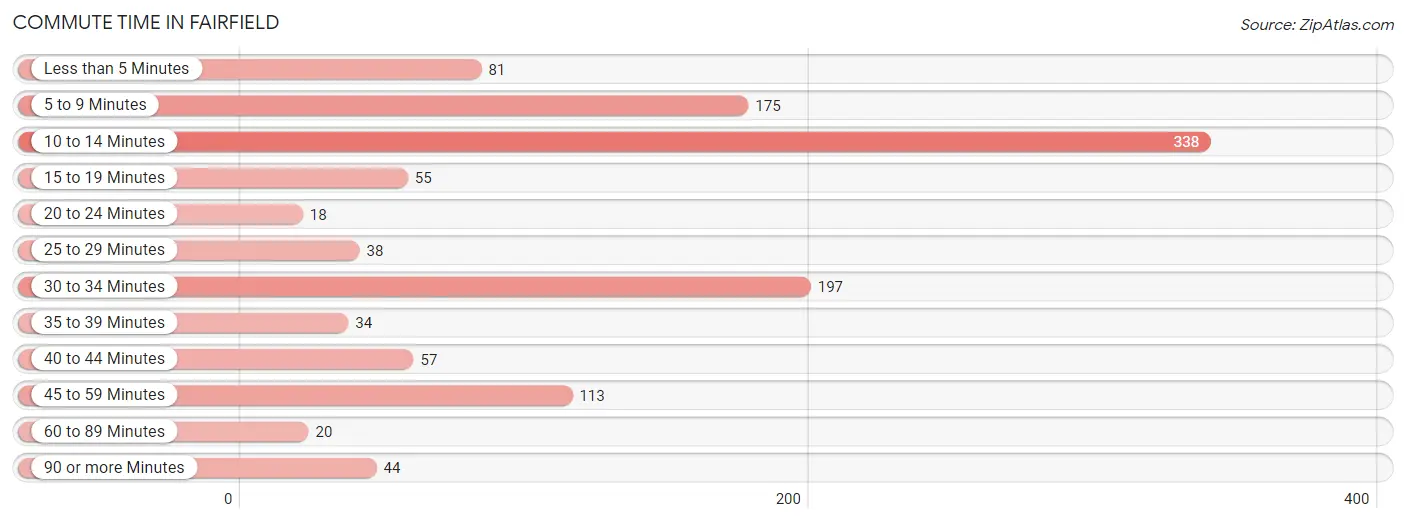
Commute Time in Fairfield
The most frequently occuring commute durations in Fairfield are 10 to 14 minutes (338 commuters, 28.9%), 30 to 34 minutes (197 commuters, 16.8%), and 5 to 9 minutes (175 commuters, 15.0%).
| Commute Time | # Commuters | % Commuters |
| Less than 5 Minutes | 81 | 6.9% |
| 5 to 9 Minutes | 175 | 15.0% |
| 10 to 14 Minutes | 338 | 28.9% |
| 15 to 19 Minutes | 55 | 4.7% |
| 20 to 24 Minutes | 18 | 1.5% |
| 25 to 29 Minutes | 38 | 3.3% |
| 30 to 34 Minutes | 197 | 16.8% |
| 35 to 39 Minutes | 34 | 2.9% |
| 40 to 44 Minutes | 57 | 4.9% |
| 45 to 59 Minutes | 113 | 9.7% |
| 60 to 89 Minutes | 20 | 1.7% |
| 90 or more Minutes | 44 | 3.8% |
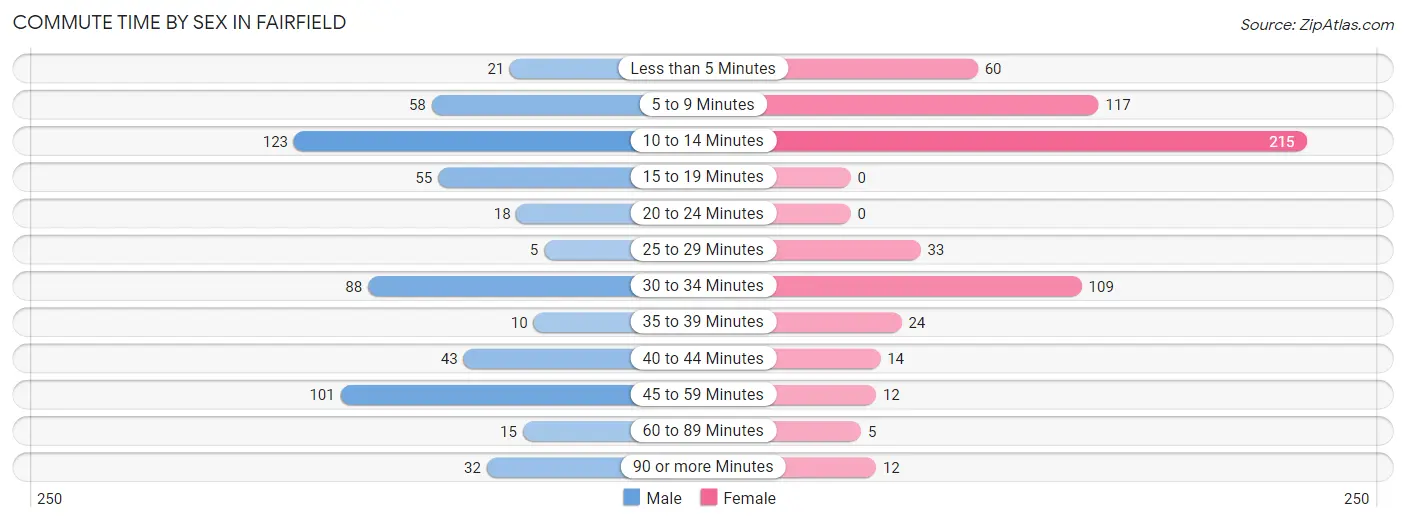
Commute Time by Sex in Fairfield
The most common commute times in Fairfield are 10 to 14 minutes (123 commuters, 21.6%) for males and 10 to 14 minutes (215 commuters, 35.8%) for females.
| Commute Time | Male | Female |
| Less than 5 Minutes | 21 (3.7%) | 60 (10.0%) |
| 5 to 9 Minutes | 58 (10.2%) | 117 (19.5%) |
| 10 to 14 Minutes | 123 (21.6%) | 215 (35.8%) |
| 15 to 19 Minutes | 55 (9.7%) | 0 (0.0%) |
| 20 to 24 Minutes | 18 (3.2%) | 0 (0.0%) |
| 25 to 29 Minutes | 5 (0.9%) | 33 (5.5%) |
| 30 to 34 Minutes | 88 (15.5%) | 109 (18.1%) |
| 35 to 39 Minutes | 10 (1.8%) | 24 (4.0%) |
| 40 to 44 Minutes | 43 (7.6%) | 14 (2.3%) |
| 45 to 59 Minutes | 101 (17.7%) | 12 (2.0%) |
| 60 to 89 Minutes | 15 (2.6%) | 5 (0.8%) |
| 90 or more Minutes | 32 (5.6%) | 12 (2.0%) |
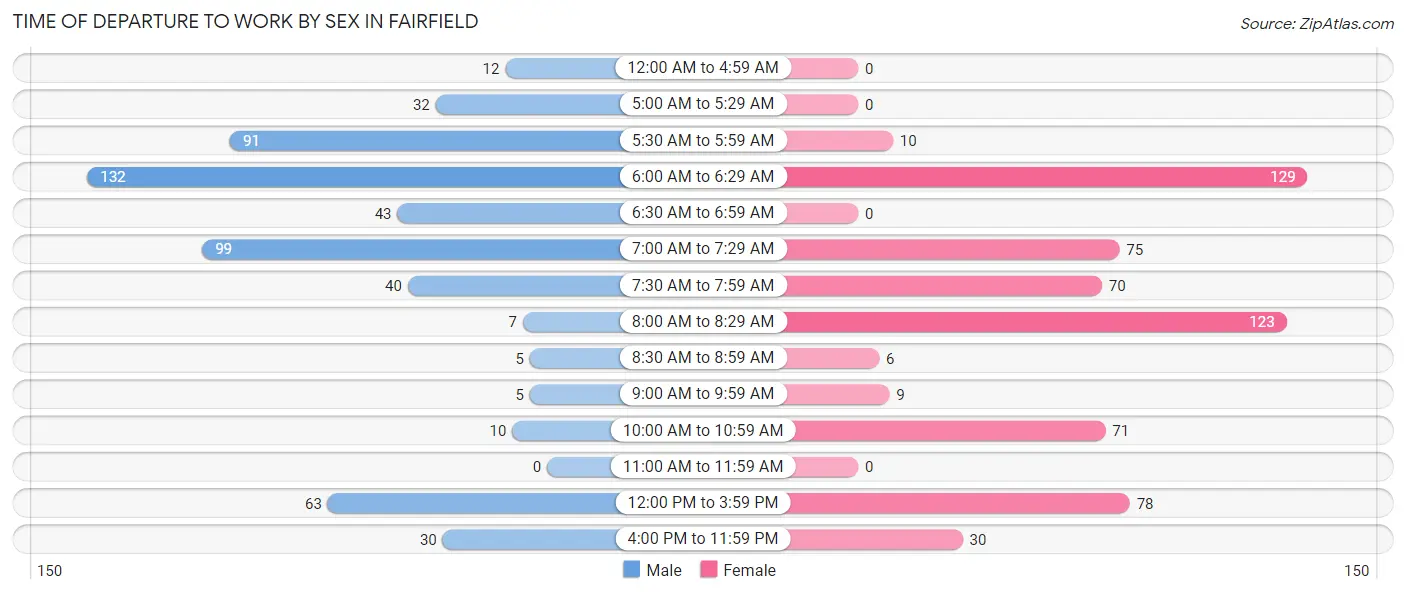
Time of Departure to Work by Sex in Fairfield
The most frequent times of departure to work in Fairfield are 6:00 AM to 6:29 AM (132, 23.2%) for males and 6:00 AM to 6:29 AM (129, 21.5%) for females.
| Time of Departure | Male | Female |
| 12:00 AM to 4:59 AM | 12 (2.1%) | 0 (0.0%) |
| 5:00 AM to 5:29 AM | 32 (5.6%) | 0 (0.0%) |
| 5:30 AM to 5:59 AM | 91 (16.0%) | 10 (1.7%) |
| 6:00 AM to 6:29 AM | 132 (23.2%) | 129 (21.5%) |
| 6:30 AM to 6:59 AM | 43 (7.6%) | 0 (0.0%) |
| 7:00 AM to 7:29 AM | 99 (17.4%) | 75 (12.5%) |
| 7:30 AM to 7:59 AM | 40 (7.0%) | 70 (11.7%) |
| 8:00 AM to 8:29 AM | 7 (1.2%) | 123 (20.5%) |
| 8:30 AM to 8:59 AM | 5 (0.9%) | 6 (1.0%) |
| 9:00 AM to 9:59 AM | 5 (0.9%) | 9 (1.5%) |
| 10:00 AM to 10:59 AM | 10 (1.8%) | 71 (11.8%) |
| 11:00 AM to 11:59 AM | 0 (0.0%) | 0 (0.0%) |
| 12:00 PM to 3:59 PM | 63 (11.1%) | 78 (13.0%) |
| 4:00 PM to 11:59 PM | 30 (5.3%) | 30 (5.0%) |
| Total | 569 (100.0%) | 601 (100.0%) |
Housing Occupancy in Fairfield
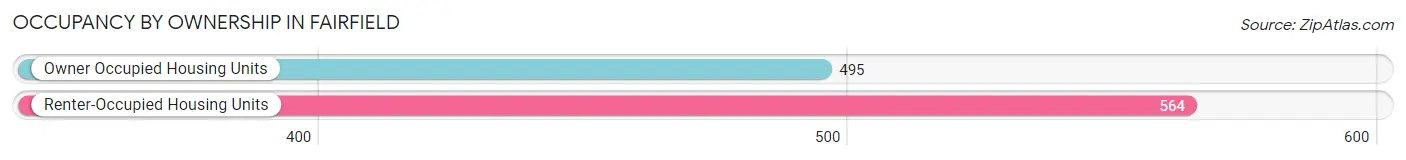
Occupancy by Ownership in Fairfield
Of the total 1,059 dwellings in Fairfield, owner-occupied units account for 495 (46.7%), while renter-occupied units make up 564 (53.3%).
| Occupancy | # Housing Units | % Housing Units |
| Owner Occupied Housing Units | 495 | 46.7% |
| Renter-Occupied Housing Units | 564 | 53.3% |
| Total Occupied Housing Units | 1,059 | 100.0% |
Occupancy by Household Size in Fairfield
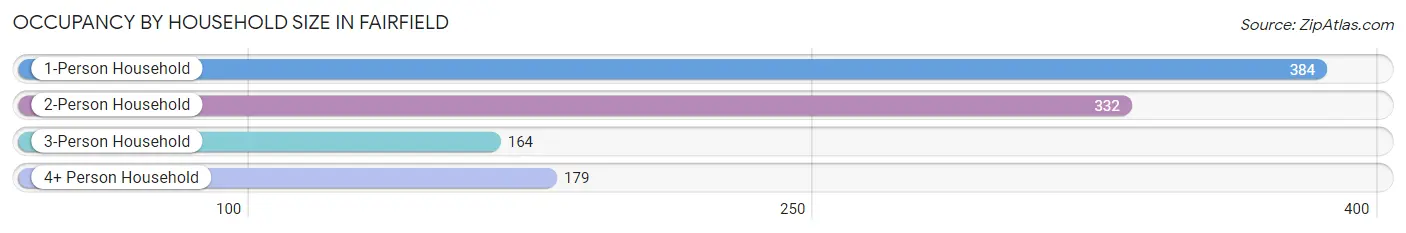
| Household Size | # Housing Units | % Housing Units |
| 1-Person Household | 384 | 36.3% |
| 2-Person Household | 332 | 31.4% |
| 3-Person Household | 164 | 15.5% |
| 4+ Person Household | 179 | 16.9% |
| Total Housing Units | 1,059 | 100.0% |
Occupancy by Ownership by Household Size in Fairfield
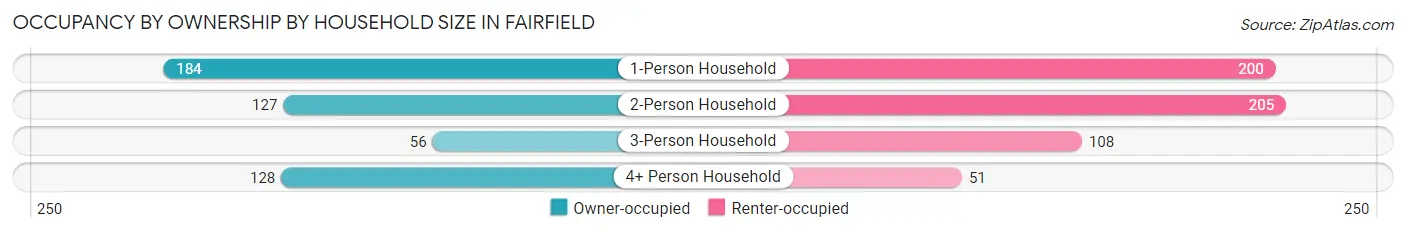
| Household Size | Owner-occupied | Renter-occupied |
| 1-Person Household | 184 (47.9%) | 200 (52.1%) |
| 2-Person Household | 127 (38.3%) | 205 (61.8%) |
| 3-Person Household | 56 (34.2%) | 108 (65.8%) |
| 4+ Person Household | 128 (71.5%) | 51 (28.5%) |
| Total Housing Units | 495 (46.7%) | 564 (53.3%) |
Occupancy by Educational Attainment in Fairfield
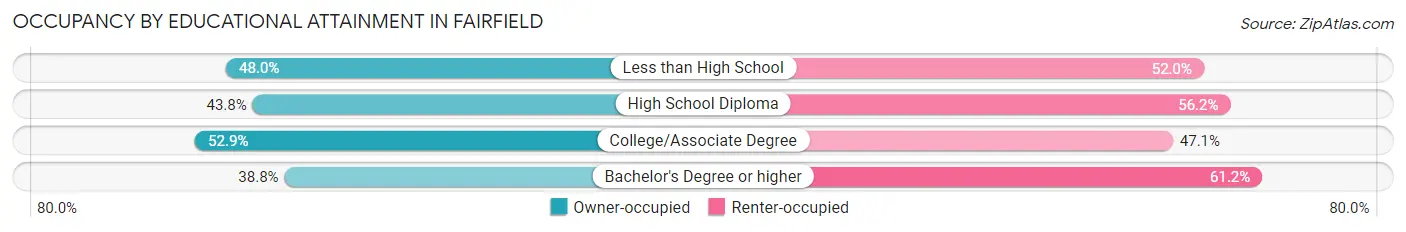
| Household Size | Owner-occupied | Renter-occupied |
| Less than High School | 86 (48.0%) | 93 (52.0%) |
| High School Diploma | 128 (43.8%) | 164 (56.2%) |
| College/Associate Degree | 198 (52.9%) | 176 (47.1%) |
| Bachelor's Degree or higher | 83 (38.8%) | 131 (61.2%) |
Occupancy by Age of Householder in Fairfield
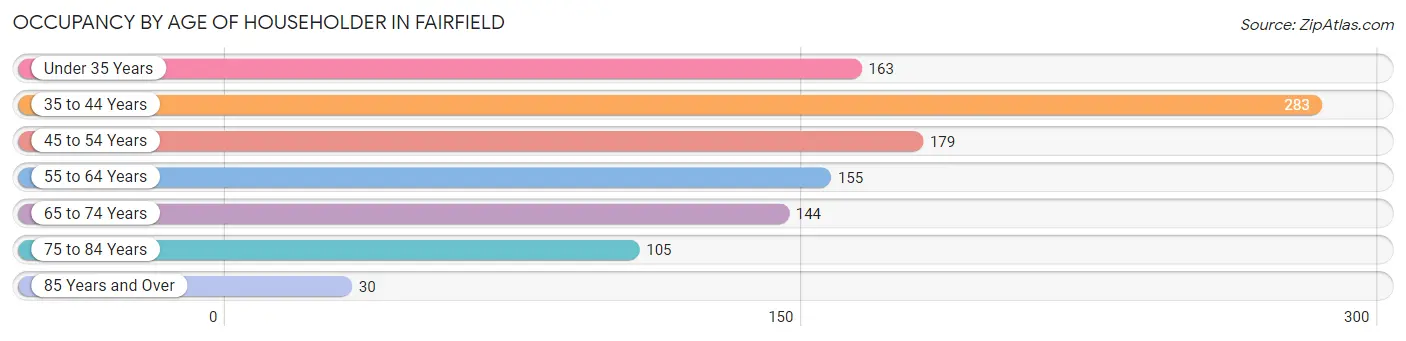
| Age Bracket | # Households | % Households |
| Under 35 Years | 163 | 15.4% |
| 35 to 44 Years | 283 | 26.7% |
| 45 to 54 Years | 179 | 16.9% |
| 55 to 64 Years | 155 | 14.6% |
| 65 to 74 Years | 144 | 13.6% |
| 75 to 84 Years | 105 | 9.9% |
| 85 Years and Over | 30 | 2.8% |
| Total | 1,059 | 100.0% |
Housing Finances in Fairfield
Median Income by Occupancy in Fairfield
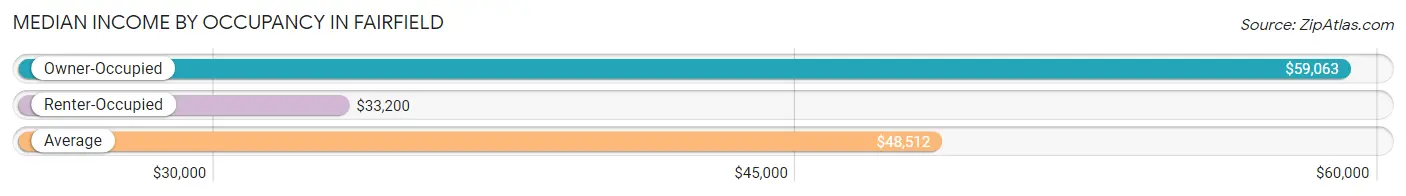
| Occupancy Type | # Households | Median Income |
| Owner-Occupied | 495 (46.7%) | $59,063 |
| Renter-Occupied | 564 (53.3%) | $33,200 |
| Average | 1,059 (100.0%) | $48,512 |
Occupancy by Householder Income Bracket in Fairfield
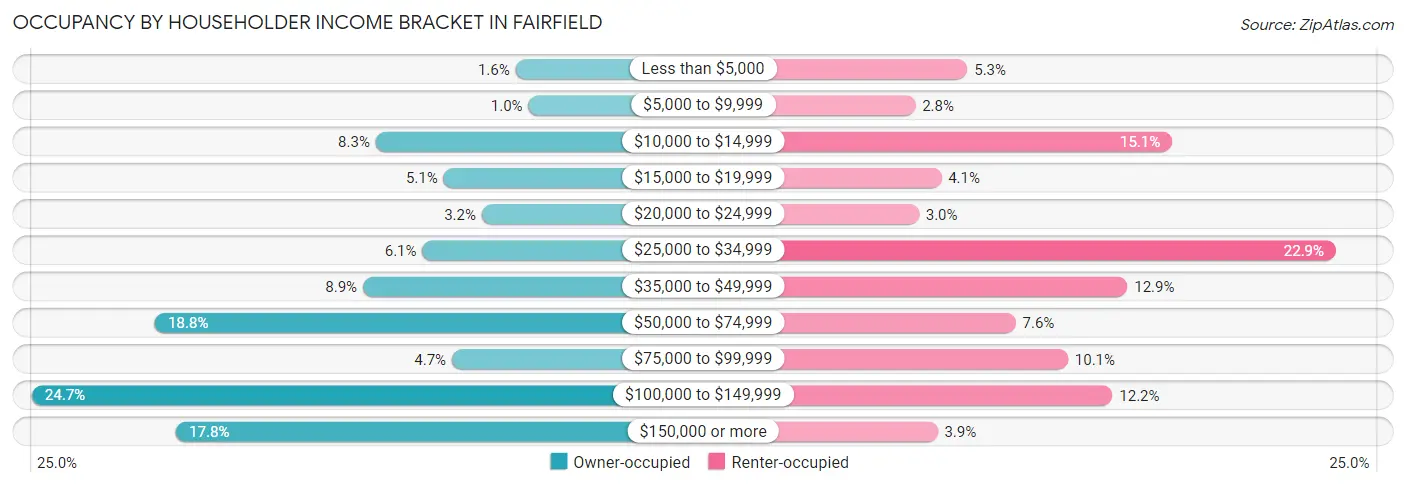
| Income Bracket | Owner-occupied | Renter-occupied |
| Less than $5,000 | 8 (1.6%) | 30 (5.3%) |
| $5,000 to $9,999 | 5 (1.0%) | 16 (2.8%) |
| $10,000 to $14,999 | 41 (8.3%) | 85 (15.1%) |
| $15,000 to $19,999 | 25 (5.1%) | 23 (4.1%) |
| $20,000 to $24,999 | 16 (3.2%) | 17 (3.0%) |
| $25,000 to $34,999 | 30 (6.1%) | 129 (22.9%) |
| $35,000 to $49,999 | 44 (8.9%) | 73 (12.9%) |
| $50,000 to $74,999 | 93 (18.8%) | 43 (7.6%) |
| $75,000 to $99,999 | 23 (4.6%) | 57 (10.1%) |
| $100,000 to $149,999 | 122 (24.6%) | 69 (12.2%) |
| $150,000 or more | 88 (17.8%) | 22 (3.9%) |
| Total | 495 (100.0%) | 564 (100.0%) |
Monthly Housing Cost Tiers in Fairfield
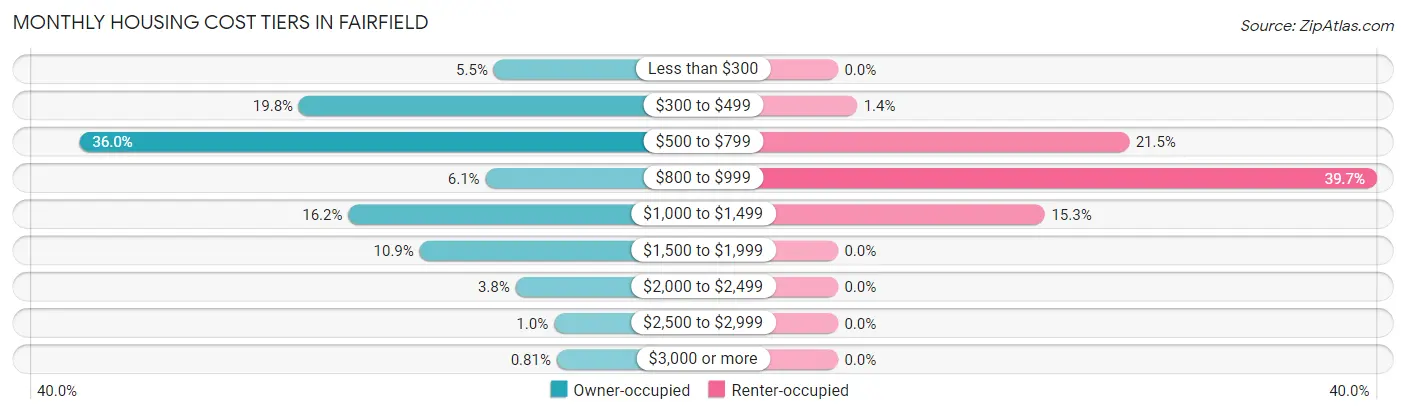
| Monthly Cost | Owner-occupied | Renter-occupied |
| Less than $300 | 27 (5.4%) | 0 (0.0%) |
| $300 to $499 | 98 (19.8%) | 8 (1.4%) |
| $500 to $799 | 178 (36.0%) | 121 (21.4%) |
| $800 to $999 | 30 (6.1%) | 224 (39.7%) |
| $1,000 to $1,499 | 80 (16.2%) | 86 (15.2%) |
| $1,500 to $1,999 | 54 (10.9%) | 0 (0.0%) |
| $2,000 to $2,499 | 19 (3.8%) | 0 (0.0%) |
| $2,500 to $2,999 | 5 (1.0%) | 0 (0.0%) |
| $3,000 or more | 4 (0.8%) | 0 (0.0%) |
| Total | 495 (100.0%) | 564 (100.0%) |
Physical Housing Characteristics in Fairfield
Housing Structures in Fairfield
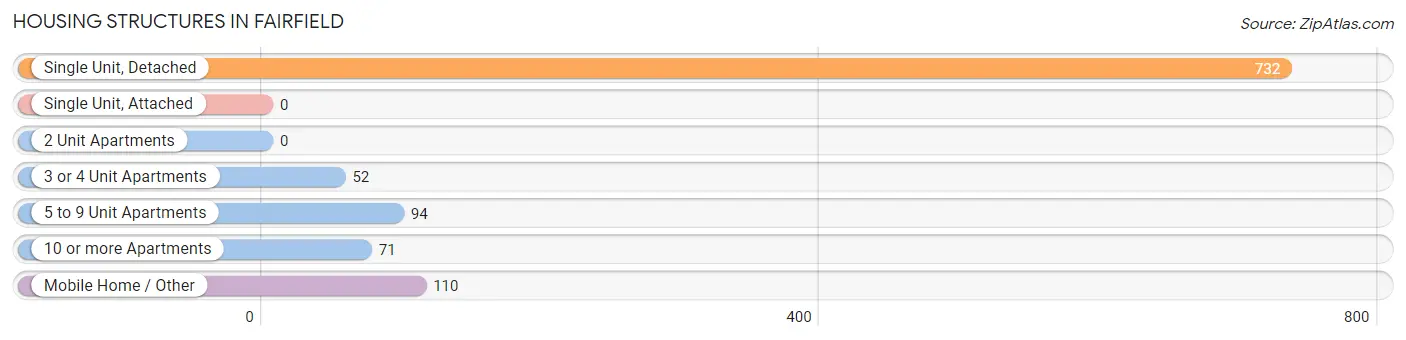
| Structure Type | # Housing Units | % Housing Units |
| Single Unit, Detached | 732 | 69.1% |
| Single Unit, Attached | 0 | 0.0% |
| 2 Unit Apartments | 0 | 0.0% |
| 3 or 4 Unit Apartments | 52 | 4.9% |
| 5 to 9 Unit Apartments | 94 | 8.9% |
| 10 or more Apartments | 71 | 6.7% |
| Mobile Home / Other | 110 | 10.4% |
| Total | 1,059 | 100.0% |
Housing Structures by Occupancy in Fairfield
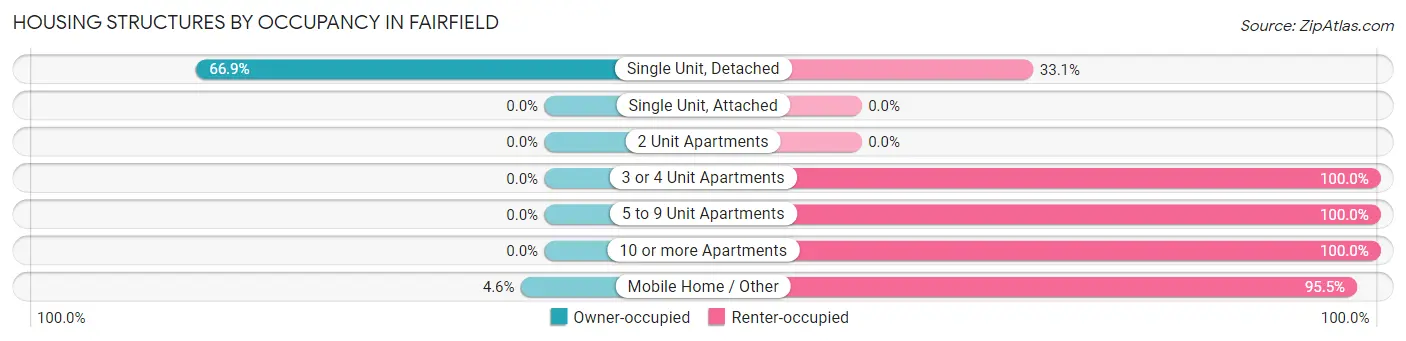
| Structure Type | Owner-occupied | Renter-occupied |
| Single Unit, Detached | 490 (66.9%) | 242 (33.1%) |
| Single Unit, Attached | 0 (0.0%) | 0 (0.0%) |
| 2 Unit Apartments | 0 (0.0%) | 0 (0.0%) |
| 3 or 4 Unit Apartments | 0 (0.0%) | 52 (100.0%) |
| 5 to 9 Unit Apartments | 0 (0.0%) | 94 (100.0%) |
| 10 or more Apartments | 0 (0.0%) | 71 (100.0%) |
| Mobile Home / Other | 5 (4.5%) | 105 (95.5%) |
| Total | 495 (46.7%) | 564 (53.3%) |
Housing Structures by Number of Rooms in Fairfield
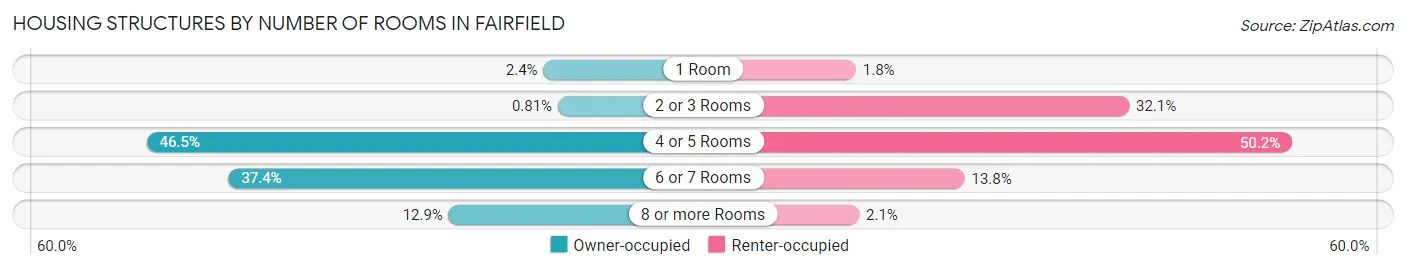
| Number of Rooms | Owner-occupied | Renter-occupied |
| 1 Room | 12 (2.4%) | 10 (1.8%) |
| 2 or 3 Rooms | 4 (0.8%) | 181 (32.1%) |
| 4 or 5 Rooms | 230 (46.5%) | 283 (50.2%) |
| 6 or 7 Rooms | 185 (37.4%) | 78 (13.8%) |
| 8 or more Rooms | 64 (12.9%) | 12 (2.1%) |
| Total | 495 (100.0%) | 564 (100.0%) |
Housing Structure by Heating Type in Fairfield
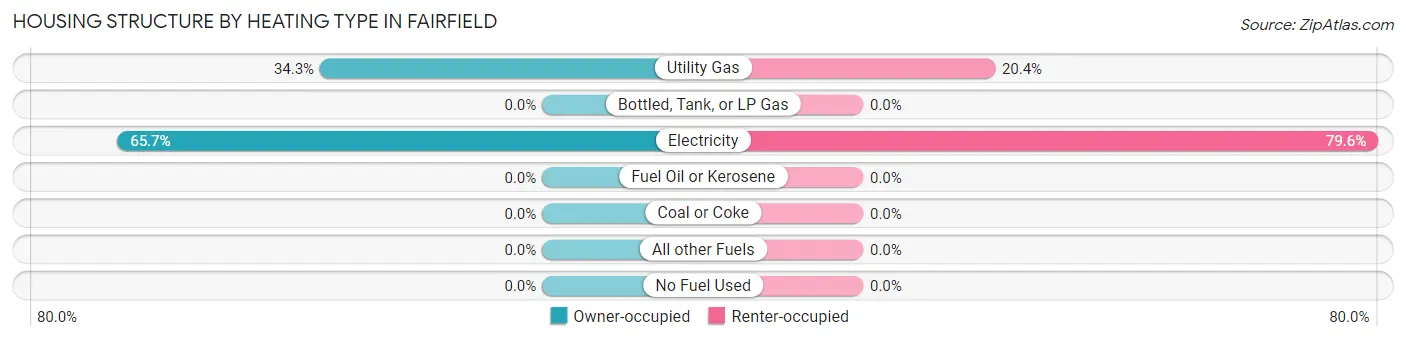
| Heating Type | Owner-occupied | Renter-occupied |
| Utility Gas | 170 (34.3%) | 115 (20.4%) |
| Bottled, Tank, or LP Gas | 0 (0.0%) | 0 (0.0%) |
| Electricity | 325 (65.7%) | 449 (79.6%) |
| Fuel Oil or Kerosene | 0 (0.0%) | 0 (0.0%) |
| Coal or Coke | 0 (0.0%) | 0 (0.0%) |
| All other Fuels | 0 (0.0%) | 0 (0.0%) |
| No Fuel Used | 0 (0.0%) | 0 (0.0%) |
| Total | 495 (100.0%) | 564 (100.0%) |
Household Vehicle Usage in Fairfield
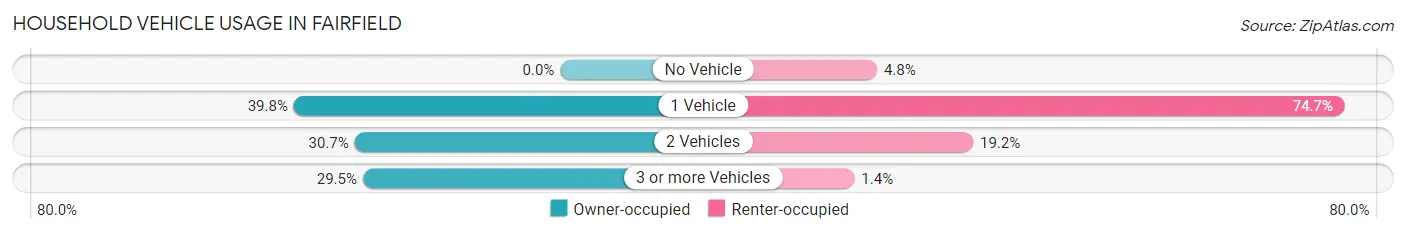
| Vehicles per Household | Owner-occupied | Renter-occupied |
| No Vehicle | 0 (0.0%) | 27 (4.8%) |
| 1 Vehicle | 197 (39.8%) | 421 (74.7%) |
| 2 Vehicles | 152 (30.7%) | 108 (19.2%) |
| 3 or more Vehicles | 146 (29.5%) | 8 (1.4%) |
| Total | 495 (100.0%) | 564 (100.0%) |
Real Estate & Mortgages in Fairfield
Real Estate and Mortgage Overview in Fairfield
| Characteristic | Without Mortgage | With Mortgage |
| Housing Units | 316 | 179 |
| Median Property Value | $121,200 | $129,900 |
| Median Household Income | $52,949 | $59 |
| Monthly Housing Costs | $541 | $4 |
| Real Estate Taxes | $2,019 | $0 |
Property Value by Mortgage Status in Fairfield
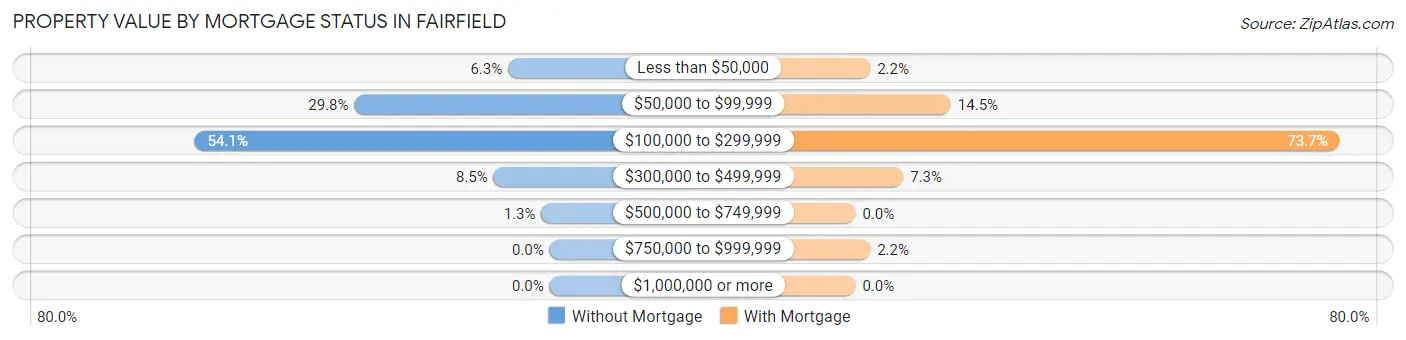
| Property Value | Without Mortgage | With Mortgage |
| Less than $50,000 | 20 (6.3%) | 4 (2.2%) |
| $50,000 to $99,999 | 94 (29.7%) | 26 (14.5%) |
| $100,000 to $299,999 | 171 (54.1%) | 132 (73.7%) |
| $300,000 to $499,999 | 27 (8.5%) | 13 (7.3%) |
| $500,000 to $749,999 | 4 (1.3%) | 0 (0.0%) |
| $750,000 to $999,999 | 0 (0.0%) | 4 (2.2%) |
| $1,000,000 or more | 0 (0.0%) | 0 (0.0%) |
| Total | 316 (100.0%) | 179 (100.0%) |
Household Income by Mortgage Status in Fairfield
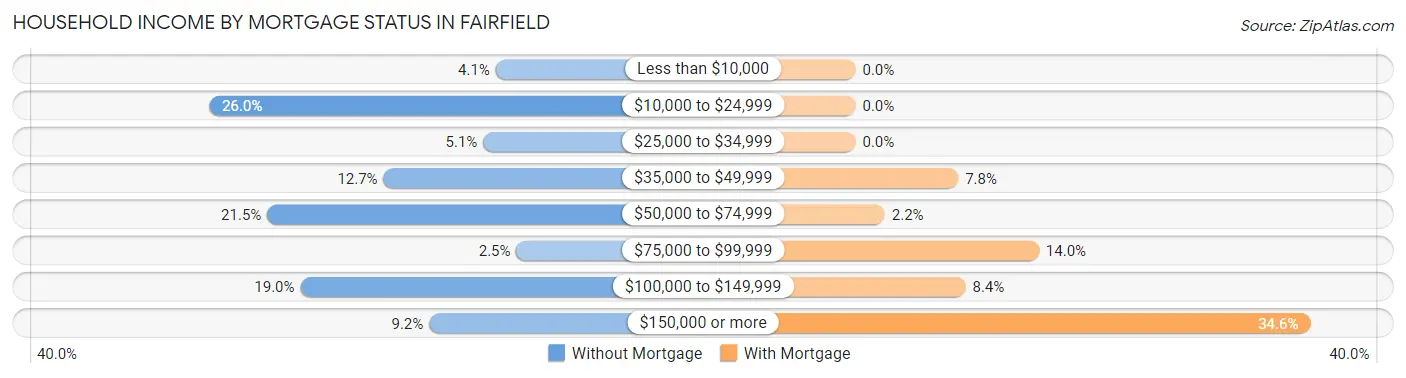
| Household Income | Without Mortgage | With Mortgage |
| Less than $10,000 | 13 (4.1%) | 0 (0.0%) |
| $10,000 to $24,999 | 82 (26.0%) | 0 (0.0%) |
| $25,000 to $34,999 | 16 (5.1%) | 0 (0.0%) |
| $35,000 to $49,999 | 40 (12.7%) | 14 (7.8%) |
| $50,000 to $74,999 | 68 (21.5%) | 4 (2.2%) |
| $75,000 to $99,999 | 8 (2.5%) | 25 (14.0%) |
| $100,000 to $149,999 | 60 (19.0%) | 15 (8.4%) |
| $150,000 or more | 29 (9.2%) | 62 (34.6%) |
| Total | 316 (100.0%) | 179 (100.0%) |
Property Value to Household Income Ratio in Fairfield
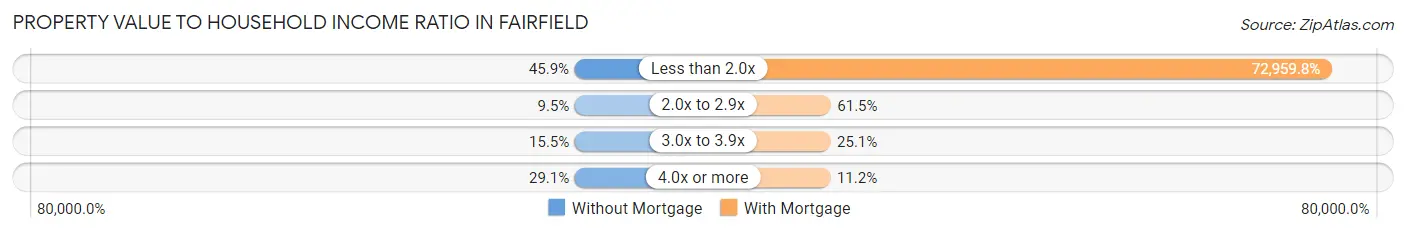
| Value-to-Income Ratio | Without Mortgage | With Mortgage |
| Less than 2.0x | 145 (45.9%) | 130,598 (72,959.8%) |
| 2.0x to 2.9x | 30 (9.5%) | 110 (61.5%) |
| 3.0x to 3.9x | 49 (15.5%) | 45 (25.1%) |
| 4.0x or more | 92 (29.1%) | 20 (11.2%) |
| Total | 316 (100.0%) | 179 (100.0%) |
Real Estate Taxes by Mortgage Status in Fairfield
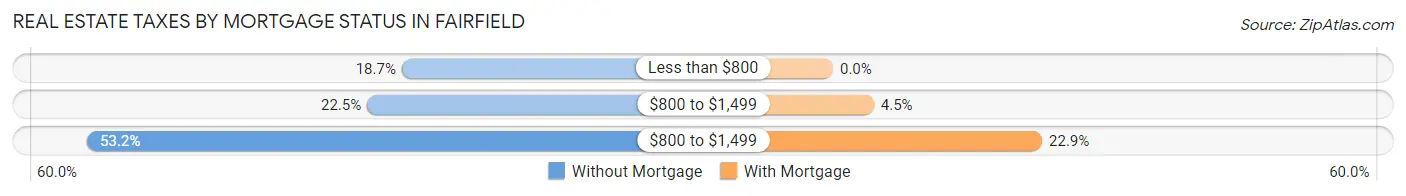
| Property Taxes | Without Mortgage | With Mortgage |
| Less than $800 | 59 (18.7%) | 0 (0.0%) |
| $800 to $1,499 | 71 (22.5%) | 8 (4.5%) |
| $800 to $1,499 | 168 (53.2%) | 41 (22.9%) |
| Total | 316 (100.0%) | 179 (100.0%) |
Health & Disability in Fairfield
Health Insurance Coverage by Age in Fairfield
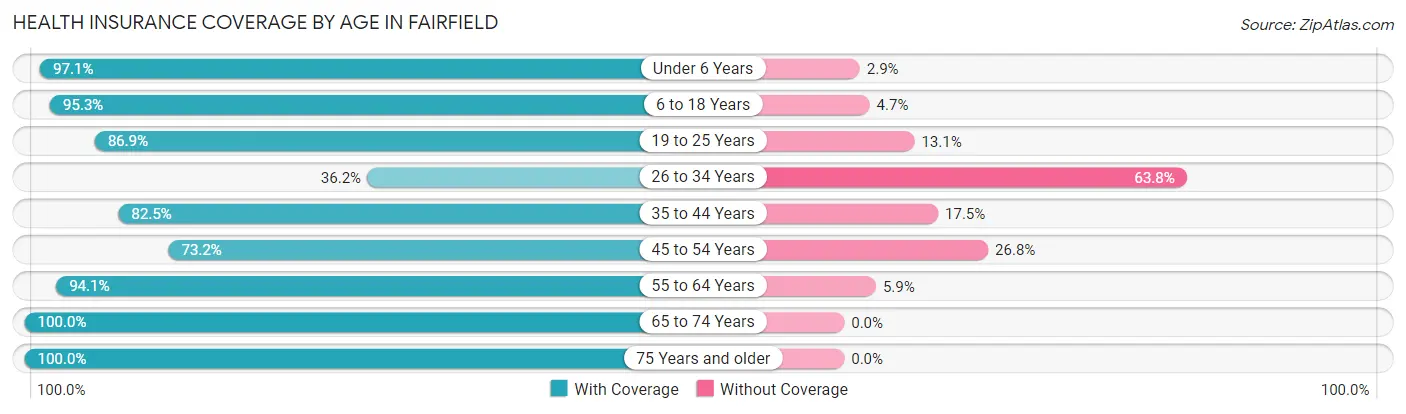
| Age Bracket | With Coverage | Without Coverage |
| Under 6 Years | 234 (97.1%) | 7 (2.9%) |
| 6 to 18 Years | 483 (95.3%) | 24 (4.7%) |
| 19 to 25 Years | 259 (86.9%) | 39 (13.1%) |
| 26 to 34 Years | 149 (36.2%) | 263 (63.8%) |
| 35 to 44 Years | 264 (82.5%) | 56 (17.5%) |
| 45 to 54 Years | 210 (73.2%) | 77 (26.8%) |
| 55 to 64 Years | 223 (94.1%) | 14 (5.9%) |
| 65 to 74 Years | 177 (100.0%) | 0 (0.0%) |
| 75 Years and older | 179 (100.0%) | 0 (0.0%) |
| Total | 2,178 (81.9%) | 480 (18.1%) |
Health Insurance Coverage by Citizenship Status in Fairfield
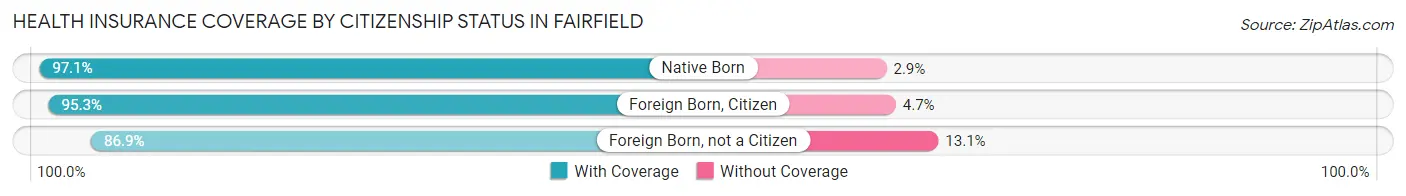
| Citizenship Status | With Coverage | Without Coverage |
| Native Born | 234 (97.1%) | 7 (2.9%) |
| Foreign Born, Citizen | 483 (95.3%) | 24 (4.7%) |
| Foreign Born, not a Citizen | 259 (86.9%) | 39 (13.1%) |
Health Insurance Coverage by Household Income in Fairfield
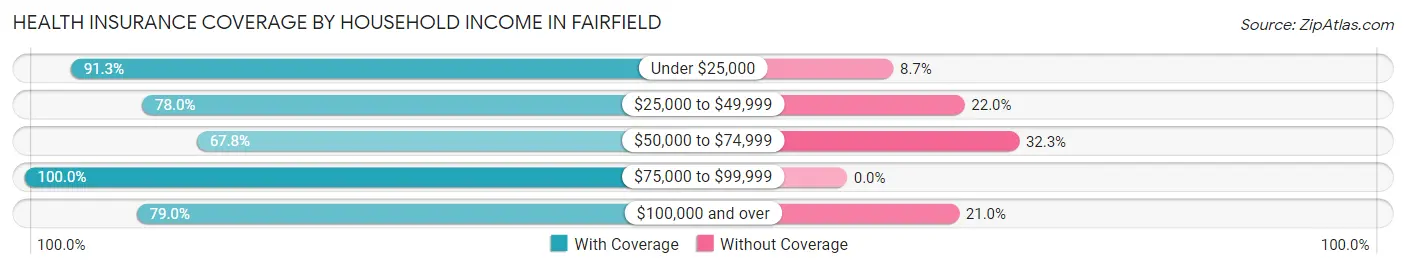
| Household Income | With Coverage | Without Coverage |
| Under $25,000 | 559 (91.3%) | 53 (8.7%) |
| $25,000 to $49,999 | 446 (78.0%) | 126 (22.0%) |
| $50,000 to $74,999 | 187 (67.7%) | 89 (32.3%) |
| $75,000 to $99,999 | 187 (100.0%) | 0 (0.0%) |
| $100,000 and over | 798 (79.0%) | 212 (21.0%) |
Public vs Private Health Insurance Coverage by Age in Fairfield
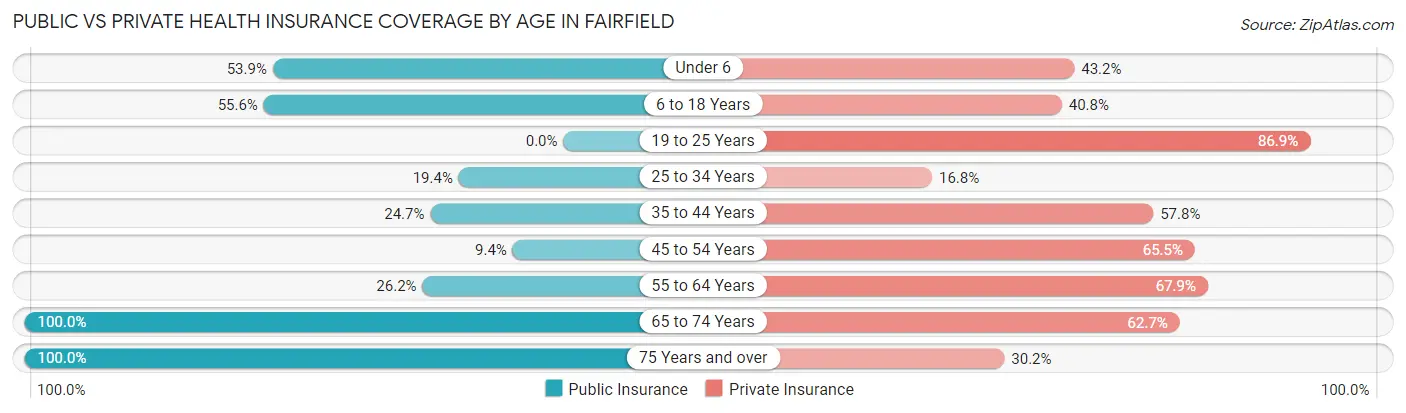
| Age Bracket | Public Insurance | Private Insurance |
| Under 6 | 130 (53.9%) | 104 (43.1%) |
| 6 to 18 Years | 282 (55.6%) | 207 (40.8%) |
| 19 to 25 Years | 0 (0.0%) | 259 (86.9%) |
| 25 to 34 Years | 80 (19.4%) | 69 (16.8%) |
| 35 to 44 Years | 79 (24.7%) | 185 (57.8%) |
| 45 to 54 Years | 27 (9.4%) | 188 (65.5%) |
| 55 to 64 Years | 62 (26.2%) | 161 (67.9%) |
| 65 to 74 Years | 177 (100.0%) | 111 (62.7%) |
| 75 Years and over | 179 (100.0%) | 54 (30.2%) |
| Total | 1,016 (38.2%) | 1,338 (50.3%) |
Disability Status by Sex by Age in Fairfield
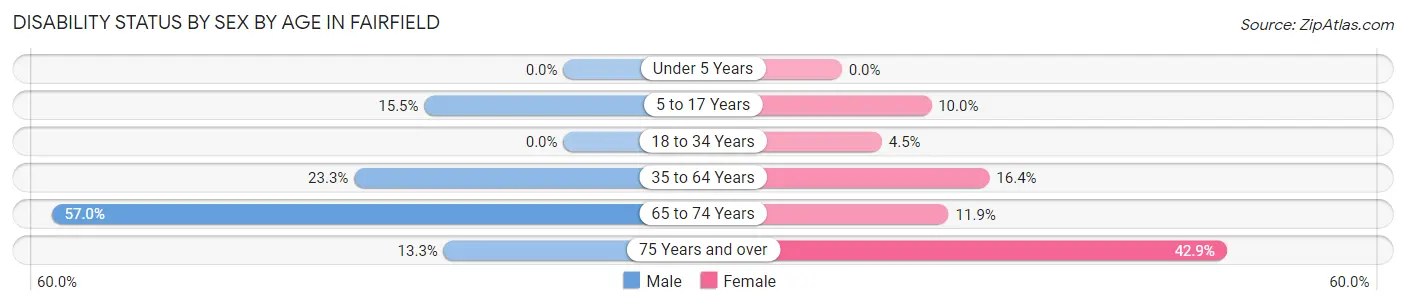
| Age Bracket | Male | Female |
| Under 5 Years | 0 (0.0%) | 0 (0.0%) |
| 5 to 17 Years | 50 (15.5%) | 23 (10.0%) |
| 18 to 34 Years | 0 (0.0%) | 18 (4.5%) |
| 35 to 64 Years | 96 (23.3%) | 71 (16.4%) |
| 65 to 74 Years | 53 (57.0%) | 10 (11.9%) |
| 75 Years and over | 8 (13.3%) | 51 (42.9%) |
Disability Class by Sex by Age in Fairfield
Disability Class: Hearing Difficulty
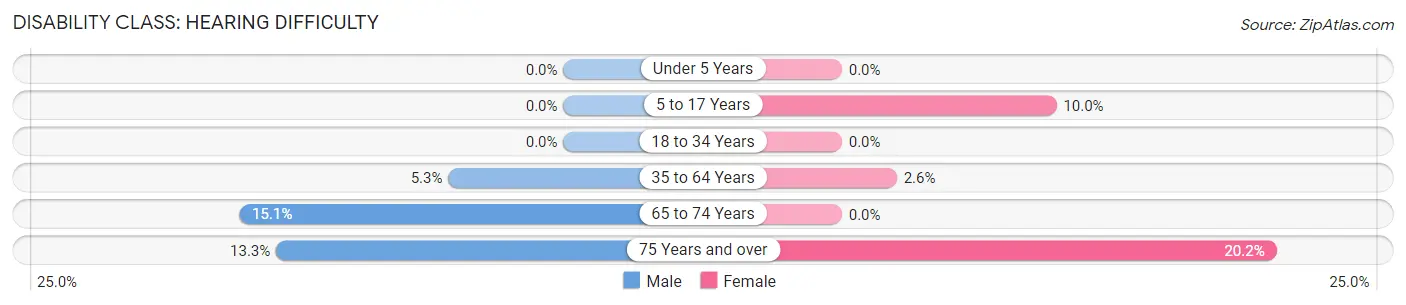
| Age Bracket | Male | Female |
| Under 5 Years | 0 (0.0%) | 0 (0.0%) |
| 5 to 17 Years | 0 (0.0%) | 23 (10.0%) |
| 18 to 34 Years | 0 (0.0%) | 0 (0.0%) |
| 35 to 64 Years | 22 (5.3%) | 11 (2.5%) |
| 65 to 74 Years | 14 (15.0%) | 0 (0.0%) |
| 75 Years and over | 8 (13.3%) | 24 (20.2%) |
Disability Class: Vision Difficulty
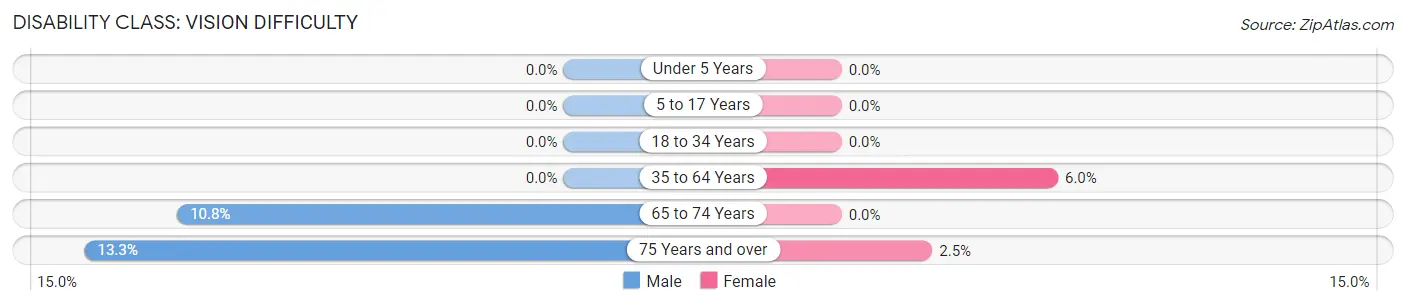
| Age Bracket | Male | Female |
| Under 5 Years | 0 (0.0%) | 0 (0.0%) |
| 5 to 17 Years | 0 (0.0%) | 0 (0.0%) |
| 18 to 34 Years | 0 (0.0%) | 0 (0.0%) |
| 35 to 64 Years | 0 (0.0%) | 26 (6.0%) |
| 65 to 74 Years | 10 (10.7%) | 0 (0.0%) |
| 75 Years and over | 8 (13.3%) | 3 (2.5%) |
Disability Class: Cognitive Difficulty
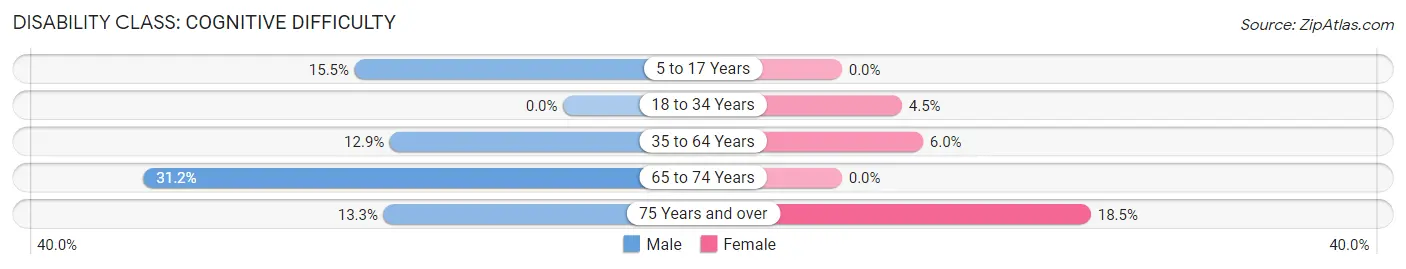
| Age Bracket | Male | Female |
| 5 to 17 Years | 50 (15.5%) | 0 (0.0%) |
| 18 to 34 Years | 0 (0.0%) | 18 (4.5%) |
| 35 to 64 Years | 53 (12.9%) | 26 (6.0%) |
| 65 to 74 Years | 29 (31.2%) | 0 (0.0%) |
| 75 Years and over | 8 (13.3%) | 22 (18.5%) |
Disability Class: Ambulatory Difficulty
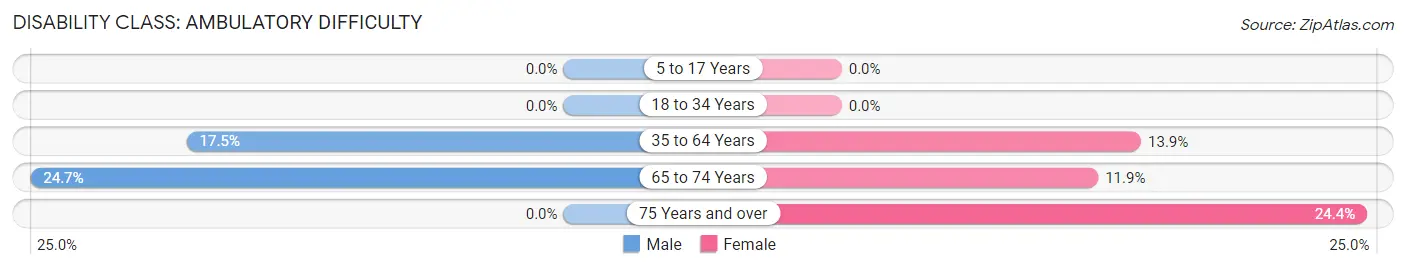
| Age Bracket | Male | Female |
| 5 to 17 Years | 0 (0.0%) | 0 (0.0%) |
| 18 to 34 Years | 0 (0.0%) | 0 (0.0%) |
| 35 to 64 Years | 72 (17.5%) | 60 (13.9%) |
| 65 to 74 Years | 23 (24.7%) | 10 (11.9%) |
| 75 Years and over | 0 (0.0%) | 29 (24.4%) |
Disability Class: Self-Care Difficulty
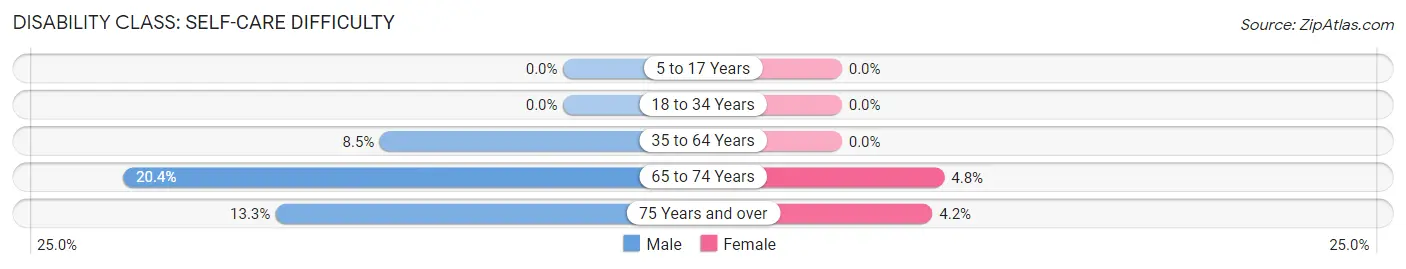
| Age Bracket | Male | Female |
| 5 to 17 Years | 0 (0.0%) | 0 (0.0%) |
| 18 to 34 Years | 0 (0.0%) | 0 (0.0%) |
| 35 to 64 Years | 35 (8.5%) | 0 (0.0%) |
| 65 to 74 Years | 19 (20.4%) | 4 (4.8%) |
| 75 Years and over | 8 (13.3%) | 5 (4.2%) |
Technology Access in Fairfield
Computing Device Access in Fairfield
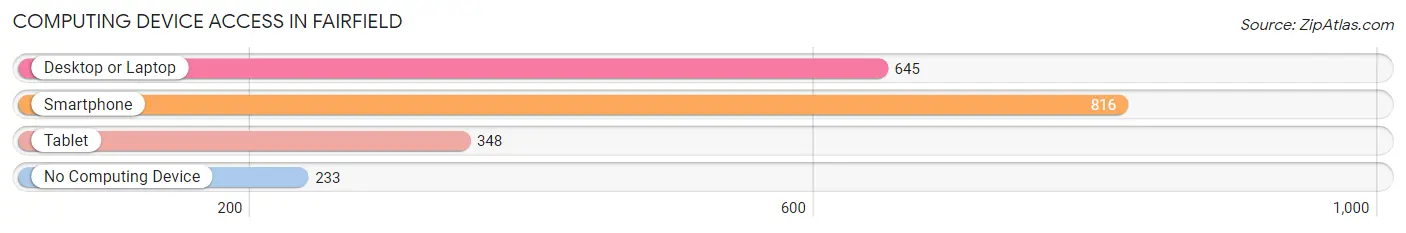
| Device Type | # Households | % Households |
| Desktop or Laptop | 645 | 60.9% |
| Smartphone | 816 | 77.0% |
| Tablet | 348 | 32.9% |
| No Computing Device | 233 | 22.0% |
| Total | 1,059 | 100.0% |
Internet Access in Fairfield
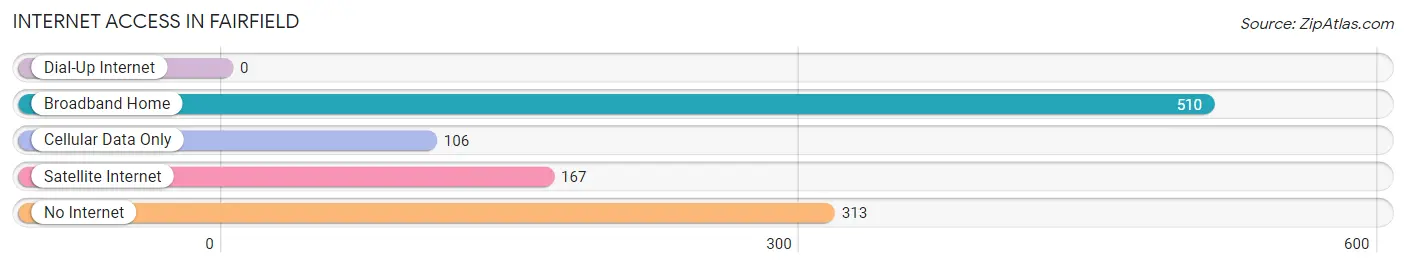
| Internet Type | # Households | % Households |
| Dial-Up Internet | 0 | 0.0% |
| Broadband Home | 510 | 48.2% |
| Cellular Data Only | 106 | 10.0% |
| Satellite Internet | 167 | 15.8% |
| No Internet | 313 | 29.6% |
| Total | 1,059 | 100.0% |
Fairfield Summary
Fairfield, Texas is a small city located in Freestone County, Texas. It is situated about halfway between Dallas and Houston, and is part of the Dallas-Fort Worth-Arlington metropolitan area. The city has a population of approximately 3,000 people and is the county seat of Freestone County.
History
Fairfield was founded in 1851 by a group of settlers from Tennessee. The town was named after Fairfield, Tennessee, the hometown of the settlers. The town was originally located on the banks of the Trinity River, but was moved to its current location in 1854 due to flooding.
The town was incorporated in 1856 and quickly became a center of commerce for the surrounding area. The town was home to several businesses, including a cotton gin, a grist mill, and a blacksmith shop. The town also had a school, a post office, and a newspaper.
In the late 19th century, Fairfield was a major stop on the Houston and Texas Central Railway. The railroad brought new businesses and people to the town, and the population grew to over 1,000 by the early 20th century.
Geography
Fairfield is located in Freestone County, Texas, about halfway between Dallas and Houston. The city is situated on the western edge of the Blackland Prairie, an area of rolling hills and fertile soil. The city is surrounded by farmland and is located near several small lakes.
The climate in Fairfield is hot and humid in the summer and mild in the winter. The average temperature in the summer is around 90 degrees Fahrenheit, and the average temperature in the winter is around 50 degrees Fahrenheit.
Economy
The economy of Fairfield is largely based on agriculture. The city is home to several farms and ranches, and the surrounding area is known for its production of cotton, corn, and soybeans.
The city is also home to several small businesses, including restaurants, retail stores, and service providers. The city is also home to a few manufacturing companies, including a furniture factory and a plastics factory.
Demographics
As of the 2010 census, the population of Fairfield was 3,092. The racial makeup of the city was 79.3% White, 16.2% African American, 0.7% Native American, 0.4% Asian, 0.1% Pacific Islander, and 3.3% from other races. Hispanic or Latino of any race were 8.2% of the population.
The median household income in Fairfield was $35,938, and the median family income was $41,944. The per capita income was $17,845. About 17.2% of the population was below the poverty line.
Conclusion
Fairfield, Texas is a small city located in Freestone County, Texas. It is situated about halfway between Dallas and Houston, and is part of the Dallas-Fort Worth-Arlington metropolitan area. The city has a population of approximately 3,000 people and is the county seat of Freestone County. The city was founded in 1851 by a group of settlers from Tennessee and has since become a center of commerce for the surrounding area. The economy of Fairfield is largely based on agriculture, and the city is home to several small businesses. The racial makeup of the city is 79.3% White, 16.2% African American, 0.7% Native American, 0.4% Asian, 0.1% Pacific Islander, and 3.3% from other races. The median household income in Fairfield was $35,938, and the median family income was $41,944.
Common Questions
What is Per Capita Income in Fairfield?
Per Capita income in Fairfield is $27,665.
What is the Median Family Income in Fairfield?
Median Family Income in Fairfield is $78,036.
What is the Median Household income in Fairfield?
Median Household Income in Fairfield is $48,512.
What is Income or Wage Gap in Fairfield?
Income or Wage Gap in Fairfield is 35.1%.
Women in Fairfield earn 64.9 cents for every dollar earned by a man.
What is Inequality or Gini Index in Fairfield?
Inequality or Gini Index in Fairfield is 0.45.
What is the Total Population of Fairfield?
Total Population of Fairfield is 2,867.
What is the Total Male Population of Fairfield?
Total Male Population of Fairfield is 1,348.
What is the Total Female Population of Fairfield?
Total Female Population of Fairfield is 1,519.
What is the Ratio of Males per 100 Females in Fairfield?
There are 88.74 Males per 100 Females in Fairfield.
What is the Ratio of Females per 100 Males in Fairfield?
There are 112.69 Females per 100 Males in Fairfield.
What is the Median Population Age in Fairfield?
Median Population Age in Fairfield is 33.1 Years.
What is the Average Family Size in Fairfield
Average Family Size in Fairfield is 3.4 People.
What is the Average Household Size in Fairfield
Average Household Size in Fairfield is 2.5 People.
How Large is the Labor Force in Fairfield?
There are 1,285 People in the Labor Forcein in Fairfield.
What is the Percentage of People in the Labor Force in Fairfield?
56.5% of People are in the Labor Force in Fairfield.
What is the Unemployment Rate in Fairfield?
Unemployment Rate in Fairfield is 3.6%.