Zip Codes with the Highest Percentage of Population Employed in Food Preparation & Serving in San Antonio, TX
RELATED REPORTS & OPTIONS
Food Preparation & Serving
San Antonio
Compare Zip Codes
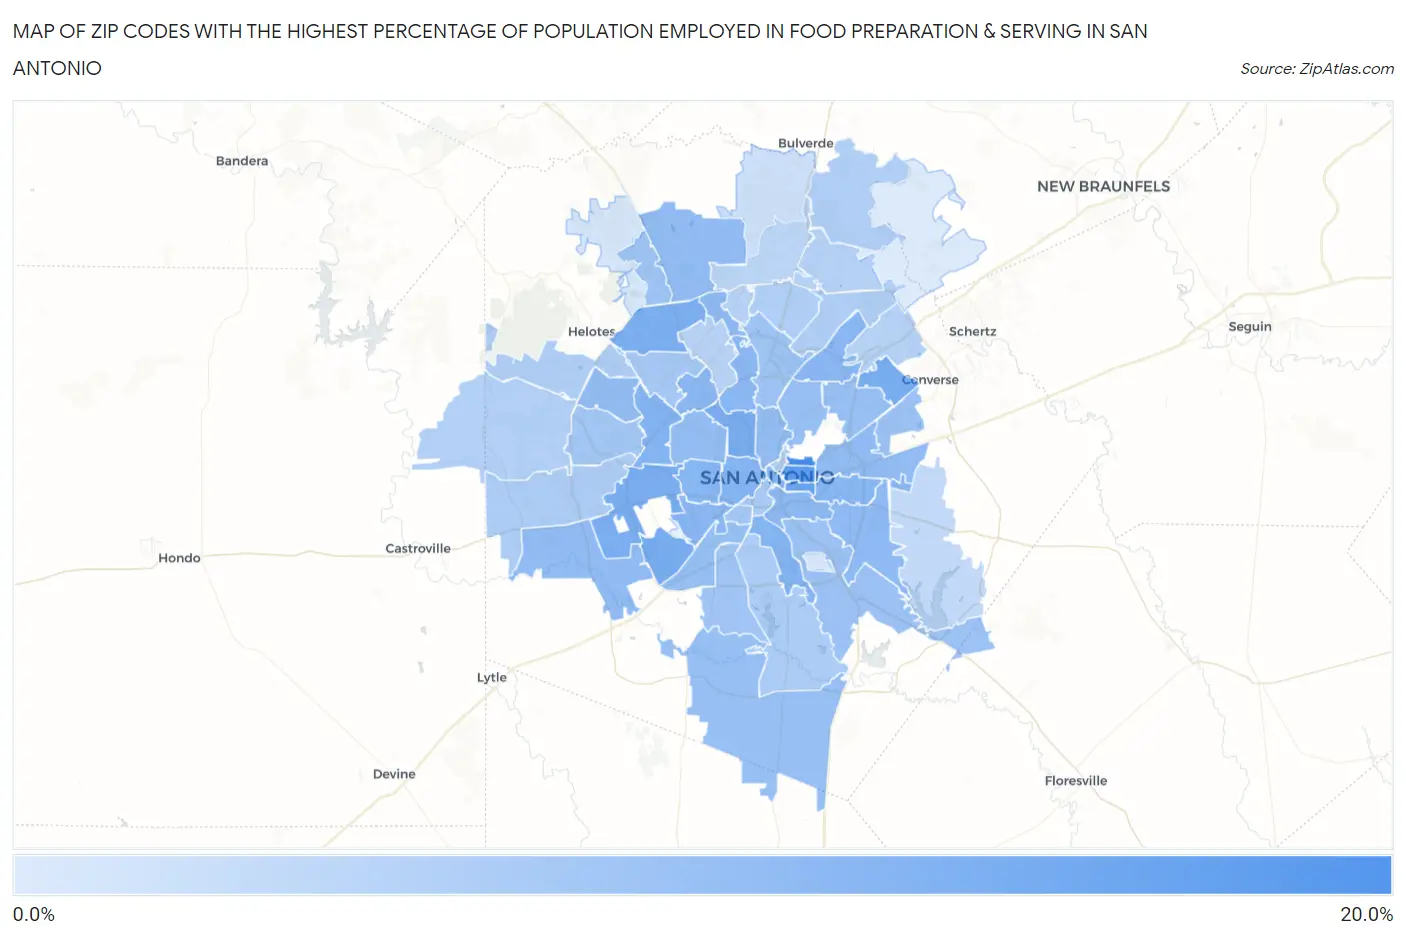
Map of Zip Codes with the Highest Percentage of Population Employed in Food Preparation & Serving in San Antonio
1.4%
15.2%
Zip Codes with the Highest Percentage of Population Employed in Food Preparation & Serving in San Antonio, TX
| Zip Code | % Employed | vs State | vs National | |
| 1. | 78208 | 15.2% | 5.4%(+9.82)#52 | 5.3%(+9.88)#959 |
| 2. | 78202 | 13.5% | 5.4%(+8.13)#72 | 5.3%(+8.20)#1,282 |
| 3. | 78203 | 11.8% | 5.4%(+6.47)#94 | 5.3%(+6.54)#1,728 |
| 4. | 78239 | 10.6% | 5.4%(+5.28)#121 | 5.3%(+5.34)#2,245 |
| 5. | 78242 | 10.5% | 5.4%(+5.12)#128 | 5.3%(+5.19)#2,336 |
| 6. | 78201 | 10.4% | 5.4%(+5.04)#130 | 5.3%(+5.10)#2,381 |
| 7. | 78227 | 10.4% | 5.4%(+5.03)#132 | 5.3%(+5.09)#2,387 |
| 8. | 78249 | 10.1% | 5.4%(+4.75)#142 | 5.3%(+4.82)#2,556 |
| 9. | 78238 | 9.4% | 5.4%(+4.07)#170 | 5.3%(+4.13)#3,118 |
| 10. | 78214 | 9.3% | 5.4%(+3.99)#175 | 5.3%(+4.06)#3,196 |
| 11. | 78207 | 9.2% | 5.4%(+3.84)#184 | 5.3%(+3.90)#3,335 |
| 12. | 78205 | 9.1% | 5.4%(+3.80)#186 | 5.3%(+3.86)#3,372 |
| 13. | 78237 | 9.0% | 5.4%(+3.60)#206 | 5.3%(+3.67)#3,569 |
| 14. | 78220 | 8.9% | 5.4%(+3.57)#208 | 5.3%(+3.63)#3,600 |
| 15. | 78229 | 8.8% | 5.4%(+3.50)#211 | 5.3%(+3.56)#3,667 |
| 16. | 78226 | 8.8% | 5.4%(+3.49)#212 | 5.3%(+3.56)#3,669 |
| 17. | 78213 | 8.8% | 5.4%(+3.47)#214 | 5.3%(+3.54)#3,694 |
| 18. | 78217 | 8.8% | 5.4%(+3.40)#220 | 5.3%(+3.46)#3,782 |
| 19. | 78210 | 8.7% | 5.4%(+3.34)#229 | 5.3%(+3.40)#3,871 |
| 20. | 78231 | 8.4% | 5.4%(+3.05)#254 | 5.3%(+3.12)#4,169 |
| 21. | 78222 | 8.4% | 5.4%(+3.00)#257 | 5.3%(+3.07)#4,237 |
| 22. | 78219 | 8.2% | 5.4%(+2.83)#270 | 5.3%(+2.90)#4,455 |
| 23. | 78257 | 8.1% | 5.4%(+2.77)#277 | 5.3%(+2.84)#4,543 |
| 24. | 78252 | 8.1% | 5.4%(+2.75)#279 | 5.3%(+2.82)#4,568 |
| 25. | 78250 | 8.0% | 5.4%(+2.68)#291 | 5.3%(+2.74)#4,690 |
| 26. | 78228 | 8.0% | 5.4%(+2.66)#292 | 5.3%(+2.73)#4,710 |
| 27. | 78212 | 7.9% | 5.4%(+2.57)#298 | 5.3%(+2.64)#4,853 |
| 28. | 78211 | 7.8% | 5.4%(+2.45)#311 | 5.3%(+2.51)#5,053 |
| 29. | 78209 | 7.6% | 5.4%(+2.23)#331 | 5.3%(+2.30)#5,398 |
| 30. | 78218 | 7.6% | 5.4%(+2.21)#334 | 5.3%(+2.27)#5,449 |
| 31. | 78264 | 7.5% | 5.4%(+2.20)#338 | 5.3%(+2.26)#5,469 |
| 32. | 78223 | 7.4% | 5.4%(+2.05)#360 | 5.3%(+2.11)#5,744 |
| 33. | 78244 | 7.2% | 5.4%(+1.81)#392 | 5.3%(+1.88)#6,198 |
| 34. | 78216 | 6.9% | 5.4%(+1.51)#430 | 5.3%(+1.58)#6,912 |
| 35. | 78256 | 6.8% | 5.4%(+1.49)#432 | 5.3%(+1.56)#6,950 |
| 36. | 78224 | 6.6% | 5.4%(+1.28)#464 | 5.3%(+1.35)#7,534 |
| 37. | 78225 | 6.4% | 5.4%(+1.06)#499 | 5.3%(+1.12)#8,130 |
| 38. | 78251 | 6.4% | 5.4%(+1.04)#503 | 5.3%(+1.11)#8,155 |
| 39. | 78240 | 6.2% | 5.4%(+0.890)#522 | 5.3%(+0.955)#8,613 |
| 40. | 78204 | 6.0% | 5.4%(+0.688)#559 | 5.3%(+0.753)#9,214 |
| 41. | 78221 | 5.6% | 5.4%(+0.286)#639 | 5.3%(+0.351)#10,569 |
| 42. | 78245 | 5.6% | 5.4%(+0.200)#665 | 5.3%(+0.265)#10,889 |
| 43. | 78254 | 5.4% | 5.4%(+0.048)#696 | 5.3%(+0.113)#11,411 |
| 44. | 78247 | 5.4% | 5.4%(+0.018)#705 | 5.3%(+0.083)#11,514 |
| 45. | 78232 | 5.3% | 5.4%(-0.021)#720 | 5.3%(+0.045)#11,651 |
| 46. | 78261 | 5.3% | 5.4%(-0.021)#722 | 5.3%(+0.044)#11,657 |
| 47. | 78215 | 5.0% | 5.4%(-0.338)#806 | 5.3%(-0.273)#12,895 |
| 48. | 78253 | 5.0% | 5.4%(-0.354)#811 | 5.3%(-0.289)#12,976 |
| 49. | 78259 | 4.9% | 5.4%(-0.456)#831 | 5.3%(-0.391)#13,374 |
| 50. | 78233 | 4.8% | 5.4%(-0.502)#845 | 5.3%(-0.437)#13,567 |
| 51. | 78230 | 4.6% | 5.4%(-0.759)#901 | 5.3%(-0.694)#14,629 |
| 52. | 78248 | 4.6% | 5.4%(-0.766)#904 | 5.3%(-0.701)#14,675 |
| 53. | 78258 | 4.3% | 5.4%(-1.07)#970 | 5.3%(-1.01)#15,971 |
| 54. | 78263 | 3.9% | 5.4%(-1.48)#1,072 | 5.3%(-1.41)#17,656 |
| 55. | 78260 | 2.8% | 5.4%(-2.55)#1,306 | 5.3%(-2.48)#22,059 |
| 56. | 78255 | 1.9% | 5.4%(-3.45)#1,455 | 5.3%(-3.39)#25,005 |
| 57. | 78235 | 1.7% | 5.4%(-3.65)#1,482 | 5.3%(-3.58)#25,521 |
| 58. | 78266 | 1.4% | 5.4%(-3.96)#1,524 | 5.3%(-3.89)#26,214 |
1
Common Questions
What are the Top 10 Zip Codes with the Highest Percentage of Population Employed in Food Preparation & Serving in San Antonio, TX?
Top 10 Zip Codes with the Highest Percentage of Population Employed in Food Preparation & Serving in San Antonio, TX are:
What zip code has the Highest Percentage of Population Employed in Food Preparation & Serving in San Antonio, TX?
78208 has the Highest Percentage of Population Employed in Food Preparation & Serving in San Antonio, TX with 15.2%.
What is the Percentage of Population Employed in Food Preparation & Serving in San Antonio, TX?
Percentage of Population Employed in Food Preparation & Serving in San Antonio is 7.6%.
What is the Percentage of Population Employed in Food Preparation & Serving in Texas?
Percentage of Population Employed in Food Preparation & Serving in Texas is 5.4%.
What is the Percentage of Population Employed in Food Preparation & Serving in the United States?
Percentage of Population Employed in Food Preparation & Serving in the United States is 5.3%.