Zip Codes with the Highest Percentage of Population Employed in Food Preparation & Serving in Canyon, TX
RELATED REPORTS & OPTIONS
Food Preparation & Serving
Canyon
Compare Zip Codes
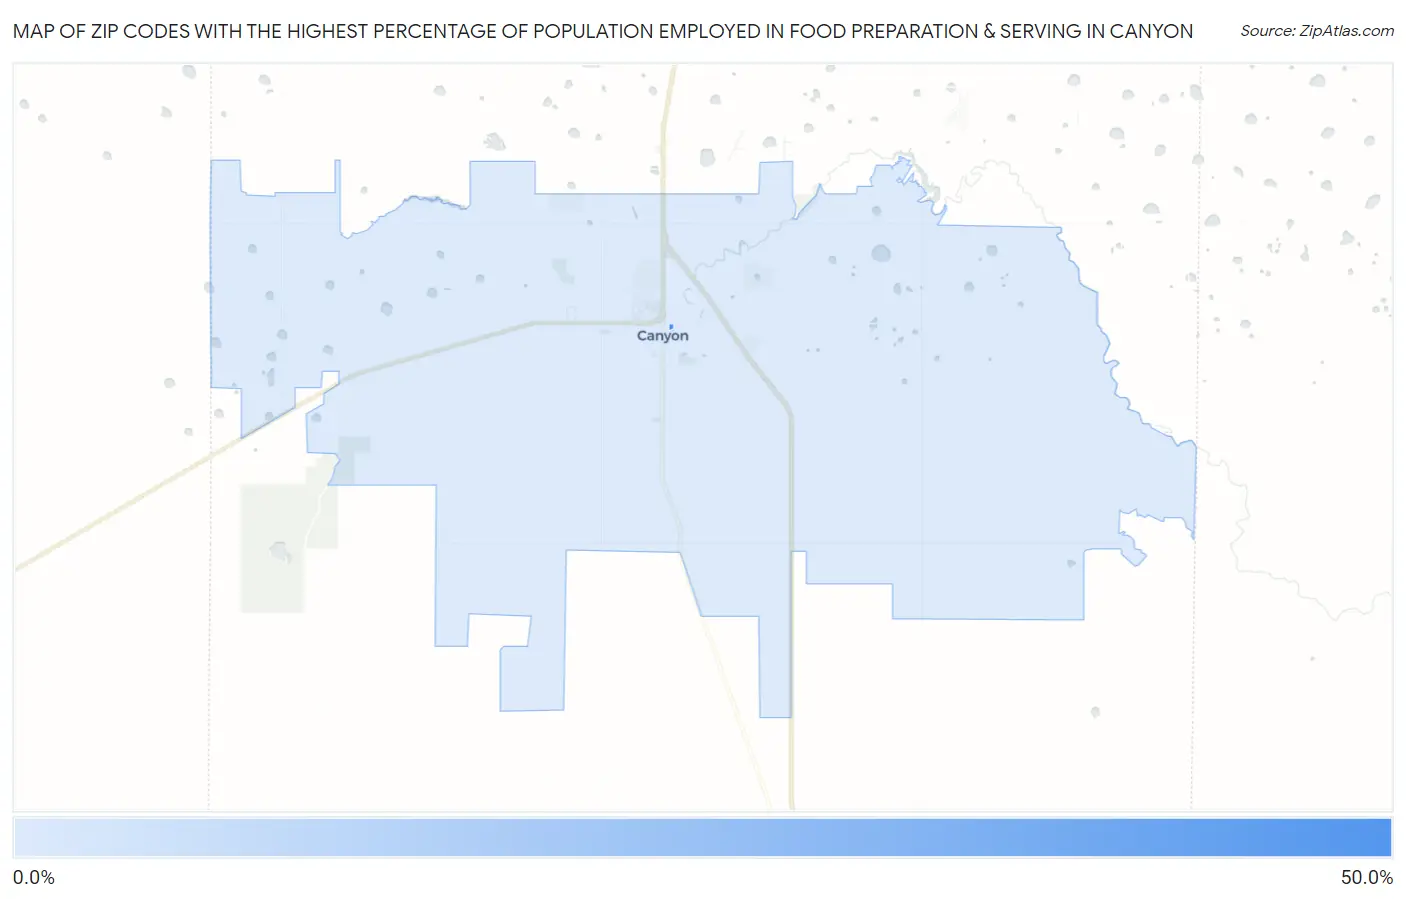
Map of Zip Codes with the Highest Percentage of Population Employed in Food Preparation & Serving in Canyon
5.3%
45.4%
Zip Codes with the Highest Percentage of Population Employed in Food Preparation & Serving in Canyon, TX
| Zip Code | % Employed | vs State | vs National | |
| 1. | 79016 | 45.4% | 5.4%(+40.1)#4 | 5.3%(+40.1)#72 |
| 2. | 79015 | 5.3% | 5.4%(-0.090)#739 | 5.3%(-0.025)#11,917 |
1
Common Questions
What are the Top Zip Codes with the Highest Percentage of Population Employed in Food Preparation & Serving in Canyon, TX?
Top Zip Codes with the Highest Percentage of Population Employed in Food Preparation & Serving in Canyon, TX are:
What zip code has the Highest Percentage of Population Employed in Food Preparation & Serving in Canyon, TX?
79016 has the Highest Percentage of Population Employed in Food Preparation & Serving in Canyon, TX with 45.4%.
What is the Percentage of Population Employed in Food Preparation & Serving in Canyon, TX?
Percentage of Population Employed in Food Preparation & Serving in Canyon is 7.6%.
What is the Percentage of Population Employed in Food Preparation & Serving in Texas?
Percentage of Population Employed in Food Preparation & Serving in Texas is 5.4%.
What is the Percentage of Population Employed in Food Preparation & Serving in the United States?
Percentage of Population Employed in Food Preparation & Serving in the United States is 5.3%.