Elm Creek, TX Map & Demographics
Elm Creek Map
Elm Creek Overview
$21,643
PER CAPITA INCOME
$93,914
AVG FAMILY INCOME
$64,853
AVG HOUSEHOLD INCOME
65.9%
WAGE / INCOME GAP [ % ]
34.1¢/ $1
WAGE / INCOME GAP [ $ ]
0.38
INEQUALITY / GINI INDEX
3,559
TOTAL POPULATION
1,930
MALE POPULATION
1,629
FEMALE POPULATION
118.48
MALES / 100 FEMALES
84.40
FEMALES / 100 MALES
27.0
MEDIAN AGE
4.3
AVG FAMILY SIZE
3.8
AVG HOUSEHOLD SIZE
1,687
LABOR FORCE [ PEOPLE ]
67.6%
PERCENT IN LABOR FORCE
6.8%
UNEMPLOYMENT RATE
Income in Elm Creek
Income Overview in Elm Creek
Per Capita Income in Elm Creek is $21,643, while median incomes of families and households are $93,914 and $64,853 respectively.
| Characteristic | Number | Measure |
| Per Capita Income | 3,559 | $21,643 |
| Median Family Income | 799 | $93,914 |
| Mean Family Income | 799 | $85,183 |
| Median Household Income | 942 | $64,853 |
| Mean Household Income | 942 | $77,703 |
| Income Deficit | 799 | $0 |
| Wage / Income Gap (%) | 3,559 | 65.89% |
| Wage / Income Gap ($) | 3,559 | 34.11¢ per $1 |
| Gini / Inequality Index | 3,559 | 0.38 |
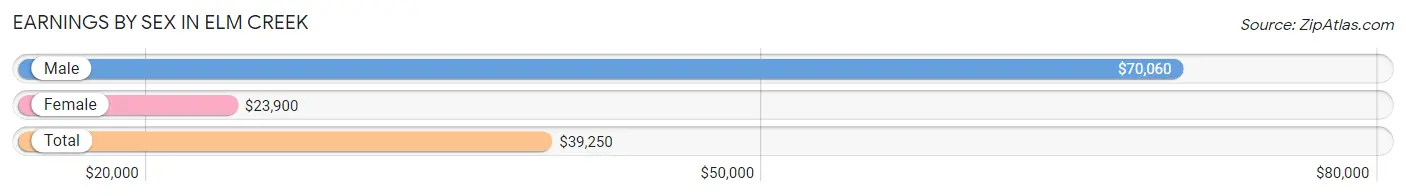
Earnings by Sex in Elm Creek
Average Earnings in Elm Creek are $39,250, $70,060 for men and $23,900 for women, a difference of 65.9%.
| Sex | Number | Average Earnings |
| Male | 832 (51.7%) | $70,060 |
| Female | 778 (48.3%) | $23,900 |
| Total | 1,610 (100.0%) | $39,250 |
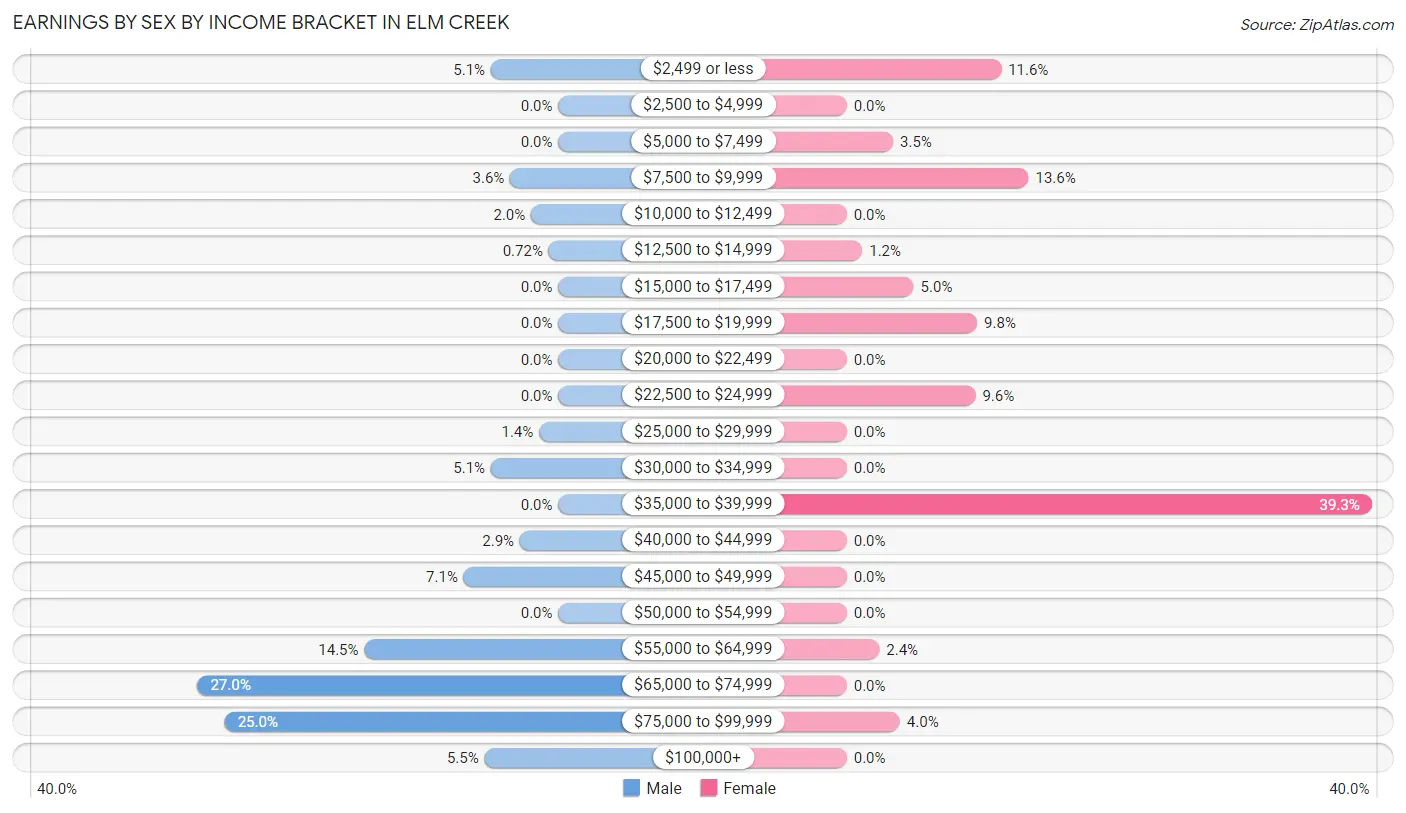
Earnings by Sex by Income Bracket in Elm Creek
The most common earnings brackets in Elm Creek are $65,000 to $74,999 for men (225 | 27.0%) and $35,000 to $39,999 for women (306 | 39.3%).
| Income | Male | Female |
| $2,499 or less | 42 (5.1%) | 90 (11.6%) |
| $2,500 to $4,999 | 0 (0.0%) | 0 (0.0%) |
| $5,000 to $7,499 | 0 (0.0%) | 27 (3.5%) |
| $7,500 to $9,999 | 30 (3.6%) | 106 (13.6%) |
| $10,000 to $12,499 | 17 (2.0%) | 0 (0.0%) |
| $12,500 to $14,999 | 6 (0.7%) | 9 (1.2%) |
| $15,000 to $17,499 | 0 (0.0%) | 39 (5.0%) |
| $17,500 to $19,999 | 0 (0.0%) | 76 (9.8%) |
| $20,000 to $22,499 | 0 (0.0%) | 0 (0.0%) |
| $22,500 to $24,999 | 0 (0.0%) | 75 (9.6%) |
| $25,000 to $29,999 | 12 (1.4%) | 0 (0.0%) |
| $30,000 to $34,999 | 42 (5.1%) | 0 (0.0%) |
| $35,000 to $39,999 | 0 (0.0%) | 306 (39.3%) |
| $40,000 to $44,999 | 24 (2.9%) | 0 (0.0%) |
| $45,000 to $49,999 | 59 (7.1%) | 0 (0.0%) |
| $50,000 to $54,999 | 0 (0.0%) | 0 (0.0%) |
| $55,000 to $64,999 | 121 (14.5%) | 19 (2.4%) |
| $65,000 to $74,999 | 225 (27.0%) | 0 (0.0%) |
| $75,000 to $99,999 | 208 (25.0%) | 31 (4.0%) |
| $100,000+ | 46 (5.5%) | 0 (0.0%) |
| Total | 832 (100.0%) | 778 (100.0%) |
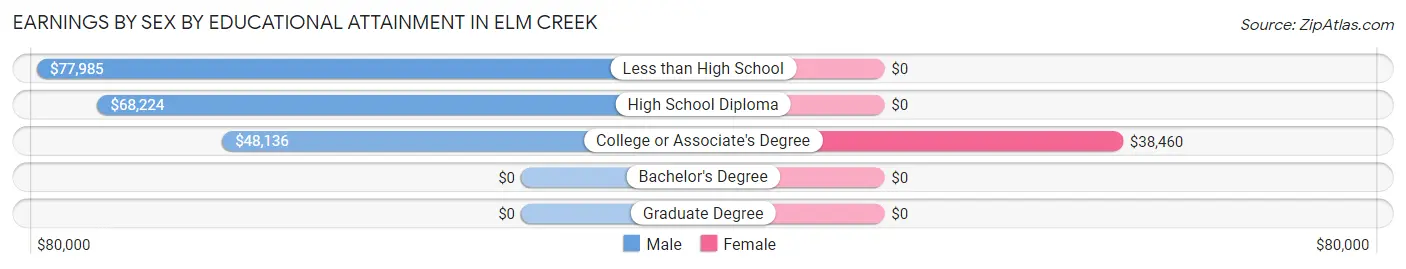
Earnings by Sex by Educational Attainment in Elm Creek
Average earnings in Elm Creek are $65,714 for men and $36,496 for women, a difference of 44.5%. Men with an educational attainment of less than high school enjoy the highest average annual earnings of $77,985, while those with college or associate's degree education earn the least with $48,136. Women with an educational attainment of college or associate's degree earn the most with the average annual earnings of $38,460, while those with college or associate's degree education have the smallest earnings of $38,460.
| Educational Attainment | Male Income | Female Income |
| Less than High School | $77,985 | $0 |
| High School Diploma | $68,224 | $0 |
| College or Associate's Degree | $48,136 | $38,460 |
| Bachelor's Degree | - | - |
| Graduate Degree | - | - |
| Total | $65,714 | $36,496 |
Family Income in Elm Creek
Family Income Brackets in Elm Creek
According to the Elm Creek family income data, there are 291 families falling into the $100,000 to $149,999 income range, which is the most common income bracket and makes up 36.4% of all families.
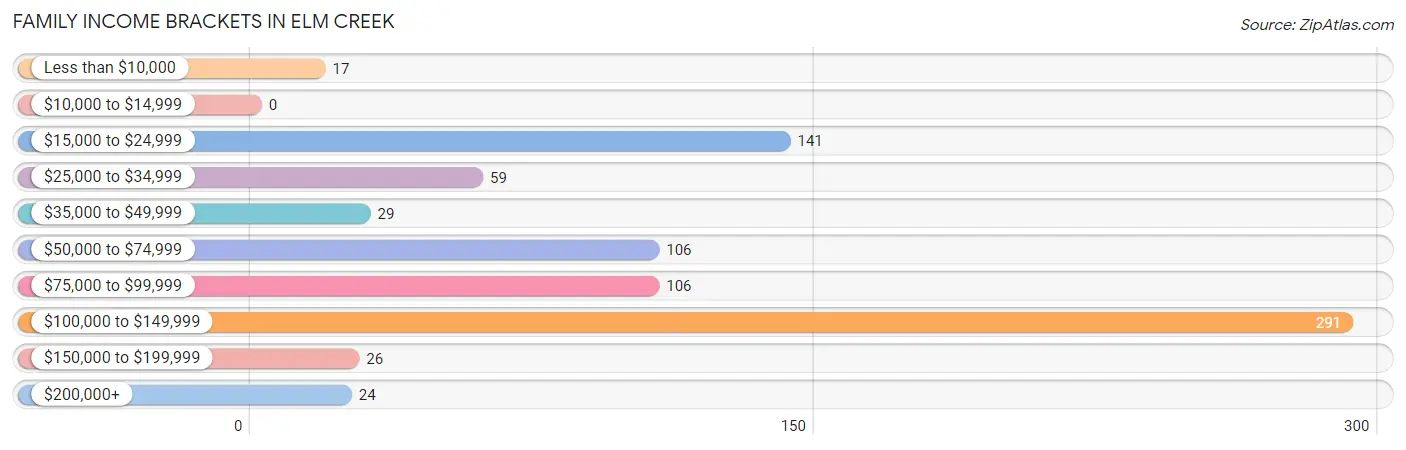
| Income Bracket | # Families | % Families |
| Less than $10,000 | 17 | 2.1% |
| $10,000 to $14,999 | 0 | 0.0% |
| $15,000 to $24,999 | 141 | 17.6% |
| $25,000 to $34,999 | 59 | 7.4% |
| $35,000 to $49,999 | 29 | 3.6% |
| $50,000 to $74,999 | 106 | 13.3% |
| $75,000 to $99,999 | 106 | 13.3% |
| $100,000 to $149,999 | 291 | 36.4% |
| $150,000 to $199,999 | 26 | 3.3% |
| $200,000+ | 24 | 3.0% |
Family Income by Famaliy Size in Elm Creek
5-person families (346 | 43.3%) account for the highest median family income in Elm Creek with $116,735 per family, while 5-person families (346 | 43.3%) have the highest median income of $23,347 per family member.
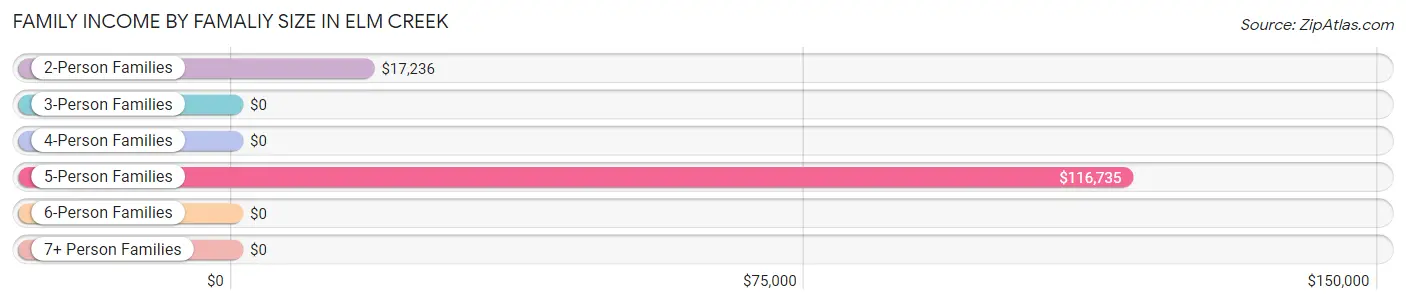
| Income Bracket | # Families | Median Income |
| 2-Person Families | 93 (11.6%) | $17,236 |
| 3-Person Families | 128 (16.0%) | $0 |
| 4-Person Families | 92 (11.5%) | $0 |
| 5-Person Families | 346 (43.3%) | $116,735 |
| 6-Person Families | 80 (10.0%) | $0 |
| 7+ Person Families | 60 (7.5%) | $0 |
| Total | 799 (100.0%) | $93,914 |
Family Income by Number of Earners in Elm Creek
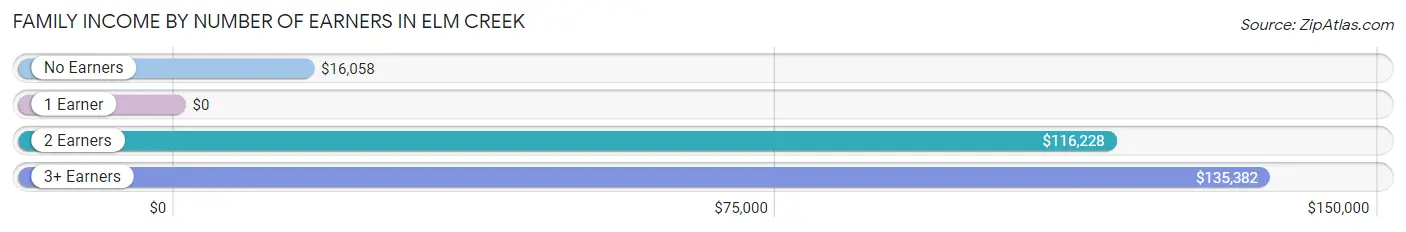
| Number of Earners | # Families | Median Income |
| No Earners | 78 (9.8%) | $16,058 |
| 1 Earner | 243 (30.4%) | $0 |
| 2 Earners | 225 (28.2%) | $116,228 |
| 3+ Earners | 253 (31.7%) | $135,382 |
| Total | 799 (100.0%) | $93,914 |
Household Income in Elm Creek
Household Income Brackets in Elm Creek
With 291 households falling in the category, the $100,000 to $149,999 income range is the most frequent in Elm Creek, accounting for 30.9% of all households.
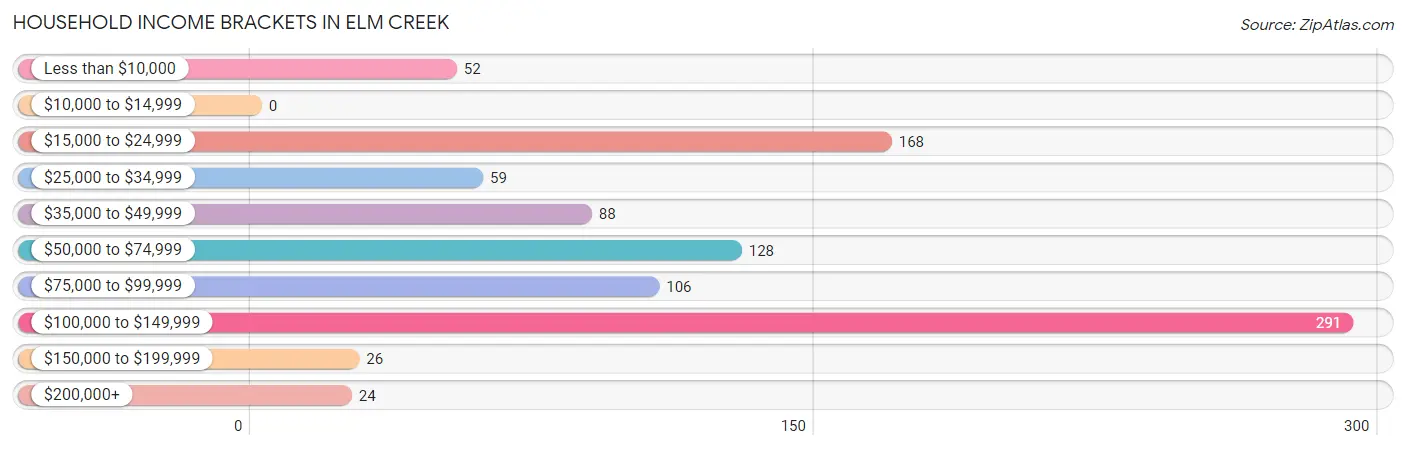
| Income Bracket | # Households | % Households |
| Less than $10,000 | 52 | 5.5% |
| $10,000 to $14,999 | 0 | 0.0% |
| $15,000 to $24,999 | 168 | 17.8% |
| $25,000 to $34,999 | 59 | 6.3% |
| $35,000 to $49,999 | 88 | 9.3% |
| $50,000 to $74,999 | 128 | 13.6% |
| $75,000 to $99,999 | 106 | 11.3% |
| $100,000 to $149,999 | 291 | 30.9% |
| $150,000 to $199,999 | 26 | 2.8% |
| $200,000+ | 24 | 2.5% |
Household Income by Householder Age in Elm Creek
The median household income in Elm Creek is $64,853, with the highest median household income of $71,023 found in the 45 to 64 years age bracket for the primary householder. A total of 428 households (45.4%) fall into this category.
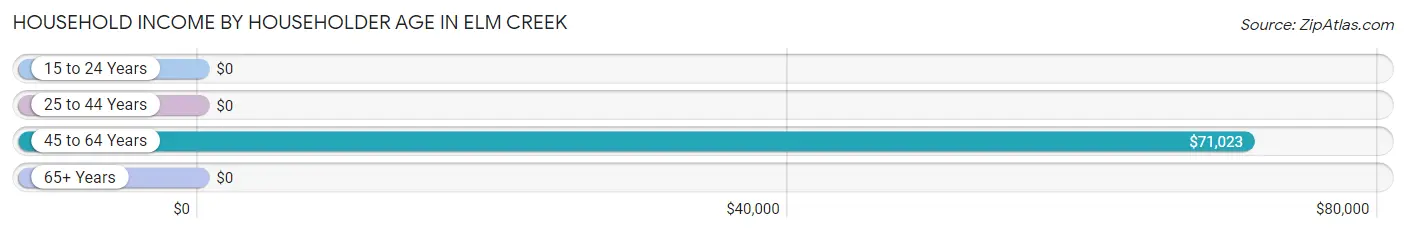
| Income Bracket | # Households | Median Income |
| 15 to 24 Years | 0 (0.0%) | $0 |
| 25 to 44 Years | 314 (33.3%) | $0 |
| 45 to 64 Years | 428 (45.4%) | $71,023 |
| 65+ Years | 200 (21.2%) | $0 |
| Total | 942 (100.0%) | $64,853 |
Poverty in Elm Creek
Income Below Poverty by Sex and Age in Elm Creek
With 13.4% poverty level for males and 26.0% for females among the residents of Elm Creek, under 5 year old males and 15 year old females are the most vulnerable to poverty, with 49 males (51.0%) and 109 females (100.0%) in their respective age groups living below the poverty level.
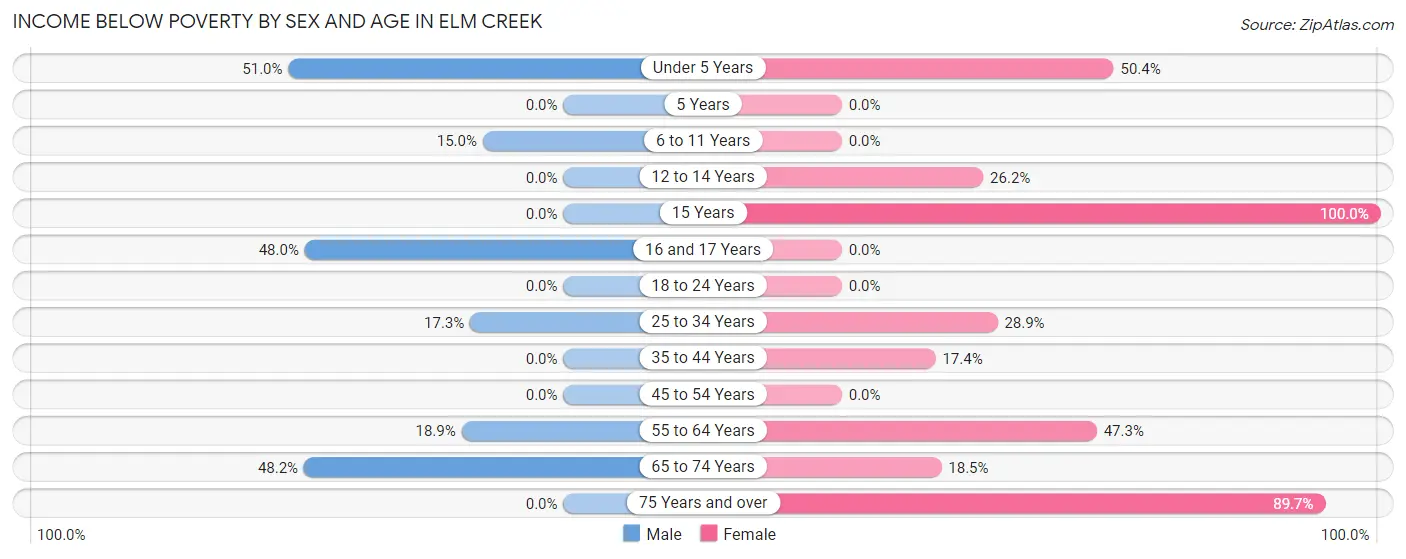
| Age Bracket | Male | Female |
| Under 5 Years | 49 (51.0%) | 57 (50.4%) |
| 5 Years | 0 (0.0%) | 0 (0.0%) |
| 6 to 11 Years | 45 (14.9%) | 0 (0.0%) |
| 12 to 14 Years | 0 (0.0%) | 37 (26.2%) |
| 15 Years | 0 (0.0%) | 109 (100.0%) |
| 16 and 17 Years | 60 (48.0%) | 0 (0.0%) |
| 18 to 24 Years | 0 (0.0%) | 0 (0.0%) |
| 25 to 34 Years | 36 (17.3%) | 39 (28.9%) |
| 35 to 44 Years | 0 (0.0%) | 76 (17.4%) |
| 45 to 54 Years | 0 (0.0%) | 0 (0.0%) |
| 55 to 64 Years | 17 (18.9%) | 53 (47.3%) |
| 65 to 74 Years | 52 (48.1%) | 17 (18.5%) |
| 75 Years and over | 0 (0.0%) | 35 (89.7%) |
| Total | 259 (13.4%) | 423 (26.0%) |
Income Above Poverty by Sex and Age in Elm Creek
According to the poverty statistics in Elm Creek, males aged 5 years and females aged 6 to 11 years are the age groups that are most secure financially, with 100.0% of males and 100.0% of females in these age groups living above the poverty line.
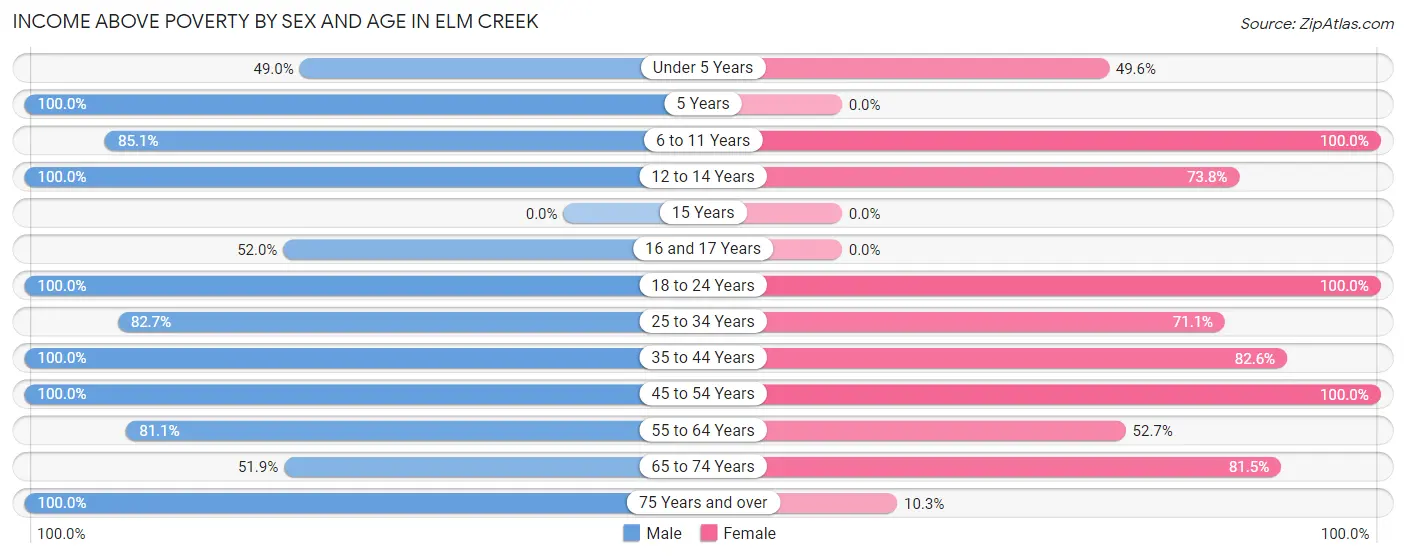
| Age Bracket | Male | Female |
| Under 5 Years | 47 (49.0%) | 56 (49.6%) |
| 5 Years | 70 (100.0%) | 0 (0.0%) |
| 6 to 11 Years | 256 (85.1%) | 134 (100.0%) |
| 12 to 14 Years | 99 (100.0%) | 104 (73.8%) |
| 15 Years | 0 (0.0%) | 0 (0.0%) |
| 16 and 17 Years | 65 (52.0%) | 0 (0.0%) |
| 18 to 24 Years | 340 (100.0%) | 198 (100.0%) |
| 25 to 34 Years | 172 (82.7%) | 96 (71.1%) |
| 35 to 44 Years | 208 (100.0%) | 361 (82.6%) |
| 45 to 54 Years | 255 (100.0%) | 119 (100.0%) |
| 55 to 64 Years | 73 (81.1%) | 59 (52.7%) |
| 65 to 74 Years | 56 (51.8%) | 75 (81.5%) |
| 75 Years and over | 30 (100.0%) | 4 (10.3%) |
| Total | 1,671 (86.6%) | 1,206 (74.0%) |
Income Below Poverty Among Married-Couple Families in Elm Creek
The poverty statistics for married-couple families in Elm Creek show that 11.8% or 69 of the total 586 families live below the poverty line. Families with no children have the highest poverty rate of 40.6%, comprising of 69 families. On the other hand, families with 1 or 2 children have the lowest poverty rate of 0.0%, which includes 0 families.
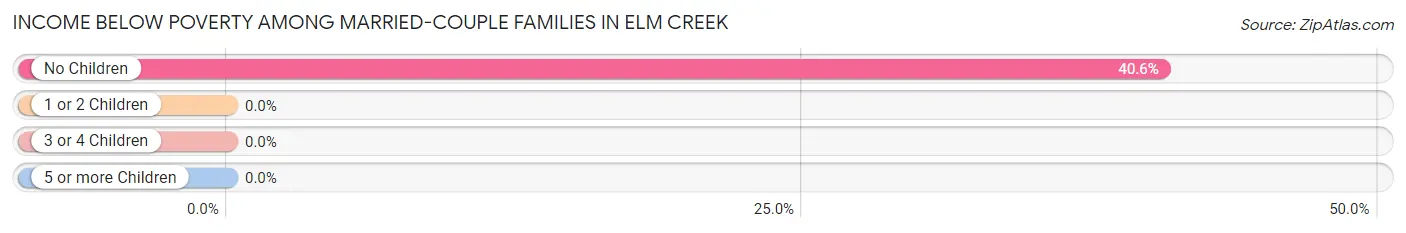
| Children | Above Poverty | Below Poverty |
| No Children | 101 (59.4%) | 69 (40.6%) |
| 1 or 2 Children | 354 (100.0%) | 0 (0.0%) |
| 3 or 4 Children | 62 (100.0%) | 0 (0.0%) |
| 5 or more Children | 0 (0.0%) | 0 (0.0%) |
| Total | 517 (88.2%) | 69 (11.8%) |
Income Below Poverty Among Single-Parent Households in Elm Creek
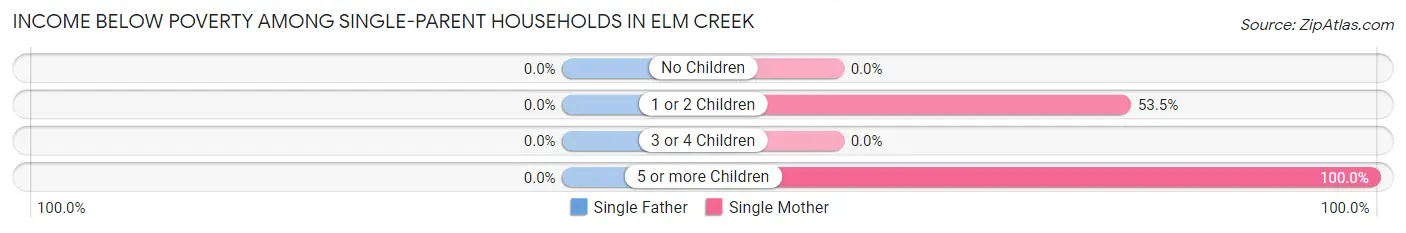
| Children | Single Father | Single Mother |
| No Children | 0 (0.0%) | 0 (0.0%) |
| 1 or 2 Children | 0 (0.0%) | 76 (53.5%) |
| 3 or 4 Children | 0 (0.0%) | 0 (0.0%) |
| 5 or more Children | 0 (0.0%) | 36 (100.0%) |
| Total | 0 (0.0%) | 112 (59.9%) |
Income Below Poverty Among Married-Couple vs Single-Parent Households in Elm Creek
The poverty data for Elm Creek shows that 69 of the married-couple family households (11.8%) and 112 of the single-parent households (52.6%) are living below the poverty level. Within the married-couple family households, those with no children have the highest poverty rate, with 69 households (40.6%) falling below the poverty line. Among the single-parent households, those with 5 or more children have the highest poverty rate, with 36 household (100.0%) living below poverty.
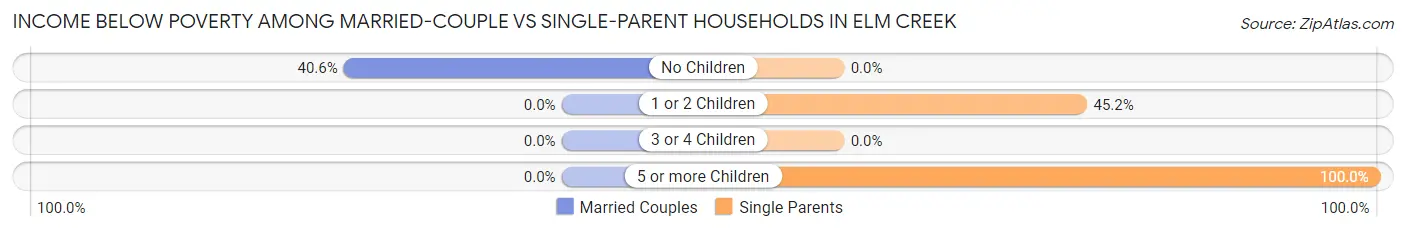
| Children | Married-Couple Families | Single-Parent Households |
| No Children | 69 (40.6%) | 0 (0.0%) |
| 1 or 2 Children | 0 (0.0%) | 76 (45.2%) |
| 3 or 4 Children | 0 (0.0%) | 0 (0.0%) |
| 5 or more Children | 0 (0.0%) | 36 (100.0%) |
| Total | 69 (11.8%) | 112 (52.6%) |
Race in Elm Creek
The most populous races in Elm Creek are Hispanic or Latino (3,387 | 95.2%), White / Caucasian (1,938 | 54.4%), and Two or more Races (1,358 | 38.2%).
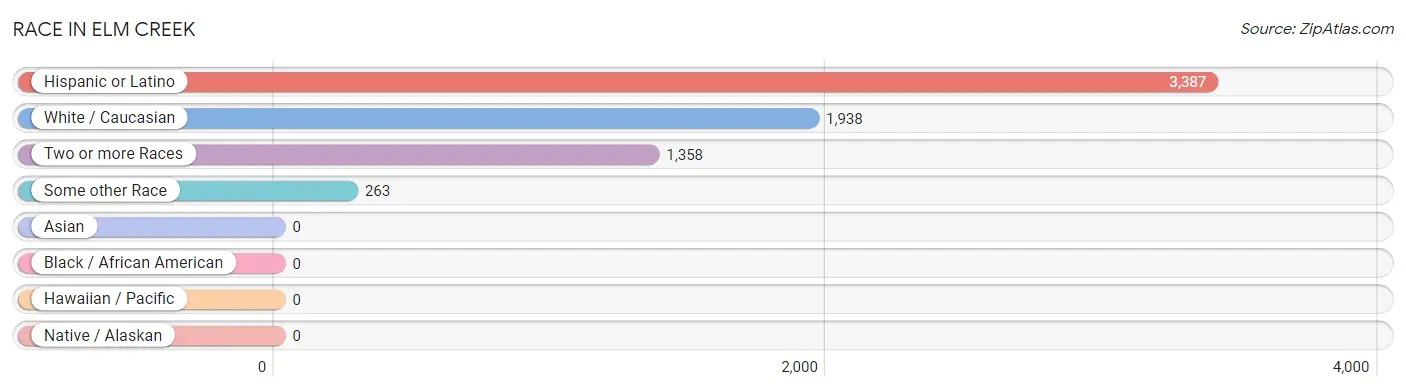
| Race | # Population | % Population |
| Asian | 0 | 0.0% |
| Black / African American | 0 | 0.0% |
| Hawaiian / Pacific | 0 | 0.0% |
| Hispanic or Latino | 3,387 | 95.2% |
| Native / Alaskan | 0 | 0.0% |
| White / Caucasian | 1,938 | 54.4% |
| Two or more Races | 1,358 | 38.2% |
| Some other Race | 263 | 7.4% |
| Total | 3,559 | 100.0% |
Ancestry in Elm Creek
The most populous ancestries reported in Elm Creek are Mexican (3,355 | 94.3%), American (305 | 8.6%), Scottish (90 | 2.5%), English (69 | 1.9%), and German (63 | 1.8%), together accounting for 109.1% of all Elm Creek residents.
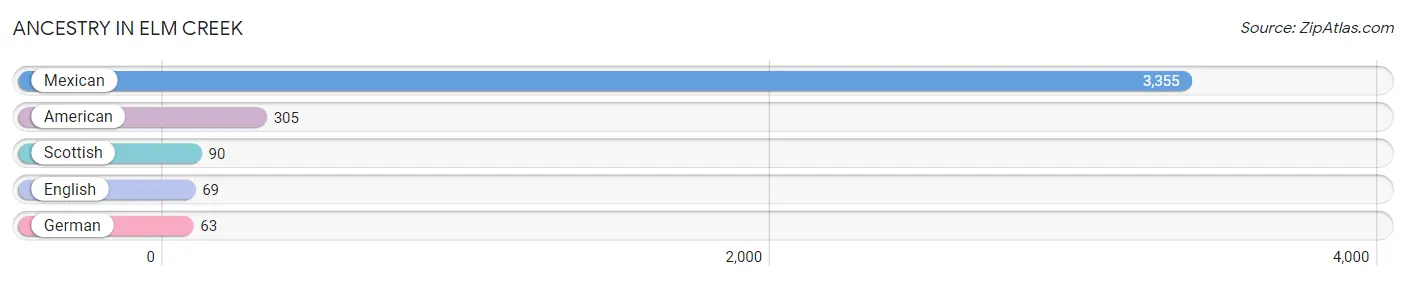
| Ancestry | # Population | % Population |
| American | 305 | 8.6% |
| English | 69 | 1.9% |
| German | 63 | 1.8% |
| Mexican | 3,355 | 94.3% |
| Scottish | 90 | 2.5% | View All 5 Rows |
Immigrants in Elm Creek
The most numerous immigrant groups reported in Elm Creek came from Central America (1,290 | 36.2%), Latin America (1,290 | 36.2%), and Mexico (1,290 | 36.2%), together accounting for 108.7% of all Elm Creek residents.
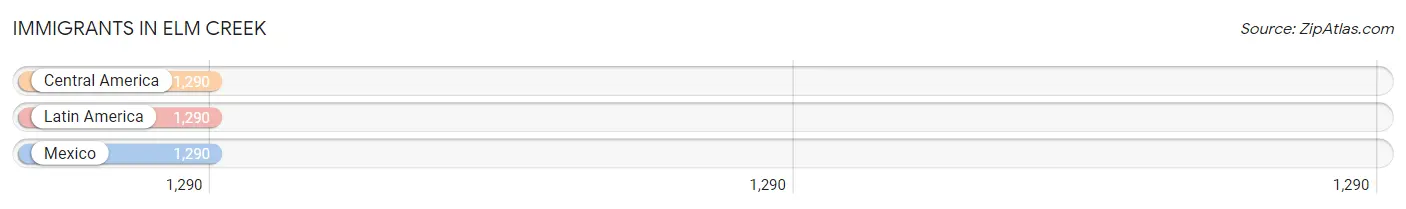
| Immigration Origin | # Population | % Population |
| Central America | 1,290 | 36.2% |
| Latin America | 1,290 | 36.2% |
| Mexico | 1,290 | 36.2% | View All 3 Rows |
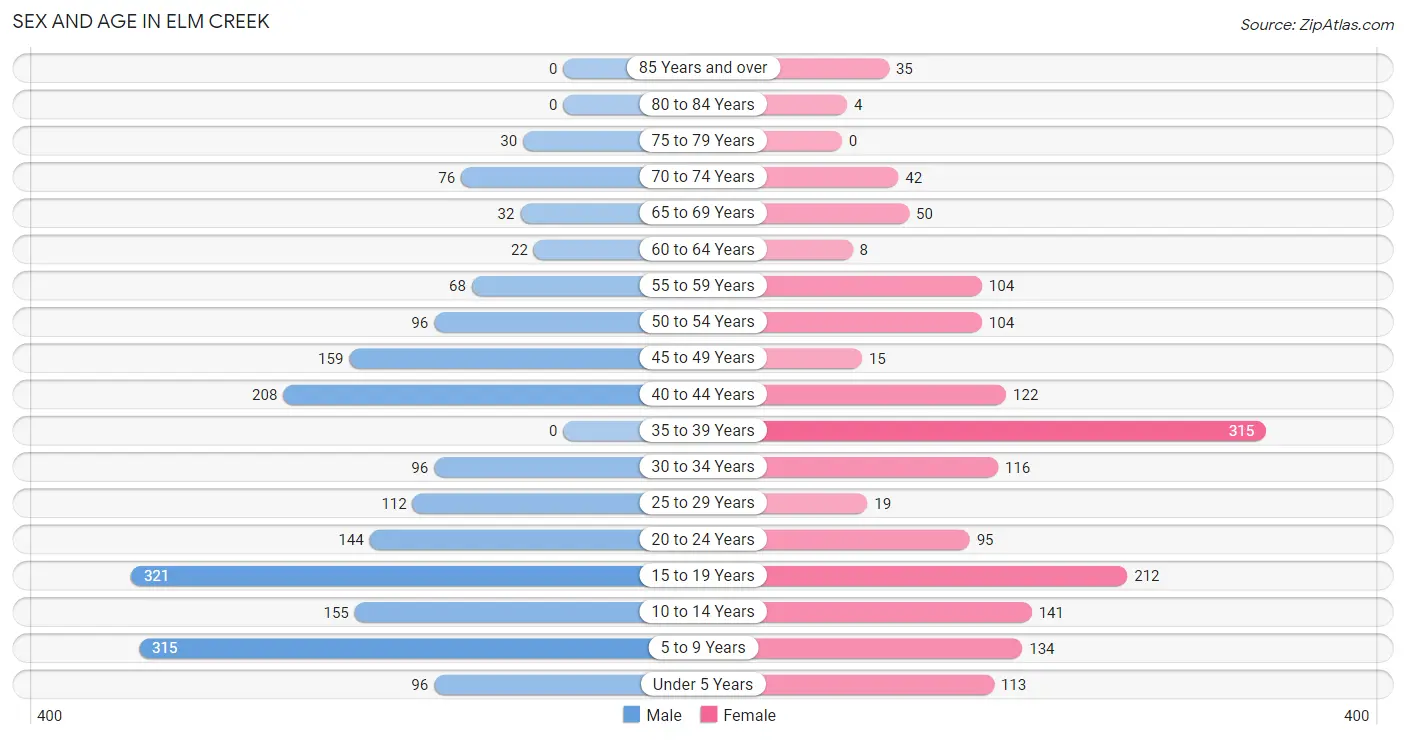
Sex and Age in Elm Creek
Sex and Age in Elm Creek
The most populous age groups in Elm Creek are 15 to 19 Years (321 | 16.6%) for men and 35 to 39 Years (315 | 19.3%) for women.
| Age Bracket | Male | Female |
| Under 5 Years | 96 (5.0%) | 113 (6.9%) |
| 5 to 9 Years | 315 (16.3%) | 134 (8.2%) |
| 10 to 14 Years | 155 (8.0%) | 141 (8.7%) |
| 15 to 19 Years | 321 (16.6%) | 212 (13.0%) |
| 20 to 24 Years | 144 (7.5%) | 95 (5.8%) |
| 25 to 29 Years | 112 (5.8%) | 19 (1.2%) |
| 30 to 34 Years | 96 (5.0%) | 116 (7.1%) |
| 35 to 39 Years | 0 (0.0%) | 315 (19.3%) |
| 40 to 44 Years | 208 (10.8%) | 122 (7.5%) |
| 45 to 49 Years | 159 (8.2%) | 15 (0.9%) |
| 50 to 54 Years | 96 (5.0%) | 104 (6.4%) |
| 55 to 59 Years | 68 (3.5%) | 104 (6.4%) |
| 60 to 64 Years | 22 (1.1%) | 8 (0.5%) |
| 65 to 69 Years | 32 (1.7%) | 50 (3.1%) |
| 70 to 74 Years | 76 (3.9%) | 42 (2.6%) |
| 75 to 79 Years | 30 (1.5%) | 0 (0.0%) |
| 80 to 84 Years | 0 (0.0%) | 4 (0.3%) |
| 85 Years and over | 0 (0.0%) | 35 (2.1%) |
| Total | 1,930 (100.0%) | 1,629 (100.0%) |
Families and Households in Elm Creek
Median Family Size in Elm Creek
The median family size in Elm Creek is 4.28 persons per family, with single male/father families (26 | 3.3%) accounting for the largest median family size of 4.81 persons per family. On the other hand, married-couple families (586 | 73.3%) represent the smallest median family size with 4.20 persons per family.
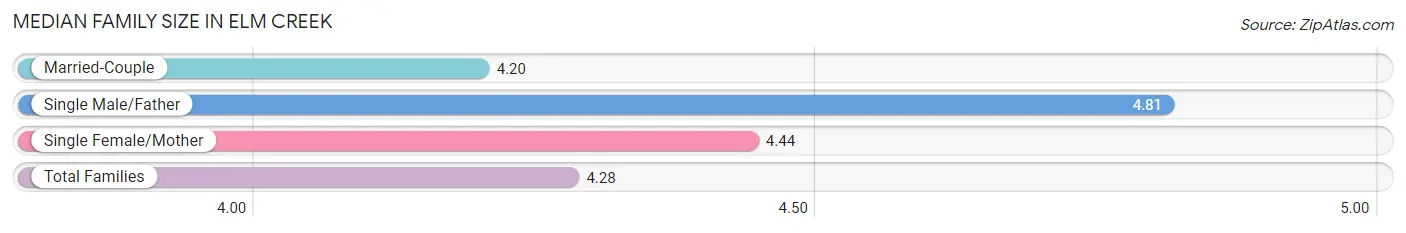
| Family Type | # Families | Family Size |
| Married-Couple | 586 (73.3%) | 4.20 |
| Single Male/Father | 26 (3.3%) | 4.81 |
| Single Female/Mother | 187 (23.4%) | 4.44 |
| Total Families | 799 (100.0%) | 4.28 |
Median Household Size in Elm Creek
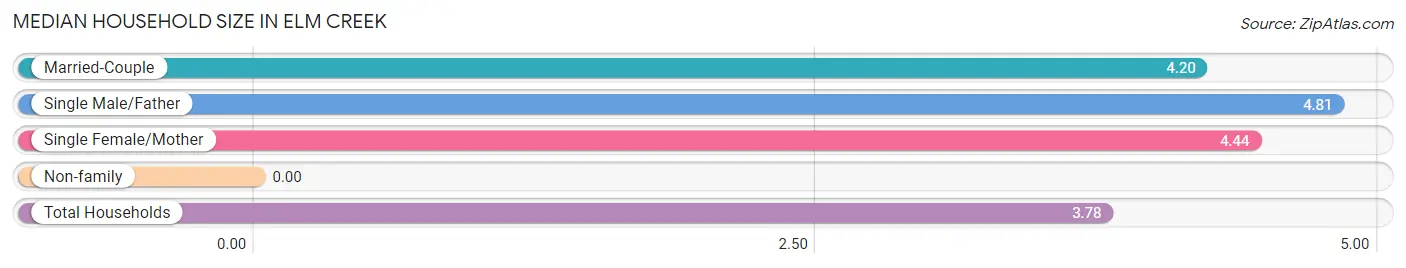
| Household Type | # Households | Household Size |
| Married-Couple | 586 (62.2%) | 4.20 |
| Single Male/Father | 26 (2.8%) | 4.81 |
| Single Female/Mother | 187 (19.9%) | 4.44 |
| Non-family | 143 (15.2%) | - |
| Total Households | 942 (100.0%) | 3.78 |
Household Size by Marriage Status in Elm Creek
Out of a total of 942 households in Elm Creek, 799 (84.8%) are family households, while 143 (15.2%) are nonfamily households. The most numerous type of family households are 5-person households, comprising 346, and the most common type of nonfamily households are 1-person households, comprising 143.
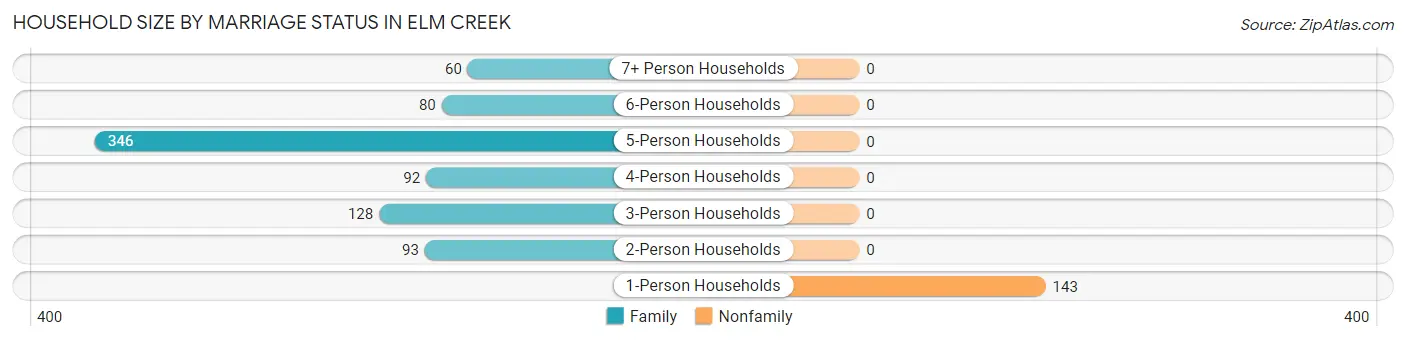
| Household Size | Family Households | Nonfamily Households |
| 1-Person Households | - | 143 (15.2%) |
| 2-Person Households | 93 (9.9%) | 0 (0.0%) |
| 3-Person Households | 128 (13.6%) | 0 (0.0%) |
| 4-Person Households | 92 (9.8%) | 0 (0.0%) |
| 5-Person Households | 346 (36.7%) | 0 (0.0%) |
| 6-Person Households | 80 (8.5%) | 0 (0.0%) |
| 7+ Person Households | 60 (6.4%) | 0 (0.0%) |
| Total | 799 (84.8%) | 143 (15.2%) |
Female Fertility in Elm Creek
Fertility by Age in Elm Creek
| Age Bracket | Women with Births | Births / 1,000 Women |
| 15 to 19 years | 0 (0.0%) | 0.0 |
| 20 to 34 years | 0 (0.0%) | 0.0 |
| 35 to 50 years | 0 (0.0%) | 0.0 |
| Total | 0 (0.0%) | 0.0 |
Fertility by Age by Marriage Status in Elm Creek
| Age Bracket | Married | Unmarried |
| 15 to 19 years | 0 (0.0%) | 0 (0.0%) |
| 20 to 34 years | 0 (0.0%) | 0 (0.0%) |
| 35 to 50 years | 0 (0.0%) | 0 (0.0%) |
| Total | 0 (0.0%) | 0 (0.0%) |
Fertility by Education in Elm Creek
| Educational Attainment | Women with Births | Births / 1,000 Women |
| Less than High School | 0 (0.0%) | 0.0 |
| High School Diploma | 0 (0.0%) | 0.0 |
| College or Associate's Degree | 0 (0.0%) | 0.0 |
| Bachelor's Degree | 0 (0.0%) | 0.0 |
| Graduate Degree | 0 (0.0%) | 0.0 |
| Total | 0 (0.0%) | 0.0 |
Fertility by Education by Marriage Status in Elm Creek
| Educational Attainment | Married | Unmarried |
| Less than High School | 0 (0.0%) | 0 (0.0%) |
| High School Diploma | 0 (0.0%) | 0 (0.0%) |
| College or Associate's Degree | 0 (0.0%) | 0 (0.0%) |
| Bachelor's Degree | 0 (0.0%) | 0 (0.0%) |
| Graduate Degree | 0 (0.0%) | 0 (0.0%) |
| Total | 0 (0.0%) | 0 (0.0%) |
Employment Characteristics in Elm Creek
Employment by Class of Employer in Elm Creek
Among the 1,572 employed individuals in Elm Creek, private company employees (1,351 | 85.9%), self-employed (not incorporated) (92 | 5.9%), and self-employed (incorporated) (49 | 3.1%) make up the most common classes of employment.
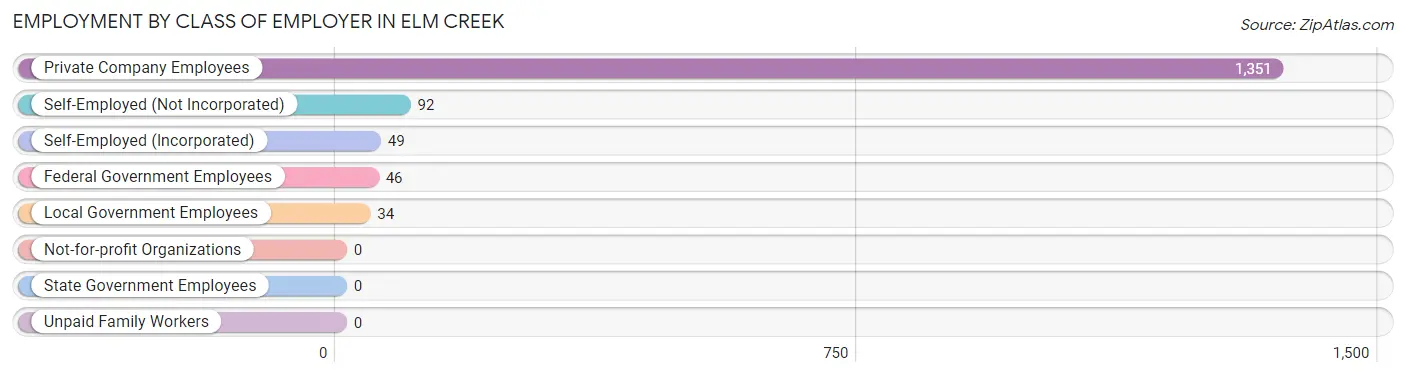
| Employer Class | # Employees | % Employees |
| Private Company Employees | 1,351 | 85.9% |
| Self-Employed (Incorporated) | 49 | 3.1% |
| Self-Employed (Not Incorporated) | 92 | 5.9% |
| Not-for-profit Organizations | 0 | 0.0% |
| Local Government Employees | 34 | 2.2% |
| State Government Employees | 0 | 0.0% |
| Federal Government Employees | 46 | 2.9% |
| Unpaid Family Workers | 0 | 0.0% |
| Total | 1,572 | 100.0% |
Employment Status by Age in Elm Creek
According to the labor force statistics for Elm Creek, out of the total population over 16 years of age (2,496), 67.6% or 1,687 individuals are in the labor force, with 6.8% or 115 of them unemployed. The age group with the highest labor force participation rate is 20 to 24 years, with 100.0% or 239 individuals in the labor force. Within the labor force, the 16 to 19 years age range has the highest percentage of unemployed individuals, with 33.3% or 60 of them being unemployed.
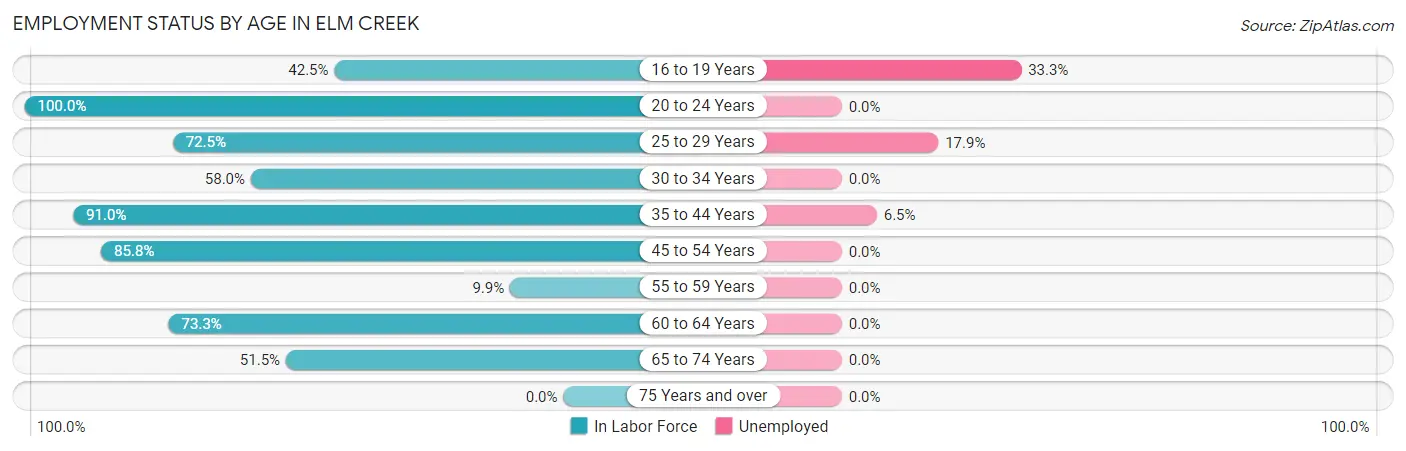
| Age Bracket | In Labor Force | Unemployed |
| 16 to 19 Years | 180 (42.5%) | 60 (33.3%) |
| 20 to 24 Years | 239 (100.0%) | 0 (0.0%) |
| 25 to 29 Years | 95 (72.5%) | 17 (17.9%) |
| 30 to 34 Years | 123 (58.0%) | 0 (0.0%) |
| 35 to 44 Years | 587 (91.0%) | 38 (6.5%) |
| 45 to 54 Years | 321 (85.8%) | 0 (0.0%) |
| 55 to 59 Years | 17 (9.9%) | 0 (0.0%) |
| 60 to 64 Years | 22 (73.3%) | 0 (0.0%) |
| 65 to 74 Years | 103 (51.5%) | 0 (0.0%) |
| 75 Years and over | 0 (0.0%) | 0 (0.0%) |
| Total | 1,687 (67.6%) | 115 (6.8%) |
Employment Status by Educational Attainment in Elm Creek
According to labor force statistics for Elm Creek, 74.5% of individuals (1,165) out of the total population between 25 and 64 years of age (1,564) are in the labor force, with 4.7% or 55 of them being unemployed. The group with the highest labor force participation rate are those with the educational attainment of bachelor's degree or higher, with 100.0% or 17 individuals in the labor force. Within the labor force, individuals with bachelor's degree or higher education have the highest percentage of unemployment, with 100.0% or 17 of them being unemployed.
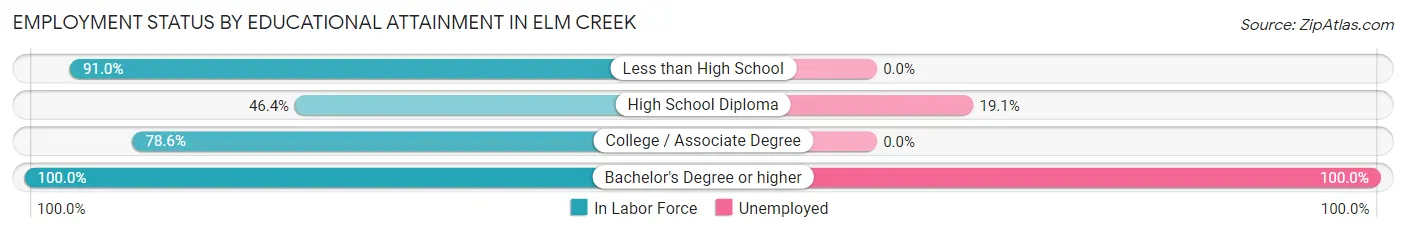
| Educational Attainment | In Labor Force | Unemployed |
| Less than High School | 515 (91.0%) | 0 (0.0%) |
| High School Diploma | 199 (46.4%) | 82 (19.1%) |
| College / Associate Degree | 434 (78.6%) | 0 (0.0%) |
| Bachelor's Degree or higher | 17 (100.0%) | 17 (100.0%) |
| Total | 1,165 (74.5%) | 74 (4.7%) |
Employment Occupations by Sex in Elm Creek
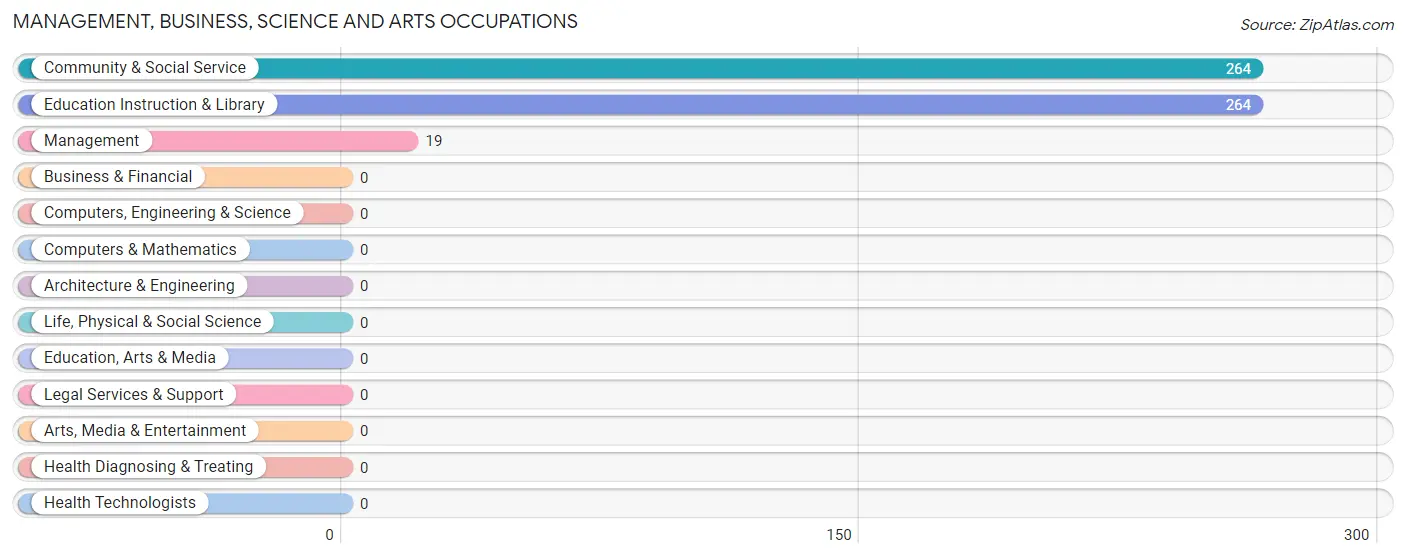
Management, Business, Science and Arts Occupations
The most common Management, Business, Science and Arts occupations in Elm Creek are Community & Social Service (264 | 16.8%), Education Instruction & Library (264 | 16.8%), and Management (19 | 1.2%).
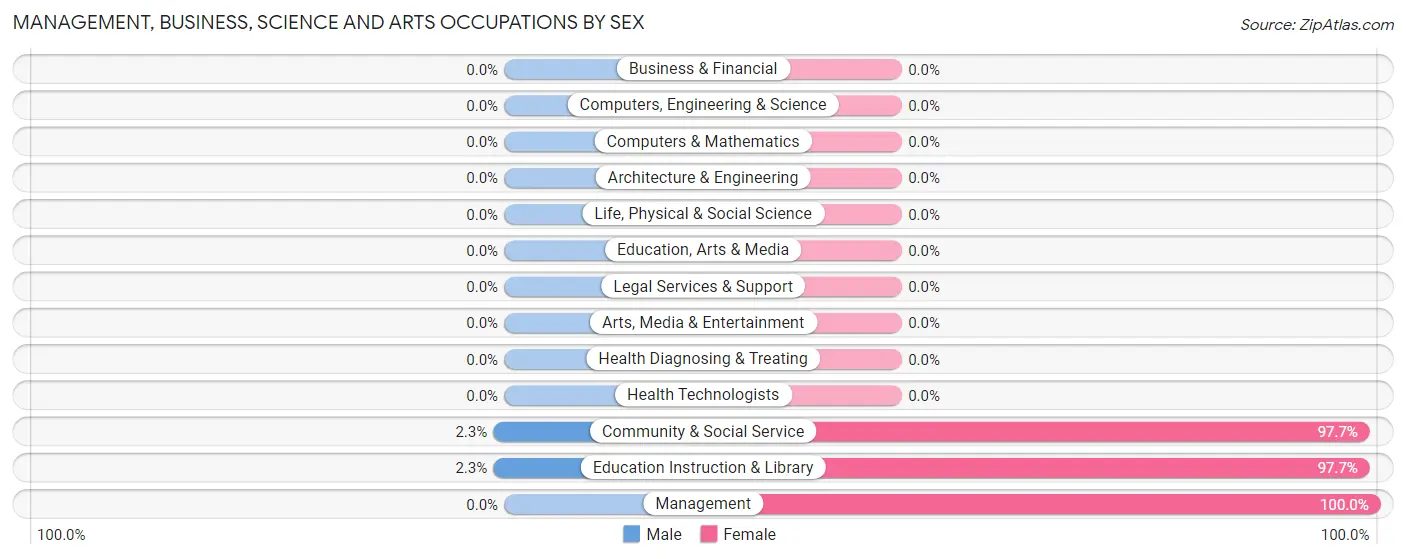
Management, Business, Science and Arts Occupations by Sex
Within the Management, Business, Science and Arts occupations in Elm Creek, the most male-oriented occupations are Community & Social Service (2.3%), and Education Instruction & Library (2.3%), while the most female-oriented occupations are Management (100.0%), Community & Social Service (97.7%), and Education Instruction & Library (97.7%).
| Occupation | Male | Female |
| Management | 0 (0.0%) | 19 (100.0%) |
| Business & Financial | 0 (0.0%) | 0 (0.0%) |
| Computers, Engineering & Science | 0 (0.0%) | 0 (0.0%) |
| Computers & Mathematics | 0 (0.0%) | 0 (0.0%) |
| Architecture & Engineering | 0 (0.0%) | 0 (0.0%) |
| Life, Physical & Social Science | 0 (0.0%) | 0 (0.0%) |
| Community & Social Service | 6 (2.3%) | 258 (97.7%) |
| Education, Arts & Media | 0 (0.0%) | 0 (0.0%) |
| Legal Services & Support | 0 (0.0%) | 0 (0.0%) |
| Education Instruction & Library | 6 (2.3%) | 258 (97.7%) |
| Arts, Media & Entertainment | 0 (0.0%) | 0 (0.0%) |
| Health Diagnosing & Treating | 0 (0.0%) | 0 (0.0%) |
| Health Technologists | 0 (0.0%) | 0 (0.0%) |
| Total (Category) | 6 (2.1%) | 277 (97.9%) |
| Total (Overall) | 794 (50.5%) | 778 (49.5%) |
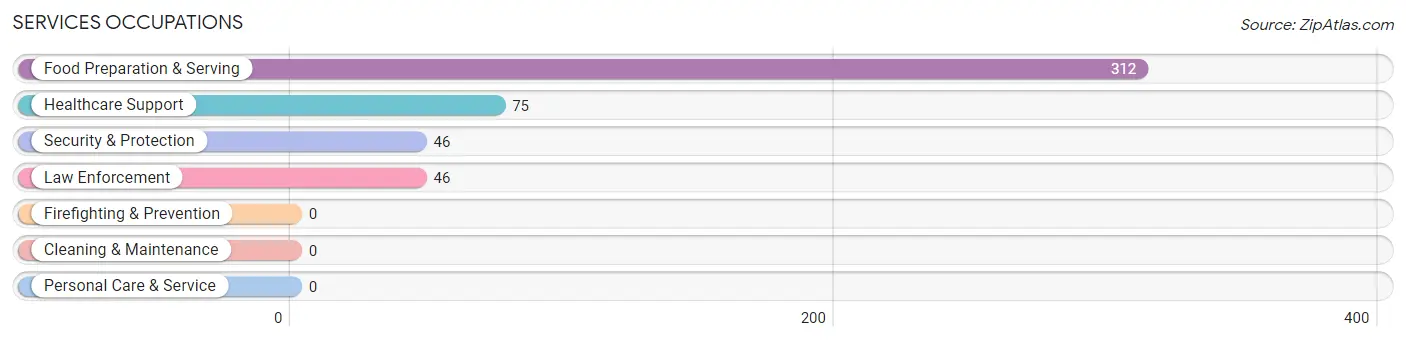
Services Occupations
The most common Services occupations in Elm Creek are Food Preparation & Serving (312 | 19.9%), Healthcare Support (75 | 4.8%), Security & Protection (46 | 2.9%), and Law Enforcement (46 | 2.9%).
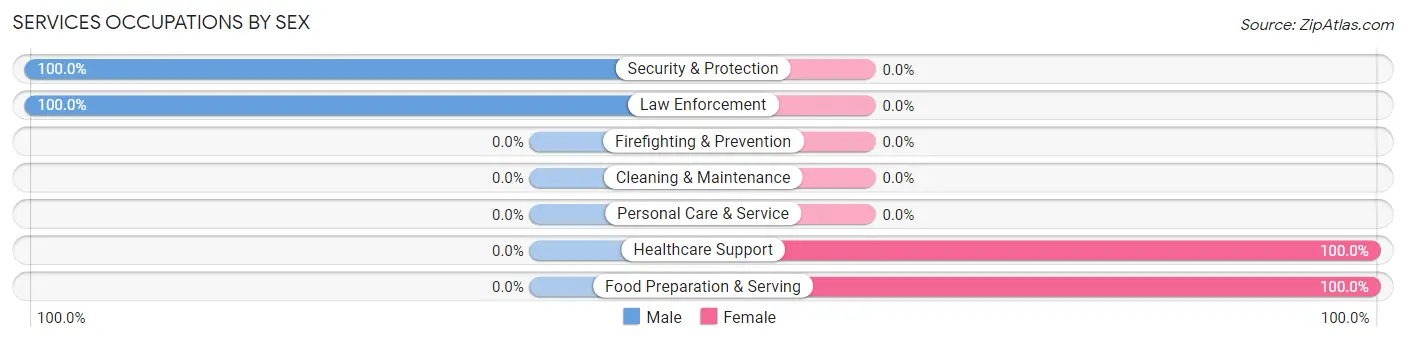
Services Occupations by Sex
Within the Services occupations in Elm Creek, the most male-oriented occupations are Security & Protection (100.0%), and Law Enforcement (100.0%), while the most female-oriented occupations are Healthcare Support (100.0%), and Food Preparation & Serving (100.0%).
| Occupation | Male | Female |
| Healthcare Support | 0 (0.0%) | 75 (100.0%) |
| Security & Protection | 46 (100.0%) | 0 (0.0%) |
| Firefighting & Prevention | 0 (0.0%) | 0 (0.0%) |
| Law Enforcement | 46 (100.0%) | 0 (0.0%) |
| Food Preparation & Serving | 0 (0.0%) | 312 (100.0%) |
| Cleaning & Maintenance | 0 (0.0%) | 0 (0.0%) |
| Personal Care & Service | 0 (0.0%) | 0 (0.0%) |
| Total (Category) | 46 (10.6%) | 387 (89.4%) |
| Total (Overall) | 794 (50.5%) | 778 (49.5%) |
Sales and Office Occupations
The most common Sales and Office occupations in Elm Creek are Sales & Related (158 | 10.1%), and Office & Administration (30 | 1.9%).
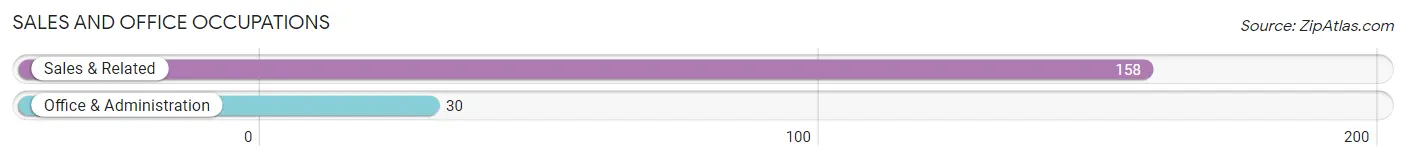
Sales and Office Occupations by Sex

| Occupation | Male | Female |
| Sales & Related | 95 (60.1%) | 63 (39.9%) |
| Office & Administration | 30 (100.0%) | 0 (0.0%) |
| Total (Category) | 125 (66.5%) | 63 (33.5%) |
| Total (Overall) | 794 (50.5%) | 778 (49.5%) |
Natural Resources, Construction and Maintenance Occupations
The most common Natural Resources, Construction and Maintenance occupations in Elm Creek are , and Construction & Extraction (314 | 20.0%).
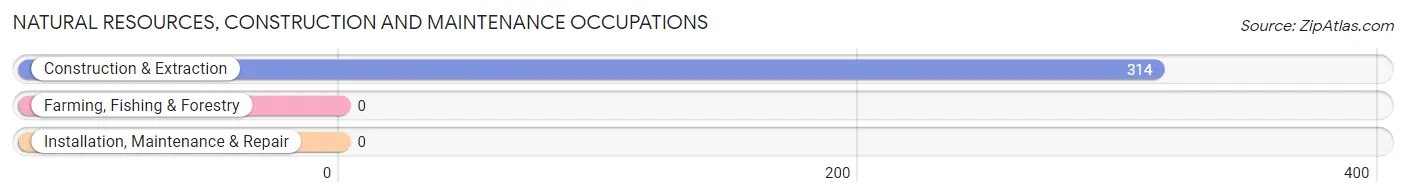
Natural Resources, Construction and Maintenance Occupations by Sex
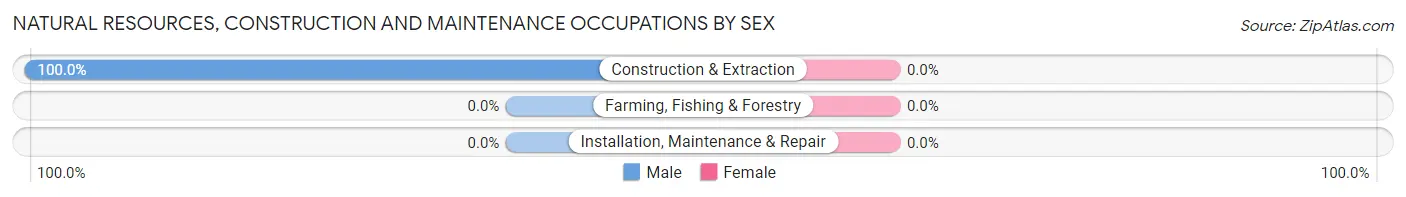
| Occupation | Male | Female |
| Farming, Fishing & Forestry | 0 (0.0%) | 0 (0.0%) |
| Construction & Extraction | 314 (100.0%) | 0 (0.0%) |
| Installation, Maintenance & Repair | 0 (0.0%) | 0 (0.0%) |
| Total (Category) | 314 (100.0%) | 0 (0.0%) |
| Total (Overall) | 794 (50.5%) | 778 (49.5%) |
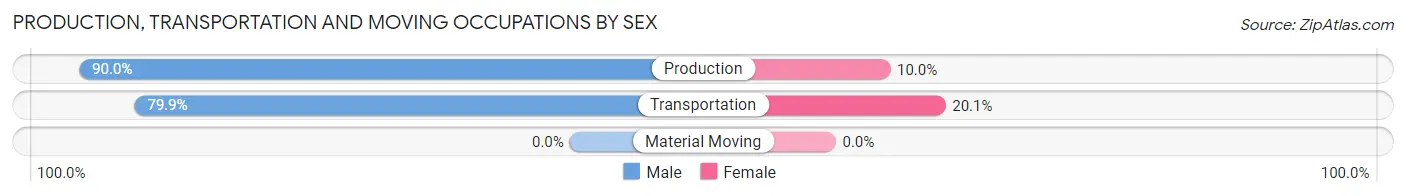
Production, Transportation and Moving Occupations
The most common Production, Transportation and Moving occupations in Elm Creek are Production (200 | 12.7%), and Transportation (154 | 9.8%).
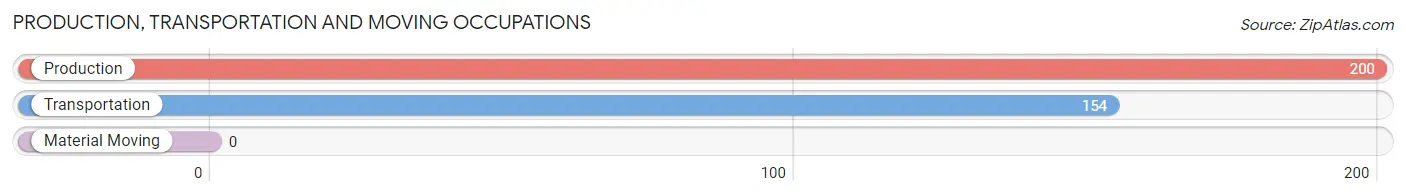
Production, Transportation and Moving Occupations by Sex
| Occupation | Male | Female |
| Production | 180 (90.0%) | 20 (10.0%) |
| Transportation | 123 (79.9%) | 31 (20.1%) |
| Material Moving | 0 (0.0%) | 0 (0.0%) |
| Total (Category) | 303 (85.6%) | 51 (14.4%) |
| Total (Overall) | 794 (50.5%) | 778 (49.5%) |
Employment Industries by Sex in Elm Creek
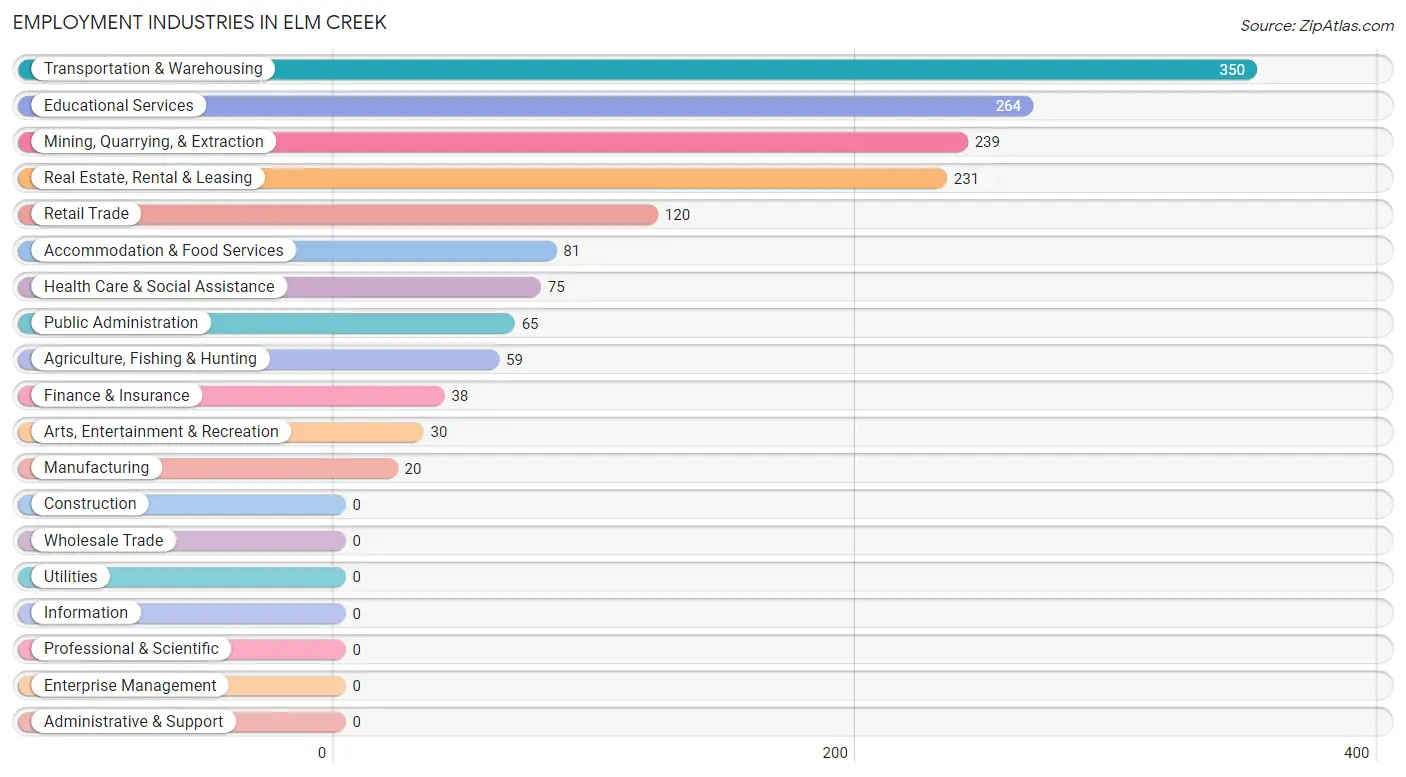
Employment Industries in Elm Creek
The major employment industries in Elm Creek include Transportation & Warehousing (350 | 22.3%), Educational Services (264 | 16.8%), Mining, Quarrying, & Extraction (239 | 15.2%), Real Estate, Rental & Leasing (231 | 14.7%), and Retail Trade (120 | 7.6%).
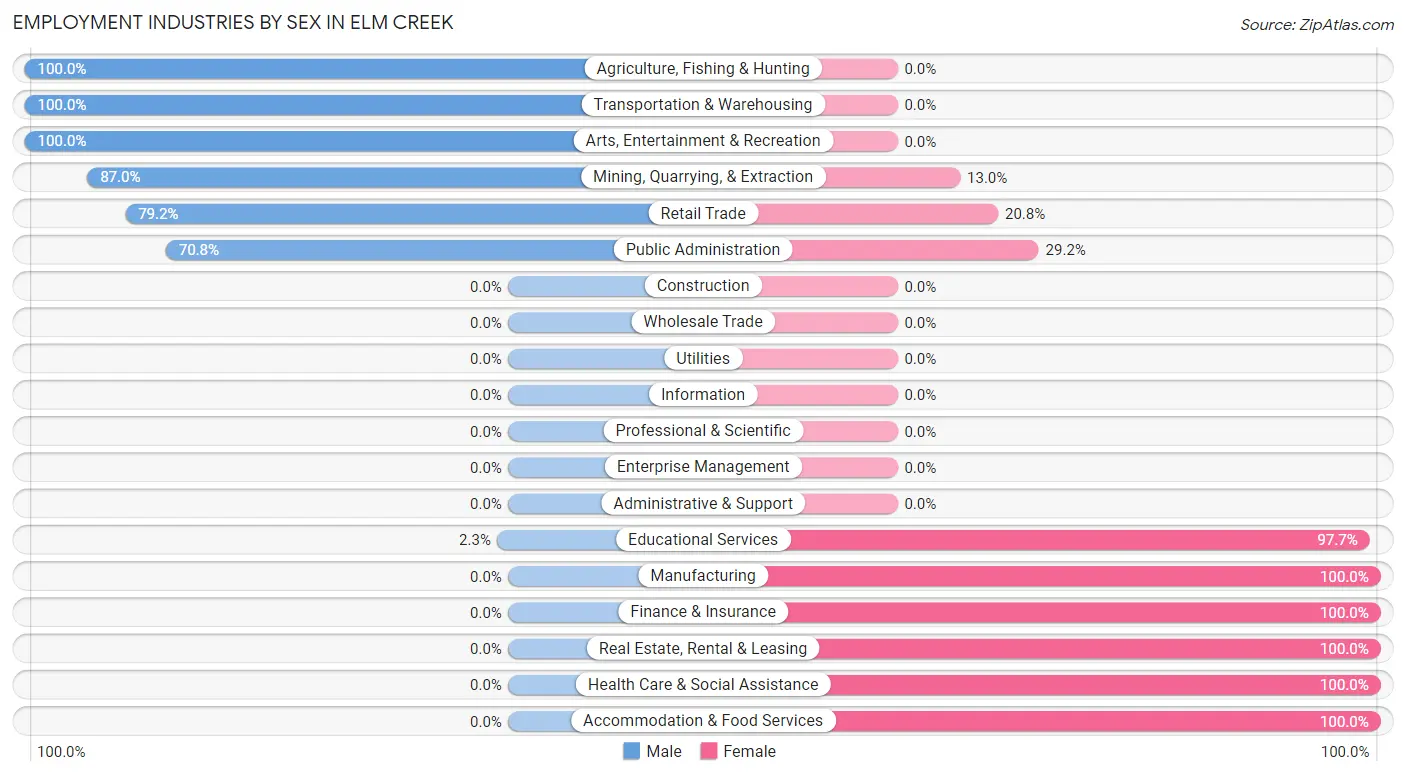
Employment Industries by Sex in Elm Creek
The Elm Creek industries that see more men than women are Agriculture, Fishing & Hunting (100.0%), Transportation & Warehousing (100.0%), and Arts, Entertainment & Recreation (100.0%), whereas the industries that tend to have a higher number of women are Manufacturing (100.0%), Finance & Insurance (100.0%), and Real Estate, Rental & Leasing (100.0%).
| Industry | Male | Female |
| Agriculture, Fishing & Hunting | 59 (100.0%) | 0 (0.0%) |
| Mining, Quarrying, & Extraction | 208 (87.0%) | 31 (13.0%) |
| Construction | 0 (0.0%) | 0 (0.0%) |
| Manufacturing | 0 (0.0%) | 20 (100.0%) |
| Wholesale Trade | 0 (0.0%) | 0 (0.0%) |
| Retail Trade | 95 (79.2%) | 25 (20.8%) |
| Transportation & Warehousing | 350 (100.0%) | 0 (0.0%) |
| Utilities | 0 (0.0%) | 0 (0.0%) |
| Information | 0 (0.0%) | 0 (0.0%) |
| Finance & Insurance | 0 (0.0%) | 38 (100.0%) |
| Real Estate, Rental & Leasing | 0 (0.0%) | 231 (100.0%) |
| Professional & Scientific | 0 (0.0%) | 0 (0.0%) |
| Enterprise Management | 0 (0.0%) | 0 (0.0%) |
| Administrative & Support | 0 (0.0%) | 0 (0.0%) |
| Educational Services | 6 (2.3%) | 258 (97.7%) |
| Health Care & Social Assistance | 0 (0.0%) | 75 (100.0%) |
| Arts, Entertainment & Recreation | 30 (100.0%) | 0 (0.0%) |
| Accommodation & Food Services | 0 (0.0%) | 81 (100.0%) |
| Public Administration | 46 (70.8%) | 19 (29.2%) |
| Total | 794 (50.5%) | 778 (49.5%) |
Education in Elm Creek
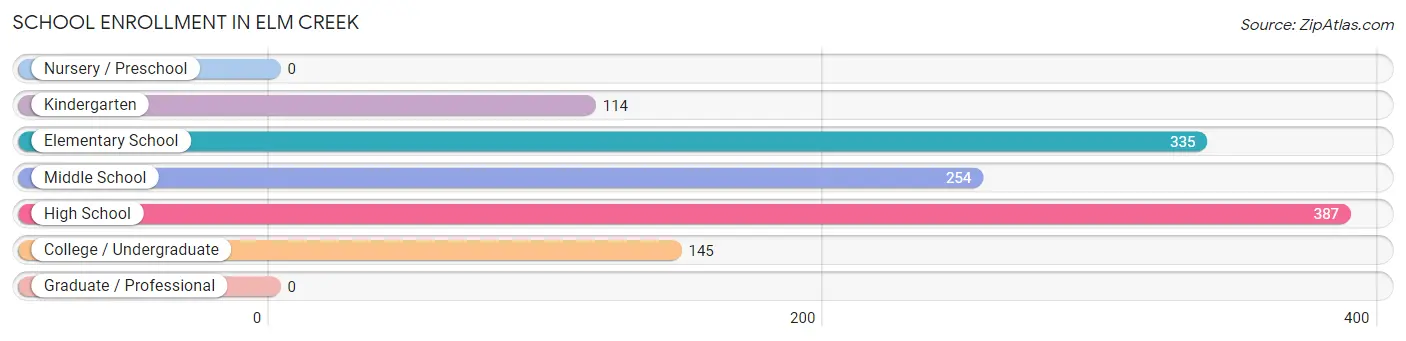
School Enrollment in Elm Creek
The most common levels of schooling among the 1,235 students in Elm Creek are high school (387 | 31.3%), elementary school (335 | 27.1%), and middle school (254 | 20.6%).
| School Level | # Students | % Students |
| Nursery / Preschool | 0 | 0.0% |
| Kindergarten | 114 | 9.2% |
| Elementary School | 335 | 27.1% |
| Middle School | 254 | 20.6% |
| High School | 387 | 31.3% |
| College / Undergraduate | 145 | 11.7% |
| Graduate / Professional | 0 | 0.0% |
| Total | 1,235 | 100.0% |
School Enrollment by Age by Funding Source in Elm Creek
Out of a total of 1,235 students who are enrolled in schools in Elm Creek, 169 (13.7%) attend a private institution, while the remaining 1,066 (86.3%) are enrolled in public schools. The age group of 15 to 17 year olds has the highest likelihood of being enrolled in private schools, with 169 (72.2% in the age bracket) enrolled. Conversely, the age group of 5 to 9 year old has the lowest likelihood of being enrolled in a private school, with 449 (100.0% in the age bracket) attending a public institution.
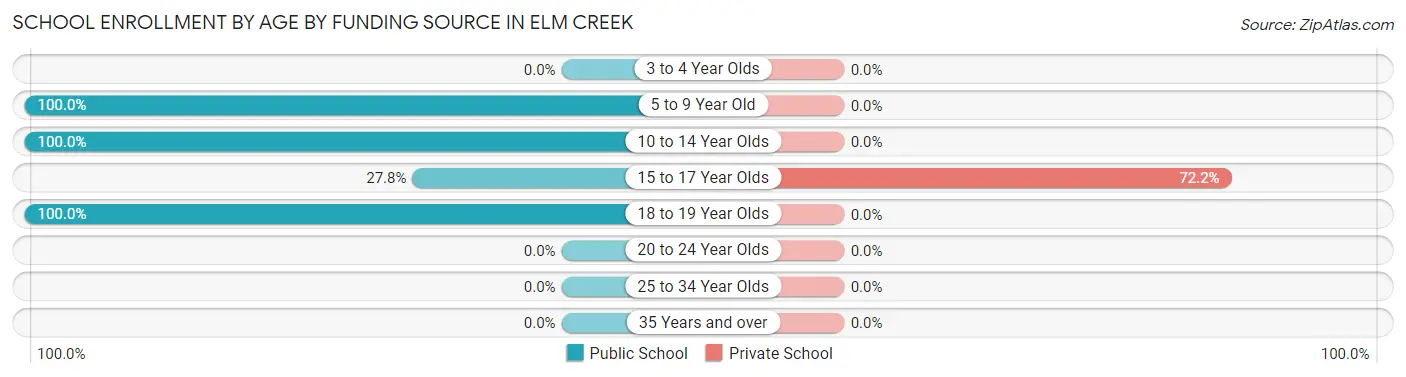
| Age Bracket | Public School | Private School |
| 3 to 4 Year Olds | 0 (0.0%) | 0 (0.0%) |
| 5 to 9 Year Old | 449 (100.0%) | 0 (0.0%) |
| 10 to 14 Year Olds | 296 (100.0%) | 0 (0.0%) |
| 15 to 17 Year Olds | 65 (27.8%) | 169 (72.2%) |
| 18 to 19 Year Olds | 256 (100.0%) | 0 (0.0%) |
| 20 to 24 Year Olds | 0 (0.0%) | 0 (0.0%) |
| 25 to 34 Year Olds | 0 (0.0%) | 0 (0.0%) |
| 35 Years and over | 0 (0.0%) | 0 (0.0%) |
| Total | 1,066 (86.3%) | 169 (13.7%) |
Educational Attainment by Field of Study in Elm Creek
Engineering (24 | 51.1%), business (17 | 36.2%), and computers & mathematics (6 | 12.8%) are the most common fields of study among 47 individuals in Elm Creek who have obtained a bachelor's degree or higher.
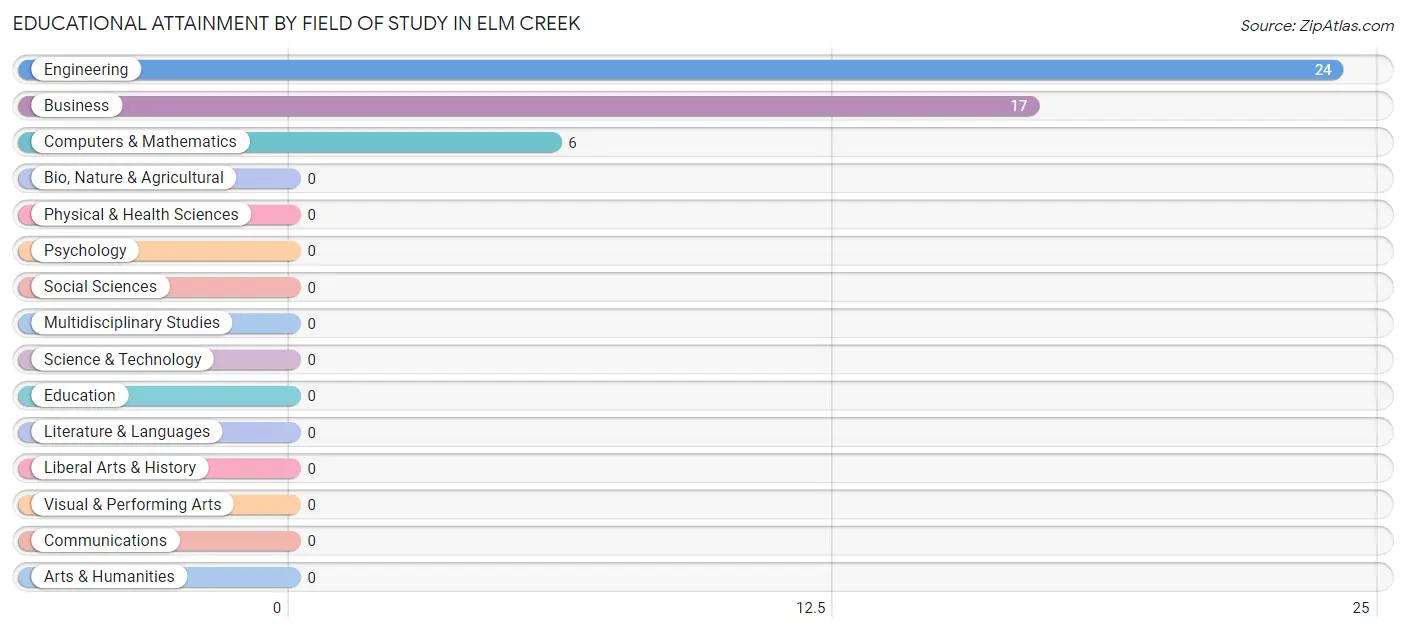
| Field of Study | # Graduates | % Graduates |
| Computers & Mathematics | 6 | 12.8% |
| Bio, Nature & Agricultural | 0 | 0.0% |
| Physical & Health Sciences | 0 | 0.0% |
| Psychology | 0 | 0.0% |
| Social Sciences | 0 | 0.0% |
| Engineering | 24 | 51.1% |
| Multidisciplinary Studies | 0 | 0.0% |
| Science & Technology | 0 | 0.0% |
| Business | 17 | 36.2% |
| Education | 0 | 0.0% |
| Literature & Languages | 0 | 0.0% |
| Liberal Arts & History | 0 | 0.0% |
| Visual & Performing Arts | 0 | 0.0% |
| Communications | 0 | 0.0% |
| Arts & Humanities | 0 | 0.0% |
| Total | 47 | 100.0% |
Transportation & Commute in Elm Creek
Vehicle Availability by Sex in Elm Creek
The most prevalent vehicle ownership categories in Elm Creek are males with 1 vehicle (308, accounting for 38.8%) and females with 1 vehicle (193, making up 39.6%).
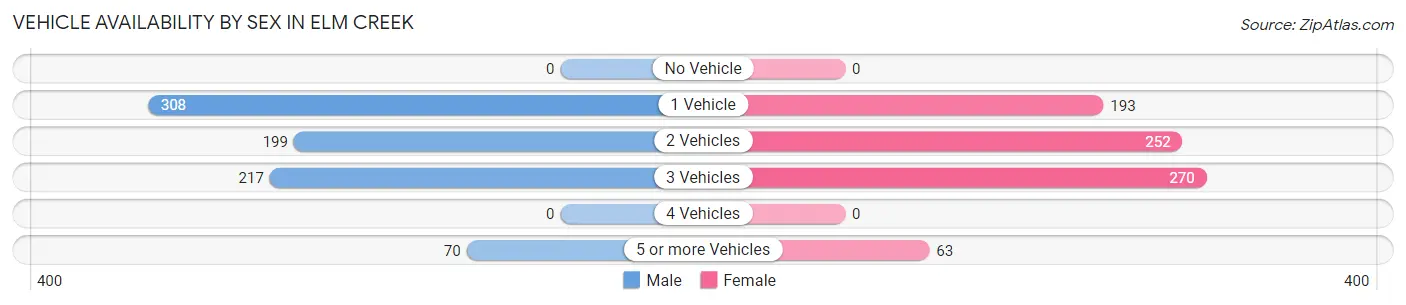
| Vehicles Available | Male | Female |
| No Vehicle | 0 (0.0%) | 0 (0.0%) |
| 1 Vehicle | 308 (38.8%) | 193 (24.8%) |
| 2 Vehicles | 199 (25.1%) | 252 (32.4%) |
| 3 Vehicles | 217 (27.3%) | 270 (34.7%) |
| 4 Vehicles | 0 (0.0%) | 0 (0.0%) |
| 5 or more Vehicles | 70 (8.8%) | 63 (8.1%) |
| Total | 794 (100.0%) | 778 (100.0%) |
Commute Time in Elm Creek
The most frequently occuring commute durations in Elm Creek are 15 to 19 minutes (359 commuters, 25.7%), 30 to 34 minutes (341 commuters, 24.4%), and 20 to 24 minutes (194 commuters, 13.9%).
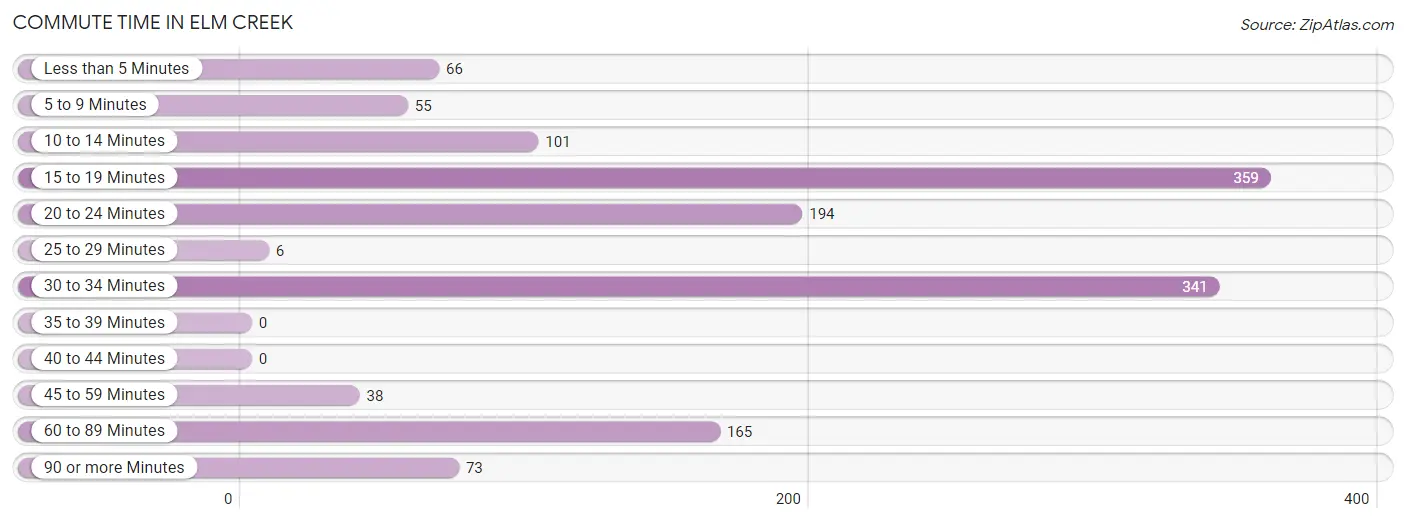
| Commute Time | # Commuters | % Commuters |
| Less than 5 Minutes | 66 | 4.7% |
| 5 to 9 Minutes | 55 | 3.9% |
| 10 to 14 Minutes | 101 | 7.2% |
| 15 to 19 Minutes | 359 | 25.7% |
| 20 to 24 Minutes | 194 | 13.9% |
| 25 to 29 Minutes | 6 | 0.4% |
| 30 to 34 Minutes | 341 | 24.4% |
| 35 to 39 Minutes | 0 | 0.0% |
| 40 to 44 Minutes | 0 | 0.0% |
| 45 to 59 Minutes | 38 | 2.7% |
| 60 to 89 Minutes | 165 | 11.8% |
| 90 or more Minutes | 73 | 5.2% |
Commute Time by Sex in Elm Creek
The most common commute times in Elm Creek are 30 to 34 minutes (341 commuters, 44.1%) for males and 20 to 24 minutes (182 commuters, 29.1%) for females.
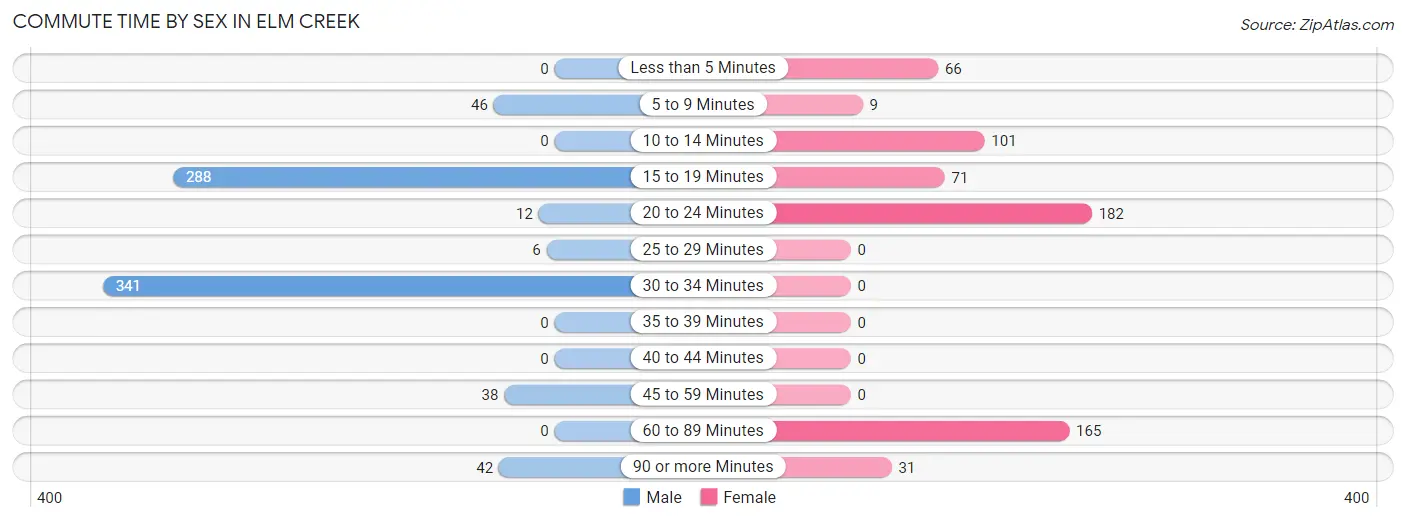
| Commute Time | Male | Female |
| Less than 5 Minutes | 0 (0.0%) | 66 (10.6%) |
| 5 to 9 Minutes | 46 (5.9%) | 9 (1.4%) |
| 10 to 14 Minutes | 0 (0.0%) | 101 (16.2%) |
| 15 to 19 Minutes | 288 (37.3%) | 71 (11.4%) |
| 20 to 24 Minutes | 12 (1.5%) | 182 (29.1%) |
| 25 to 29 Minutes | 6 (0.8%) | 0 (0.0%) |
| 30 to 34 Minutes | 341 (44.1%) | 0 (0.0%) |
| 35 to 39 Minutes | 0 (0.0%) | 0 (0.0%) |
| 40 to 44 Minutes | 0 (0.0%) | 0 (0.0%) |
| 45 to 59 Minutes | 38 (4.9%) | 0 (0.0%) |
| 60 to 89 Minutes | 0 (0.0%) | 165 (26.4%) |
| 90 or more Minutes | 42 (5.4%) | 31 (5.0%) |
Time of Departure to Work by Sex in Elm Creek
The most frequent times of departure to work in Elm Creek are 6:00 AM to 6:29 AM (265, 34.3%) for males and 7:30 AM to 7:59 AM (202, 32.3%) for females.
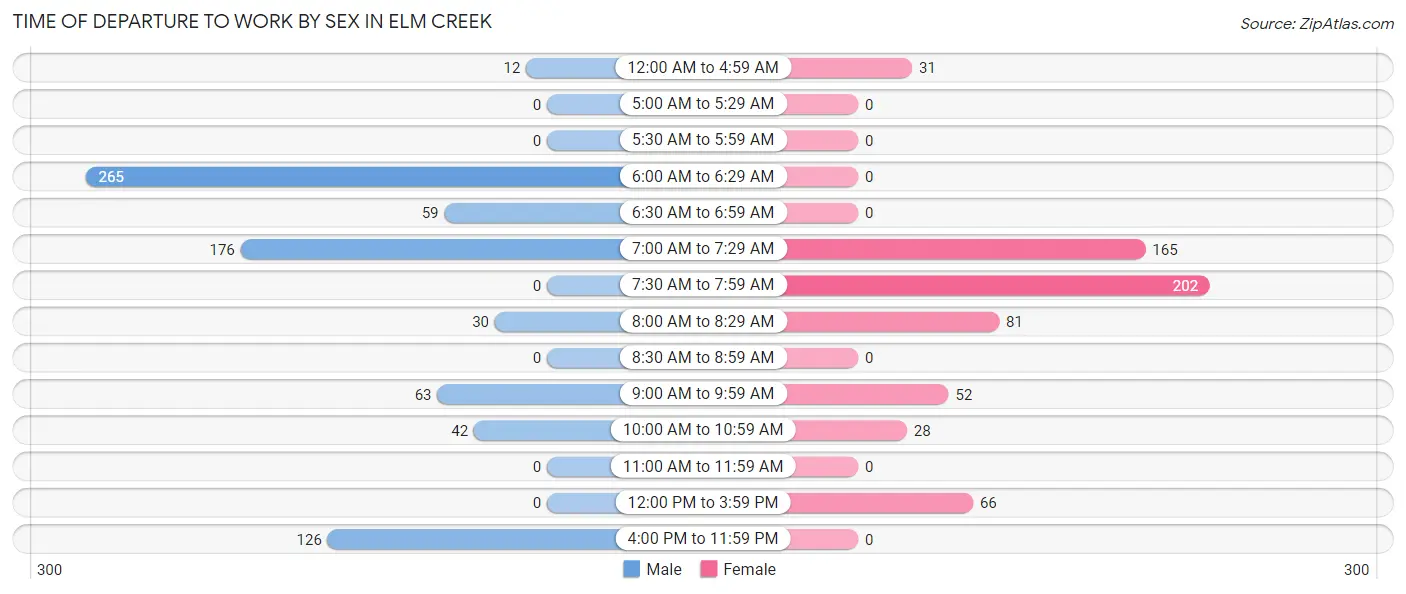
| Time of Departure | Male | Female |
| 12:00 AM to 4:59 AM | 12 (1.5%) | 31 (5.0%) |
| 5:00 AM to 5:29 AM | 0 (0.0%) | 0 (0.0%) |
| 5:30 AM to 5:59 AM | 0 (0.0%) | 0 (0.0%) |
| 6:00 AM to 6:29 AM | 265 (34.3%) | 0 (0.0%) |
| 6:30 AM to 6:59 AM | 59 (7.6%) | 0 (0.0%) |
| 7:00 AM to 7:29 AM | 176 (22.8%) | 165 (26.4%) |
| 7:30 AM to 7:59 AM | 0 (0.0%) | 202 (32.3%) |
| 8:00 AM to 8:29 AM | 30 (3.9%) | 81 (13.0%) |
| 8:30 AM to 8:59 AM | 0 (0.0%) | 0 (0.0%) |
| 9:00 AM to 9:59 AM | 63 (8.2%) | 52 (8.3%) |
| 10:00 AM to 10:59 AM | 42 (5.4%) | 28 (4.5%) |
| 11:00 AM to 11:59 AM | 0 (0.0%) | 0 (0.0%) |
| 12:00 PM to 3:59 PM | 0 (0.0%) | 66 (10.6%) |
| 4:00 PM to 11:59 PM | 126 (16.3%) | 0 (0.0%) |
| Total | 773 (100.0%) | 625 (100.0%) |
Housing Occupancy in Elm Creek
Occupancy by Ownership in Elm Creek
Of the total 942 dwellings in Elm Creek, owner-occupied units account for 808 (85.8%), while renter-occupied units make up 134 (14.2%).
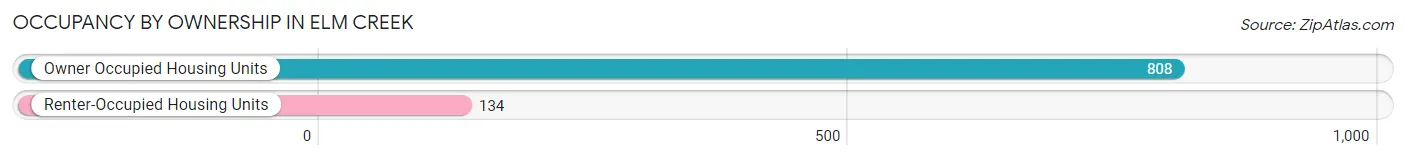
| Occupancy | # Housing Units | % Housing Units |
| Owner Occupied Housing Units | 808 | 85.8% |
| Renter-Occupied Housing Units | 134 | 14.2% |
| Total Occupied Housing Units | 942 | 100.0% |
Occupancy by Household Size in Elm Creek
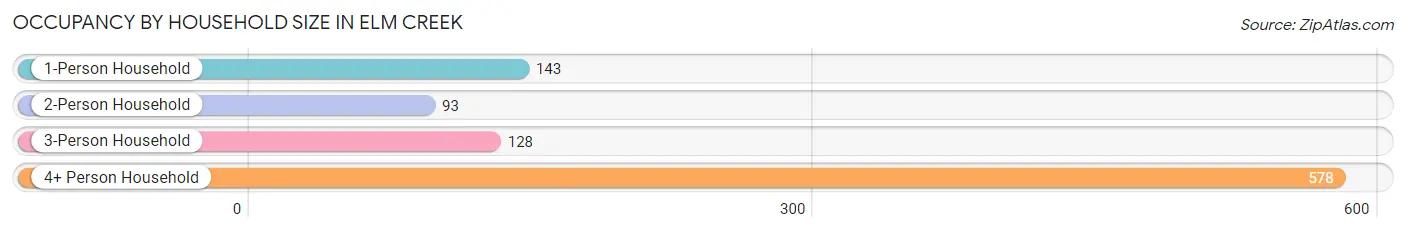
| Household Size | # Housing Units | % Housing Units |
| 1-Person Household | 143 | 15.2% |
| 2-Person Household | 93 | 9.9% |
| 3-Person Household | 128 | 13.6% |
| 4+ Person Household | 578 | 61.4% |
| Total Housing Units | 942 | 100.0% |
Occupancy by Ownership by Household Size in Elm Creek
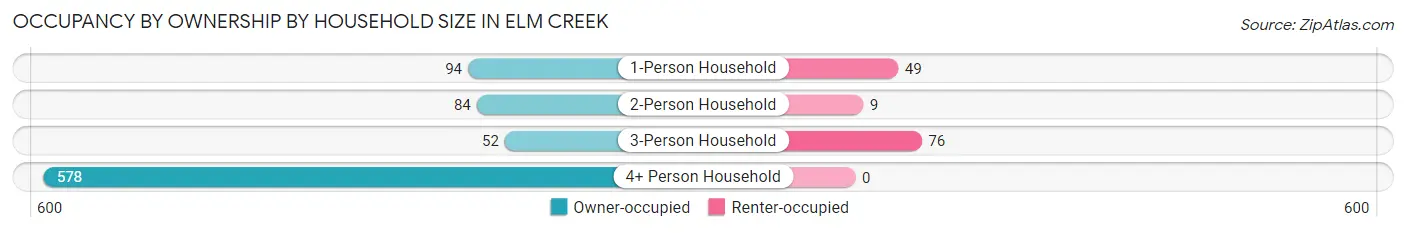
| Household Size | Owner-occupied | Renter-occupied |
| 1-Person Household | 94 (65.7%) | 49 (34.3%) |
| 2-Person Household | 84 (90.3%) | 9 (9.7%) |
| 3-Person Household | 52 (40.6%) | 76 (59.4%) |
| 4+ Person Household | 578 (100.0%) | 0 (0.0%) |
| Total Housing Units | 808 (85.8%) | 134 (14.2%) |
Occupancy by Educational Attainment in Elm Creek
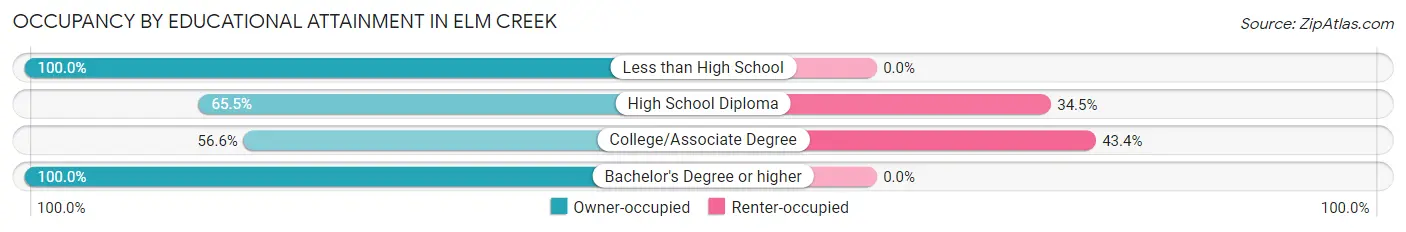
| Household Size | Owner-occupied | Renter-occupied |
| Less than High School | 569 (100.0%) | 0 (0.0%) |
| High School Diploma | 110 (65.5%) | 58 (34.5%) |
| College/Associate Degree | 99 (56.6%) | 76 (43.4%) |
| Bachelor's Degree or higher | 30 (100.0%) | 0 (0.0%) |
Occupancy by Age of Householder in Elm Creek
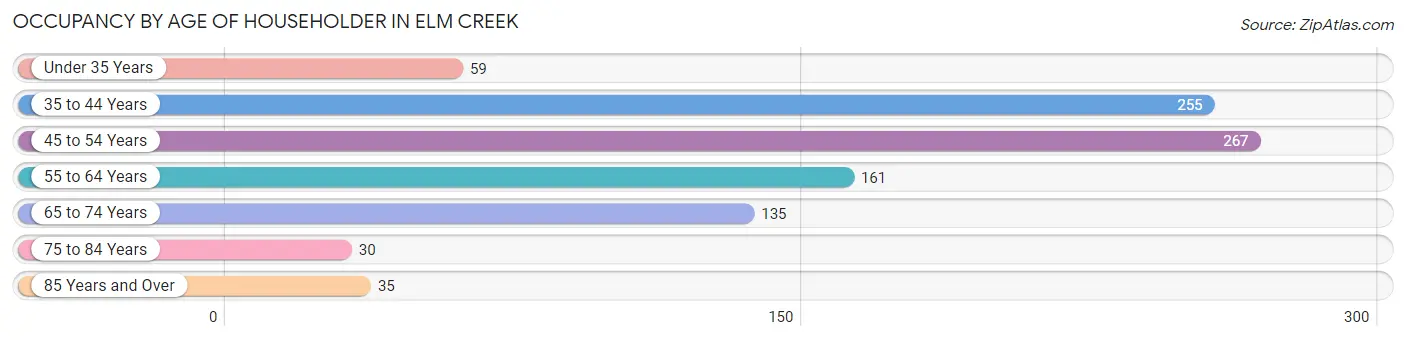
| Age Bracket | # Households | % Households |
| Under 35 Years | 59 | 6.3% |
| 35 to 44 Years | 255 | 27.1% |
| 45 to 54 Years | 267 | 28.3% |
| 55 to 64 Years | 161 | 17.1% |
| 65 to 74 Years | 135 | 14.3% |
| 75 to 84 Years | 30 | 3.2% |
| 85 Years and Over | 35 | 3.7% |
| Total | 942 | 100.0% |
Housing Finances in Elm Creek
Median Income by Occupancy in Elm Creek
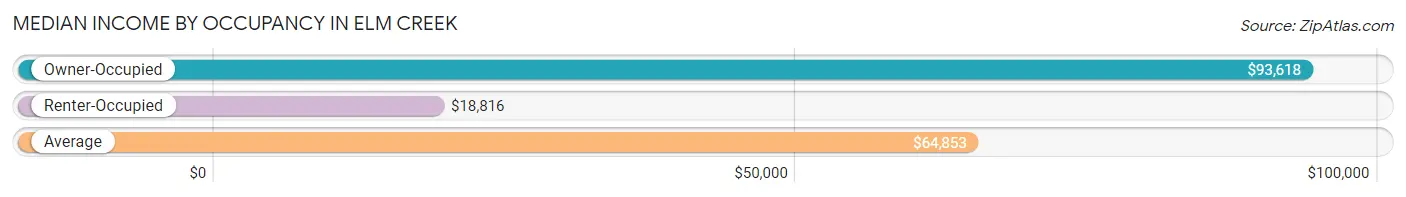
| Occupancy Type | # Households | Median Income |
| Owner-Occupied | 808 (85.8%) | $93,618 |
| Renter-Occupied | 134 (14.2%) | $18,816 |
| Average | 942 (100.0%) | $64,853 |
Occupancy by Householder Income Bracket in Elm Creek
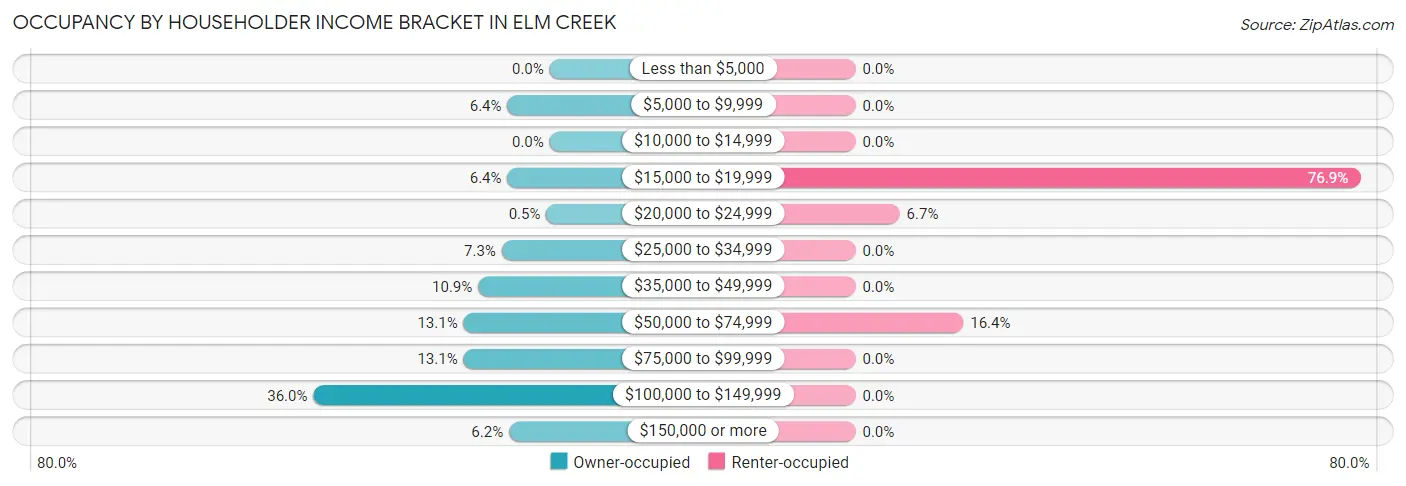
| Income Bracket | Owner-occupied | Renter-occupied |
| Less than $5,000 | 0 (0.0%) | 0 (0.0%) |
| $5,000 to $9,999 | 52 (6.4%) | 0 (0.0%) |
| $10,000 to $14,999 | 0 (0.0%) | 0 (0.0%) |
| $15,000 to $19,999 | 52 (6.4%) | 103 (76.9%) |
| $20,000 to $24,999 | 4 (0.5%) | 9 (6.7%) |
| $25,000 to $34,999 | 59 (7.3%) | 0 (0.0%) |
| $35,000 to $49,999 | 88 (10.9%) | 0 (0.0%) |
| $50,000 to $74,999 | 106 (13.1%) | 22 (16.4%) |
| $75,000 to $99,999 | 106 (13.1%) | 0 (0.0%) |
| $100,000 to $149,999 | 291 (36.0%) | 0 (0.0%) |
| $150,000 or more | 50 (6.2%) | 0 (0.0%) |
| Total | 808 (100.0%) | 134 (100.0%) |
Monthly Housing Cost Tiers in Elm Creek
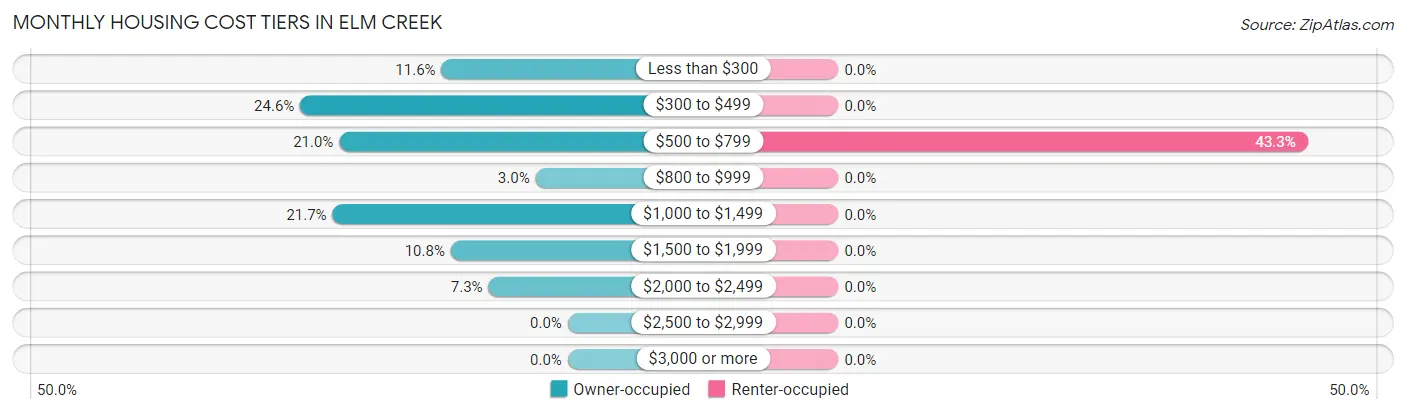
| Monthly Cost | Owner-occupied | Renter-occupied |
| Less than $300 | 94 (11.6%) | 0 (0.0%) |
| $300 to $499 | 199 (24.6%) | 0 (0.0%) |
| $500 to $799 | 170 (21.0%) | 58 (43.3%) |
| $800 to $999 | 24 (3.0%) | 0 (0.0%) |
| $1,000 to $1,499 | 175 (21.7%) | 0 (0.0%) |
| $1,500 to $1,999 | 87 (10.8%) | 0 (0.0%) |
| $2,000 to $2,499 | 59 (7.3%) | 0 (0.0%) |
| $2,500 to $2,999 | 0 (0.0%) | 0 (0.0%) |
| $3,000 or more | 0 (0.0%) | 0 (0.0%) |
| Total | 808 (100.0%) | 134 (100.0%) |
Physical Housing Characteristics in Elm Creek
Housing Structures in Elm Creek
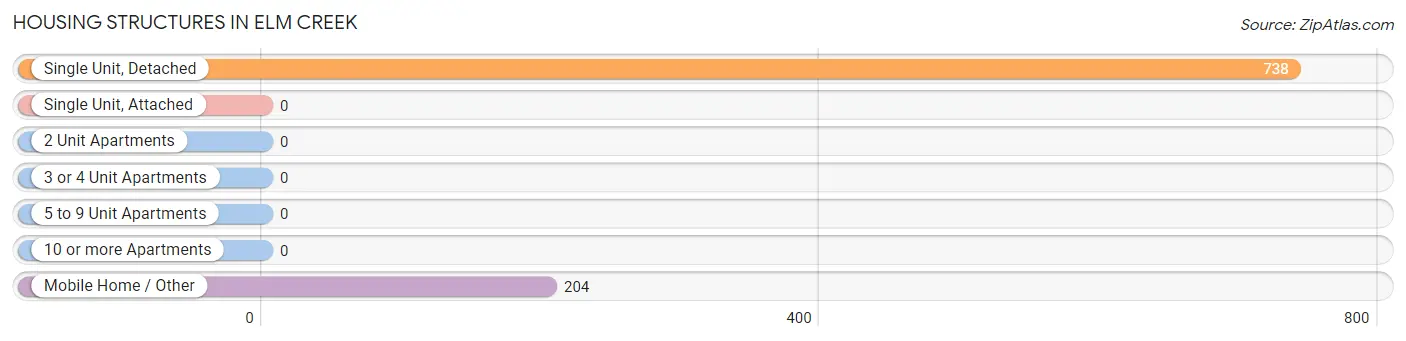
| Structure Type | # Housing Units | % Housing Units |
| Single Unit, Detached | 738 | 78.3% |
| Single Unit, Attached | 0 | 0.0% |
| 2 Unit Apartments | 0 | 0.0% |
| 3 or 4 Unit Apartments | 0 | 0.0% |
| 5 to 9 Unit Apartments | 0 | 0.0% |
| 10 or more Apartments | 0 | 0.0% |
| Mobile Home / Other | 204 | 21.7% |
| Total | 942 | 100.0% |
Housing Structures by Occupancy in Elm Creek
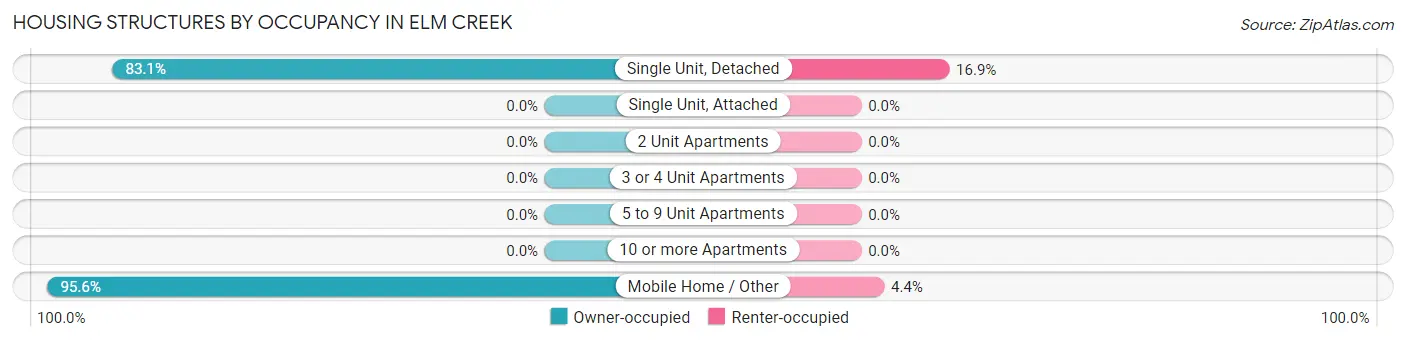
| Structure Type | Owner-occupied | Renter-occupied |
| Single Unit, Detached | 613 (83.1%) | 125 (16.9%) |
| Single Unit, Attached | 0 (0.0%) | 0 (0.0%) |
| 2 Unit Apartments | 0 (0.0%) | 0 (0.0%) |
| 3 or 4 Unit Apartments | 0 (0.0%) | 0 (0.0%) |
| 5 to 9 Unit Apartments | 0 (0.0%) | 0 (0.0%) |
| 10 or more Apartments | 0 (0.0%) | 0 (0.0%) |
| Mobile Home / Other | 195 (95.6%) | 9 (4.4%) |
| Total | 808 (85.8%) | 134 (14.2%) |
Housing Structures by Number of Rooms in Elm Creek
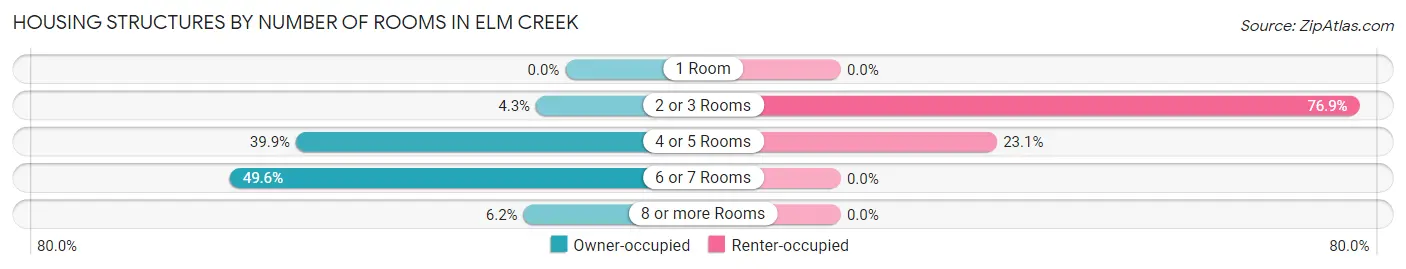
| Number of Rooms | Owner-occupied | Renter-occupied |
| 1 Room | 0 (0.0%) | 0 (0.0%) |
| 2 or 3 Rooms | 35 (4.3%) | 103 (76.9%) |
| 4 or 5 Rooms | 322 (39.9%) | 31 (23.1%) |
| 6 or 7 Rooms | 401 (49.6%) | 0 (0.0%) |
| 8 or more Rooms | 50 (6.2%) | 0 (0.0%) |
| Total | 808 (100.0%) | 134 (100.0%) |
Housing Structure by Heating Type in Elm Creek
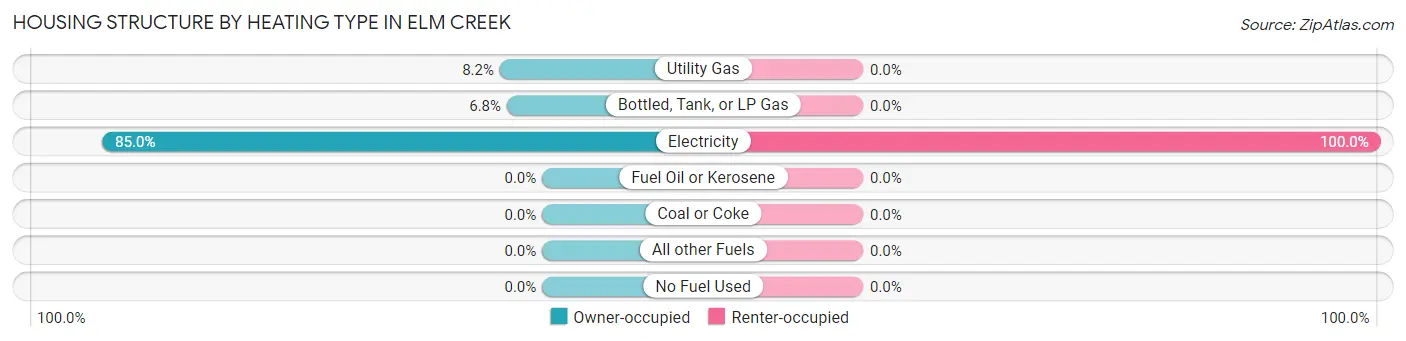
| Heating Type | Owner-occupied | Renter-occupied |
| Utility Gas | 66 (8.2%) | 0 (0.0%) |
| Bottled, Tank, or LP Gas | 55 (6.8%) | 0 (0.0%) |
| Electricity | 687 (85.0%) | 134 (100.0%) |
| Fuel Oil or Kerosene | 0 (0.0%) | 0 (0.0%) |
| Coal or Coke | 0 (0.0%) | 0 (0.0%) |
| All other Fuels | 0 (0.0%) | 0 (0.0%) |
| No Fuel Used | 0 (0.0%) | 0 (0.0%) |
| Total | 808 (100.0%) | 134 (100.0%) |
Household Vehicle Usage in Elm Creek
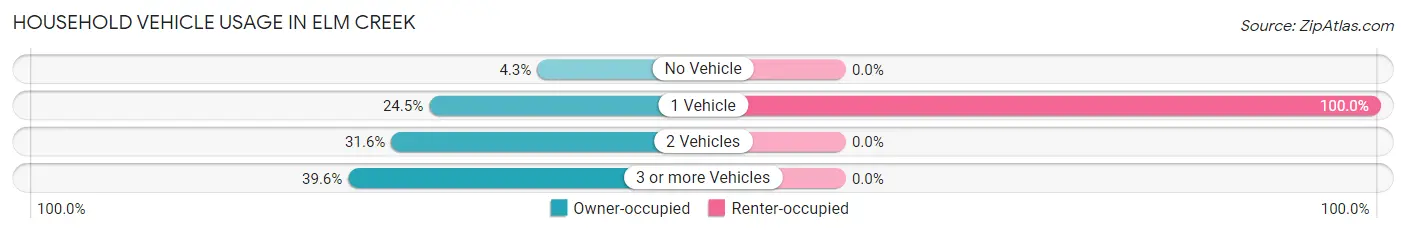
| Vehicles per Household | Owner-occupied | Renter-occupied |
| No Vehicle | 35 (4.3%) | 0 (0.0%) |
| 1 Vehicle | 198 (24.5%) | 134 (100.0%) |
| 2 Vehicles | 255 (31.6%) | 0 (0.0%) |
| 3 or more Vehicles | 320 (39.6%) | 0 (0.0%) |
| Total | 808 (100.0%) | 134 (100.0%) |
Real Estate & Mortgages in Elm Creek
Real Estate and Mortgage Overview in Elm Creek
| Characteristic | Without Mortgage | With Mortgage |
| Housing Units | 327 | 481 |
| Median Property Value | $67,600 | $117,100 |
| Median Household Income | - | - |
| Monthly Housing Costs | $418 | $0 |
| Real Estate Taxes | $544 | $0 |
Property Value by Mortgage Status in Elm Creek
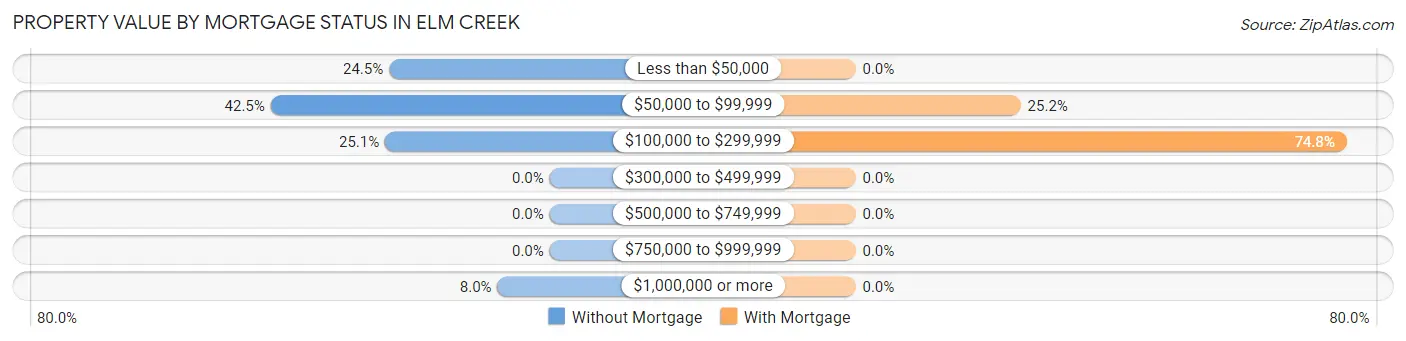
| Property Value | Without Mortgage | With Mortgage |
| Less than $50,000 | 80 (24.5%) | 0 (0.0%) |
| $50,000 to $99,999 | 139 (42.5%) | 121 (25.2%) |
| $100,000 to $299,999 | 82 (25.1%) | 360 (74.8%) |
| $300,000 to $499,999 | 0 (0.0%) | 0 (0.0%) |
| $500,000 to $749,999 | 0 (0.0%) | 0 (0.0%) |
| $750,000 to $999,999 | 0 (0.0%) | 0 (0.0%) |
| $1,000,000 or more | 26 (8.0%) | 0 (0.0%) |
| Total | 327 (100.0%) | 481 (100.0%) |
Household Income by Mortgage Status in Elm Creek
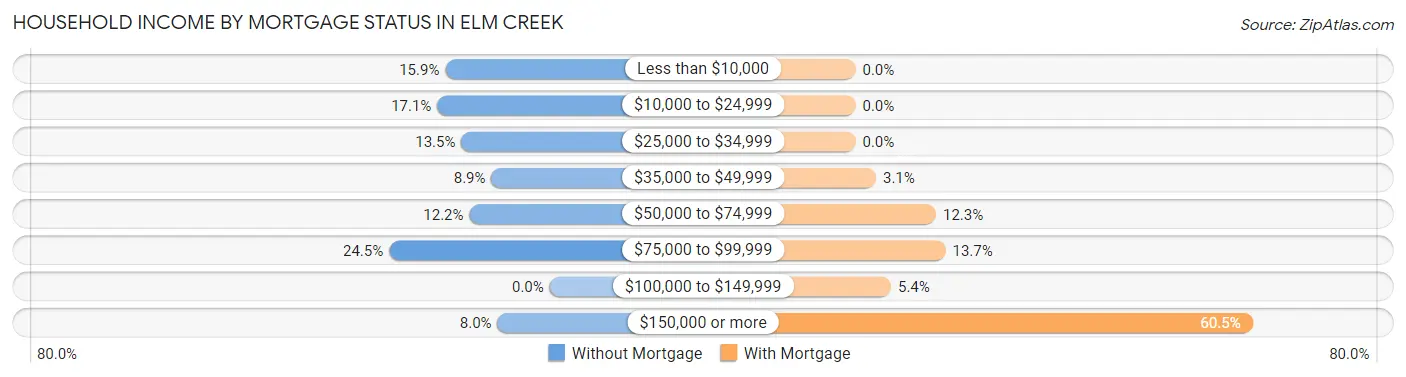
| Household Income | Without Mortgage | With Mortgage |
| Less than $10,000 | 52 (15.9%) | 0 (0.0%) |
| $10,000 to $24,999 | 56 (17.1%) | 0 (0.0%) |
| $25,000 to $34,999 | 44 (13.5%) | 0 (0.0%) |
| $35,000 to $49,999 | 29 (8.9%) | 15 (3.1%) |
| $50,000 to $74,999 | 40 (12.2%) | 59 (12.3%) |
| $75,000 to $99,999 | 80 (24.5%) | 66 (13.7%) |
| $100,000 to $149,999 | 0 (0.0%) | 26 (5.4%) |
| $150,000 or more | 26 (8.0%) | 291 (60.5%) |
| Total | 327 (100.0%) | 481 (100.0%) |
Property Value to Household Income Ratio in Elm Creek
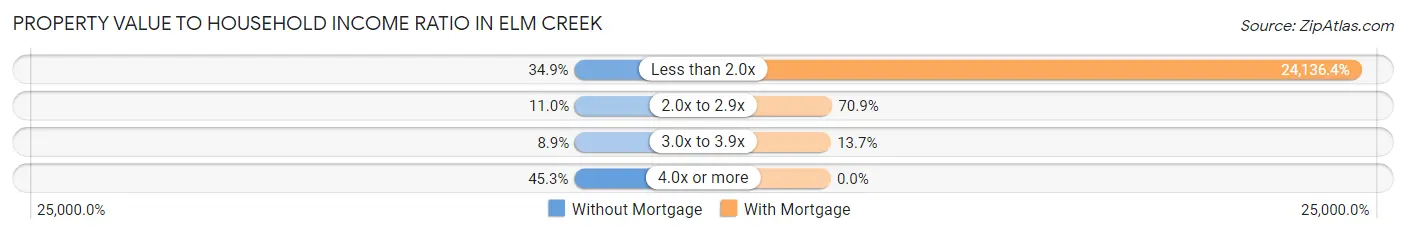
| Value-to-Income Ratio | Without Mortgage | With Mortgage |
| Less than 2.0x | 114 (34.9%) | 116,096 (24,136.4%) |
| 2.0x to 2.9x | 36 (11.0%) | 341 (70.9%) |
| 3.0x to 3.9x | 29 (8.9%) | 66 (13.7%) |
| 4.0x or more | 148 (45.3%) | 0 (0.0%) |
| Total | 327 (100.0%) | 481 (100.0%) |
Real Estate Taxes by Mortgage Status in Elm Creek
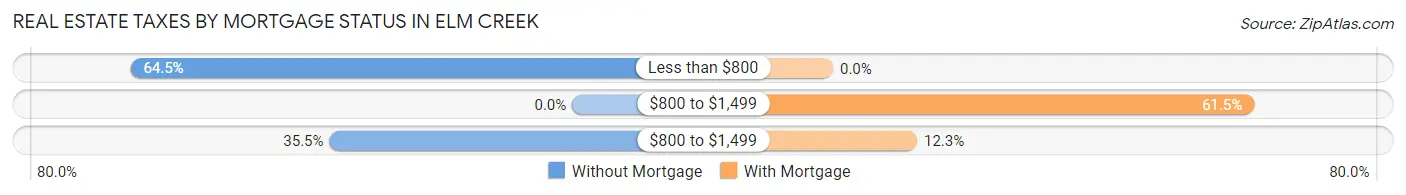
| Property Taxes | Without Mortgage | With Mortgage |
| Less than $800 | 211 (64.5%) | 0 (0.0%) |
| $800 to $1,499 | 0 (0.0%) | 296 (61.5%) |
| $800 to $1,499 | 116 (35.5%) | 59 (12.3%) |
| Total | 327 (100.0%) | 481 (100.0%) |
Health & Disability in Elm Creek
Health Insurance Coverage by Age in Elm Creek
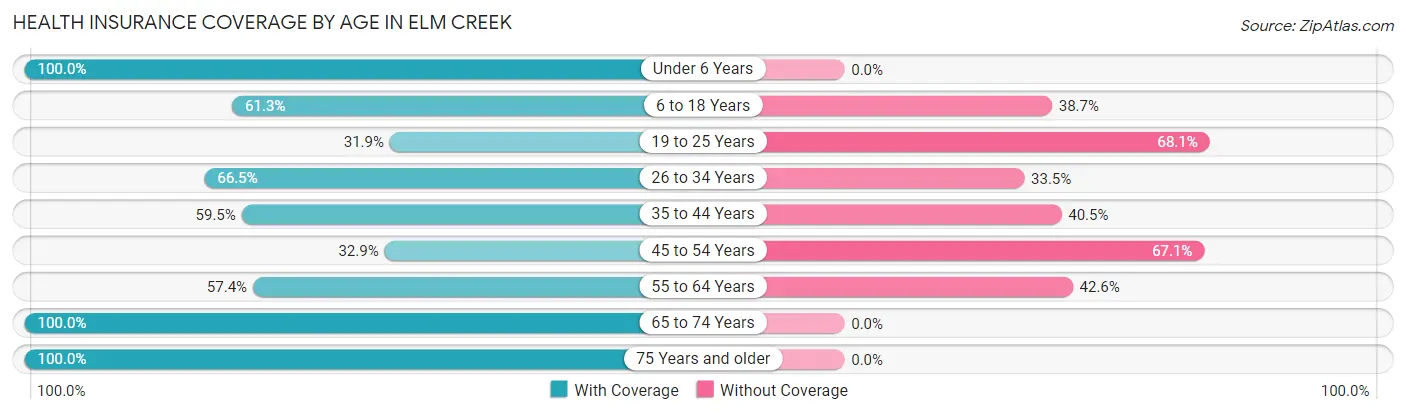
| Age Bracket | With Coverage | Without Coverage |
| Under 6 Years | 279 (100.0%) | 0 (0.0%) |
| 6 to 18 Years | 645 (61.3%) | 407 (38.7%) |
| 19 to 25 Years | 126 (31.9%) | 269 (68.1%) |
| 26 to 34 Years | 228 (66.5%) | 115 (33.5%) |
| 35 to 44 Years | 384 (59.5%) | 261 (40.5%) |
| 45 to 54 Years | 123 (32.9%) | 251 (67.1%) |
| 55 to 64 Years | 116 (57.4%) | 86 (42.6%) |
| 65 to 74 Years | 200 (100.0%) | 0 (0.0%) |
| 75 Years and older | 69 (100.0%) | 0 (0.0%) |
| Total | 2,170 (61.0%) | 1,389 (39.0%) |
Health Insurance Coverage by Citizenship Status in Elm Creek

| Citizenship Status | With Coverage | Without Coverage |
| Native Born | 279 (100.0%) | 0 (0.0%) |
| Foreign Born, Citizen | 645 (61.3%) | 407 (38.7%) |
| Foreign Born, not a Citizen | 126 (31.9%) | 269 (68.1%) |
Health Insurance Coverage by Household Income in Elm Creek
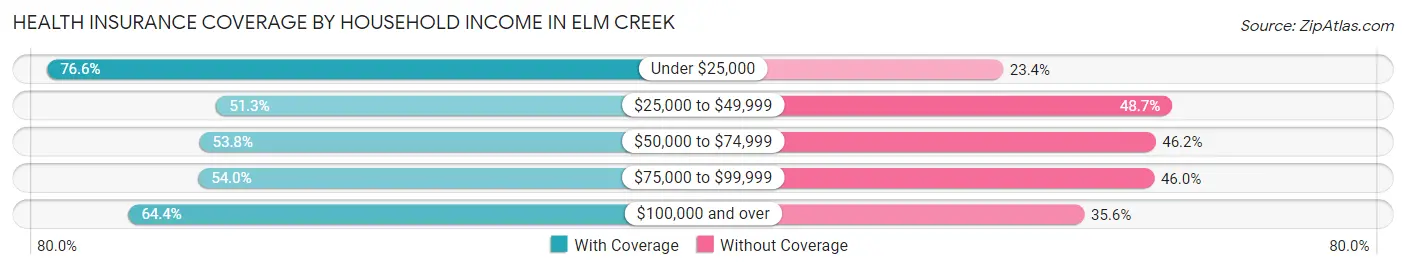
| Household Income | With Coverage | Without Coverage |
| Under $25,000 | 334 (76.6%) | 102 (23.4%) |
| $25,000 to $49,999 | 264 (51.3%) | 251 (48.7%) |
| $50,000 to $74,999 | 293 (53.8%) | 252 (46.2%) |
| $75,000 to $99,999 | 259 (54.0%) | 221 (46.0%) |
| $100,000 and over | 1,020 (64.4%) | 563 (35.6%) |
Public vs Private Health Insurance Coverage by Age in Elm Creek
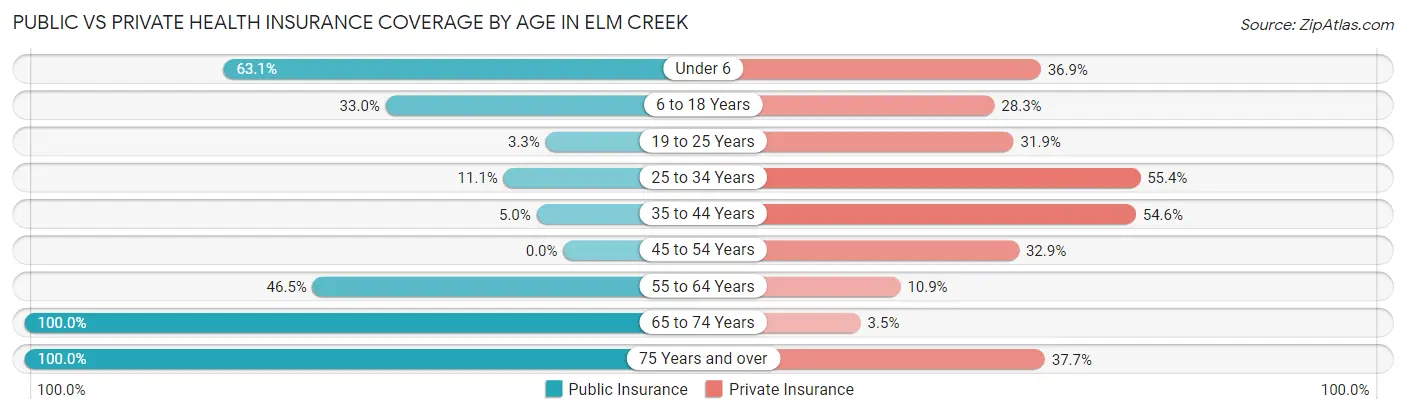
| Age Bracket | Public Insurance | Private Insurance |
| Under 6 | 176 (63.1%) | 103 (36.9%) |
| 6 to 18 Years | 347 (33.0%) | 298 (28.3%) |
| 19 to 25 Years | 13 (3.3%) | 126 (31.9%) |
| 25 to 34 Years | 38 (11.1%) | 190 (55.4%) |
| 35 to 44 Years | 32 (5.0%) | 352 (54.6%) |
| 45 to 54 Years | 0 (0.0%) | 123 (32.9%) |
| 55 to 64 Years | 94 (46.5%) | 22 (10.9%) |
| 65 to 74 Years | 200 (100.0%) | 7 (3.5%) |
| 75 Years and over | 69 (100.0%) | 26 (37.7%) |
| Total | 969 (27.2%) | 1,247 (35.0%) |
Disability Status by Sex by Age in Elm Creek
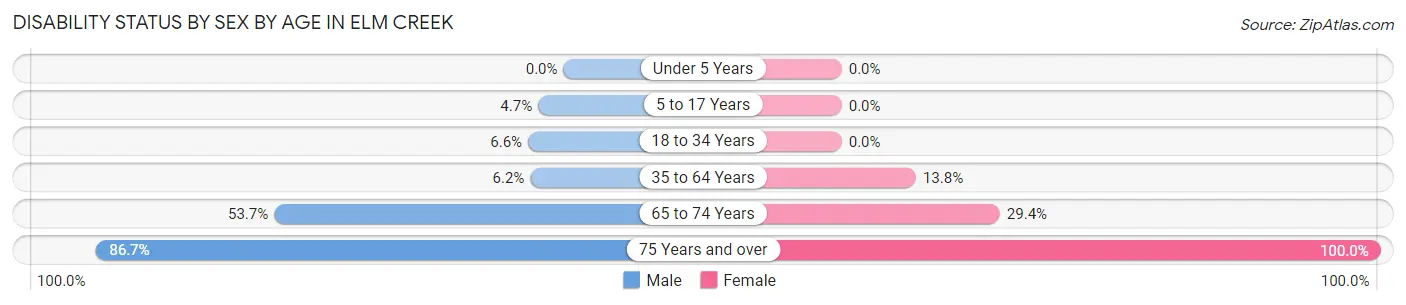
| Age Bracket | Male | Female |
| Under 5 Years | 0 (0.0%) | 0 (0.0%) |
| 5 to 17 Years | 28 (4.7%) | 0 (0.0%) |
| 18 to 34 Years | 36 (6.6%) | 0 (0.0%) |
| 35 to 64 Years | 34 (6.1%) | 92 (13.8%) |
| 65 to 74 Years | 58 (53.7%) | 27 (29.3%) |
| 75 Years and over | 26 (86.7%) | 39 (100.0%) |
Disability Class by Sex by Age in Elm Creek
Disability Class: Hearing Difficulty
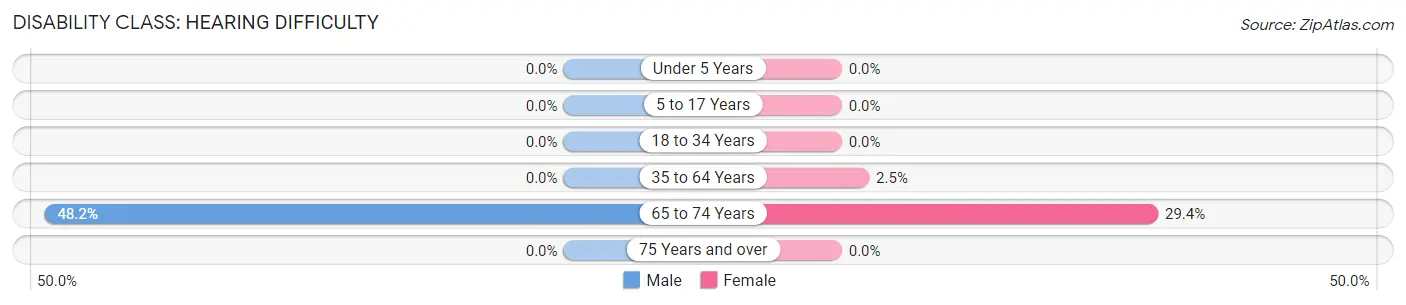
| Age Bracket | Male | Female |
| Under 5 Years | 0 (0.0%) | 0 (0.0%) |
| 5 to 17 Years | 0 (0.0%) | 0 (0.0%) |
| 18 to 34 Years | 0 (0.0%) | 0 (0.0%) |
| 35 to 64 Years | 0 (0.0%) | 17 (2.5%) |
| 65 to 74 Years | 52 (48.1%) | 27 (29.3%) |
| 75 Years and over | 0 (0.0%) | 0 (0.0%) |
Disability Class: Vision Difficulty
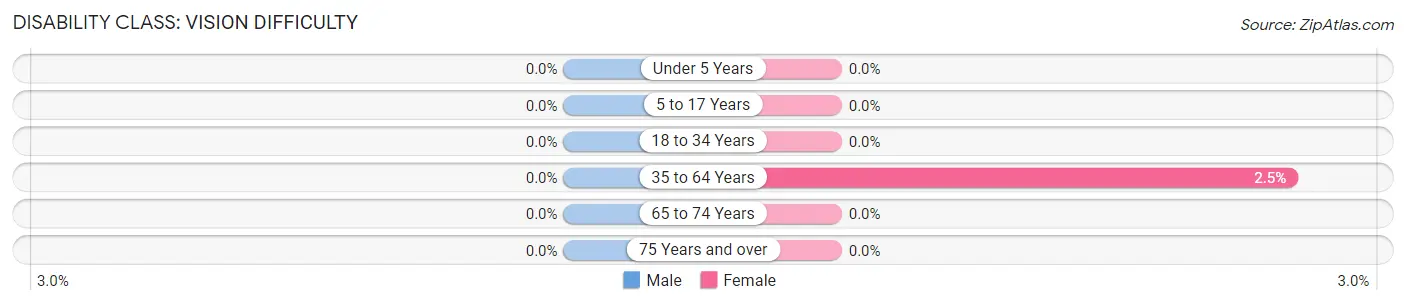
| Age Bracket | Male | Female |
| Under 5 Years | 0 (0.0%) | 0 (0.0%) |
| 5 to 17 Years | 0 (0.0%) | 0 (0.0%) |
| 18 to 34 Years | 0 (0.0%) | 0 (0.0%) |
| 35 to 64 Years | 0 (0.0%) | 17 (2.5%) |
| 65 to 74 Years | 0 (0.0%) | 0 (0.0%) |
| 75 Years and over | 0 (0.0%) | 0 (0.0%) |
Disability Class: Cognitive Difficulty
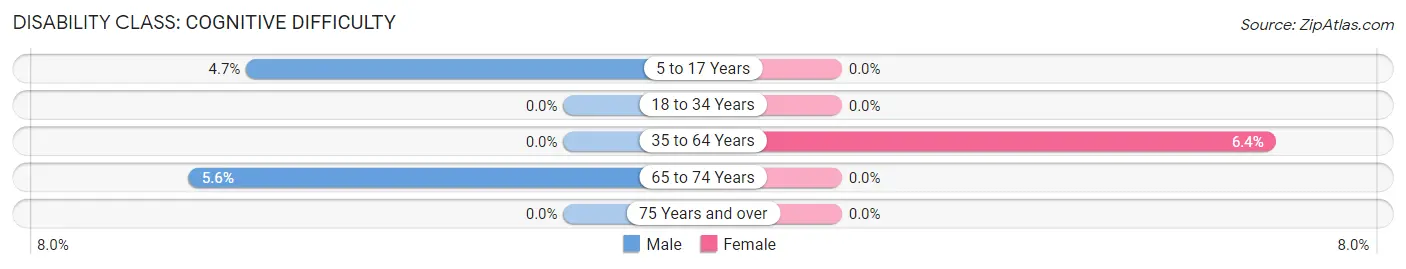
| Age Bracket | Male | Female |
| 5 to 17 Years | 28 (4.7%) | 0 (0.0%) |
| 18 to 34 Years | 0 (0.0%) | 0 (0.0%) |
| 35 to 64 Years | 0 (0.0%) | 43 (6.4%) |
| 65 to 74 Years | 6 (5.6%) | 0 (0.0%) |
| 75 Years and over | 0 (0.0%) | 0 (0.0%) |
Disability Class: Ambulatory Difficulty
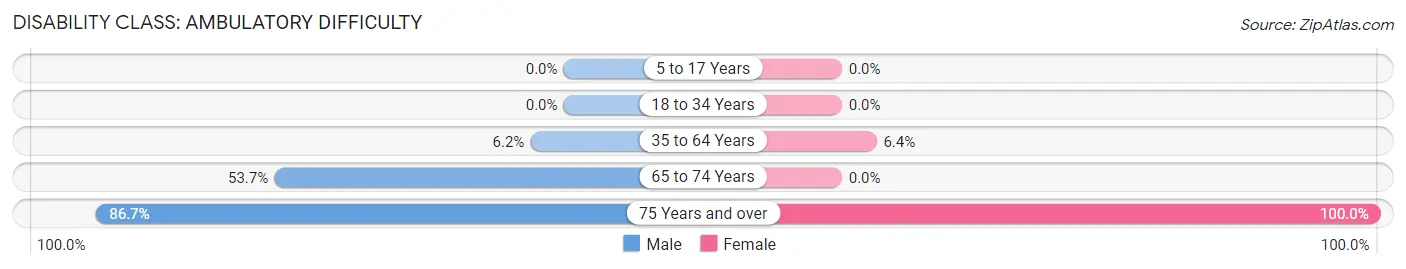
| Age Bracket | Male | Female |
| 5 to 17 Years | 0 (0.0%) | 0 (0.0%) |
| 18 to 34 Years | 0 (0.0%) | 0 (0.0%) |
| 35 to 64 Years | 34 (6.1%) | 43 (6.4%) |
| 65 to 74 Years | 58 (53.7%) | 0 (0.0%) |
| 75 Years and over | 26 (86.7%) | 39 (100.0%) |
Disability Class: Self-Care Difficulty
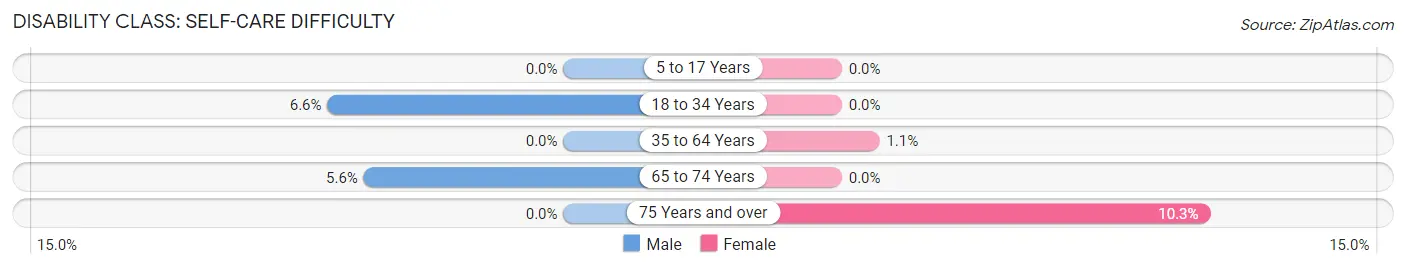
| Age Bracket | Male | Female |
| 5 to 17 Years | 0 (0.0%) | 0 (0.0%) |
| 18 to 34 Years | 36 (6.6%) | 0 (0.0%) |
| 35 to 64 Years | 0 (0.0%) | 7 (1.1%) |
| 65 to 74 Years | 6 (5.6%) | 0 (0.0%) |
| 75 Years and over | 0 (0.0%) | 4 (10.3%) |
Technology Access in Elm Creek
Computing Device Access in Elm Creek
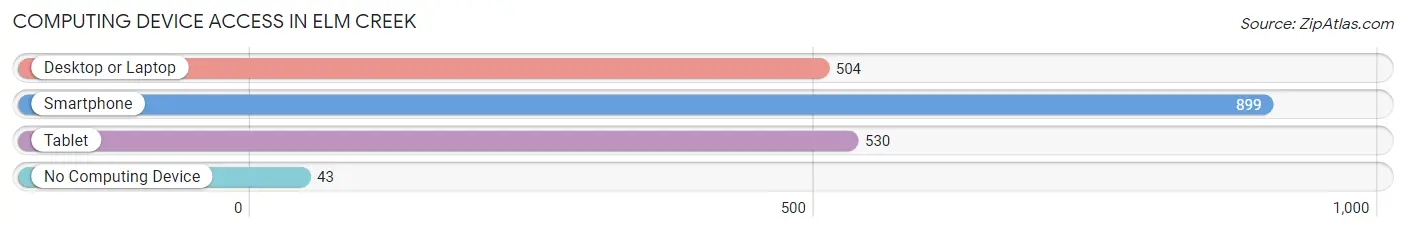
| Device Type | # Households | % Households |
| Desktop or Laptop | 504 | 53.5% |
| Smartphone | 899 | 95.4% |
| Tablet | 530 | 56.3% |
| No Computing Device | 43 | 4.6% |
| Total | 942 | 100.0% |
Internet Access in Elm Creek
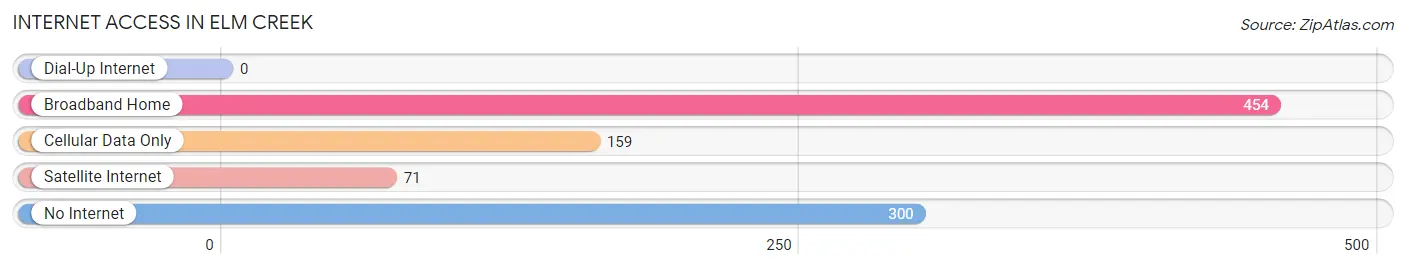
| Internet Type | # Households | % Households |
| Dial-Up Internet | 0 | 0.0% |
| Broadband Home | 454 | 48.2% |
| Cellular Data Only | 159 | 16.9% |
| Satellite Internet | 71 | 7.5% |
| No Internet | 300 | 31.9% |
| Total | 942 | 100.0% |
Elm Creek Summary
Elm Creek is a small town located in the Texas Panhandle, in the county of Lipscomb. It is situated on the banks of the Elm Creek, a tributary of the Canadian River. The town was founded in 1891 and has a population of around 500 people.
History
Elm Creek was founded in 1891 by a group of settlers from the nearby town of Higgins. The settlers were looking for a place to settle and start a new life. They chose the banks of the Elm Creek, which was a tributary of the Canadian River. The settlers built a small community and named it Elm Creek.
The town grew slowly but steadily over the years. In the early 1900s, the town was home to a number of businesses, including a general store, a blacksmith shop, a livery stable, and a hotel. The town also had a school, a post office, and a church.
In the 1920s, the town began to experience a period of growth. The population increased from around 200 people in 1920 to over 500 people by 1930. This growth was due to the discovery of oil in the area. The oil boom brought new businesses and jobs to the town, and the population continued to grow.
By the 1950s, the town had become a thriving community. The population had grown to over 1,000 people and the town had a number of businesses, including a bank, a movie theater, and a number of stores.
Geography
Elm Creek is located in the Texas Panhandle, in the county of Lipscomb. It is situated on the banks of the Elm Creek, a tributary of the Canadian River. The town is located in a semi-arid region, with an average annual rainfall of around 18 inches. The town is located at an elevation of around 2,000 feet above sea level.
The town is surrounded by rolling hills and grasslands. The area is home to a variety of wildlife, including deer, coyotes, and wild turkeys. The town is also home to a number of small lakes and ponds, which provide a habitat for a variety of fish and other aquatic life.
Economy
The economy of Elm Creek is largely based on agriculture and oil production. The town is home to a number of farms, which produce a variety of crops, including wheat, corn, and cotton. The town is also home to a number of oil wells, which produce a significant amount of oil.
The town is also home to a number of businesses, including a bank, a movie theater, and a number of stores. The town also has a number of restaurants and bars, which provide employment for many of the town’s residents.
Demographics
As of the 2010 census, the population of Elm Creek was 514 people. The town is predominantly white, with around 90% of the population being white. The town also has a small Hispanic population, with around 5% of the population being Hispanic. The town also has a small African American population, with around 2% of the population being African American.
The median household income in Elm Creek is around $35,000, which is slightly lower than the national average. The town also has a higher than average poverty rate, with around 20% of the population living below the poverty line.
Conclusion
Elm Creek is a small town located in the Texas Panhandle, in the county of Lipscomb. The town was founded in 1891 and has a population of around 500 people. The town’s economy is largely based on agriculture and oil production, and the town is home to a number of businesses, including a bank, a movie theater, and a number of stores. The town is predominantly white, with around 90% of the population being white. The median household income in Elm Creek is around $35,000, which is slightly lower than the national average.
Common Questions
What is Per Capita Income in Elm Creek?
Per Capita income in Elm Creek is $21,643.
What is the Median Family Income in Elm Creek?
Median Family Income in Elm Creek is $93,914.
What is the Median Household income in Elm Creek?
Median Household Income in Elm Creek is $64,853.
What is Income or Wage Gap in Elm Creek?
Income or Wage Gap in Elm Creek is 65.9%.
Women in Elm Creek earn 34.1 cents for every dollar earned by a man.
What is Inequality or Gini Index in Elm Creek?
Inequality or Gini Index in Elm Creek is 0.38.
What is the Total Population of Elm Creek?
Total Population of Elm Creek is 3,559.
What is the Total Male Population of Elm Creek?
Total Male Population of Elm Creek is 1,930.
What is the Total Female Population of Elm Creek?
Total Female Population of Elm Creek is 1,629.
What is the Ratio of Males per 100 Females in Elm Creek?
There are 118.48 Males per 100 Females in Elm Creek.
What is the Ratio of Females per 100 Males in Elm Creek?
There are 84.40 Females per 100 Males in Elm Creek.
What is the Median Population Age in Elm Creek?
Median Population Age in Elm Creek is 27.0 Years.
What is the Average Family Size in Elm Creek
Average Family Size in Elm Creek is 4.3 People.
What is the Average Household Size in Elm Creek
Average Household Size in Elm Creek is 3.8 People.
How Large is the Labor Force in Elm Creek?
There are 1,687 People in the Labor Forcein in Elm Creek.
What is the Percentage of People in the Labor Force in Elm Creek?
67.6% of People are in the Labor Force in Elm Creek.
What is the Unemployment Rate in Elm Creek?
Unemployment Rate in Elm Creek is 6.8%.