Garza Salinas II, TX Map & Demographics
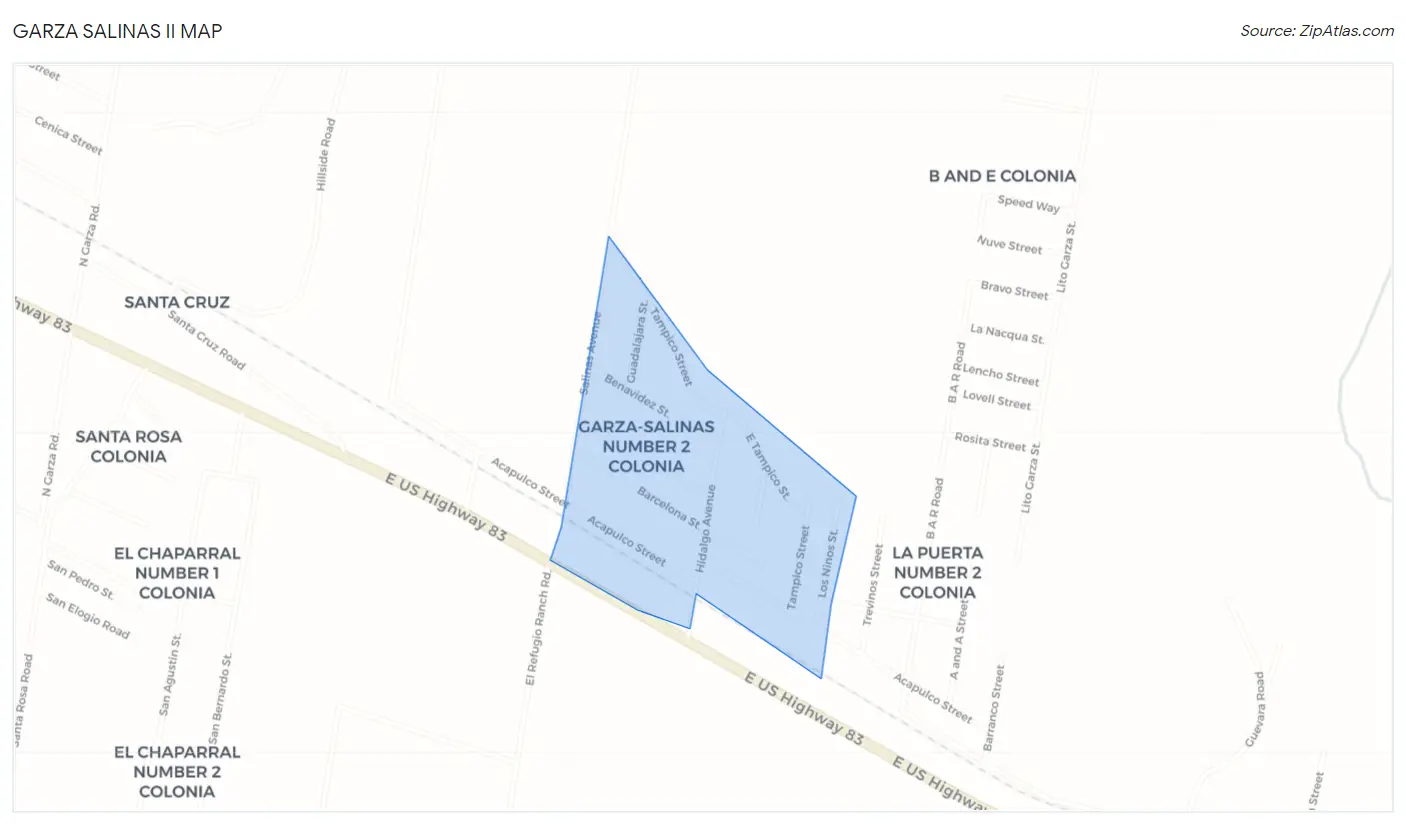
Garza Salinas II Map
Garza Salinas II Overview
$9,721
PER CAPITA INCOME
61.4%
WAGE / INCOME GAP [ % ]
38.6¢/ $1
WAGE / INCOME GAP [ $ ]
0.59
INEQUALITY / GINI INDEX
513
TOTAL POPULATION
253
MALE POPULATION
260
FEMALE POPULATION
97.31
MALES / 100 FEMALES
102.77
FEMALES / 100 MALES
21.8
MEDIAN AGE
4.6
AVG FAMILY SIZE
3.2
AVG HOUSEHOLD SIZE
140
LABOR FORCE [ PEOPLE ]
44.7%
PERCENT IN LABOR FORCE
Income in Garza Salinas II
Income Overview in Garza Salinas II
| Characteristic | Number | Measure |
| Per Capita Income | 513 | $9,721 |
| Median Family Income | 91 | $0 |
| Mean Family Income | 91 | $37,748 |
| Median Household Income | 158 | $0 |
| Mean Household Income | 158 | $27,416 |
| Income Deficit | 91 | $0 |
| Wage / Income Gap (%) | 513 | 61.36% |
| Wage / Income Gap ($) | 513 | 38.64¢ per $1 |
| Gini / Inequality Index | 513 | 0.59 |
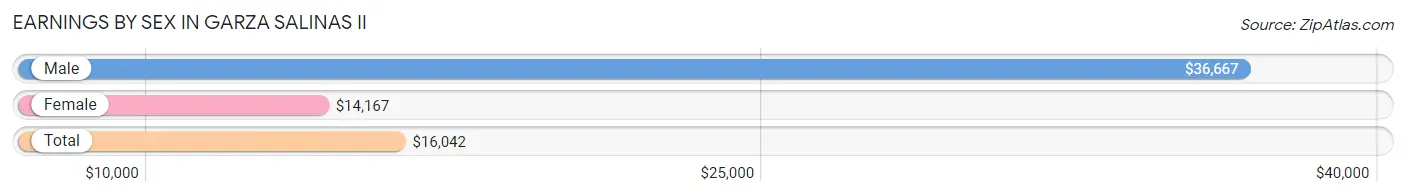
Earnings by Sex in Garza Salinas II
Average Earnings in Garza Salinas II are $16,042, $36,667 for men and $14,167 for women, a difference of 61.4%.
| Sex | Number | Average Earnings |
| Male | 42 (26.6%) | $36,667 |
| Female | 116 (73.4%) | $14,167 |
| Total | 158 (100.0%) | $16,042 |
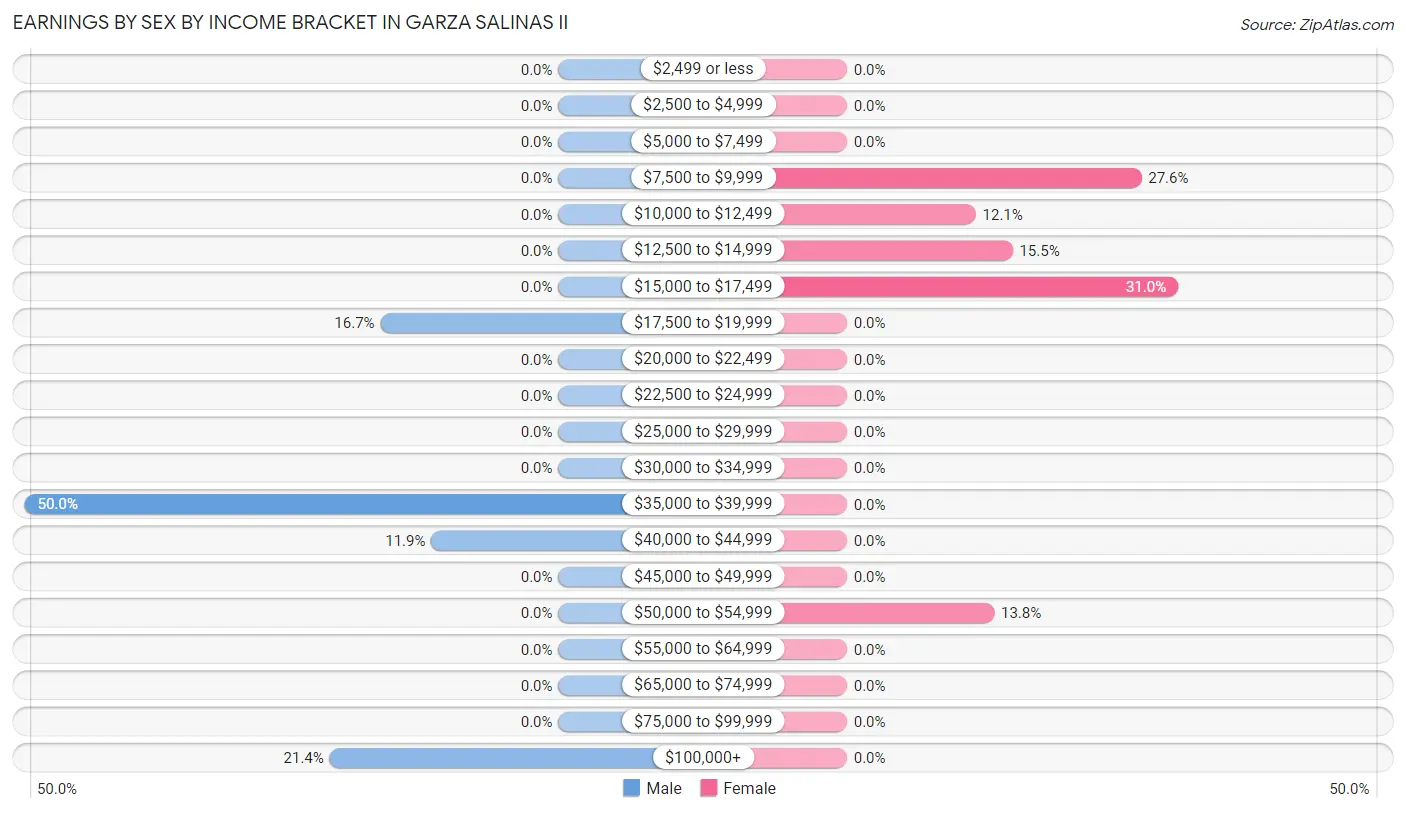
Earnings by Sex by Income Bracket in Garza Salinas II
The most common earnings brackets in Garza Salinas II are $35,000 to $39,999 for men (21 | 50.0%) and $15,000 to $17,499 for women (36 | 31.0%).
| Income | Male | Female |
| $2,499 or less | 0 (0.0%) | 0 (0.0%) |
| $2,500 to $4,999 | 0 (0.0%) | 0 (0.0%) |
| $5,000 to $7,499 | 0 (0.0%) | 0 (0.0%) |
| $7,500 to $9,999 | 0 (0.0%) | 32 (27.6%) |
| $10,000 to $12,499 | 0 (0.0%) | 14 (12.1%) |
| $12,500 to $14,999 | 0 (0.0%) | 18 (15.5%) |
| $15,000 to $17,499 | 0 (0.0%) | 36 (31.0%) |
| $17,500 to $19,999 | 7 (16.7%) | 0 (0.0%) |
| $20,000 to $22,499 | 0 (0.0%) | 0 (0.0%) |
| $22,500 to $24,999 | 0 (0.0%) | 0 (0.0%) |
| $25,000 to $29,999 | 0 (0.0%) | 0 (0.0%) |
| $30,000 to $34,999 | 0 (0.0%) | 0 (0.0%) |
| $35,000 to $39,999 | 21 (50.0%) | 0 (0.0%) |
| $40,000 to $44,999 | 5 (11.9%) | 0 (0.0%) |
| $45,000 to $49,999 | 0 (0.0%) | 0 (0.0%) |
| $50,000 to $54,999 | 0 (0.0%) | 16 (13.8%) |
| $55,000 to $64,999 | 0 (0.0%) | 0 (0.0%) |
| $65,000 to $74,999 | 0 (0.0%) | 0 (0.0%) |
| $75,000 to $99,999 | 0 (0.0%) | 0 (0.0%) |
| $100,000+ | 9 (21.4%) | 0 (0.0%) |
| Total | 42 (100.0%) | 116 (100.0%) |
Earnings by Sex by Educational Attainment in Garza Salinas II
| Educational Attainment | Male Income | Female Income |
| Less than High School | - | - |
| High School Diploma | - | - |
| College or Associate's Degree | - | - |
| Bachelor's Degree | - | - |
| Graduate Degree | - | - |
| Total | $36,667 | $15,521 |
Family Income in Garza Salinas II
Family Income Brackets in Garza Salinas II
According to the Garza Salinas II family income data, there are 23 families falling into the less than $10,000 income range, which is the most common income bracket and makes up 25.3% of all families.
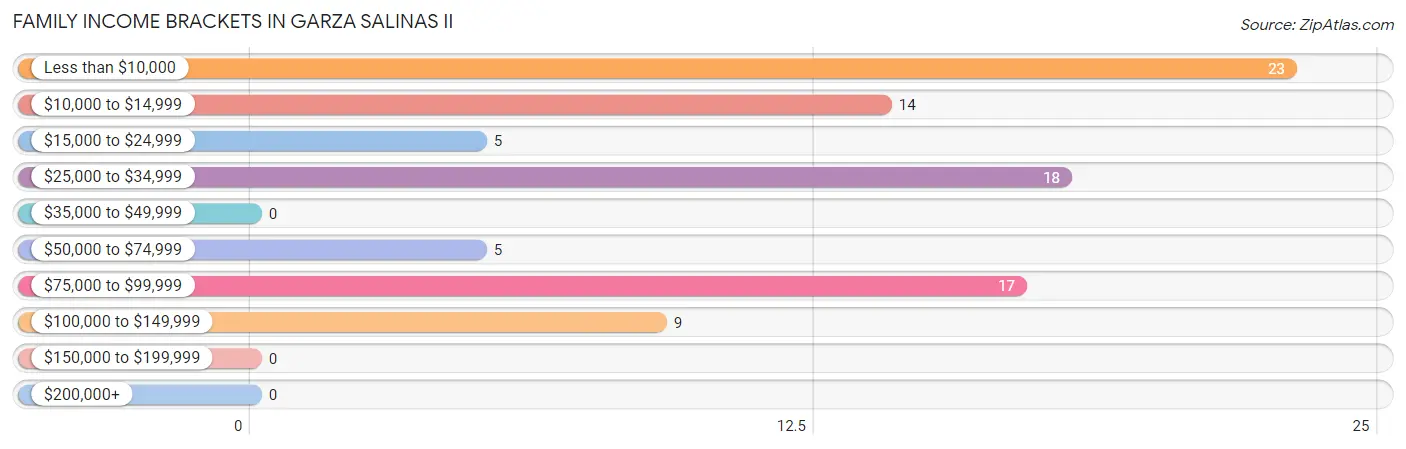
| Income Bracket | # Families | % Families |
| Less than $10,000 | 23 | 25.3% |
| $10,000 to $14,999 | 14 | 15.4% |
| $15,000 to $24,999 | 5 | 5.5% |
| $25,000 to $34,999 | 18 | 19.8% |
| $35,000 to $49,999 | 0 | 0.0% |
| $50,000 to $74,999 | 5 | 5.5% |
| $75,000 to $99,999 | 17 | 18.7% |
| $100,000 to $149,999 | 9 | 9.9% |
| $150,000 to $199,999 | 0 | 0.0% |
| $200,000+ | 0 | 0.0% |
Family Income by Famaliy Size in Garza Salinas II
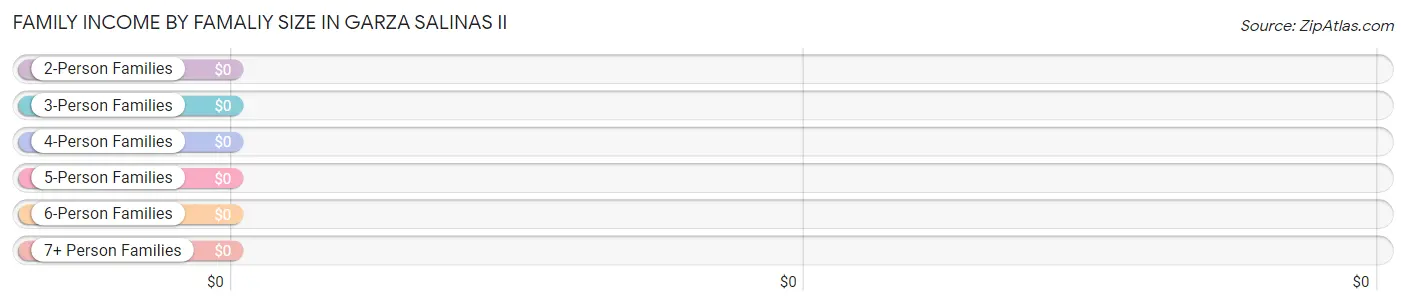
| Income Bracket | # Families | Median Income |
| 2-Person Families | 17 (18.7%) | $0 |
| 3-Person Families | 39 (42.9%) | $0 |
| 4-Person Families | 18 (19.8%) | $0 |
| 5-Person Families | 0 (0.0%) | $0 |
| 6-Person Families | 17 (18.7%) | $0 |
| 7+ Person Families | 0 (0.0%) | $0 |
| Total | 91 (100.0%) | $0 |
Family Income by Number of Earners in Garza Salinas II
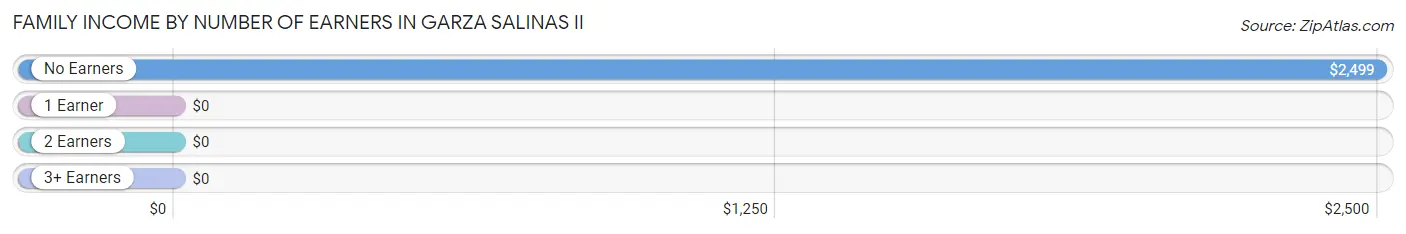
| Number of Earners | # Families | Median Income |
| No Earners | 23 (25.3%) | $2,499 |
| 1 Earner | 28 (30.8%) | $0 |
| 2 Earners | 40 (44.0%) | $0 |
| 3+ Earners | 0 (0.0%) | $0 |
| Total | 91 (100.0%) | $0 |
Household Income in Garza Salinas II
Household Income Brackets in Garza Salinas II
With 69 households falling in the category, the less than $10,000 income range is the most frequent in Garza Salinas II, accounting for 43.7% of all households.
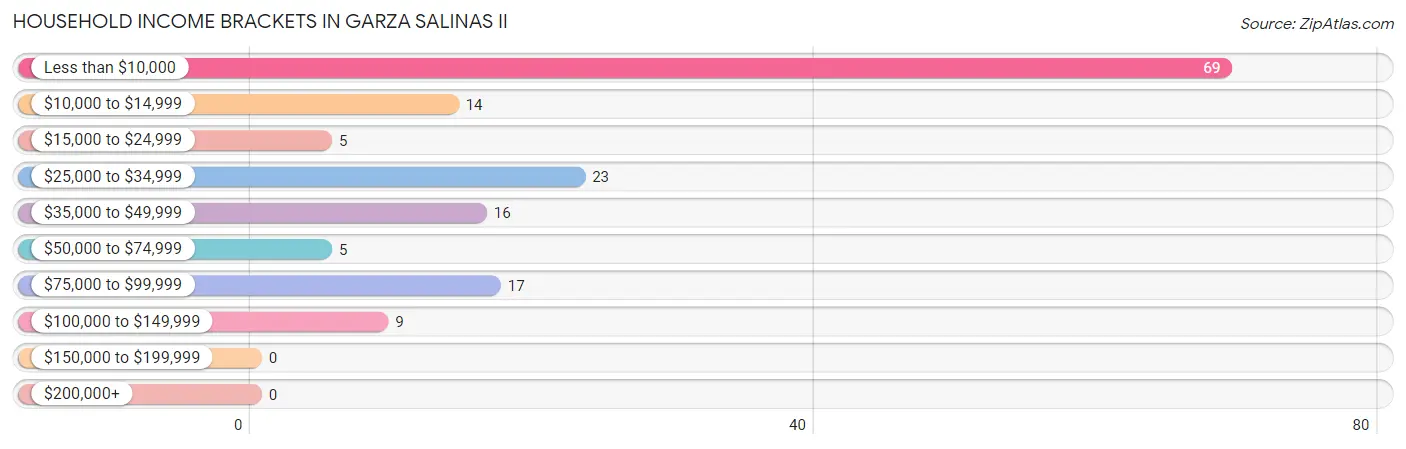
| Income Bracket | # Households | % Households |
| Less than $10,000 | 69 | 43.7% |
| $10,000 to $14,999 | 14 | 8.9% |
| $15,000 to $24,999 | 5 | 3.2% |
| $25,000 to $34,999 | 23 | 14.6% |
| $35,000 to $49,999 | 16 | 10.1% |
| $50,000 to $74,999 | 5 | 3.2% |
| $75,000 to $99,999 | 17 | 10.8% |
| $100,000 to $149,999 | 9 | 5.7% |
| $150,000 to $199,999 | 0 | 0.0% |
| $200,000+ | 0 | 0.0% |
Household Income by Householder Age in Garza Salinas II
The median household income in Garza Salinas II is $0, with the highest median household income of $29,620 found in the 25 to 44 years age bracket for the primary householder. A total of 39 households (24.7%) fall into this category.
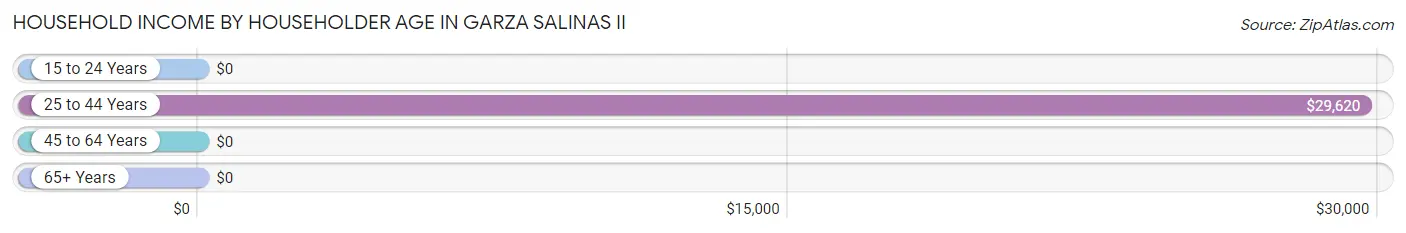
| Income Bracket | # Households | Median Income |
| 15 to 24 Years | 0 (0.0%) | $0 |
| 25 to 44 Years | 39 (24.7%) | $29,620 |
| 45 to 64 Years | 83 (52.5%) | $0 |
| 65+ Years | 36 (22.8%) | $0 |
| Total | 158 (100.0%) | $0 |
Poverty in Garza Salinas II
Income Below Poverty by Sex and Age in Garza Salinas II
With 51.8% poverty level for males and 68.1% for females among the residents of Garza Salinas II, 65 to 74 year old males and 6 to 11 year old females are the most vulnerable to poverty, with 10 males (100.0%) and 28 females (100.0%) in their respective age groups living below the poverty level.
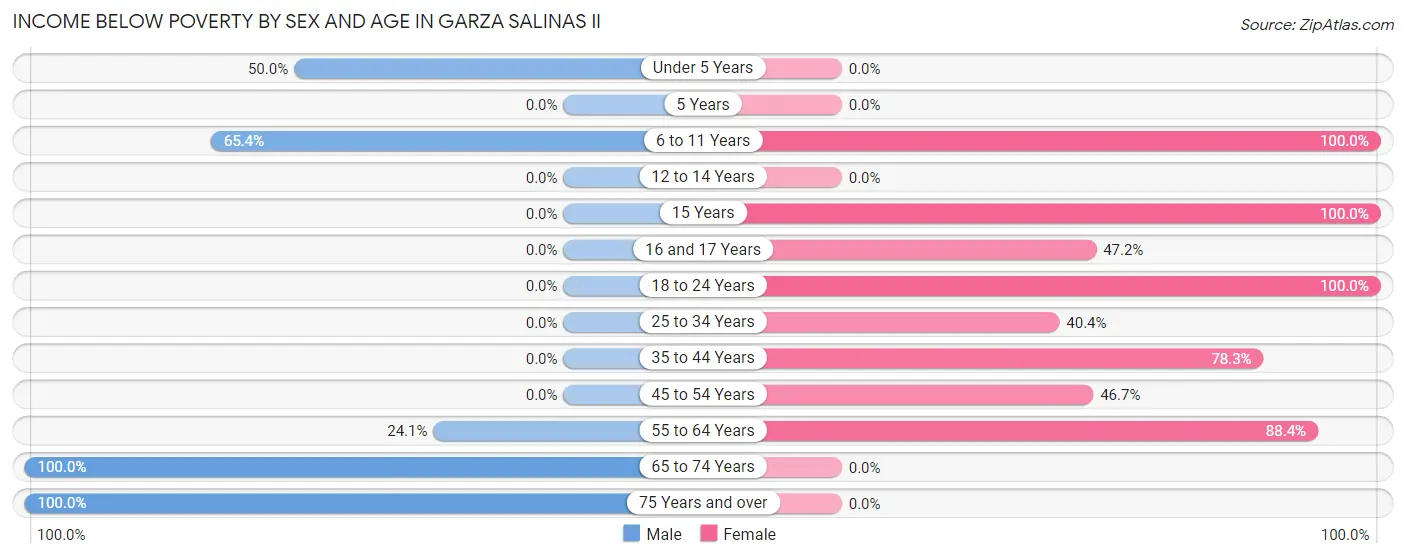
| Age Bracket | Male | Female |
| Under 5 Years | 35 (50.0%) | 0 (0.0%) |
| 5 Years | 0 (0.0%) | 0 (0.0%) |
| 6 to 11 Years | 53 (65.4%) | 28 (100.0%) |
| 12 to 14 Years | 0 (0.0%) | 0 (0.0%) |
| 15 Years | 0 (0.0%) | 14 (100.0%) |
| 16 and 17 Years | 0 (0.0%) | 17 (47.2%) |
| 18 to 24 Years | 0 (0.0%) | 27 (100.0%) |
| 25 to 34 Years | 0 (0.0%) | 21 (40.4%) |
| 35 to 44 Years | 0 (0.0%) | 18 (78.3%) |
| 45 to 54 Years | 0 (0.0%) | 14 (46.7%) |
| 55 to 64 Years | 7 (24.1%) | 38 (88.4%) |
| 65 to 74 Years | 10 (100.0%) | 0 (0.0%) |
| 75 Years and over | 26 (100.0%) | 0 (0.0%) |
| Total | 131 (51.8%) | 177 (68.1%) |
Income Above Poverty by Sex and Age in Garza Salinas II
According to the poverty statistics in Garza Salinas II, males aged 25 to 34 years and females aged 12 to 14 years are the age groups that are most secure financially, with 100.0% of males and 100.0% of females in these age groups living above the poverty line.
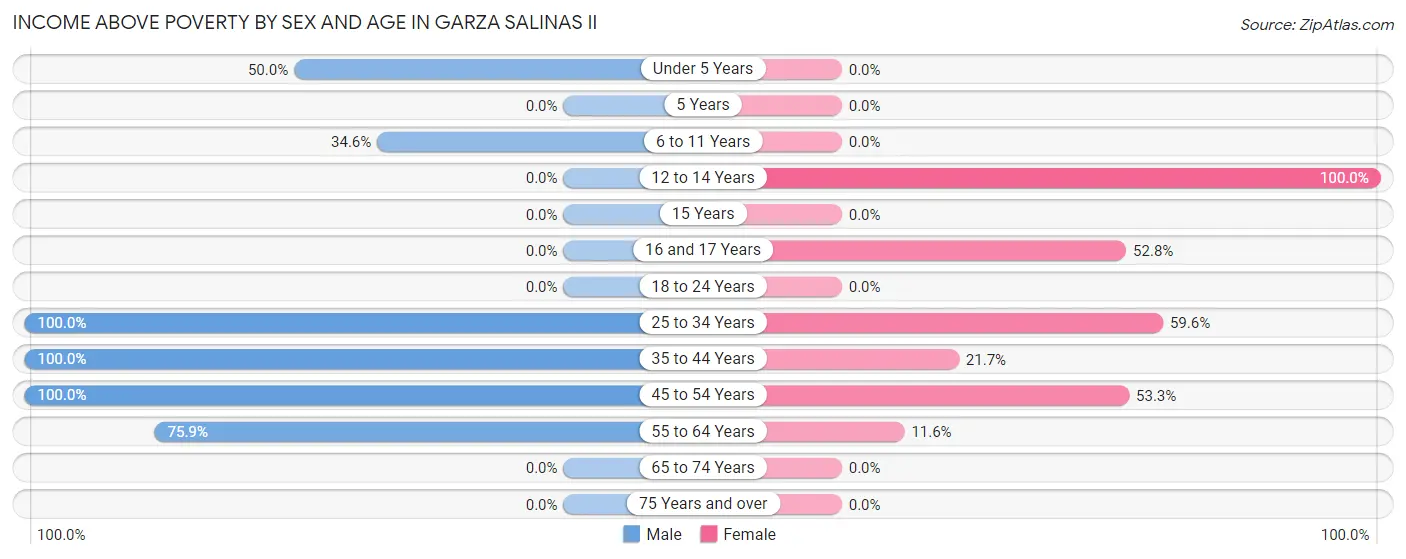
| Age Bracket | Male | Female |
| Under 5 Years | 35 (50.0%) | 0 (0.0%) |
| 5 Years | 0 (0.0%) | 0 (0.0%) |
| 6 to 11 Years | 28 (34.6%) | 0 (0.0%) |
| 12 to 14 Years | 0 (0.0%) | 7 (100.0%) |
| 15 Years | 0 (0.0%) | 0 (0.0%) |
| 16 and 17 Years | 0 (0.0%) | 19 (52.8%) |
| 18 to 24 Years | 0 (0.0%) | 0 (0.0%) |
| 25 to 34 Years | 21 (100.0%) | 31 (59.6%) |
| 35 to 44 Years | 7 (100.0%) | 5 (21.7%) |
| 45 to 54 Years | 9 (100.0%) | 16 (53.3%) |
| 55 to 64 Years | 22 (75.9%) | 5 (11.6%) |
| 65 to 74 Years | 0 (0.0%) | 0 (0.0%) |
| 75 Years and over | 0 (0.0%) | 0 (0.0%) |
| Total | 122 (48.2%) | 83 (31.9%) |
Income Below Poverty Among Married-Couple Families in Garza Salinas II
The poverty statistics for married-couple families in Garza Salinas II show that 18.4% or 7 of the total 38 families live below the poverty line. Families with no children have the highest poverty rate of 58.3%, comprising of 7 families. On the other hand, families with 1 or 2 children have the lowest poverty rate of 0.0%, which includes 0 families.
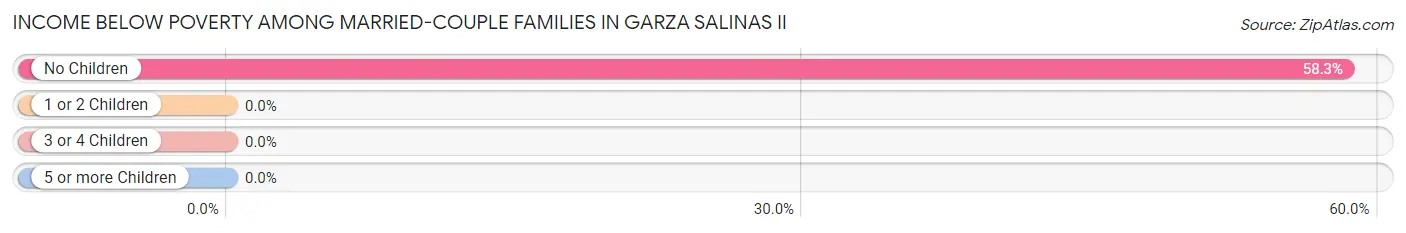
| Children | Above Poverty | Below Poverty |
| No Children | 5 (41.7%) | 7 (58.3%) |
| 1 or 2 Children | 9 (100.0%) | 0 (0.0%) |
| 3 or 4 Children | 17 (100.0%) | 0 (0.0%) |
| 5 or more Children | 0 (0.0%) | 0 (0.0%) |
| Total | 31 (81.6%) | 7 (18.4%) |
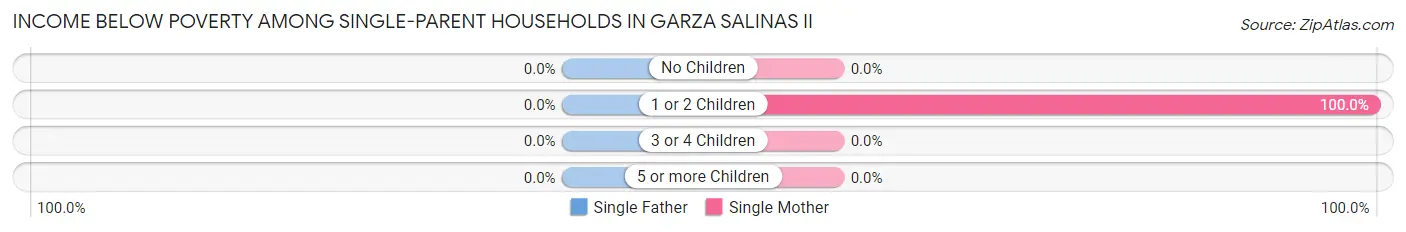
Income Below Poverty Among Single-Parent Households in Garza Salinas II
| Children | Single Father | Single Mother |
| No Children | 0 (0.0%) | 0 (0.0%) |
| 1 or 2 Children | 0 (0.0%) | 53 (100.0%) |
| 3 or 4 Children | 0 (0.0%) | 0 (0.0%) |
| 5 or more Children | 0 (0.0%) | 0 (0.0%) |
| Total | 0 (0.0%) | 53 (100.0%) |
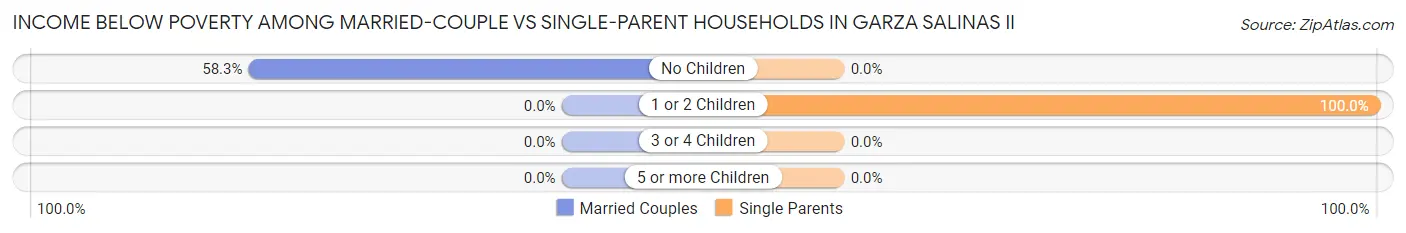
Income Below Poverty Among Married-Couple vs Single-Parent Households in Garza Salinas II
The poverty data for Garza Salinas II shows that 7 of the married-couple family households (18.4%) and 53 of the single-parent households (100.0%) are living below the poverty level. Within the married-couple family households, those with no children have the highest poverty rate, with 7 households (58.3%) falling below the poverty line. Among the single-parent households, those with 1 or 2 children have the highest poverty rate, with 53 household (100.0%) living below poverty.
| Children | Married-Couple Families | Single-Parent Households |
| No Children | 7 (58.3%) | 0 (0.0%) |
| 1 or 2 Children | 0 (0.0%) | 53 (100.0%) |
| 3 or 4 Children | 0 (0.0%) | 0 (0.0%) |
| 5 or more Children | 0 (0.0%) | 0 (0.0%) |
| Total | 7 (18.4%) | 53 (100.0%) |
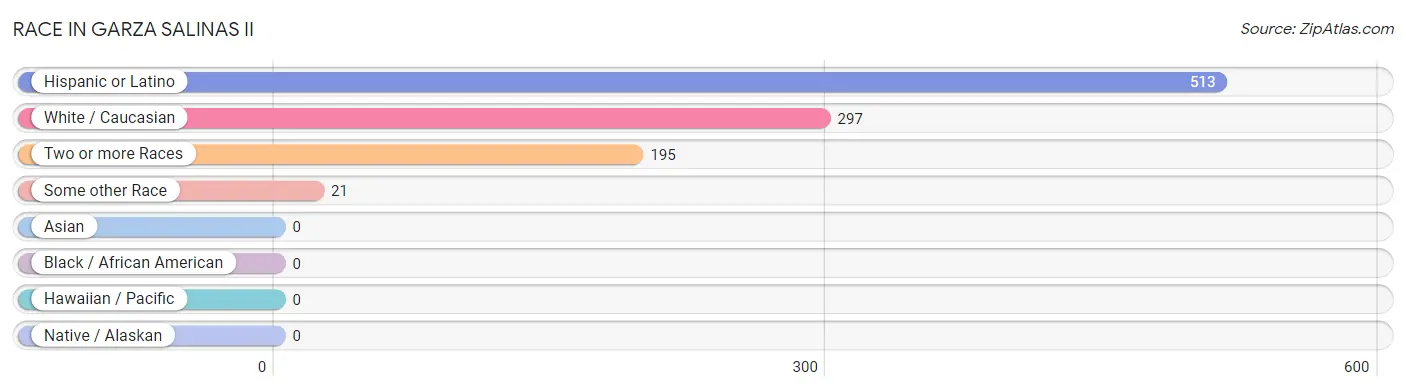
Race in Garza Salinas II
The most populous races in Garza Salinas II are Hispanic or Latino (513 | 100.0%), White / Caucasian (297 | 57.9%), and Two or more Races (195 | 38.0%).
| Race | # Population | % Population |
| Asian | 0 | 0.0% |
| Black / African American | 0 | 0.0% |
| Hawaiian / Pacific | 0 | 0.0% |
| Hispanic or Latino | 513 | 100.0% |
| Native / Alaskan | 0 | 0.0% |
| White / Caucasian | 297 | 57.9% |
| Two or more Races | 195 | 38.0% |
| Some other Race | 21 | 4.1% |
| Total | 513 | 100.0% |
Ancestry in Garza Salinas II
The most populous ancestries reported in Garza Salinas II are , and Mexican (513 | 100.0%), together accounting for 100.0% of all Garza Salinas II residents.

| Ancestry | # Population | % Population |
| Mexican | 513 | 100.0% | View All 1 Rows |
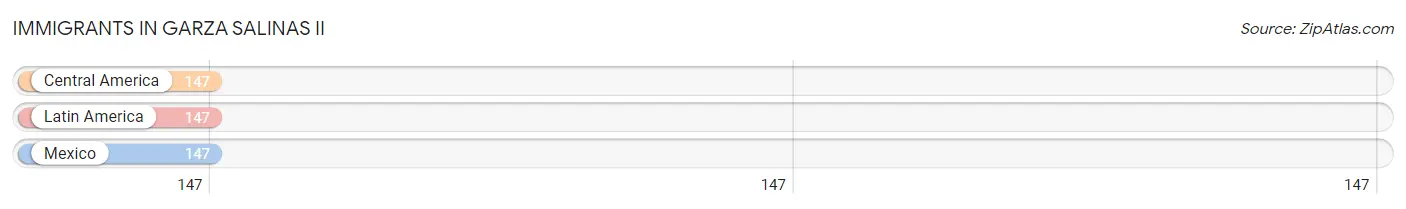
Immigrants in Garza Salinas II
The most numerous immigrant groups reported in Garza Salinas II came from Central America (147 | 28.6%), Latin America (147 | 28.6%), and Mexico (147 | 28.6%), together accounting for 85.9% of all Garza Salinas II residents.
| Immigration Origin | # Population | % Population |
| Central America | 147 | 28.6% |
| Latin America | 147 | 28.6% |
| Mexico | 147 | 28.6% | View All 3 Rows |
Sex and Age in Garza Salinas II
Sex and Age in Garza Salinas II
The most populous age groups in Garza Salinas II are Under 5 Years (70 | 27.7%) for men and 15 to 19 Years (50 | 19.2%) for women.
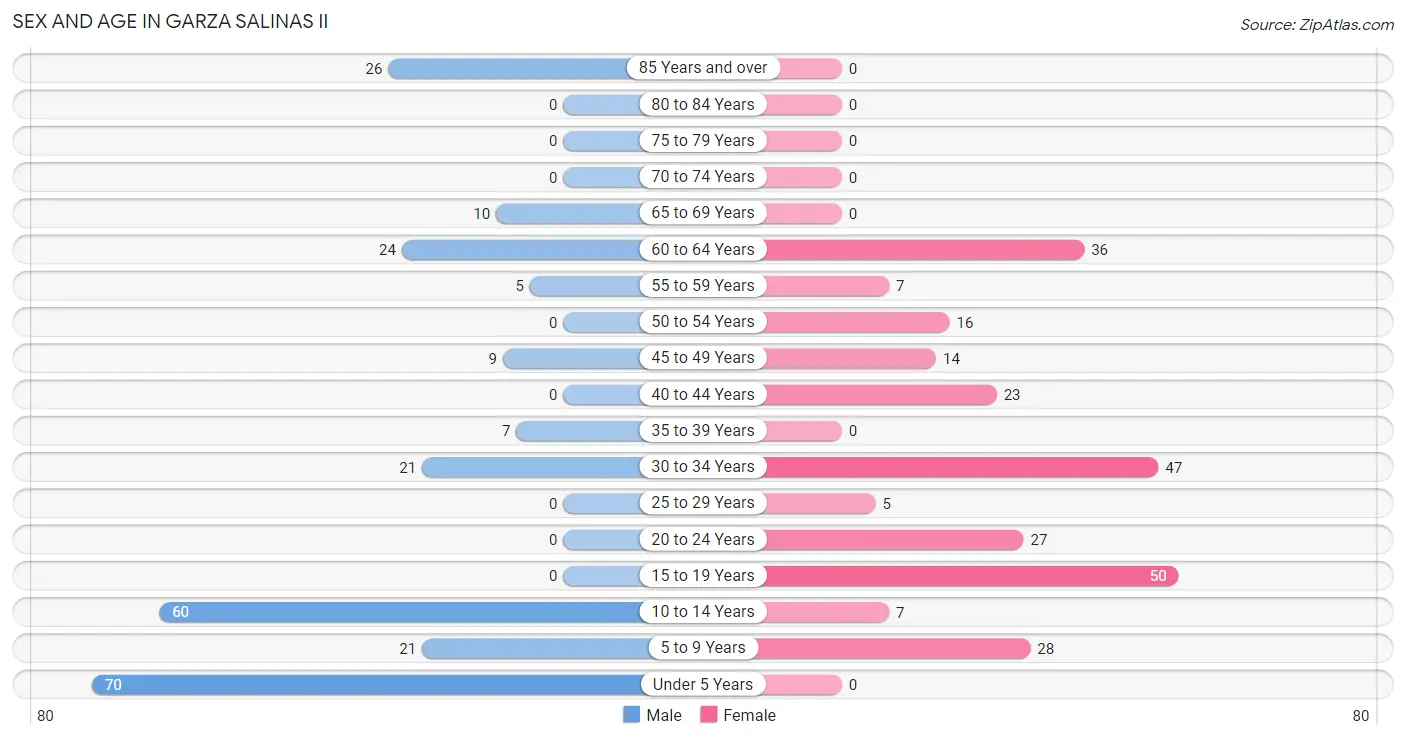
| Age Bracket | Male | Female |
| Under 5 Years | 70 (27.7%) | 0 (0.0%) |
| 5 to 9 Years | 21 (8.3%) | 28 (10.8%) |
| 10 to 14 Years | 60 (23.7%) | 7 (2.7%) |
| 15 to 19 Years | 0 (0.0%) | 50 (19.2%) |
| 20 to 24 Years | 0 (0.0%) | 27 (10.4%) |
| 25 to 29 Years | 0 (0.0%) | 5 (1.9%) |
| 30 to 34 Years | 21 (8.3%) | 47 (18.1%) |
| 35 to 39 Years | 7 (2.8%) | 0 (0.0%) |
| 40 to 44 Years | 0 (0.0%) | 23 (8.8%) |
| 45 to 49 Years | 9 (3.6%) | 14 (5.4%) |
| 50 to 54 Years | 0 (0.0%) | 16 (6.1%) |
| 55 to 59 Years | 5 (2.0%) | 7 (2.7%) |
| 60 to 64 Years | 24 (9.5%) | 36 (13.9%) |
| 65 to 69 Years | 10 (4.0%) | 0 (0.0%) |
| 70 to 74 Years | 0 (0.0%) | 0 (0.0%) |
| 75 to 79 Years | 0 (0.0%) | 0 (0.0%) |
| 80 to 84 Years | 0 (0.0%) | 0 (0.0%) |
| 85 Years and over | 26 (10.3%) | 0 (0.0%) |
| Total | 253 (100.0%) | 260 (100.0%) |
Families and Households in Garza Salinas II
Median Family Size in Garza Salinas II
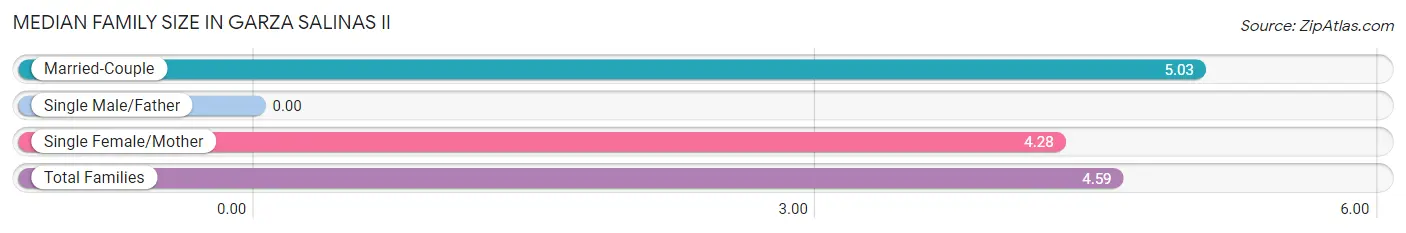
| Family Type | # Families | Family Size |
| Married-Couple | 38 (41.8%) | 5.03 |
| Single Male/Father | 0 (0.0%) | - |
| Single Female/Mother | 53 (58.2%) | 4.28 |
| Total Families | 91 (100.0%) | 4.59 |
Median Household Size in Garza Salinas II
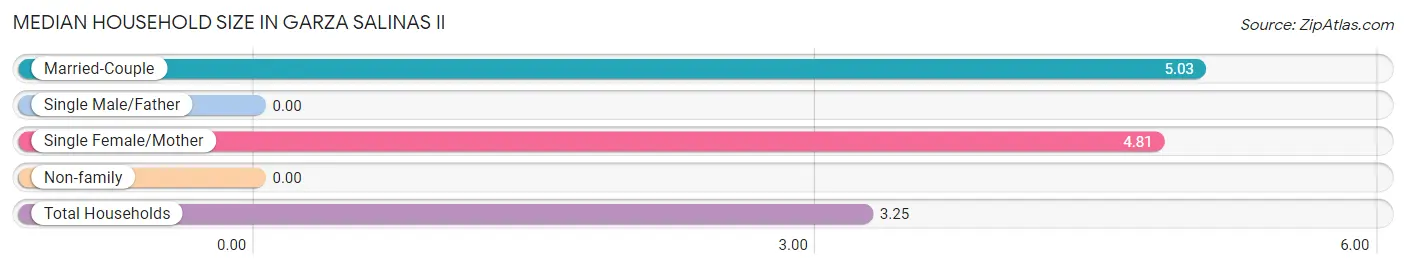
| Household Type | # Households | Household Size |
| Married-Couple | 38 (24.0%) | 5.03 |
| Single Male/Father | 0 (0.0%) | - |
| Single Female/Mother | 53 (33.5%) | 4.81 |
| Non-family | 67 (42.4%) | - |
| Total Households | 158 (100.0%) | 3.25 |
Household Size by Marriage Status in Garza Salinas II
Out of a total of 158 households in Garza Salinas II, 91 (57.6%) are family households, while 67 (42.4%) are nonfamily households. The most numerous type of family households are 4-person households, comprising 34, and the most common type of nonfamily households are 1-person households, comprising 67.
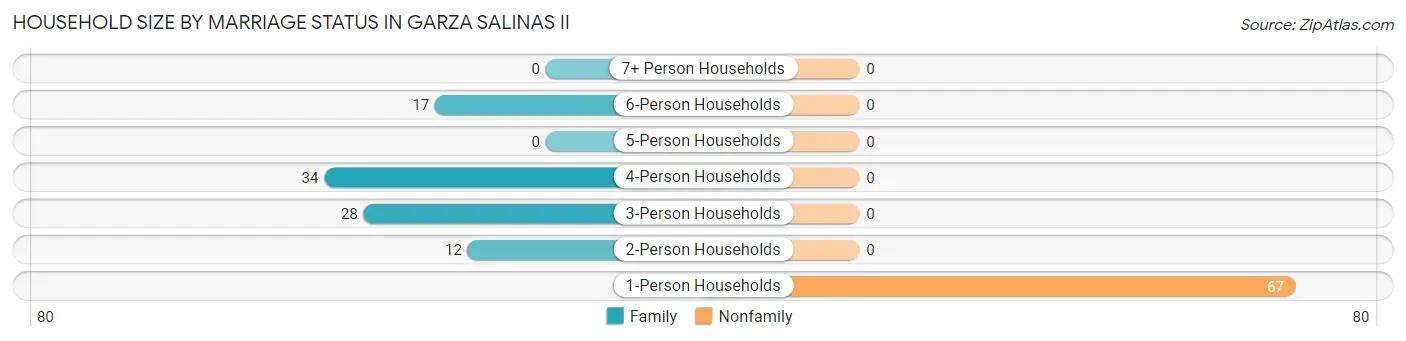
| Household Size | Family Households | Nonfamily Households |
| 1-Person Households | - | 67 (42.4%) |
| 2-Person Households | 12 (7.6%) | 0 (0.0%) |
| 3-Person Households | 28 (17.7%) | 0 (0.0%) |
| 4-Person Households | 34 (21.5%) | 0 (0.0%) |
| 5-Person Households | 0 (0.0%) | 0 (0.0%) |
| 6-Person Households | 17 (10.8%) | 0 (0.0%) |
| 7+ Person Households | 0 (0.0%) | 0 (0.0%) |
| Total | 91 (57.6%) | 67 (42.4%) |
Female Fertility in Garza Salinas II
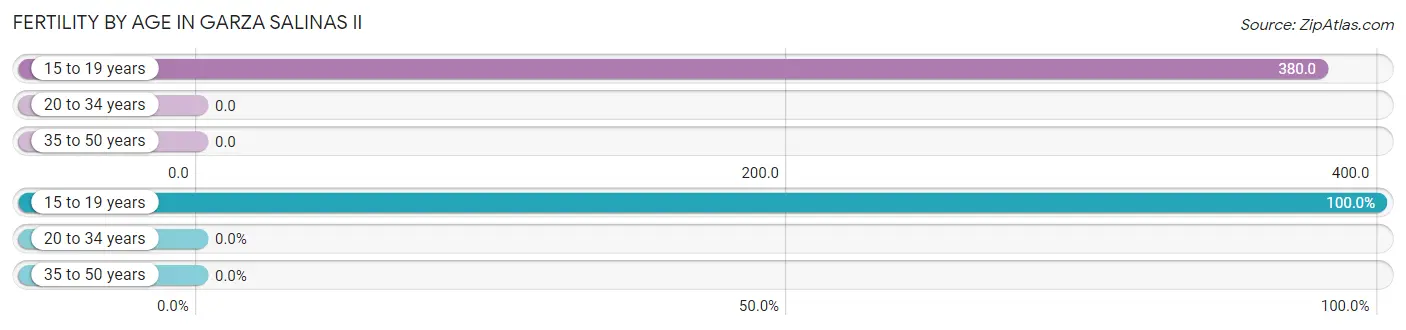
Fertility by Age in Garza Salinas II
Average fertility rate in Garza Salinas II is 114.0 births per 1,000 women. Women in the age bracket of 15 to 19 years have the highest fertility rate with 380.0 births per 1,000 women. Women in the age bracket of 15 to 19 years acount for 100.0% of all women with births.
| Age Bracket | Women with Births | Births / 1,000 Women |
| 15 to 19 years | 19 (100.0%) | 380.0 |
| 20 to 34 years | 0 (0.0%) | 0.0 |
| 35 to 50 years | 0 (0.0%) | 0.0 |
| Total | 19 (100.0%) | 114.0 |
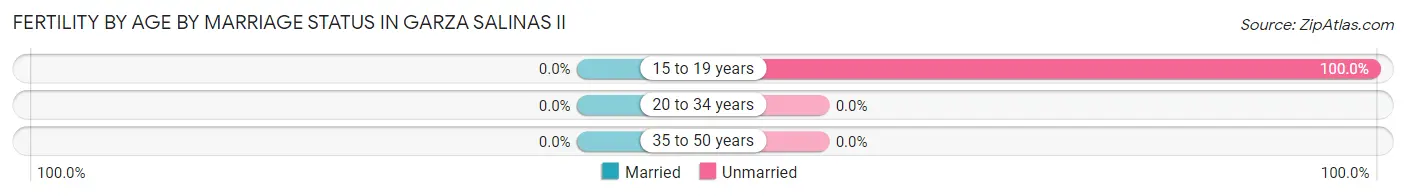
Fertility by Age by Marriage Status in Garza Salinas II
| Age Bracket | Married | Unmarried |
| 15 to 19 years | 0 (0.0%) | 19 (100.0%) |
| 20 to 34 years | 0 (0.0%) | 0 (0.0%) |
| 35 to 50 years | 0 (0.0%) | 0 (0.0%) |
| Total | 0 (0.0%) | 19 (100.0%) |
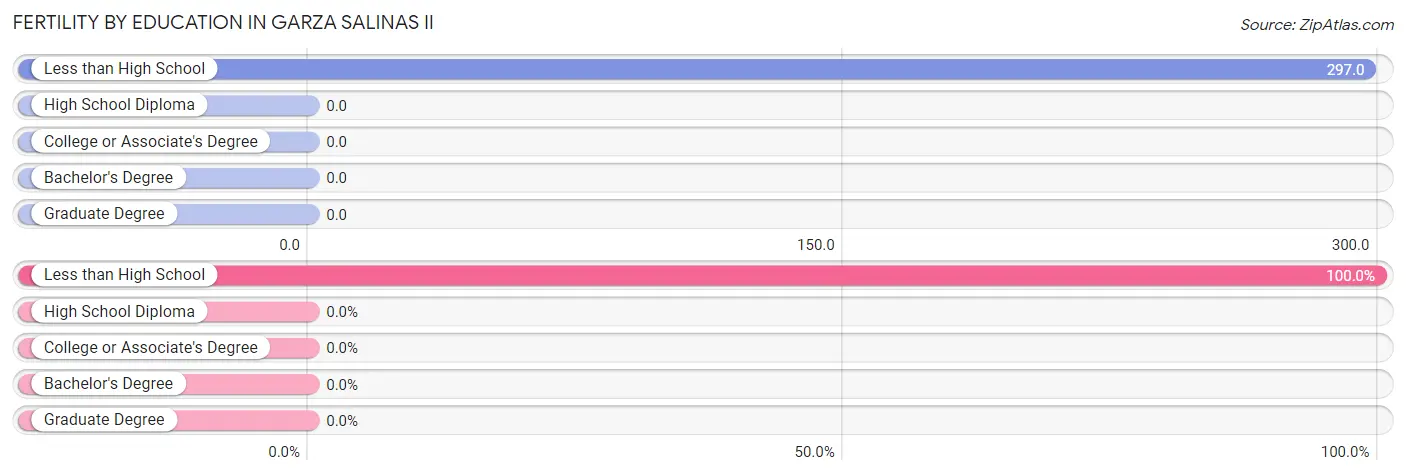
Fertility by Education in Garza Salinas II
| Educational Attainment | Women with Births | Births / 1,000 Women |
| Less than High School | 19 (100.0%) | 297.0 |
| High School Diploma | 0 (0.0%) | 0.0 |
| College or Associate's Degree | 0 (0.0%) | 0.0 |
| Bachelor's Degree | 0 (0.0%) | 0.0 |
| Graduate Degree | 0 (0.0%) | 0.0 |
| Total | 19 (100.0%) | 114.0 |
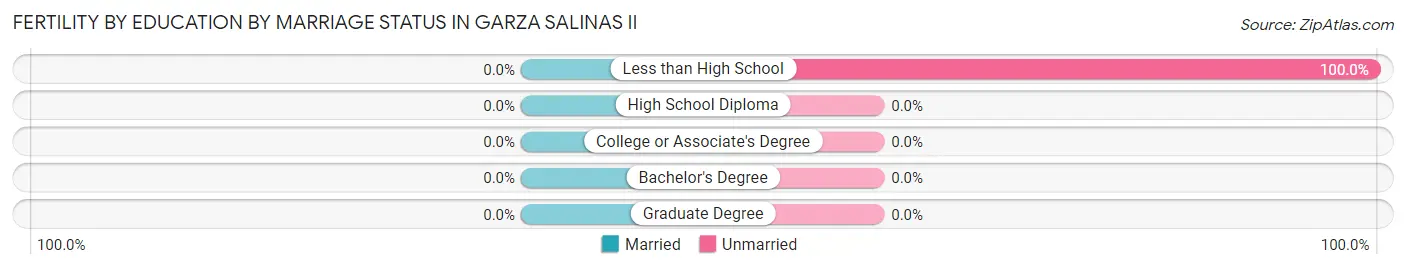
Fertility by Education by Marriage Status in Garza Salinas II
| Educational Attainment | Married | Unmarried |
| Less than High School | 0 (0.0%) | 19 (100.0%) |
| High School Diploma | 0 (0.0%) | 0 (0.0%) |
| College or Associate's Degree | 0 (0.0%) | 0 (0.0%) |
| Bachelor's Degree | 0 (0.0%) | 0 (0.0%) |
| Graduate Degree | 0 (0.0%) | 0 (0.0%) |
| Total | 0 (0.0%) | 19 (100.0%) |
Employment Characteristics in Garza Salinas II
Employment by Class of Employer in Garza Salinas II
Among the 140 employed individuals in Garza Salinas II, , and private company employees (140 | 100.0%) make up the most common classes of employment.
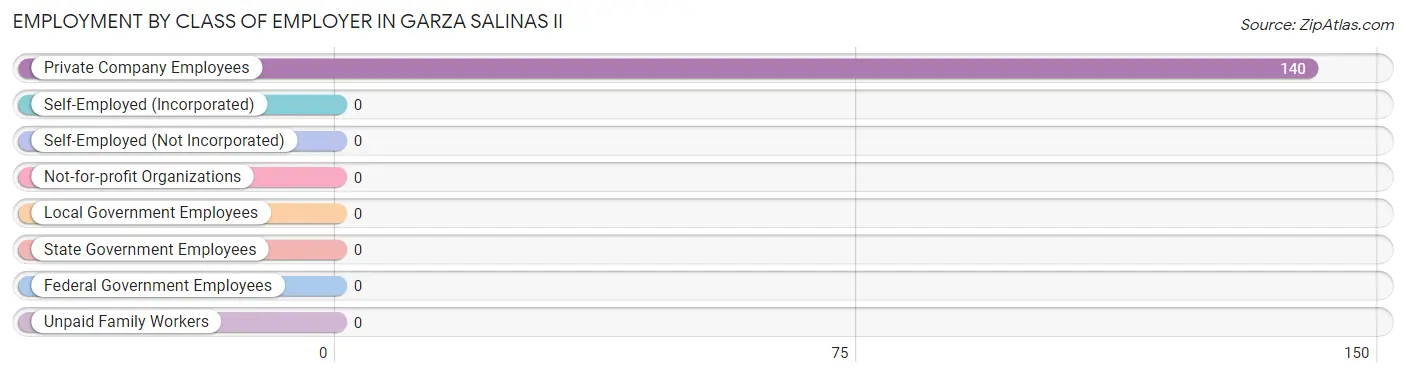
| Employer Class | # Employees | % Employees |
| Private Company Employees | 140 | 100.0% |
| Self-Employed (Incorporated) | 0 | 0.0% |
| Self-Employed (Not Incorporated) | 0 | 0.0% |
| Not-for-profit Organizations | 0 | 0.0% |
| Local Government Employees | 0 | 0.0% |
| State Government Employees | 0 | 0.0% |
| Federal Government Employees | 0 | 0.0% |
| Unpaid Family Workers | 0 | 0.0% |
| Total | 140 | 100.0% |
Employment Status by Age in Garza Salinas II
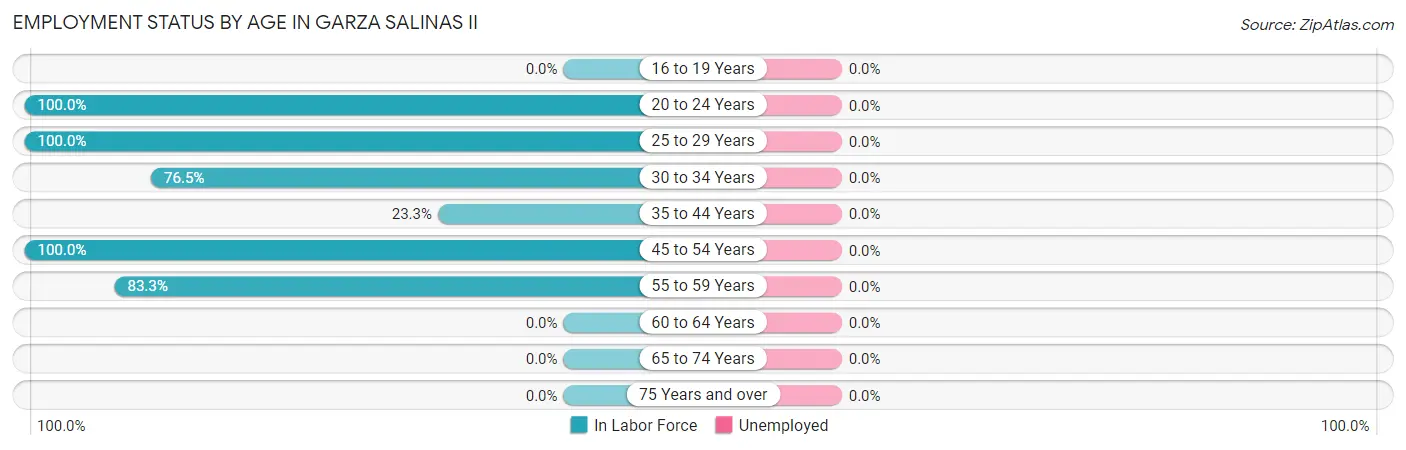
| Age Bracket | In Labor Force | Unemployed |
| 16 to 19 Years | 0 (0.0%) | 0 (0.0%) |
| 20 to 24 Years | 27 (100.0%) | 0 (0.0%) |
| 25 to 29 Years | 5 (100.0%) | 0 (0.0%) |
| 30 to 34 Years | 52 (76.5%) | 0 (0.0%) |
| 35 to 44 Years | 7 (23.3%) | 0 (0.0%) |
| 45 to 54 Years | 39 (100.0%) | 0 (0.0%) |
| 55 to 59 Years | 10 (83.3%) | 0 (0.0%) |
| 60 to 64 Years | 0 (0.0%) | 0 (0.0%) |
| 65 to 74 Years | 0 (0.0%) | 0 (0.0%) |
| 75 Years and over | 0 (0.0%) | 0 (0.0%) |
| Total | 140 (44.7%) | 0 (0.0%) |
Employment Status by Educational Attainment in Garza Salinas II
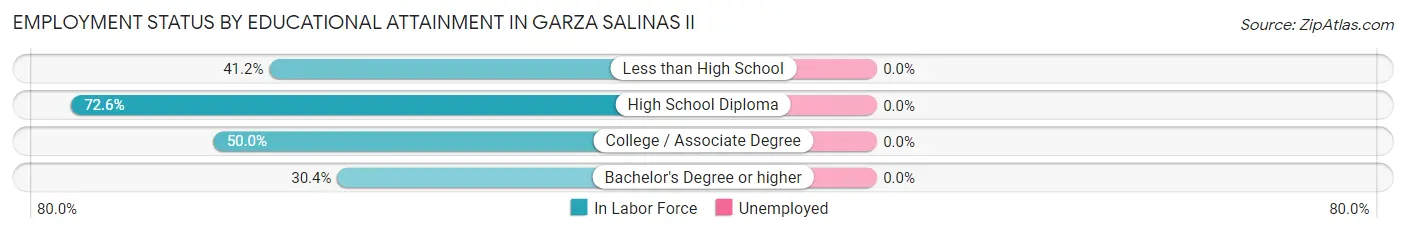
| Educational Attainment | In Labor Force | Unemployed |
| Less than High School | 40 (41.2%) | 0 (0.0%) |
| High School Diploma | 61 (72.6%) | 0 (0.0%) |
| College / Associate Degree | 5 (50.0%) | 0 (0.0%) |
| Bachelor's Degree or higher | 7 (30.4%) | 0 (0.0%) |
| Total | 113 (52.8%) | 0 (0.0%) |
Employment Occupations by Sex in Garza Salinas II
Management, Business, Science and Arts Occupations
The most common Management, Business, Science and Arts occupations in Garza Salinas II are Community & Social Service (7 | 5.0%), and Arts, Media & Entertainment (7 | 5.0%).
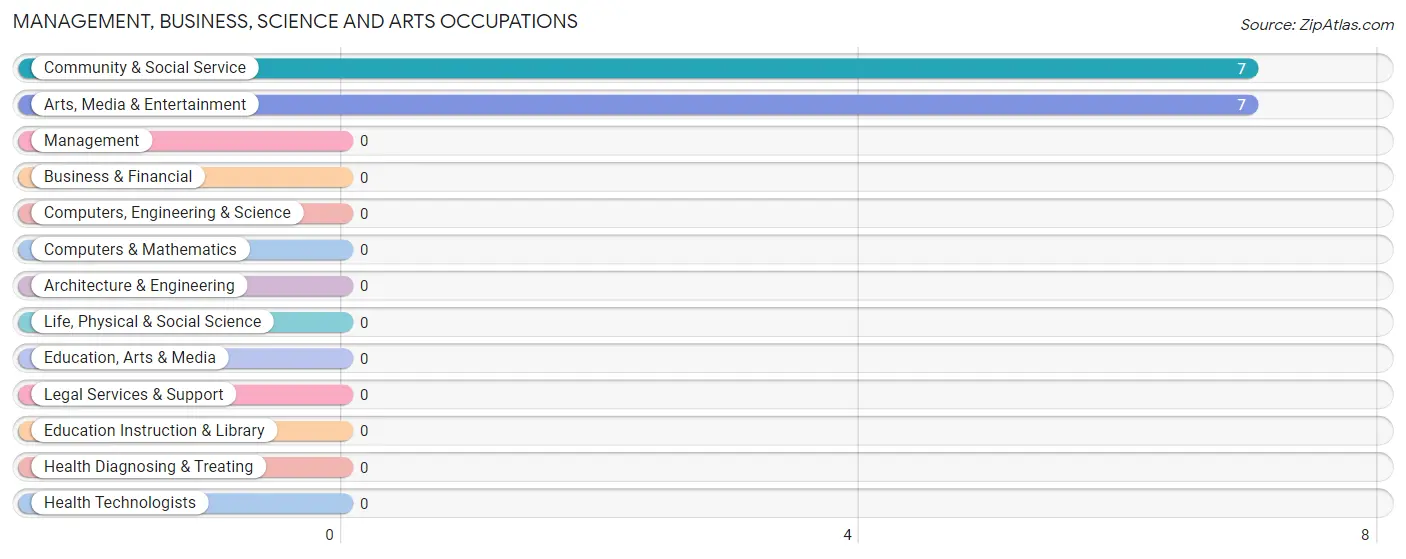
Management, Business, Science and Arts Occupations by Sex
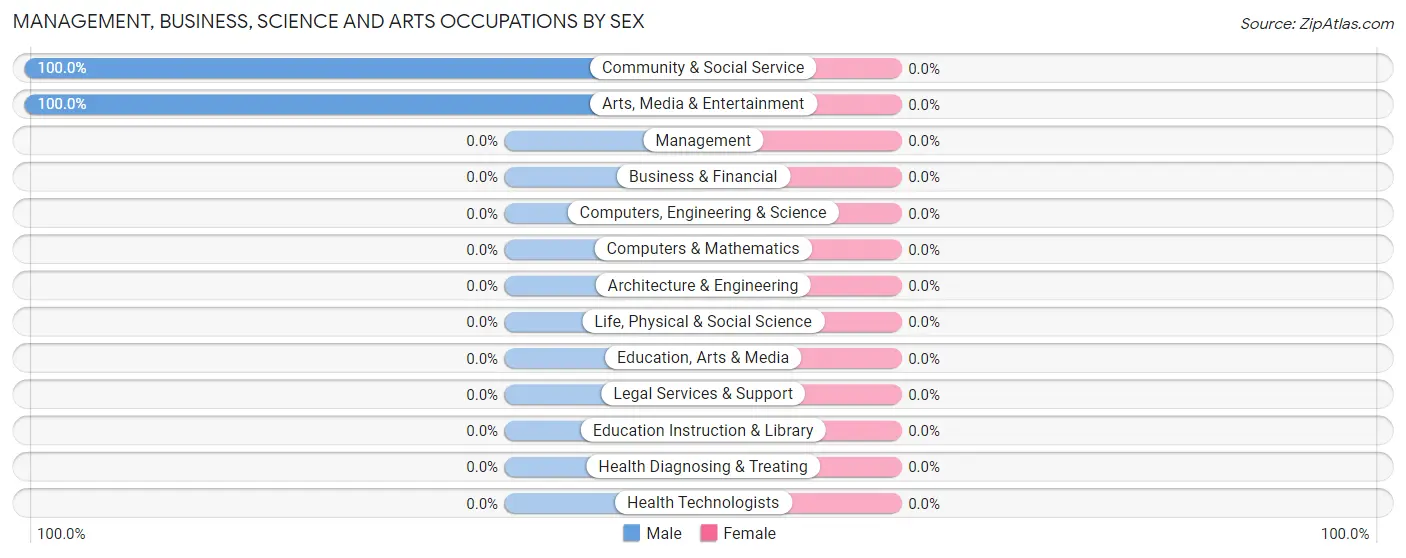
| Occupation | Male | Female |
| Management | 0 (0.0%) | 0 (0.0%) |
| Business & Financial | 0 (0.0%) | 0 (0.0%) |
| Computers, Engineering & Science | 0 (0.0%) | 0 (0.0%) |
| Computers & Mathematics | 0 (0.0%) | 0 (0.0%) |
| Architecture & Engineering | 0 (0.0%) | 0 (0.0%) |
| Life, Physical & Social Science | 0 (0.0%) | 0 (0.0%) |
| Community & Social Service | 7 (100.0%) | 0 (0.0%) |
| Education, Arts & Media | 0 (0.0%) | 0 (0.0%) |
| Legal Services & Support | 0 (0.0%) | 0 (0.0%) |
| Education Instruction & Library | 0 (0.0%) | 0 (0.0%) |
| Arts, Media & Entertainment | 7 (100.0%) | 0 (0.0%) |
| Health Diagnosing & Treating | 0 (0.0%) | 0 (0.0%) |
| Health Technologists | 0 (0.0%) | 0 (0.0%) |
| Total (Category) | 7 (100.0%) | 0 (0.0%) |
| Total (Overall) | 42 (30.0%) | 98 (70.0%) |
Services Occupations
The most common Services occupations in Garza Salinas II are Food Preparation & Serving (31 | 22.1%), and Healthcare Support (21 | 15.0%).
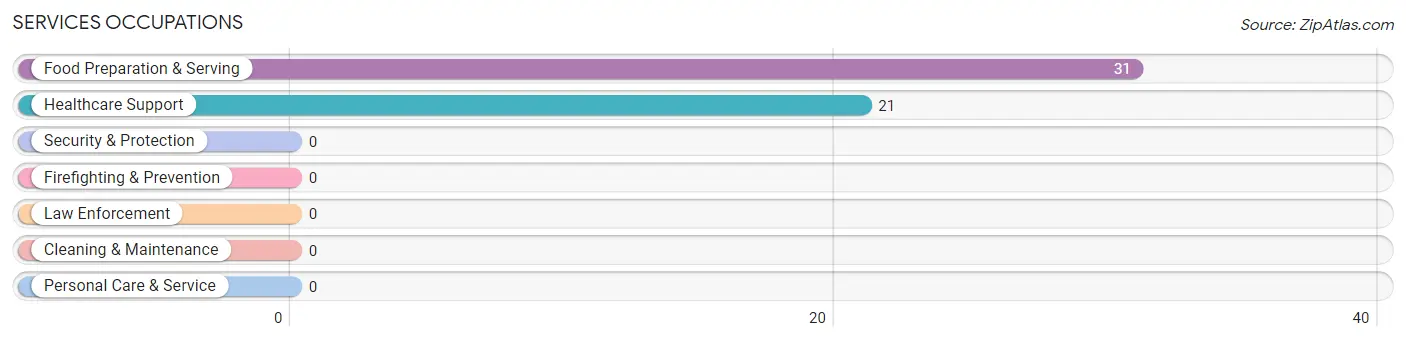
Services Occupations by Sex
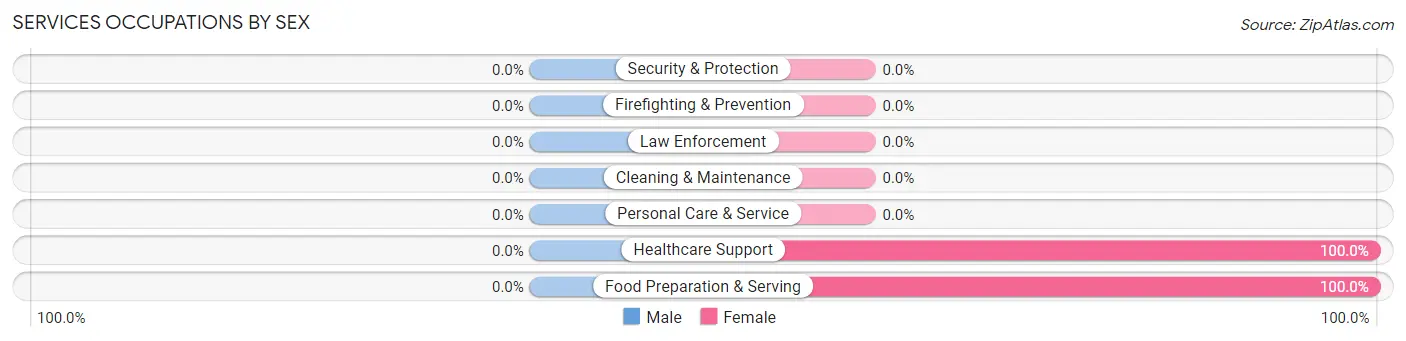
| Occupation | Male | Female |
| Healthcare Support | 0 (0.0%) | 21 (100.0%) |
| Security & Protection | 0 (0.0%) | 0 (0.0%) |
| Firefighting & Prevention | 0 (0.0%) | 0 (0.0%) |
| Law Enforcement | 0 (0.0%) | 0 (0.0%) |
| Food Preparation & Serving | 0 (0.0%) | 31 (100.0%) |
| Cleaning & Maintenance | 0 (0.0%) | 0 (0.0%) |
| Personal Care & Service | 0 (0.0%) | 0 (0.0%) |
| Total (Category) | 0 (0.0%) | 52 (100.0%) |
| Total (Overall) | 42 (30.0%) | 98 (70.0%) |
Sales and Office Occupations
The most common Sales and Office occupations in Garza Salinas II are , and Sales & Related (32 | 22.9%).

Sales and Office Occupations by Sex

| Occupation | Male | Female |
| Sales & Related | 0 (0.0%) | 32 (100.0%) |
| Office & Administration | 0 (0.0%) | 0 (0.0%) |
| Total (Category) | 0 (0.0%) | 32 (100.0%) |
| Total (Overall) | 42 (30.0%) | 98 (70.0%) |
Natural Resources, Construction and Maintenance Occupations
The most common Natural Resources, Construction and Maintenance occupations in Garza Salinas II are , and Installation, Maintenance & Repair (30 | 21.4%).
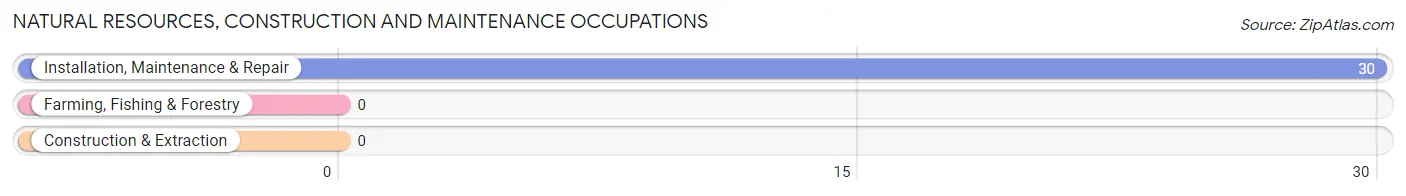
Natural Resources, Construction and Maintenance Occupations by Sex
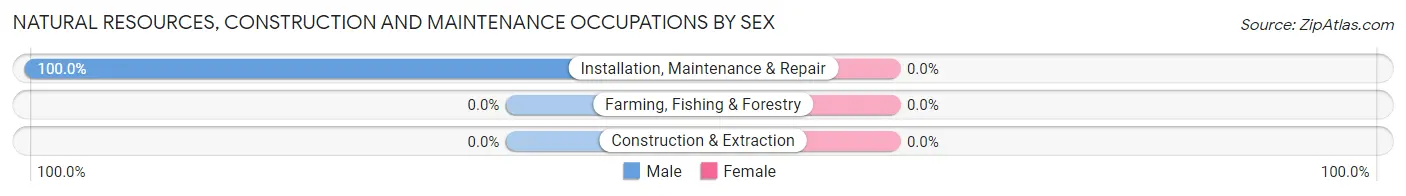
| Occupation | Male | Female |
| Farming, Fishing & Forestry | 0 (0.0%) | 0 (0.0%) |
| Construction & Extraction | 0 (0.0%) | 0 (0.0%) |
| Installation, Maintenance & Repair | 30 (100.0%) | 0 (0.0%) |
| Total (Category) | 30 (100.0%) | 0 (0.0%) |
| Total (Overall) | 42 (30.0%) | 98 (70.0%) |
Production, Transportation and Moving Occupations
The most common Production, Transportation and Moving occupations in Garza Salinas II are Transportation (14 | 10.0%), and Production (5 | 3.6%).
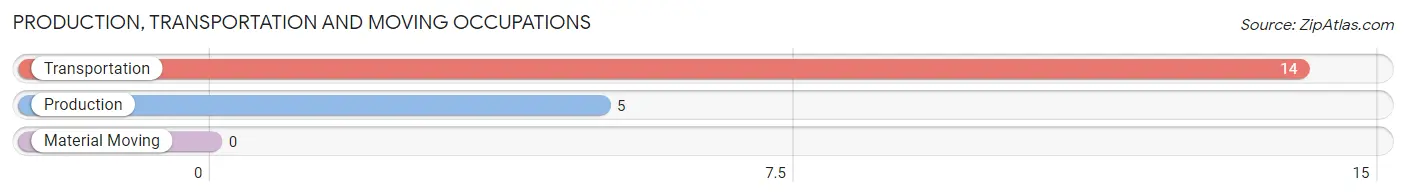
Production, Transportation and Moving Occupations by Sex
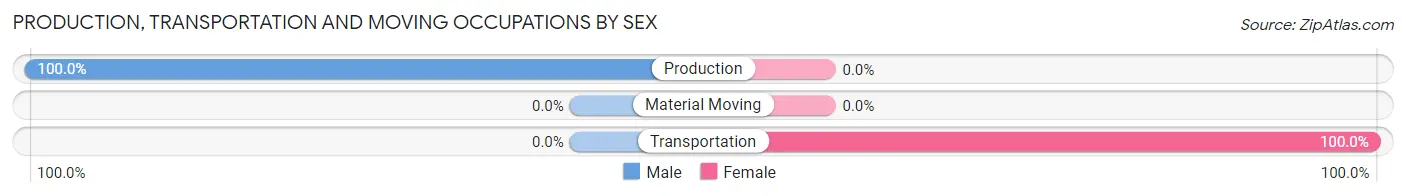
| Occupation | Male | Female |
| Production | 5 (100.0%) | 0 (0.0%) |
| Transportation | 0 (0.0%) | 14 (100.0%) |
| Material Moving | 0 (0.0%) | 0 (0.0%) |
| Total (Category) | 5 (26.3%) | 14 (73.7%) |
| Total (Overall) | 42 (30.0%) | 98 (70.0%) |
Employment Industries by Sex in Garza Salinas II
Employment Industries in Garza Salinas II
The major employment industries in Garza Salinas II include Health Care & Social Assistance (66 | 47.1%), Retail Trade (32 | 22.9%), Transportation & Warehousing (21 | 15.0%), Manufacturing (7 | 5.0%), and Mining, Quarrying, & Extraction (5 | 3.6%).
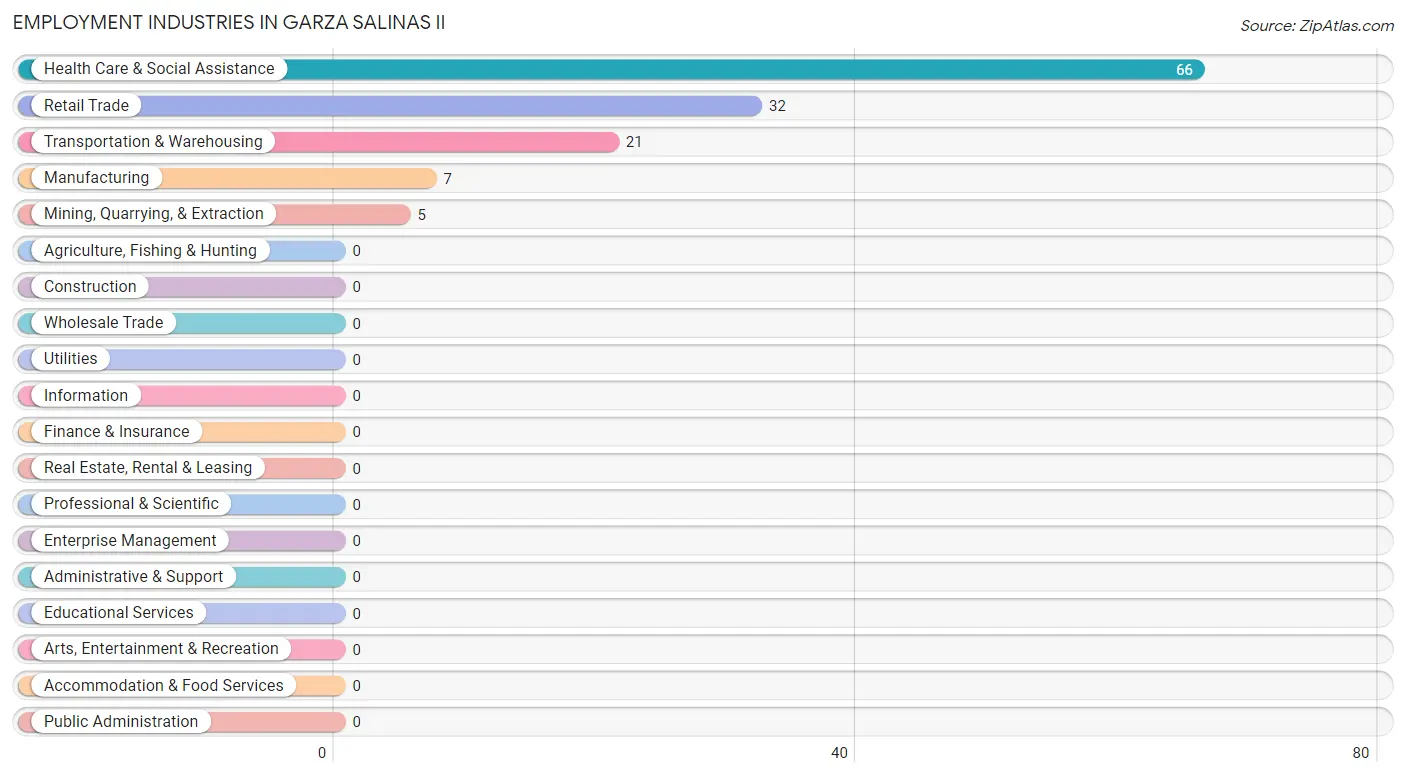
Employment Industries by Sex in Garza Salinas II
The Garza Salinas II industries that see more men than women are Mining, Quarrying, & Extraction (100.0%), Manufacturing (100.0%), and Transportation & Warehousing (100.0%), whereas the industries that tend to have a higher number of women are Retail Trade (100.0%), and Health Care & Social Assistance (100.0%).
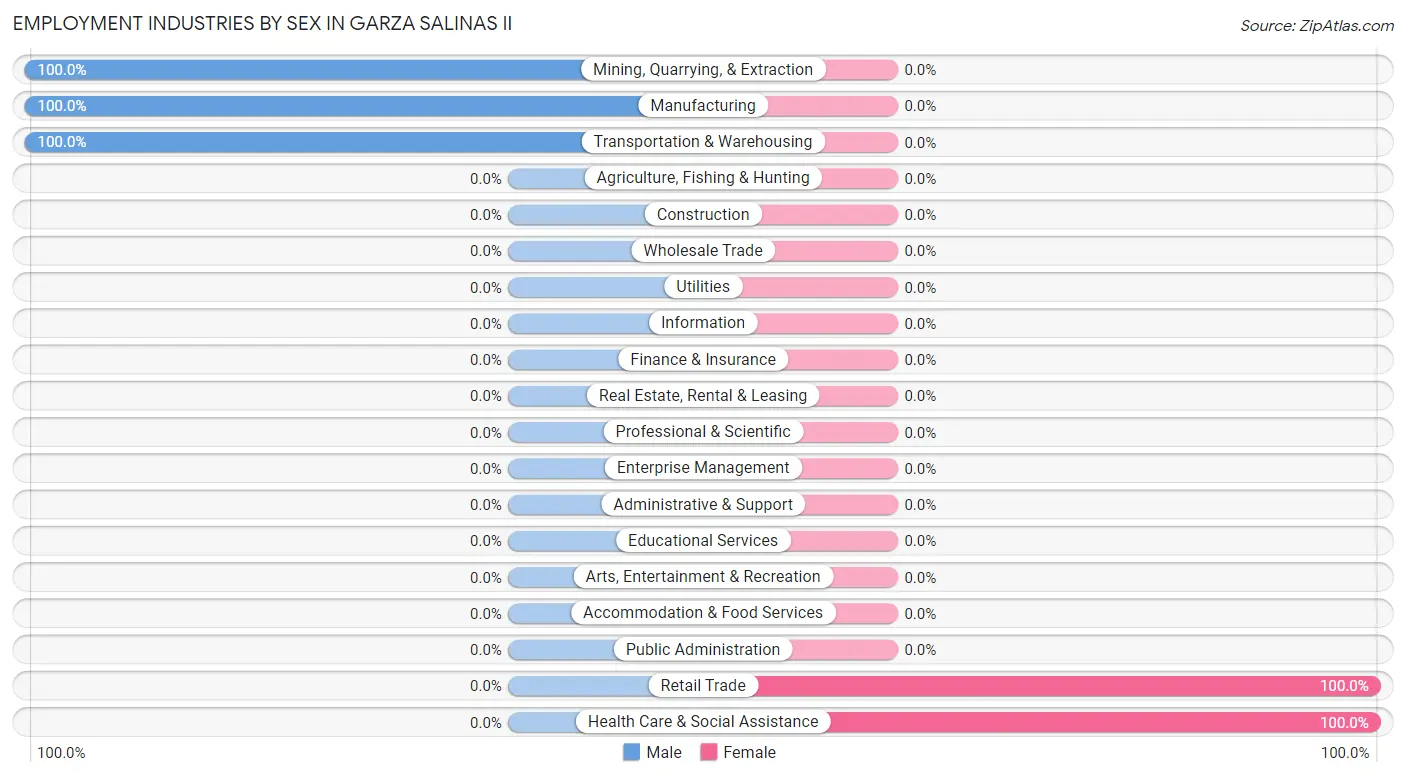
| Industry | Male | Female |
| Agriculture, Fishing & Hunting | 0 (0.0%) | 0 (0.0%) |
| Mining, Quarrying, & Extraction | 5 (100.0%) | 0 (0.0%) |
| Construction | 0 (0.0%) | 0 (0.0%) |
| Manufacturing | 7 (100.0%) | 0 (0.0%) |
| Wholesale Trade | 0 (0.0%) | 0 (0.0%) |
| Retail Trade | 0 (0.0%) | 32 (100.0%) |
| Transportation & Warehousing | 21 (100.0%) | 0 (0.0%) |
| Utilities | 0 (0.0%) | 0 (0.0%) |
| Information | 0 (0.0%) | 0 (0.0%) |
| Finance & Insurance | 0 (0.0%) | 0 (0.0%) |
| Real Estate, Rental & Leasing | 0 (0.0%) | 0 (0.0%) |
| Professional & Scientific | 0 (0.0%) | 0 (0.0%) |
| Enterprise Management | 0 (0.0%) | 0 (0.0%) |
| Administrative & Support | 0 (0.0%) | 0 (0.0%) |
| Educational Services | 0 (0.0%) | 0 (0.0%) |
| Health Care & Social Assistance | 0 (0.0%) | 66 (100.0%) |
| Arts, Entertainment & Recreation | 0 (0.0%) | 0 (0.0%) |
| Accommodation & Food Services | 0 (0.0%) | 0 (0.0%) |
| Public Administration | 0 (0.0%) | 0 (0.0%) |
| Total | 42 (30.0%) | 98 (70.0%) |
Education in Garza Salinas II
School Enrollment in Garza Salinas II
The most common levels of schooling among the 228 students in Garza Salinas II are middle school (67 | 29.4%), high school (50 | 21.9%), and elementary school (49 | 21.5%).
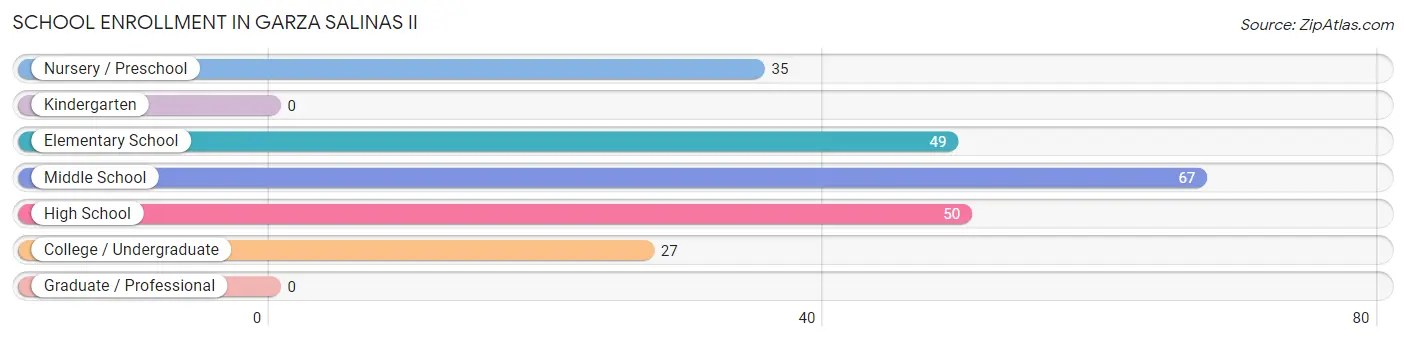
| School Level | # Students | % Students |
| Nursery / Preschool | 35 | 15.3% |
| Kindergarten | 0 | 0.0% |
| Elementary School | 49 | 21.5% |
| Middle School | 67 | 29.4% |
| High School | 50 | 21.9% |
| College / Undergraduate | 27 | 11.8% |
| Graduate / Professional | 0 | 0.0% |
| Total | 228 | 100.0% |
School Enrollment by Age by Funding Source in Garza Salinas II
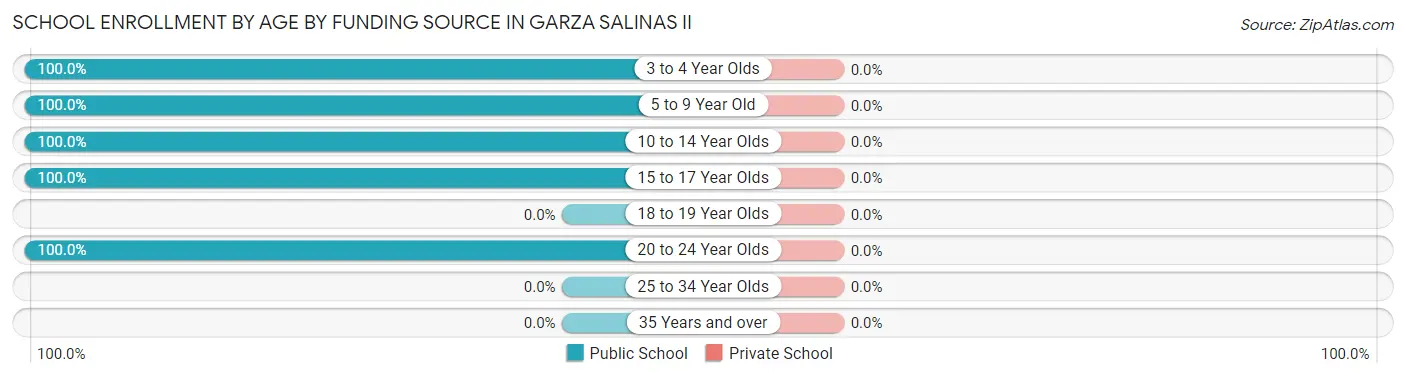
| Age Bracket | Public School | Private School |
| 3 to 4 Year Olds | 35 (100.0%) | 0 (0.0%) |
| 5 to 9 Year Old | 49 (100.0%) | 0 (0.0%) |
| 10 to 14 Year Olds | 67 (100.0%) | 0 (0.0%) |
| 15 to 17 Year Olds | 50 (100.0%) | 0 (0.0%) |
| 18 to 19 Year Olds | 0 (0.0%) | 0 (0.0%) |
| 20 to 24 Year Olds | 27 (100.0%) | 0 (0.0%) |
| 25 to 34 Year Olds | 0 (0.0%) | 0 (0.0%) |
| 35 Years and over | 0 (0.0%) | 0 (0.0%) |
| Total | 228 (100.0%) | 0 (0.0%) |
Educational Attainment by Field of Study in Garza Salinas II
Psychology (16 | 69.6%), and visual & performing arts (7 | 30.4%) are the most common fields of study among 23 individuals in Garza Salinas II who have obtained a bachelor's degree or higher.
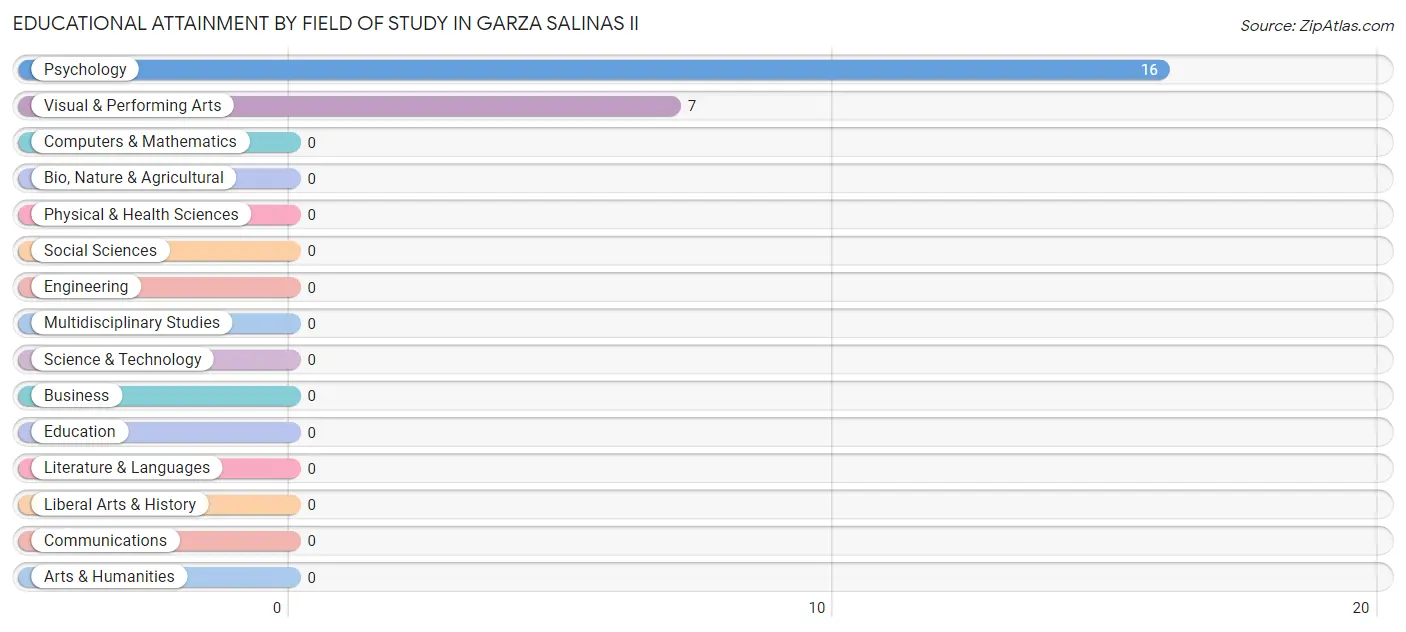
| Field of Study | # Graduates | % Graduates |
| Computers & Mathematics | 0 | 0.0% |
| Bio, Nature & Agricultural | 0 | 0.0% |
| Physical & Health Sciences | 0 | 0.0% |
| Psychology | 16 | 69.6% |
| Social Sciences | 0 | 0.0% |
| Engineering | 0 | 0.0% |
| Multidisciplinary Studies | 0 | 0.0% |
| Science & Technology | 0 | 0.0% |
| Business | 0 | 0.0% |
| Education | 0 | 0.0% |
| Literature & Languages | 0 | 0.0% |
| Liberal Arts & History | 0 | 0.0% |
| Visual & Performing Arts | 7 | 30.4% |
| Communications | 0 | 0.0% |
| Arts & Humanities | 0 | 0.0% |
| Total | 23 | 100.0% |
Transportation & Commute in Garza Salinas II
Vehicle Availability by Sex in Garza Salinas II
The most prevalent vehicle ownership categories in Garza Salinas II are males with 2 vehicles (28, accounting for 66.7%) and females with 2 vehicles (46, making up 28.6%).
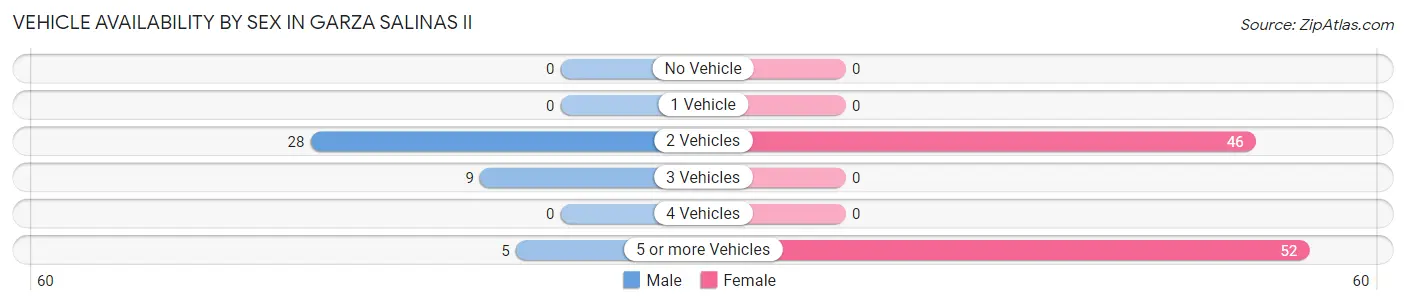
| Vehicles Available | Male | Female |
| No Vehicle | 0 (0.0%) | 0 (0.0%) |
| 1 Vehicle | 0 (0.0%) | 0 (0.0%) |
| 2 Vehicles | 28 (66.7%) | 46 (46.9%) |
| 3 Vehicles | 9 (21.4%) | 0 (0.0%) |
| 4 Vehicles | 0 (0.0%) | 0 (0.0%) |
| 5 or more Vehicles | 5 (11.9%) | 52 (53.1%) |
| Total | 42 (100.0%) | 98 (100.0%) |
Commute Time in Garza Salinas II
The most frequently occuring commute durations in Garza Salinas II are 10 to 14 minutes (98 commuters, 70.0%), 15 to 19 minutes (23 commuters, 16.4%), and 5 to 9 minutes (19 commuters, 13.6%).
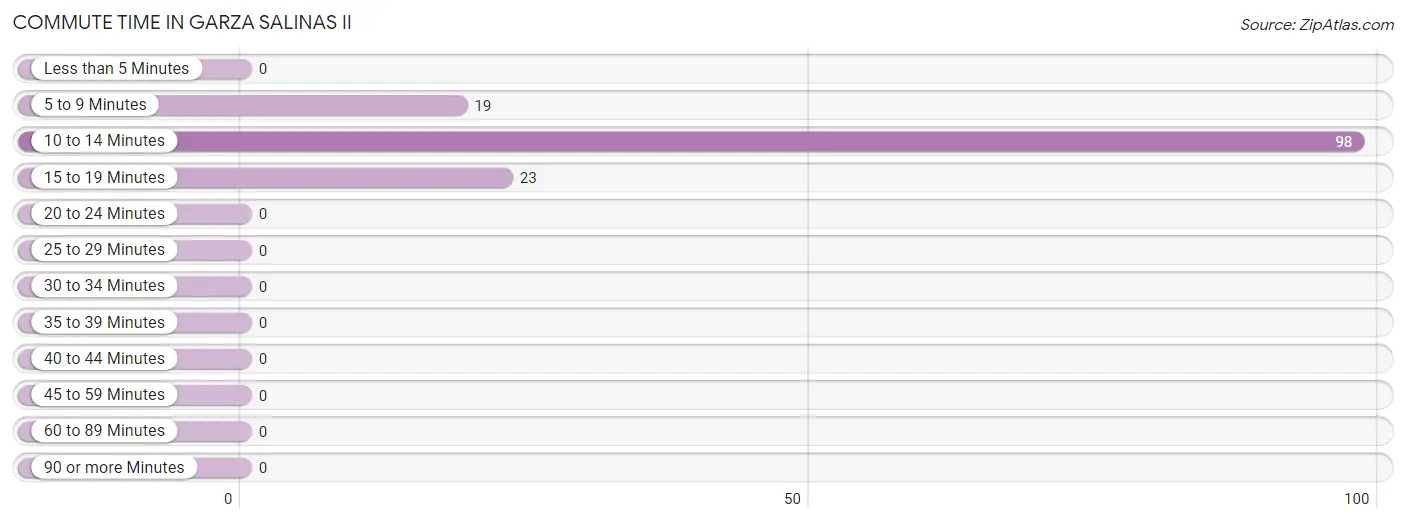
| Commute Time | # Commuters | % Commuters |
| Less than 5 Minutes | 0 | 0.0% |
| 5 to 9 Minutes | 19 | 13.6% |
| 10 to 14 Minutes | 98 | 70.0% |
| 15 to 19 Minutes | 23 | 16.4% |
| 20 to 24 Minutes | 0 | 0.0% |
| 25 to 29 Minutes | 0 | 0.0% |
| 30 to 34 Minutes | 0 | 0.0% |
| 35 to 39 Minutes | 0 | 0.0% |
| 40 to 44 Minutes | 0 | 0.0% |
| 45 to 59 Minutes | 0 | 0.0% |
| 60 to 89 Minutes | 0 | 0.0% |
| 90 or more Minutes | 0 | 0.0% |
Commute Time by Sex in Garza Salinas II
The most common commute times in Garza Salinas II are 10 to 14 minutes (21 commuters, 50.0%) for males and 10 to 14 minutes (77 commuters, 78.6%) for females.
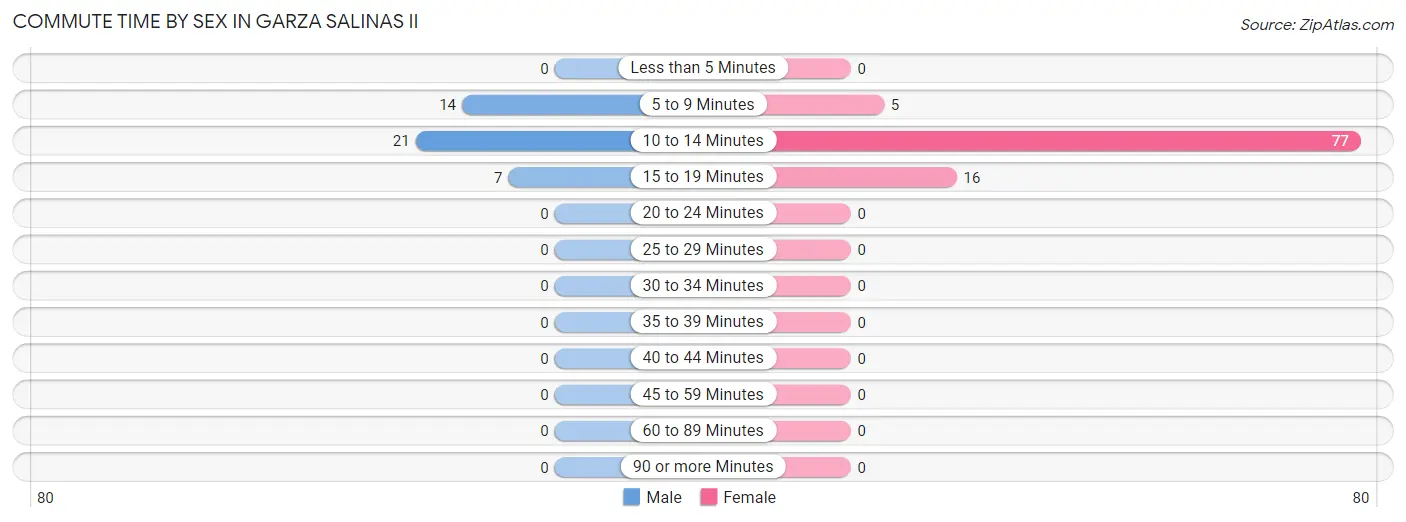
| Commute Time | Male | Female |
| Less than 5 Minutes | 0 (0.0%) | 0 (0.0%) |
| 5 to 9 Minutes | 14 (33.3%) | 5 (5.1%) |
| 10 to 14 Minutes | 21 (50.0%) | 77 (78.6%) |
| 15 to 19 Minutes | 7 (16.7%) | 16 (16.3%) |
| 20 to 24 Minutes | 0 (0.0%) | 0 (0.0%) |
| 25 to 29 Minutes | 0 (0.0%) | 0 (0.0%) |
| 30 to 34 Minutes | 0 (0.0%) | 0 (0.0%) |
| 35 to 39 Minutes | 0 (0.0%) | 0 (0.0%) |
| 40 to 44 Minutes | 0 (0.0%) | 0 (0.0%) |
| 45 to 59 Minutes | 0 (0.0%) | 0 (0.0%) |
| 60 to 89 Minutes | 0 (0.0%) | 0 (0.0%) |
| 90 or more Minutes | 0 (0.0%) | 0 (0.0%) |
Time of Departure to Work by Sex in Garza Salinas II
The most frequent times of departure to work in Garza Salinas II are 7:30 AM to 7:59 AM (21, 50.0%) for males and 12:00 PM to 3:59 PM (32, 32.7%) for females.
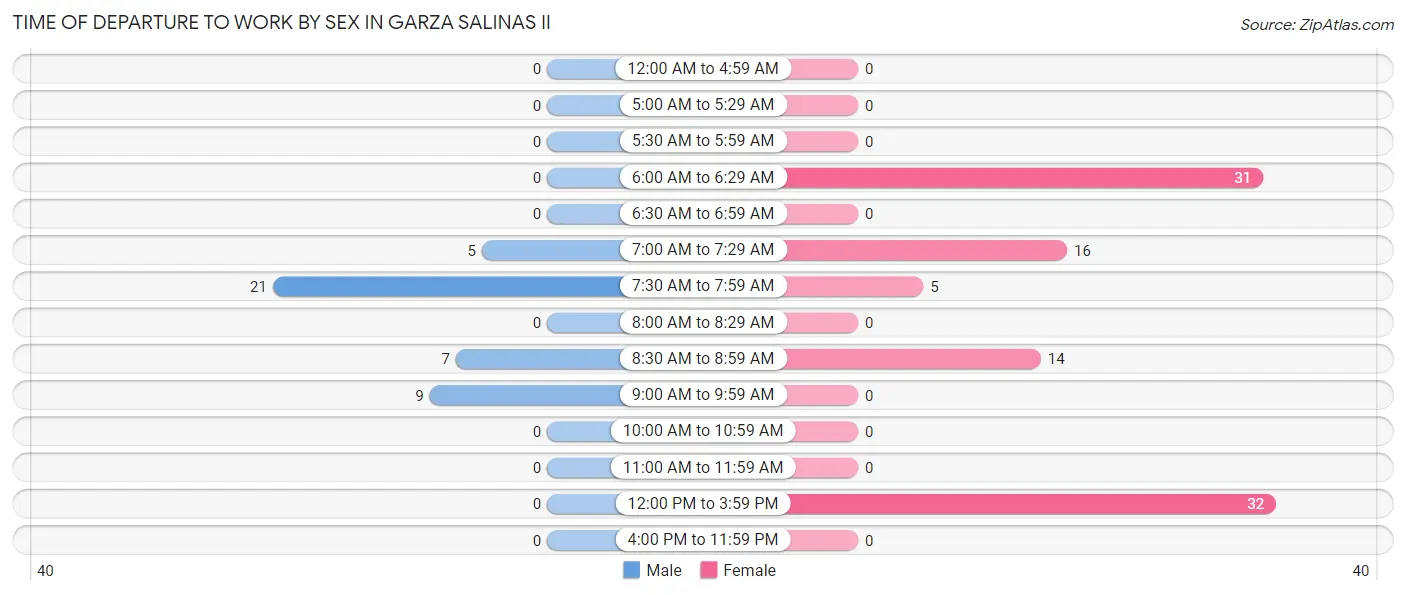
| Time of Departure | Male | Female |
| 12:00 AM to 4:59 AM | 0 (0.0%) | 0 (0.0%) |
| 5:00 AM to 5:29 AM | 0 (0.0%) | 0 (0.0%) |
| 5:30 AM to 5:59 AM | 0 (0.0%) | 0 (0.0%) |
| 6:00 AM to 6:29 AM | 0 (0.0%) | 31 (31.6%) |
| 6:30 AM to 6:59 AM | 0 (0.0%) | 0 (0.0%) |
| 7:00 AM to 7:29 AM | 5 (11.9%) | 16 (16.3%) |
| 7:30 AM to 7:59 AM | 21 (50.0%) | 5 (5.1%) |
| 8:00 AM to 8:29 AM | 0 (0.0%) | 0 (0.0%) |
| 8:30 AM to 8:59 AM | 7 (16.7%) | 14 (14.3%) |
| 9:00 AM to 9:59 AM | 9 (21.4%) | 0 (0.0%) |
| 10:00 AM to 10:59 AM | 0 (0.0%) | 0 (0.0%) |
| 11:00 AM to 11:59 AM | 0 (0.0%) | 0 (0.0%) |
| 12:00 PM to 3:59 PM | 0 (0.0%) | 32 (32.7%) |
| 4:00 PM to 11:59 PM | 0 (0.0%) | 0 (0.0%) |
| Total | 42 (100.0%) | 98 (100.0%) |
Housing Occupancy in Garza Salinas II
Occupancy by Ownership in Garza Salinas II
Of the total 158 dwellings in Garza Salinas II, owner-occupied units account for 111 (70.3%), while renter-occupied units make up 47 (29.7%).
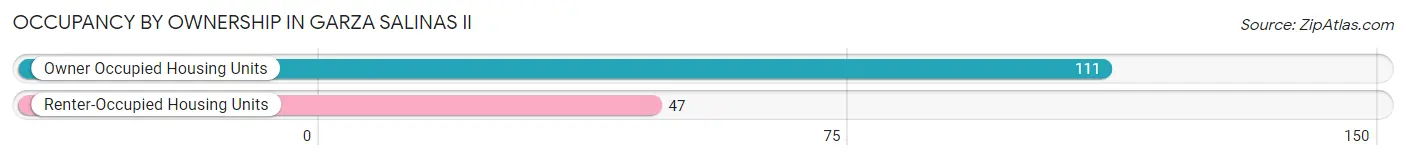
| Occupancy | # Housing Units | % Housing Units |
| Owner Occupied Housing Units | 111 | 70.3% |
| Renter-Occupied Housing Units | 47 | 29.7% |
| Total Occupied Housing Units | 158 | 100.0% |
Occupancy by Household Size in Garza Salinas II
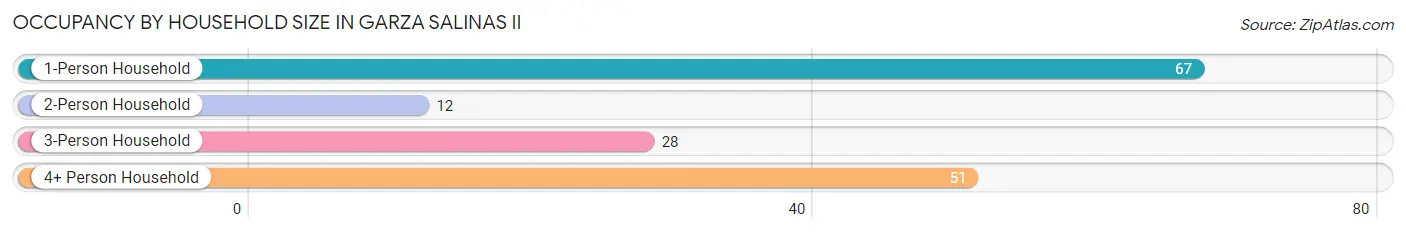
| Household Size | # Housing Units | % Housing Units |
| 1-Person Household | 67 | 42.4% |
| 2-Person Household | 12 | 7.6% |
| 3-Person Household | 28 | 17.7% |
| 4+ Person Household | 51 | 32.3% |
| Total Housing Units | 158 | 100.0% |
Occupancy by Ownership by Household Size in Garza Salinas II
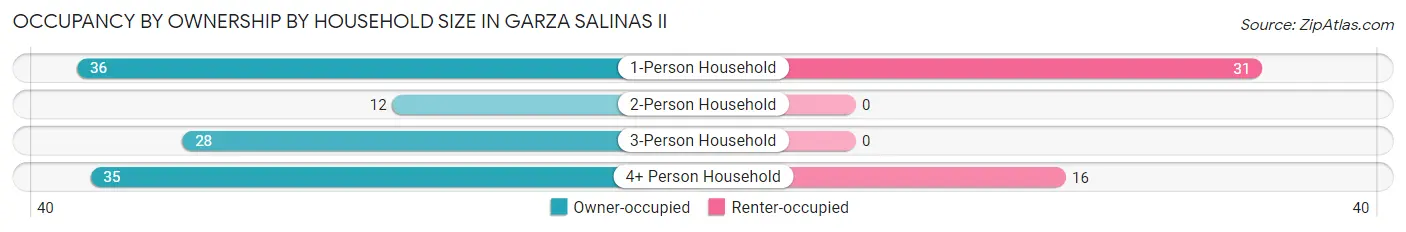
| Household Size | Owner-occupied | Renter-occupied |
| 1-Person Household | 36 (53.7%) | 31 (46.3%) |
| 2-Person Household | 12 (100.0%) | 0 (0.0%) |
| 3-Person Household | 28 (100.0%) | 0 (0.0%) |
| 4+ Person Household | 35 (68.6%) | 16 (31.4%) |
| Total Housing Units | 111 (70.3%) | 47 (29.7%) |
Occupancy by Educational Attainment in Garza Salinas II
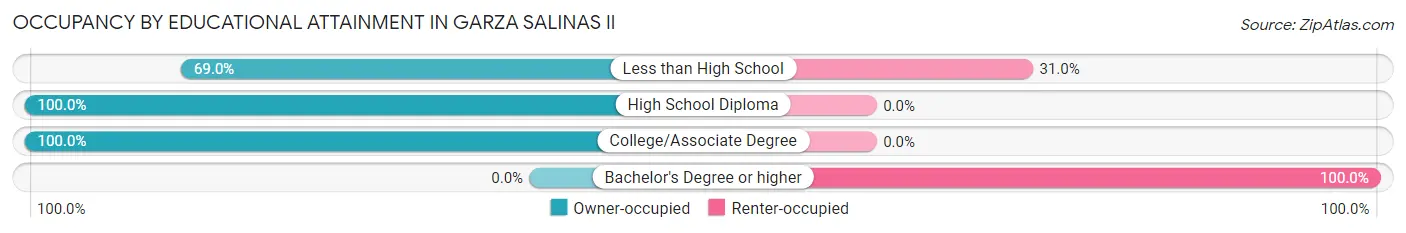
| Household Size | Owner-occupied | Renter-occupied |
| Less than High School | 69 (69.0%) | 31 (31.0%) |
| High School Diploma | 37 (100.0%) | 0 (0.0%) |
| College/Associate Degree | 5 (100.0%) | 0 (0.0%) |
| Bachelor's Degree or higher | 0 (0.0%) | 16 (100.0%) |
Occupancy by Age of Householder in Garza Salinas II
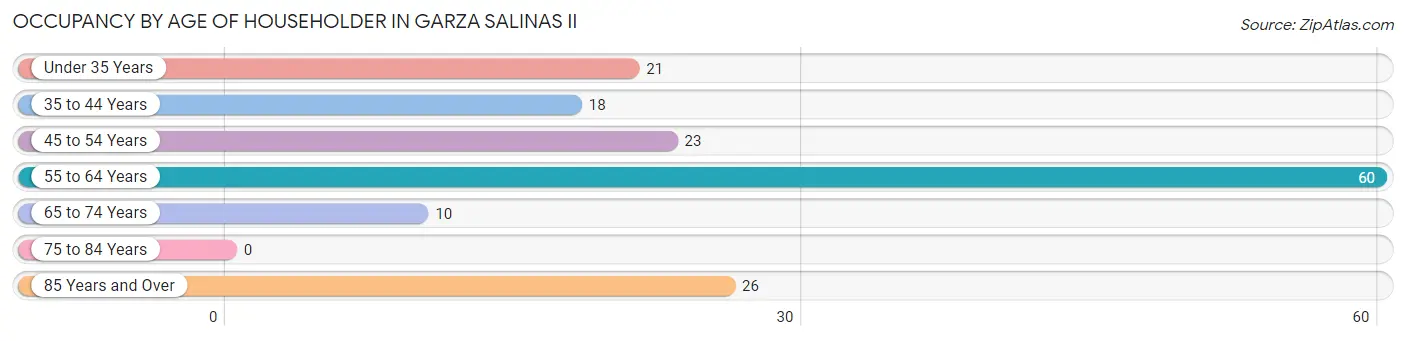
| Age Bracket | # Households | % Households |
| Under 35 Years | 21 | 13.3% |
| 35 to 44 Years | 18 | 11.4% |
| 45 to 54 Years | 23 | 14.6% |
| 55 to 64 Years | 60 | 38.0% |
| 65 to 74 Years | 10 | 6.3% |
| 75 to 84 Years | 0 | 0.0% |
| 85 Years and Over | 26 | 16.5% |
| Total | 158 | 100.0% |
Housing Finances in Garza Salinas II
Median Income by Occupancy in Garza Salinas II
| Occupancy Type | # Households | Median Income |
| Owner-Occupied | 111 (70.3%) | $0 |
| Renter-Occupied | 47 (29.7%) | $0 |
| Average | 158 (100.0%) | $0 |
Occupancy by Householder Income Bracket in Garza Salinas II
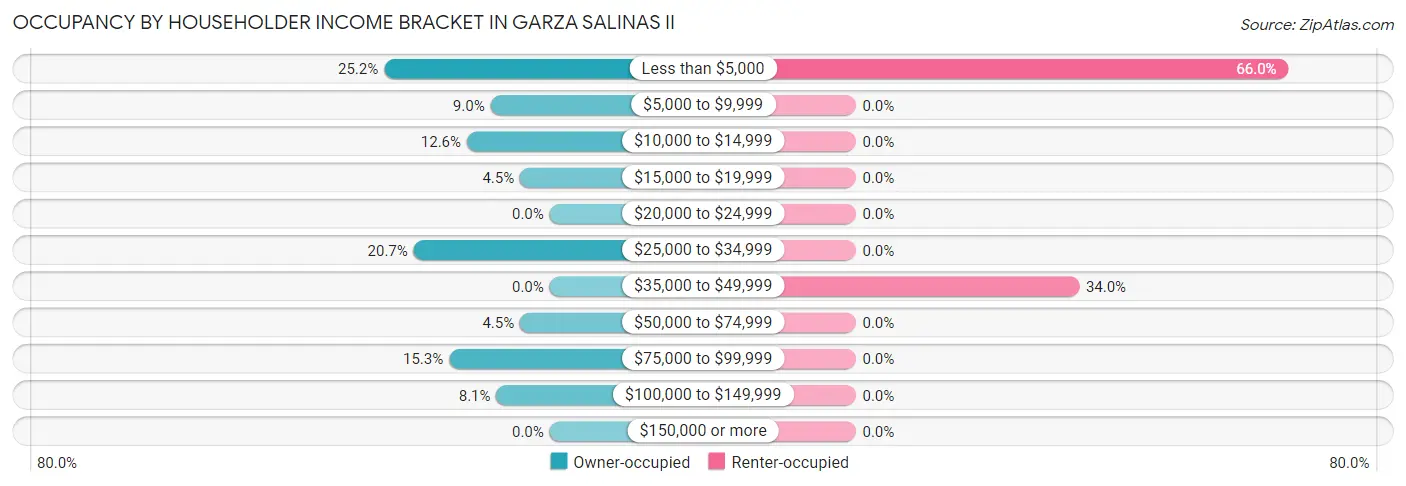
| Income Bracket | Owner-occupied | Renter-occupied |
| Less than $5,000 | 28 (25.2%) | 31 (66.0%) |
| $5,000 to $9,999 | 10 (9.0%) | 0 (0.0%) |
| $10,000 to $14,999 | 14 (12.6%) | 0 (0.0%) |
| $15,000 to $19,999 | 5 (4.5%) | 0 (0.0%) |
| $20,000 to $24,999 | 0 (0.0%) | 0 (0.0%) |
| $25,000 to $34,999 | 23 (20.7%) | 0 (0.0%) |
| $35,000 to $49,999 | 0 (0.0%) | 16 (34.0%) |
| $50,000 to $74,999 | 5 (4.5%) | 0 (0.0%) |
| $75,000 to $99,999 | 17 (15.3%) | 0 (0.0%) |
| $100,000 to $149,999 | 9 (8.1%) | 0 (0.0%) |
| $150,000 or more | 0 (0.0%) | 0 (0.0%) |
| Total | 111 (100.0%) | 47 (100.0%) |
Monthly Housing Cost Tiers in Garza Salinas II
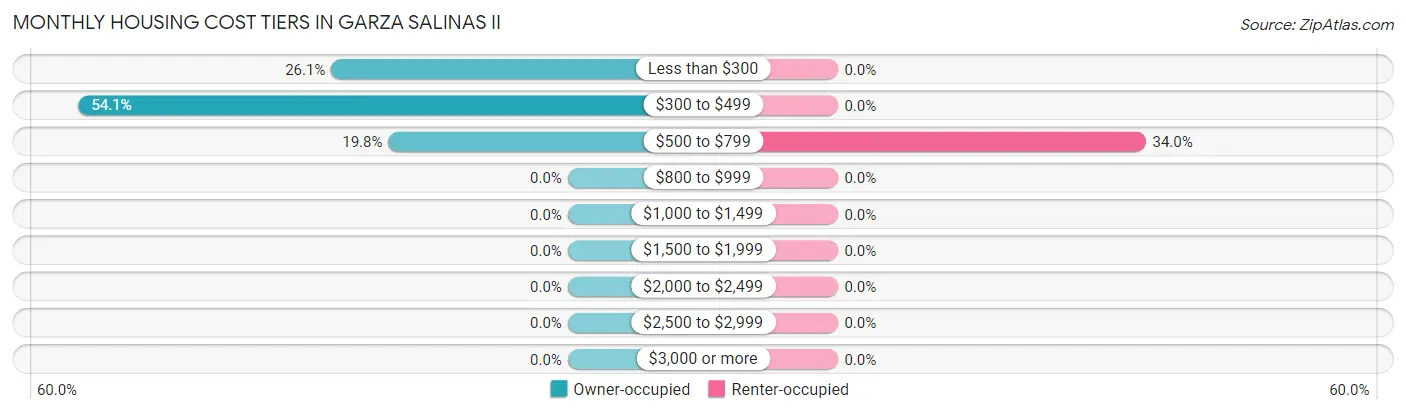
| Monthly Cost | Owner-occupied | Renter-occupied |
| Less than $300 | 29 (26.1%) | 0 (0.0%) |
| $300 to $499 | 60 (54.0%) | 0 (0.0%) |
| $500 to $799 | 22 (19.8%) | 16 (34.0%) |
| $800 to $999 | 0 (0.0%) | 0 (0.0%) |
| $1,000 to $1,499 | 0 (0.0%) | 0 (0.0%) |
| $1,500 to $1,999 | 0 (0.0%) | 0 (0.0%) |
| $2,000 to $2,499 | 0 (0.0%) | 0 (0.0%) |
| $2,500 to $2,999 | 0 (0.0%) | 0 (0.0%) |
| $3,000 or more | 0 (0.0%) | 0 (0.0%) |
| Total | 111 (100.0%) | 47 (100.0%) |
Physical Housing Characteristics in Garza Salinas II
Housing Structures in Garza Salinas II
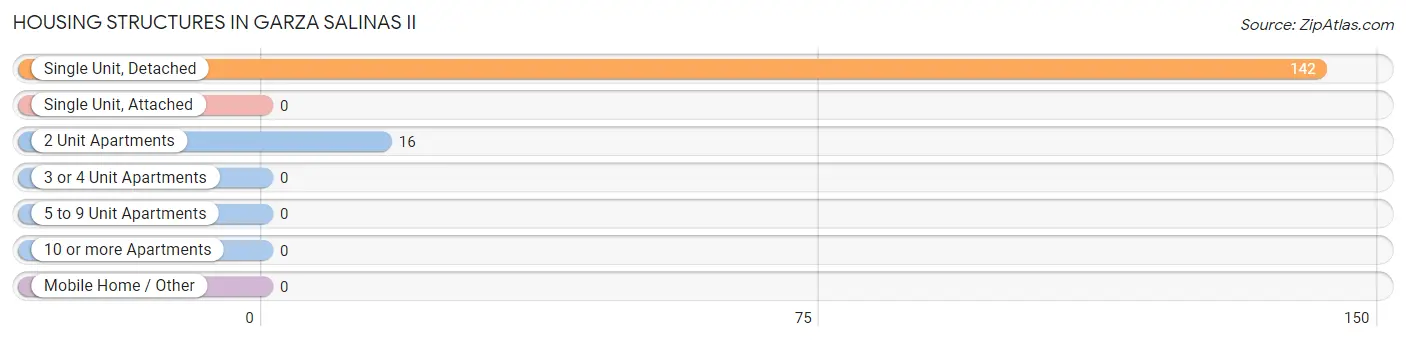
| Structure Type | # Housing Units | % Housing Units |
| Single Unit, Detached | 142 | 89.9% |
| Single Unit, Attached | 0 | 0.0% |
| 2 Unit Apartments | 16 | 10.1% |
| 3 or 4 Unit Apartments | 0 | 0.0% |
| 5 to 9 Unit Apartments | 0 | 0.0% |
| 10 or more Apartments | 0 | 0.0% |
| Mobile Home / Other | 0 | 0.0% |
| Total | 158 | 100.0% |
Housing Structures by Occupancy in Garza Salinas II
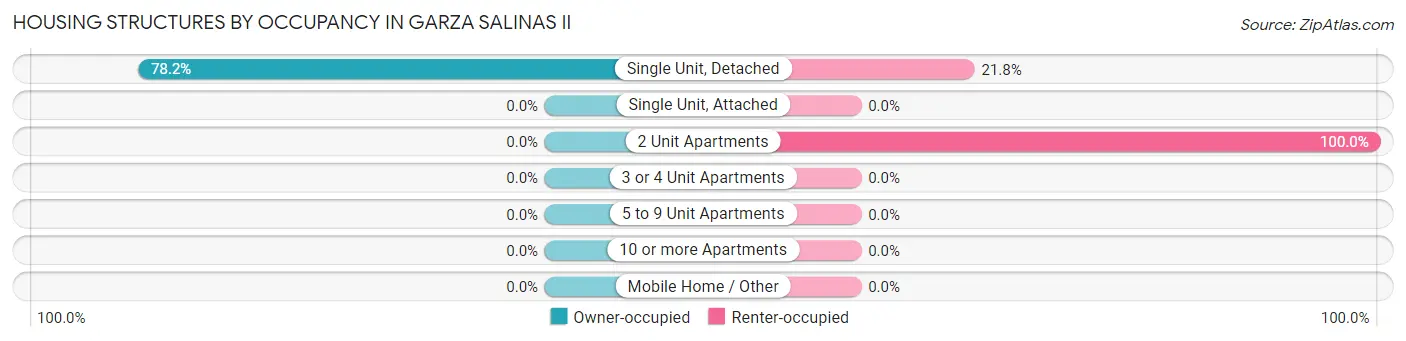
| Structure Type | Owner-occupied | Renter-occupied |
| Single Unit, Detached | 111 (78.2%) | 31 (21.8%) |
| Single Unit, Attached | 0 (0.0%) | 0 (0.0%) |
| 2 Unit Apartments | 0 (0.0%) | 16 (100.0%) |
| 3 or 4 Unit Apartments | 0 (0.0%) | 0 (0.0%) |
| 5 to 9 Unit Apartments | 0 (0.0%) | 0 (0.0%) |
| 10 or more Apartments | 0 (0.0%) | 0 (0.0%) |
| Mobile Home / Other | 0 (0.0%) | 0 (0.0%) |
| Total | 111 (70.3%) | 47 (29.7%) |
Housing Structures by Number of Rooms in Garza Salinas II
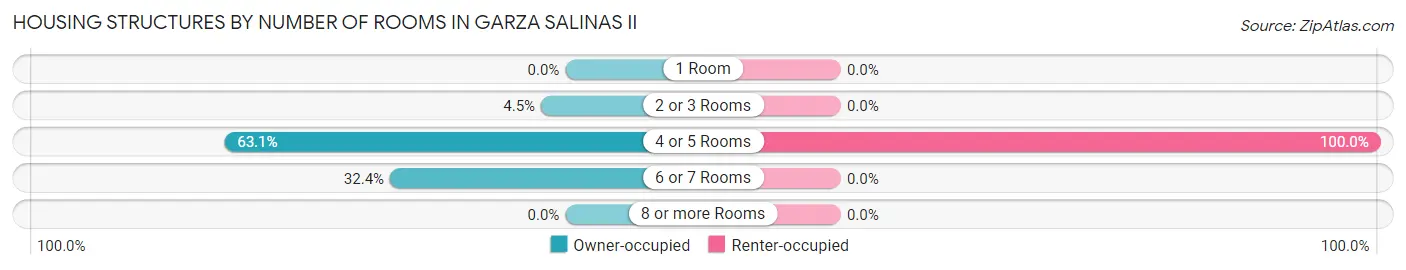
| Number of Rooms | Owner-occupied | Renter-occupied |
| 1 Room | 0 (0.0%) | 0 (0.0%) |
| 2 or 3 Rooms | 5 (4.5%) | 0 (0.0%) |
| 4 or 5 Rooms | 70 (63.1%) | 47 (100.0%) |
| 6 or 7 Rooms | 36 (32.4%) | 0 (0.0%) |
| 8 or more Rooms | 0 (0.0%) | 0 (0.0%) |
| Total | 111 (100.0%) | 47 (100.0%) |
Housing Structure by Heating Type in Garza Salinas II
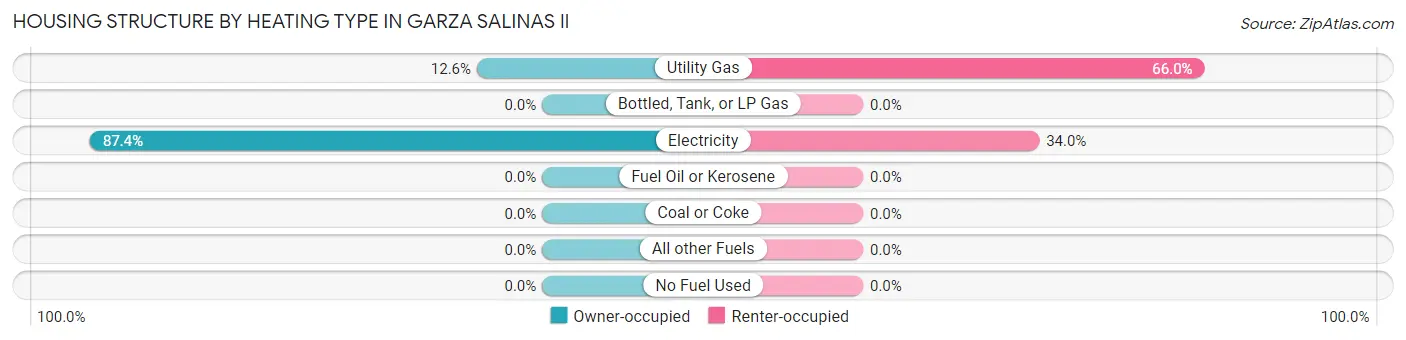
| Heating Type | Owner-occupied | Renter-occupied |
| Utility Gas | 14 (12.6%) | 31 (66.0%) |
| Bottled, Tank, or LP Gas | 0 (0.0%) | 0 (0.0%) |
| Electricity | 97 (87.4%) | 16 (34.0%) |
| Fuel Oil or Kerosene | 0 (0.0%) | 0 (0.0%) |
| Coal or Coke | 0 (0.0%) | 0 (0.0%) |
| All other Fuels | 0 (0.0%) | 0 (0.0%) |
| No Fuel Used | 0 (0.0%) | 0 (0.0%) |
| Total | 111 (100.0%) | 47 (100.0%) |
Household Vehicle Usage in Garza Salinas II
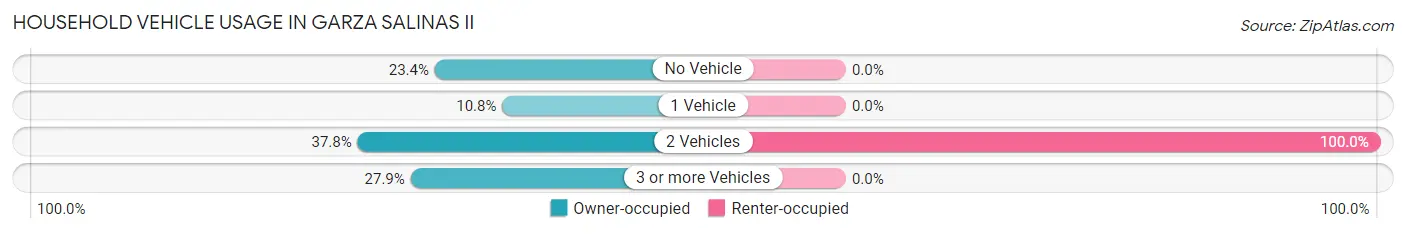
| Vehicles per Household | Owner-occupied | Renter-occupied |
| No Vehicle | 26 (23.4%) | 0 (0.0%) |
| 1 Vehicle | 12 (10.8%) | 0 (0.0%) |
| 2 Vehicles | 42 (37.8%) | 47 (100.0%) |
| 3 or more Vehicles | 31 (27.9%) | 0 (0.0%) |
| Total | 111 (100.0%) | 47 (100.0%) |
Real Estate & Mortgages in Garza Salinas II
Real Estate and Mortgage Overview in Garza Salinas II
| Characteristic | Without Mortgage | With Mortgage |
| Housing Units | 111 | 0 |
| Median Property Value | $53,400 | $0 |
| Median Household Income | - | - |
| Monthly Housing Costs | $416 | $0 |
| Real Estate Taxes | $567 | $0 |
Property Value by Mortgage Status in Garza Salinas II
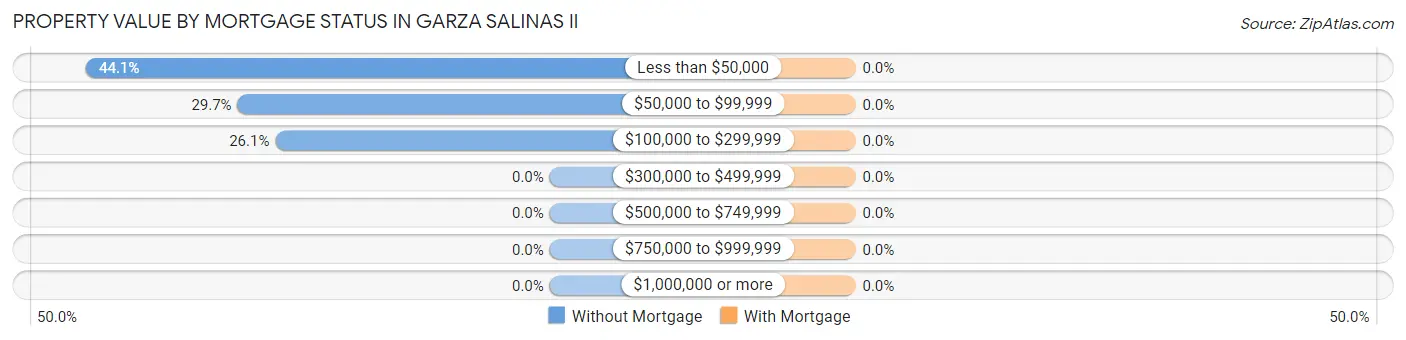
| Property Value | Without Mortgage | With Mortgage |
| Less than $50,000 | 49 (44.1%) | 0 (0.0%) |
| $50,000 to $99,999 | 33 (29.7%) | 0 (0.0%) |
| $100,000 to $299,999 | 29 (26.1%) | 0 (0.0%) |
| $300,000 to $499,999 | 0 (0.0%) | 0 (0.0%) |
| $500,000 to $749,999 | 0 (0.0%) | 0 (0.0%) |
| $750,000 to $999,999 | 0 (0.0%) | 0 (0.0%) |
| $1,000,000 or more | 0 (0.0%) | 0 (0.0%) |
| Total | 111 (100.0%) | 0 (0.0%) |
Household Income by Mortgage Status in Garza Salinas II
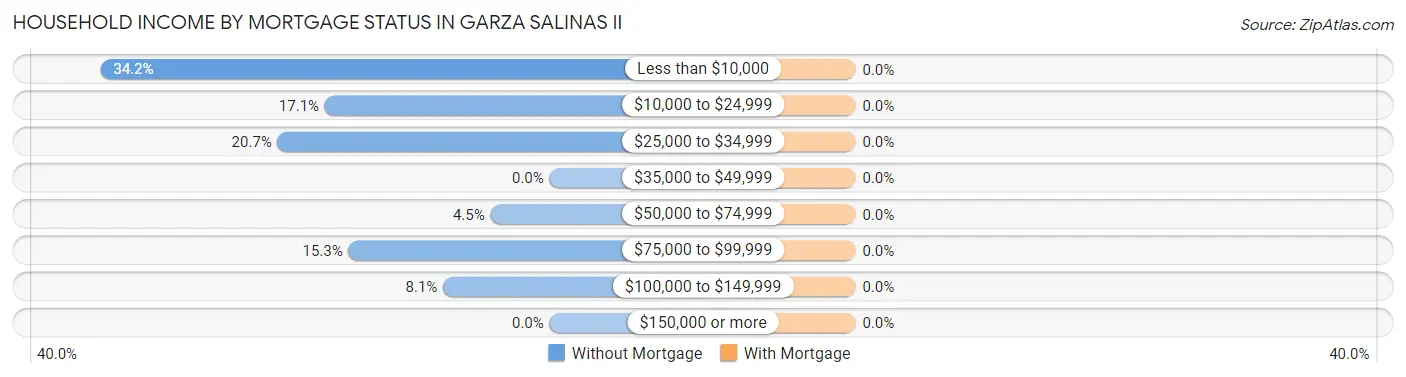
| Household Income | Without Mortgage | With Mortgage |
| Less than $10,000 | 38 (34.2%) | 0 (0.0%) |
| $10,000 to $24,999 | 19 (17.1%) | 0 (0.0%) |
| $25,000 to $34,999 | 23 (20.7%) | 0 (0.0%) |
| $35,000 to $49,999 | 0 (0.0%) | 0 (0.0%) |
| $50,000 to $74,999 | 5 (4.5%) | 0 (0.0%) |
| $75,000 to $99,999 | 17 (15.3%) | 0 (0.0%) |
| $100,000 to $149,999 | 9 (8.1%) | 0 (0.0%) |
| $150,000 or more | 0 (0.0%) | 0 (0.0%) |
| Total | 111 (100.0%) | 0 (0.0%) |
Property Value to Household Income Ratio in Garza Salinas II
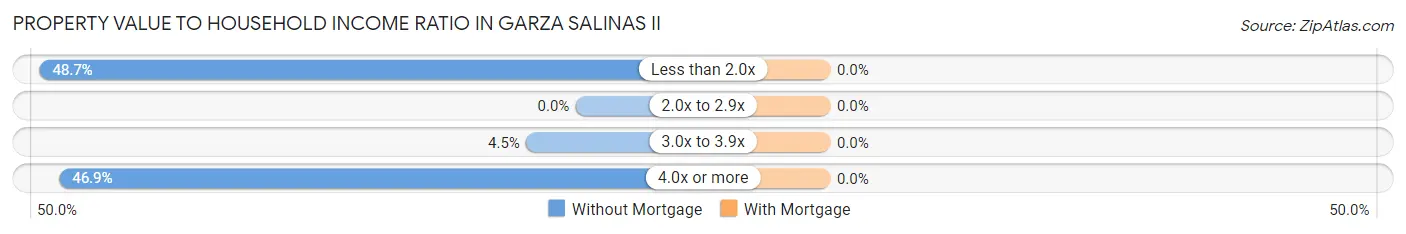
| Value-to-Income Ratio | Without Mortgage | With Mortgage |
| Less than 2.0x | 54 (48.6%) | 0 (0.0%) |
| 2.0x to 2.9x | 0 (0.0%) | 0 (0.0%) |
| 3.0x to 3.9x | 5 (4.5%) | 0 (0.0%) |
| 4.0x or more | 52 (46.9%) | 0 (0.0%) |
| Total | 111 (100.0%) | 0 (0.0%) |
Real Estate Taxes by Mortgage Status in Garza Salinas II
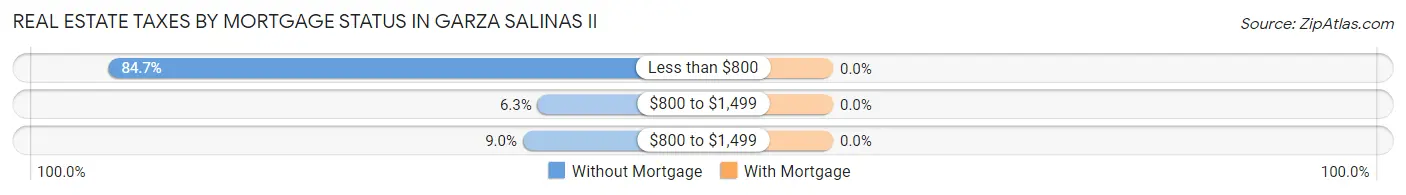
| Property Taxes | Without Mortgage | With Mortgage |
| Less than $800 | 94 (84.7%) | 0 (0.0%) |
| $800 to $1,499 | 7 (6.3%) | 0 (0.0%) |
| $800 to $1,499 | 10 (9.0%) | 0 (0.0%) |
| Total | 111 (100.0%) | 0 (0.0%) |
Health & Disability in Garza Salinas II
Health Insurance Coverage by Age in Garza Salinas II
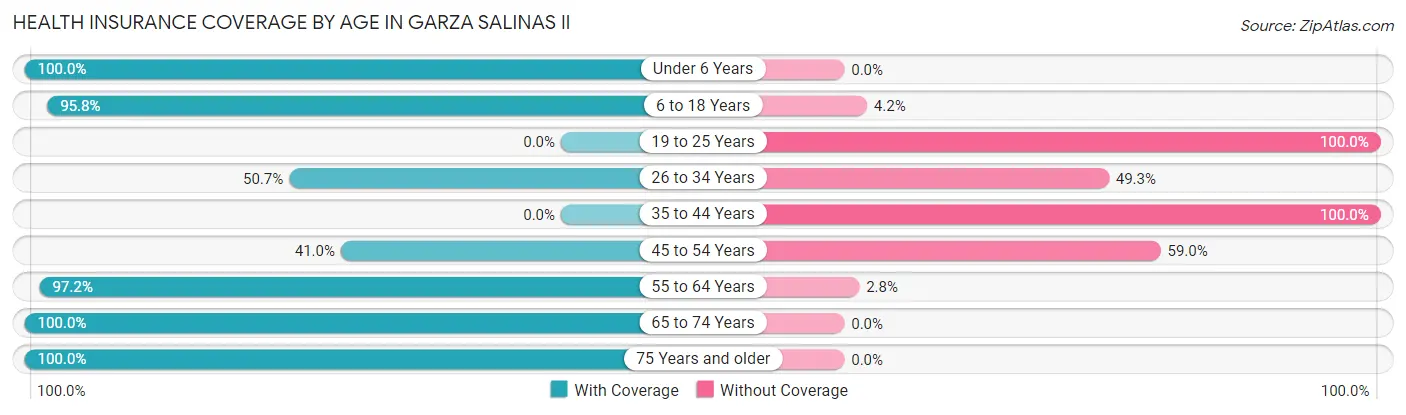
| Age Bracket | With Coverage | Without Coverage |
| Under 6 Years | 70 (100.0%) | 0 (0.0%) |
| 6 to 18 Years | 159 (95.8%) | 7 (4.2%) |
| 19 to 25 Years | 0 (0.0%) | 27 (100.0%) |
| 26 to 34 Years | 37 (50.7%) | 36 (49.3%) |
| 35 to 44 Years | 0 (0.0%) | 30 (100.0%) |
| 45 to 54 Years | 16 (41.0%) | 23 (59.0%) |
| 55 to 64 Years | 70 (97.2%) | 2 (2.8%) |
| 65 to 74 Years | 10 (100.0%) | 0 (0.0%) |
| 75 Years and older | 26 (100.0%) | 0 (0.0%) |
| Total | 388 (75.6%) | 125 (24.4%) |
Health Insurance Coverage by Citizenship Status in Garza Salinas II

| Citizenship Status | With Coverage | Without Coverage |
| Native Born | 70 (100.0%) | 0 (0.0%) |
| Foreign Born, Citizen | 159 (95.8%) | 7 (4.2%) |
| Foreign Born, not a Citizen | 0 (0.0%) | 27 (100.0%) |
Health Insurance Coverage by Household Income in Garza Salinas II
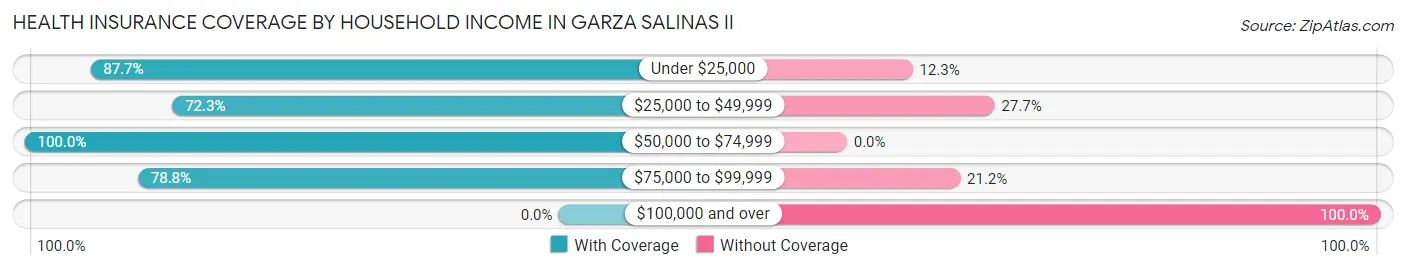
| Household Income | With Coverage | Without Coverage |
| Under $25,000 | 114 (87.7%) | 16 (12.3%) |
| $25,000 to $49,999 | 149 (72.3%) | 57 (27.7%) |
| $50,000 to $74,999 | 10 (100.0%) | 0 (0.0%) |
| $75,000 to $99,999 | 115 (78.8%) | 31 (21.2%) |
| $100,000 and over | 0 (0.0%) | 21 (100.0%) |
Public vs Private Health Insurance Coverage by Age in Garza Salinas II
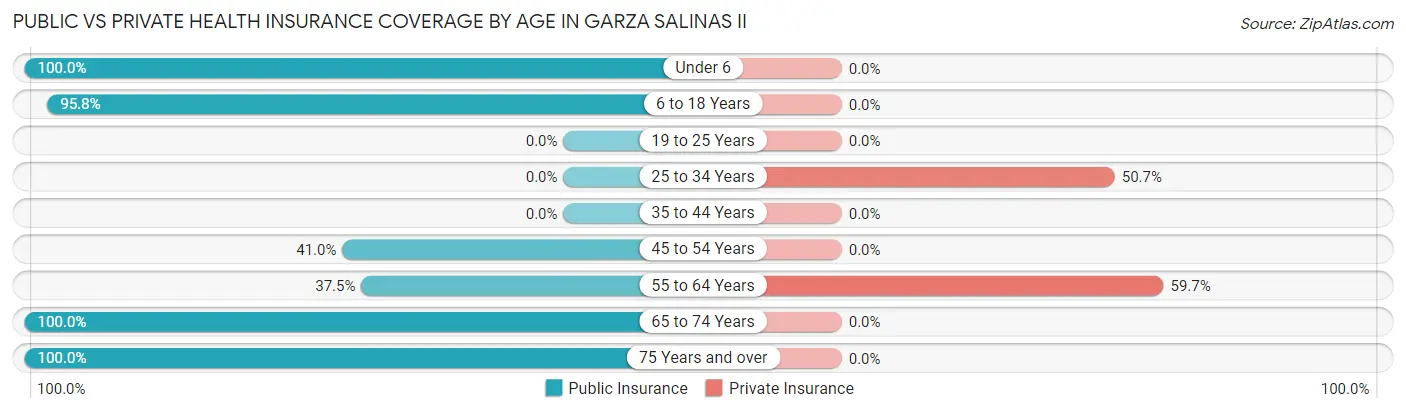
| Age Bracket | Public Insurance | Private Insurance |
| Under 6 | 70 (100.0%) | 0 (0.0%) |
| 6 to 18 Years | 159 (95.8%) | 0 (0.0%) |
| 19 to 25 Years | 0 (0.0%) | 0 (0.0%) |
| 25 to 34 Years | 0 (0.0%) | 37 (50.7%) |
| 35 to 44 Years | 0 (0.0%) | 0 (0.0%) |
| 45 to 54 Years | 16 (41.0%) | 0 (0.0%) |
| 55 to 64 Years | 27 (37.5%) | 43 (59.7%) |
| 65 to 74 Years | 10 (100.0%) | 0 (0.0%) |
| 75 Years and over | 26 (100.0%) | 0 (0.0%) |
| Total | 308 (60.0%) | 80 (15.6%) |
Disability Status by Sex by Age in Garza Salinas II
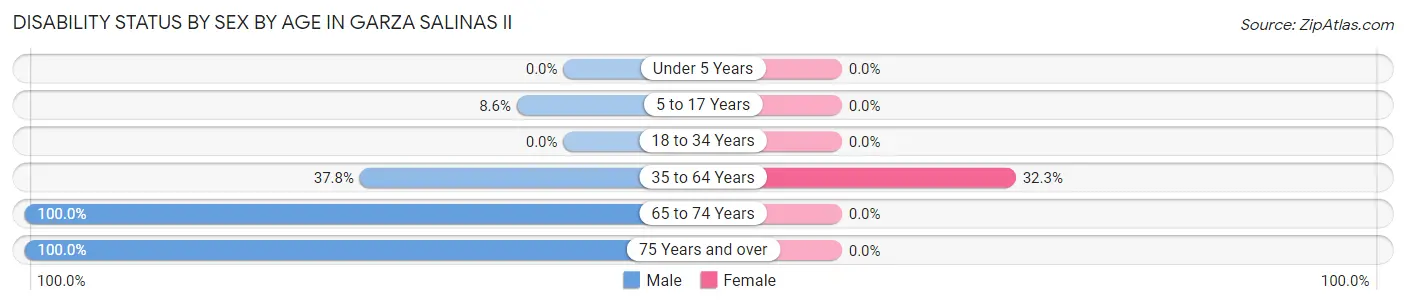
| Age Bracket | Male | Female |
| Under 5 Years | 0 (0.0%) | 0 (0.0%) |
| 5 to 17 Years | 7 (8.6%) | 0 (0.0%) |
| 18 to 34 Years | 0 (0.0%) | 0 (0.0%) |
| 35 to 64 Years | 17 (37.8%) | 31 (32.3%) |
| 65 to 74 Years | 10 (100.0%) | 0 (0.0%) |
| 75 Years and over | 26 (100.0%) | 0 (0.0%) |
Disability Class by Sex by Age in Garza Salinas II
Disability Class: Hearing Difficulty
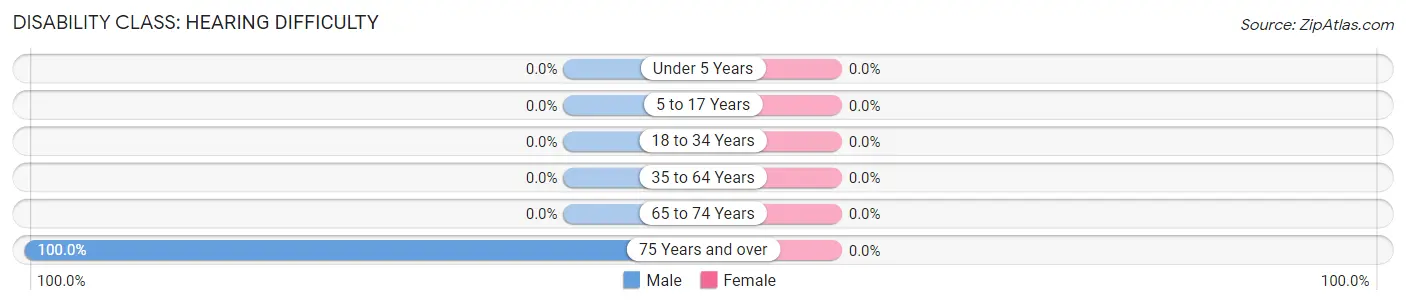
| Age Bracket | Male | Female |
| Under 5 Years | 0 (0.0%) | 0 (0.0%) |
| 5 to 17 Years | 0 (0.0%) | 0 (0.0%) |
| 18 to 34 Years | 0 (0.0%) | 0 (0.0%) |
| 35 to 64 Years | 0 (0.0%) | 0 (0.0%) |
| 65 to 74 Years | 0 (0.0%) | 0 (0.0%) |
| 75 Years and over | 26 (100.0%) | 0 (0.0%) |
Disability Class: Vision Difficulty
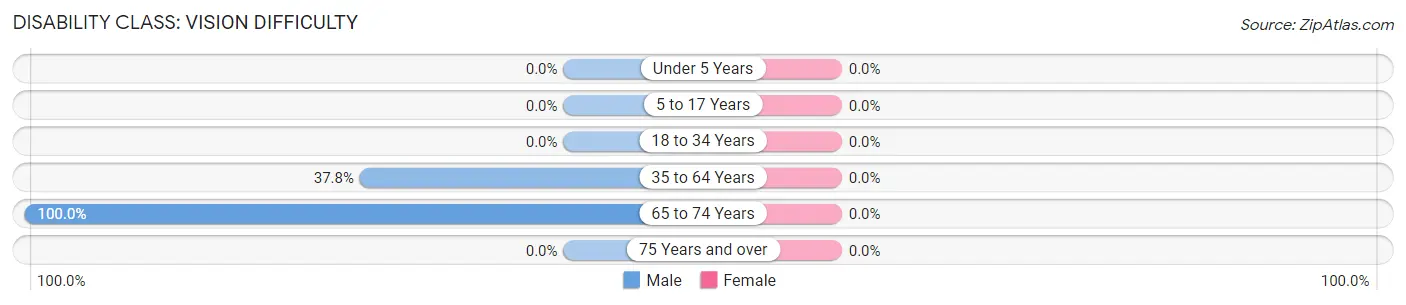
| Age Bracket | Male | Female |
| Under 5 Years | 0 (0.0%) | 0 (0.0%) |
| 5 to 17 Years | 0 (0.0%) | 0 (0.0%) |
| 18 to 34 Years | 0 (0.0%) | 0 (0.0%) |
| 35 to 64 Years | 17 (37.8%) | 0 (0.0%) |
| 65 to 74 Years | 10 (100.0%) | 0 (0.0%) |
| 75 Years and over | 0 (0.0%) | 0 (0.0%) |
Disability Class: Cognitive Difficulty
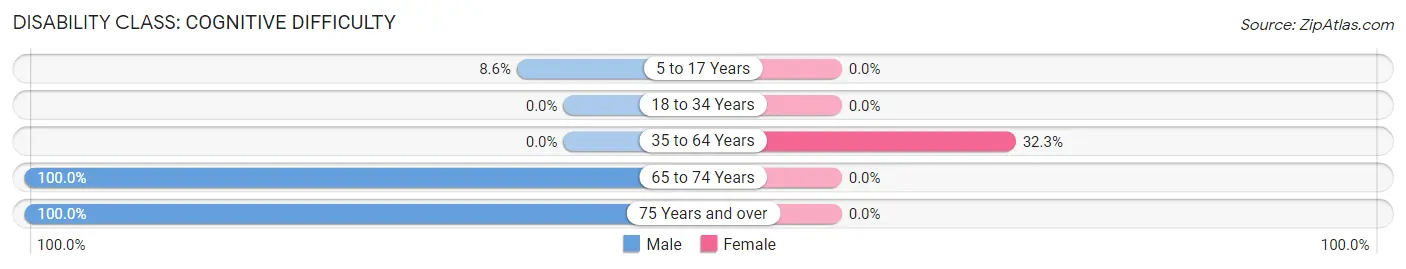
| Age Bracket | Male | Female |
| 5 to 17 Years | 7 (8.6%) | 0 (0.0%) |
| 18 to 34 Years | 0 (0.0%) | 0 (0.0%) |
| 35 to 64 Years | 0 (0.0%) | 31 (32.3%) |
| 65 to 74 Years | 10 (100.0%) | 0 (0.0%) |
| 75 Years and over | 26 (100.0%) | 0 (0.0%) |
Disability Class: Ambulatory Difficulty
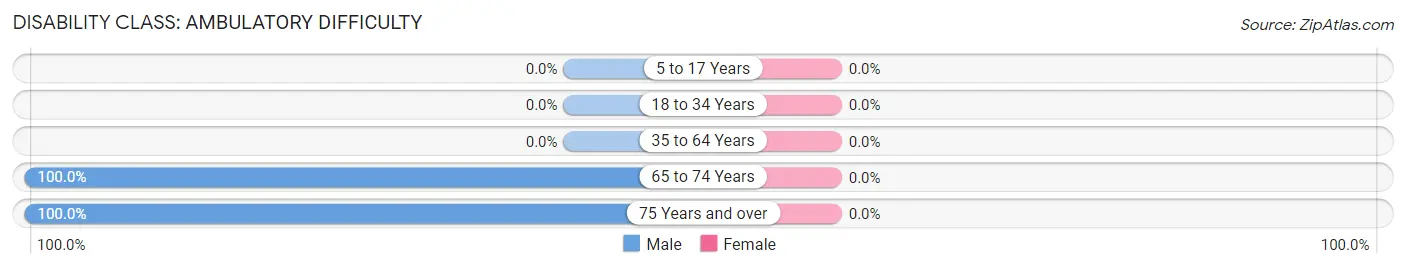
| Age Bracket | Male | Female |
| 5 to 17 Years | 0 (0.0%) | 0 (0.0%) |
| 18 to 34 Years | 0 (0.0%) | 0 (0.0%) |
| 35 to 64 Years | 0 (0.0%) | 0 (0.0%) |
| 65 to 74 Years | 10 (100.0%) | 0 (0.0%) |
| 75 Years and over | 26 (100.0%) | 0 (0.0%) |
Disability Class: Self-Care Difficulty
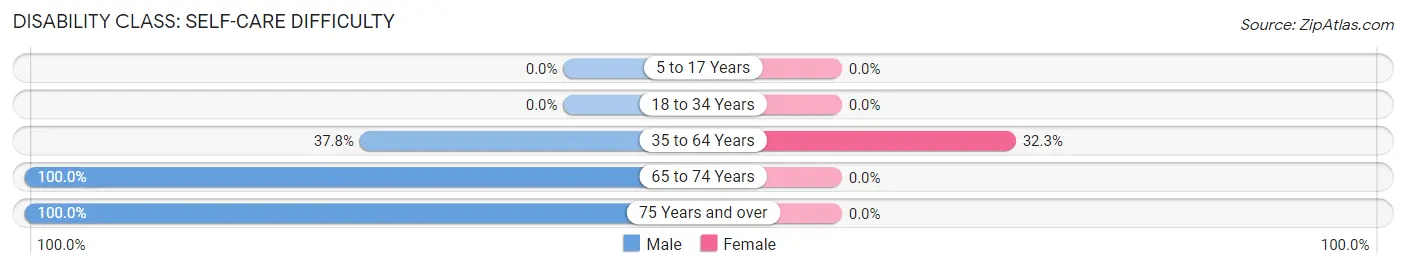
| Age Bracket | Male | Female |
| 5 to 17 Years | 0 (0.0%) | 0 (0.0%) |
| 18 to 34 Years | 0 (0.0%) | 0 (0.0%) |
| 35 to 64 Years | 17 (37.8%) | 31 (32.3%) |
| 65 to 74 Years | 10 (100.0%) | 0 (0.0%) |
| 75 Years and over | 26 (100.0%) | 0 (0.0%) |
Technology Access in Garza Salinas II
Computing Device Access in Garza Salinas II
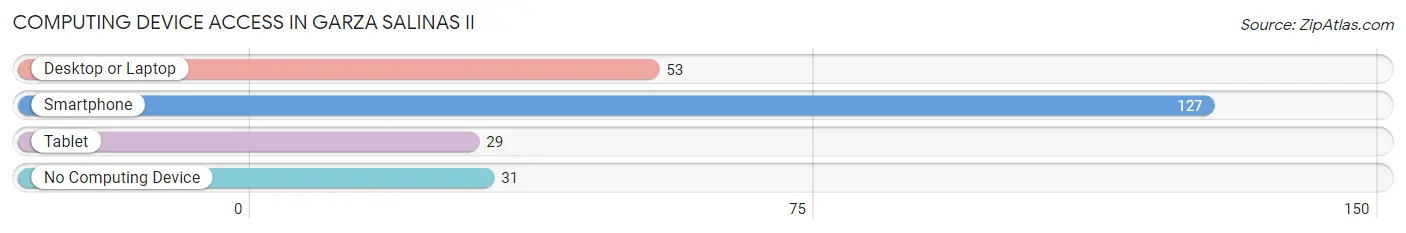
| Device Type | # Households | % Households |
| Desktop or Laptop | 53 | 33.5% |
| Smartphone | 127 | 80.4% |
| Tablet | 29 | 18.3% |
| No Computing Device | 31 | 19.6% |
| Total | 158 | 100.0% |
Internet Access in Garza Salinas II
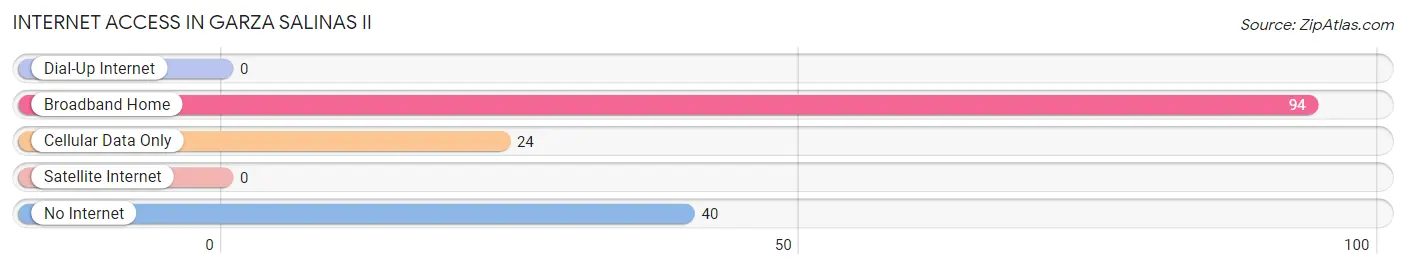
| Internet Type | # Households | % Households |
| Dial-Up Internet | 0 | 0.0% |
| Broadband Home | 94 | 59.5% |
| Cellular Data Only | 24 | 15.2% |
| Satellite Internet | 0 | 0.0% |
| No Internet | 40 | 25.3% |
| Total | 158 | 100.0% |
Garza Salinas II Summary
Garza Salinas II is a small town located in the state of Texas, in the United States. It is situated in the Rio Grande Valley, in the southernmost part of the state. The town is located in Hidalgo County, and is part of the McAllen-Edinburg-Mission Metropolitan Statistical Area. As of the 2010 census, the population of Garza Salinas II was 1,845.
Geography
Garza Salinas II is located at 26°14'25"N 98°14'17"W (26.240278, -98.238056). It is situated in the Rio Grande Valley, in the southernmost part of Texas. The town is located in Hidalgo County, and is part of the McAllen-Edinburg-Mission Metropolitan Statistical Area. The town is located near the Rio Grande River, and is bordered by the cities of McAllen and Edinburg.
The town has a total area of 0.7 square miles (1.8 km2), all of which is land. The terrain is mostly flat, with some rolling hills. The climate is subtropical, with hot summers and mild winters.
History
Garza Salinas II was founded in the late 19th century by a group of Mexican immigrants. The town was named after the Garza Salinas family, who were among the first settlers. The town was originally a small farming community, and the main crops grown were cotton, corn, and sorghum.
In the early 20th century, the town began to grow and develop. The population increased, and new businesses were established. The town was incorporated in 1925, and the first mayor was elected in 1926.
In the 1950s, the town began to experience rapid growth. The population increased, and new businesses were established. The town was connected to the rest of the state by a new highway, and the economy began to diversify.
Economy
The economy of Garza Salinas II is largely based on agriculture and tourism. The town is home to several large farms, which produce a variety of crops, including cotton, corn, sorghum, and vegetables. The town is also home to several tourist attractions, including the Garza Salinas II Museum, the Garza Salinas II Nature Center, and the Garza Salinas II State Park.
The town is also home to several small businesses, including restaurants, shops, and other services. The town is served by the McAllen-Edinburg-Mission International Airport, which provides access to the rest of the state and the country.
Demographics
As of the 2010 census, the population of Garza Salinas II was 1,845. The racial makeup of the town was 94.3% Hispanic or Latino, 4.2% White, 0.2% African American, 0.2% Native American, 0.2% Asian, and 0.9% from other races.
The median household income in the town was $25,938, and the median family income was $30,938. The per capita income was $12,938. About 24.3% of the population was below the poverty line.
Conclusion
Garza Salinas II is a small town located in the Rio Grande Valley of Texas. The town has a long history, and was founded by Mexican immigrants in the late 19th century. The economy of the town is largely based on agriculture and tourism, and the town is home to several tourist attractions. The population of the town is largely Hispanic or Latino, and the median household income is below the poverty line.
Common Questions
What is Per Capita Income in Garza Salinas II?
Per Capita income in Garza Salinas II is $9,721.
What is Income or Wage Gap in Garza Salinas II?
Income or Wage Gap in Garza Salinas II is 61.4%.
Women in Garza Salinas II earn 38.6 cents for every dollar earned by a man.
What is Inequality or Gini Index in Garza Salinas II?
Inequality or Gini Index in Garza Salinas II is 0.59.
What is the Total Population of Garza Salinas II?
Total Population of Garza Salinas II is 513.
What is the Total Male Population of Garza Salinas II?
Total Male Population of Garza Salinas II is 253.
What is the Total Female Population of Garza Salinas II?
Total Female Population of Garza Salinas II is 260.
What is the Ratio of Males per 100 Females in Garza Salinas II?
There are 97.31 Males per 100 Females in Garza Salinas II.
What is the Ratio of Females per 100 Males in Garza Salinas II?
There are 102.77 Females per 100 Males in Garza Salinas II.
What is the Median Population Age in Garza Salinas II?
Median Population Age in Garza Salinas II is 21.8 Years.
What is the Average Family Size in Garza Salinas II
Average Family Size in Garza Salinas II is 4.6 People.
What is the Average Household Size in Garza Salinas II
Average Household Size in Garza Salinas II is 3.2 People.
How Large is the Labor Force in Garza Salinas II?
There are 140 People in the Labor Forcein in Garza Salinas II.
What is the Percentage of People in the Labor Force in Garza Salinas II?
44.7% of People are in the Labor Force in Garza Salinas II.