Hamilton, TX Map & Demographics
Hamilton Map
Hamilton Overview
$25,495
PER CAPITA INCOME
$83,125
AVG FAMILY INCOME
$46,538
AVG HOUSEHOLD INCOME
16.6%
WAGE / INCOME GAP [ % ]
83.4¢/ $1
WAGE / INCOME GAP [ $ ]
0.40
INEQUALITY / GINI INDEX
2,898
TOTAL POPULATION
1,425
MALE POPULATION
1,473
FEMALE POPULATION
96.74
MALES / 100 FEMALES
103.37
FEMALES / 100 MALES
39.4
MEDIAN AGE
3.6
AVG FAMILY SIZE
2.6
AVG HOUSEHOLD SIZE
1,385
LABOR FORCE [ PEOPLE ]
58.5%
PERCENT IN LABOR FORCE
2.2%
UNEMPLOYMENT RATE
Hamilton Zip Codes
Hamilton Area Codes
Income in Hamilton
Income Overview in Hamilton
Per Capita Income in Hamilton is $25,495, while median incomes of families and households are $83,125 and $46,538 respectively.
| Characteristic | Number | Measure |
| Per Capita Income | 2,898 | $25,495 |
| Median Family Income | 586 | $83,125 |
| Mean Family Income | 586 | $77,946 |
| Median Household Income | 1,050 | $46,538 |
| Mean Household Income | 1,050 | $61,996 |
| Income Deficit | 586 | $0 |
| Wage / Income Gap (%) | 2,898 | 16.62% |
| Wage / Income Gap ($) | 2,898 | 83.38¢ per $1 |
| Gini / Inequality Index | 2,898 | 0.40 |
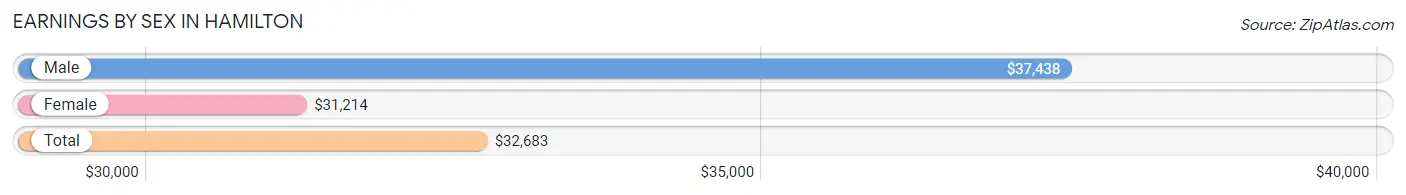
Earnings by Sex in Hamilton
Average Earnings in Hamilton are $32,683, $37,438 for men and $31,214 for women, a difference of 16.6%.
| Sex | Number | Average Earnings |
| Male | 670 (45.9%) | $37,438 |
| Female | 790 (54.1%) | $31,214 |
| Total | 1,460 (100.0%) | $32,683 |
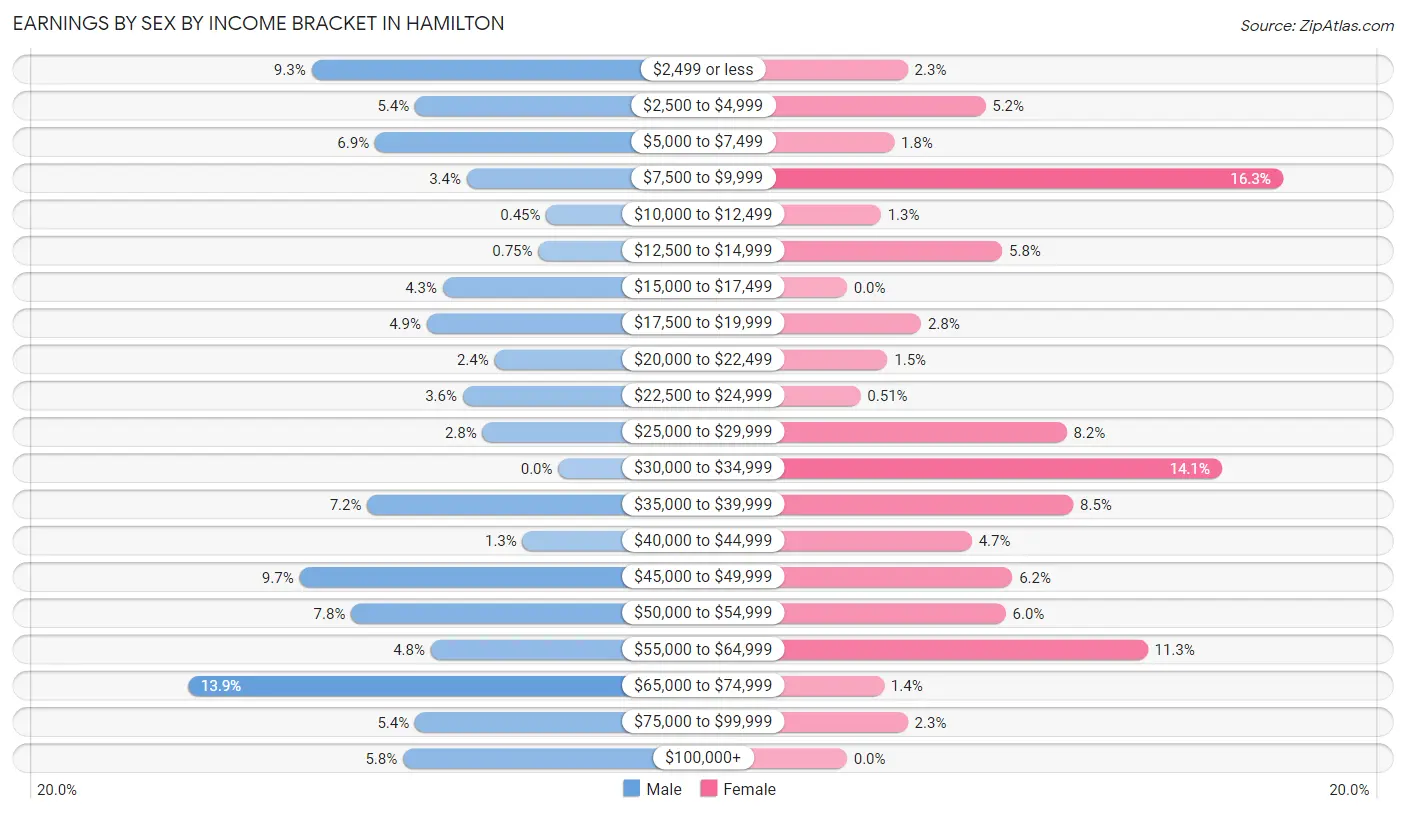
Earnings by Sex by Income Bracket in Hamilton
The most common earnings brackets in Hamilton are $65,000 to $74,999 for men (93 | 13.9%) and $7,500 to $9,999 for women (129 | 16.3%).
| Income | Male | Female |
| $2,499 or less | 62 (9.2%) | 18 (2.3%) |
| $2,500 to $4,999 | 36 (5.4%) | 41 (5.2%) |
| $5,000 to $7,499 | 46 (6.9%) | 14 (1.8%) |
| $7,500 to $9,999 | 23 (3.4%) | 129 (16.3%) |
| $10,000 to $12,499 | 3 (0.4%) | 10 (1.3%) |
| $12,500 to $14,999 | 5 (0.7%) | 46 (5.8%) |
| $15,000 to $17,499 | 29 (4.3%) | 0 (0.0%) |
| $17,500 to $19,999 | 33 (4.9%) | 22 (2.8%) |
| $20,000 to $22,499 | 16 (2.4%) | 12 (1.5%) |
| $22,500 to $24,999 | 24 (3.6%) | 4 (0.5%) |
| $25,000 to $29,999 | 19 (2.8%) | 65 (8.2%) |
| $30,000 to $34,999 | 0 (0.0%) | 111 (14.1%) |
| $35,000 to $39,999 | 48 (7.2%) | 67 (8.5%) |
| $40,000 to $44,999 | 9 (1.3%) | 37 (4.7%) |
| $45,000 to $49,999 | 65 (9.7%) | 49 (6.2%) |
| $50,000 to $54,999 | 52 (7.8%) | 47 (5.9%) |
| $55,000 to $64,999 | 32 (4.8%) | 89 (11.3%) |
| $65,000 to $74,999 | 93 (13.9%) | 11 (1.4%) |
| $75,000 to $99,999 | 36 (5.4%) | 18 (2.3%) |
| $100,000+ | 39 (5.8%) | 0 (0.0%) |
| Total | 670 (100.0%) | 790 (100.0%) |
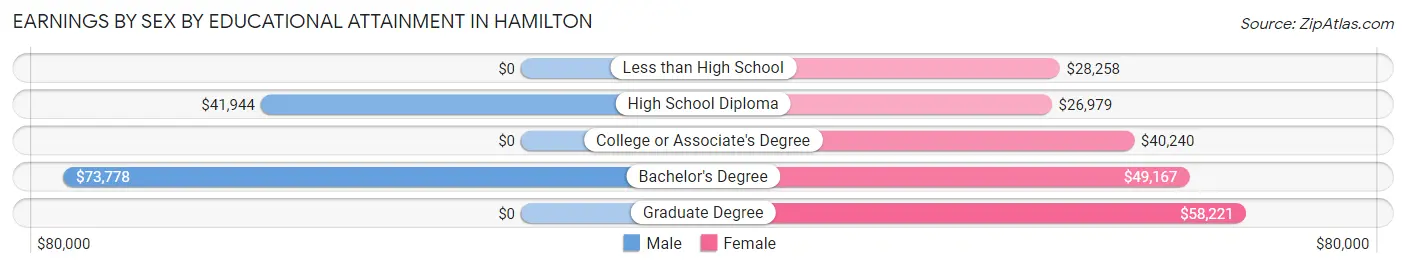
Earnings by Sex by Educational Attainment in Hamilton
Average earnings in Hamilton are $53,101 for men and $33,942 for women, a difference of 36.1%. Men with an educational attainment of bachelor's degree enjoy the highest average annual earnings of $73,778, while those with high school diploma education earn the least with $41,944. Women with an educational attainment of graduate degree earn the most with the average annual earnings of $58,221, while those with high school diploma education have the smallest earnings of $26,979.
| Educational Attainment | Male Income | Female Income |
| Less than High School | - | - |
| High School Diploma | $41,944 | $26,979 |
| College or Associate's Degree | - | - |
| Bachelor's Degree | $73,778 | $49,167 |
| Graduate Degree | - | - |
| Total | $53,101 | $33,942 |
Family Income in Hamilton
Family Income Brackets in Hamilton
According to the Hamilton family income data, there are 184 families falling into the $100,000 to $149,999 income range, which is the most common income bracket and makes up 31.4% of all families.
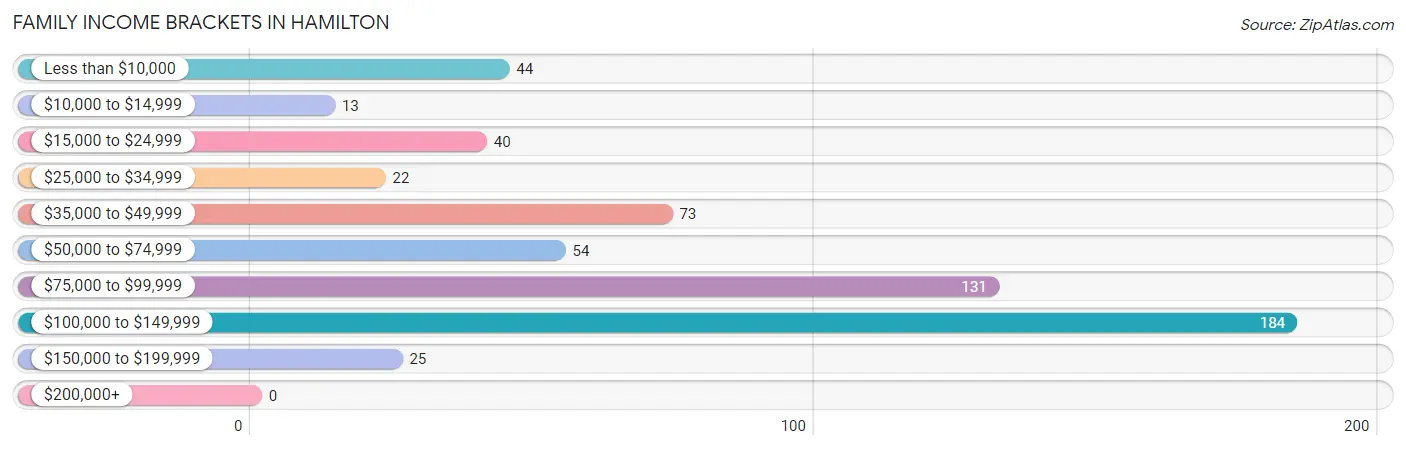
| Income Bracket | # Families | % Families |
| Less than $10,000 | 44 | 7.5% |
| $10,000 to $14,999 | 13 | 2.2% |
| $15,000 to $24,999 | 40 | 6.8% |
| $25,000 to $34,999 | 22 | 3.8% |
| $35,000 to $49,999 | 73 | 12.5% |
| $50,000 to $74,999 | 54 | 9.2% |
| $75,000 to $99,999 | 131 | 22.4% |
| $100,000 to $149,999 | 184 | 31.4% |
| $150,000 to $199,999 | 25 | 4.3% |
| $200,000+ | 0 | 0.0% |
Family Income by Famaliy Size in Hamilton
4-person families (47 | 8.0%) account for the highest median family income in Hamilton with $130,313 per family, while 3-person families (114 | 19.5%) have the highest median income of $34,848 per family member.
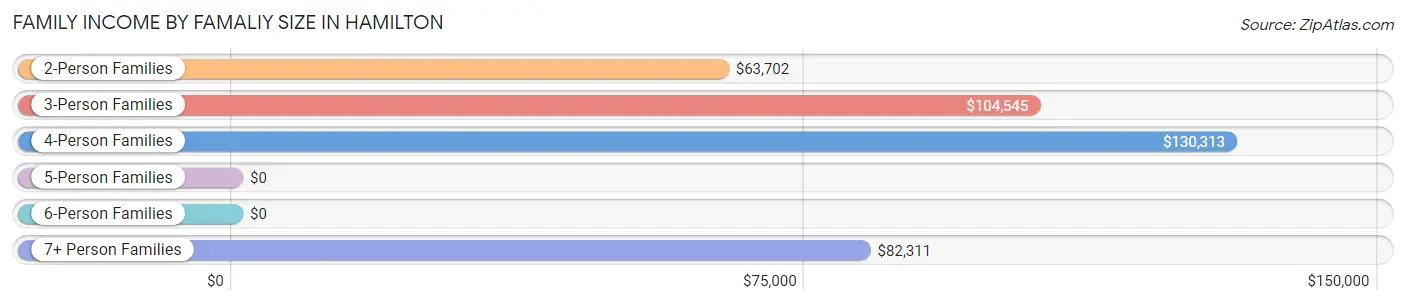
| Income Bracket | # Families | Median Income |
| 2-Person Families | 335 (57.2%) | $63,702 |
| 3-Person Families | 114 (19.5%) | $104,545 |
| 4-Person Families | 47 (8.0%) | $130,313 |
| 5-Person Families | 25 (4.3%) | $0 |
| 6-Person Families | 4 (0.7%) | $0 |
| 7+ Person Families | 61 (10.4%) | $82,311 |
| Total | 586 (100.0%) | $83,125 |
Family Income by Number of Earners in Hamilton
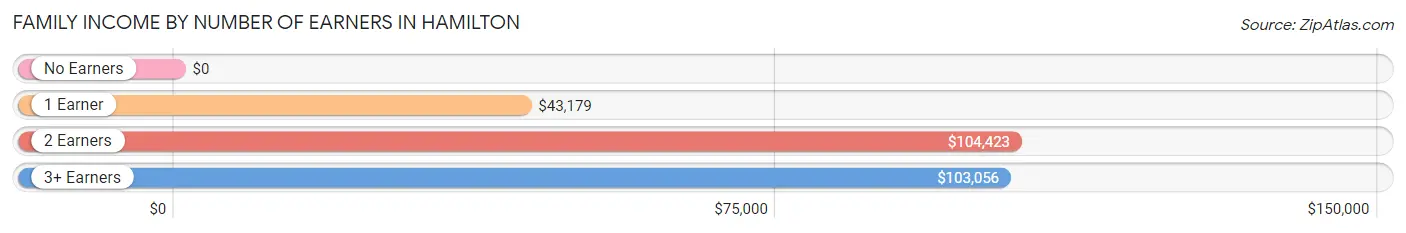
| Number of Earners | # Families | Median Income |
| No Earners | 83 (14.2%) | $0 |
| 1 Earner | 207 (35.3%) | $43,179 |
| 2 Earners | 250 (42.7%) | $104,423 |
| 3+ Earners | 46 (7.9%) | $103,056 |
| Total | 586 (100.0%) | $83,125 |
Household Income in Hamilton
Household Income Brackets in Hamilton
With 198 households falling in the category, the $100,000 to $149,999 income range is the most frequent in Hamilton, accounting for 18.9% of all households.
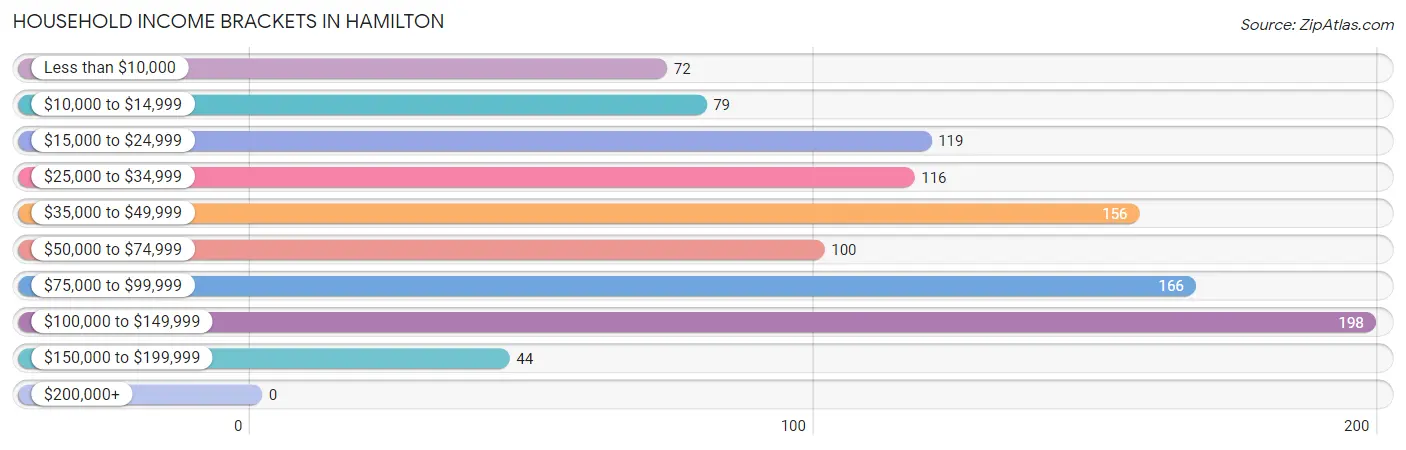
| Income Bracket | # Households | % Households |
| Less than $10,000 | 72 | 6.9% |
| $10,000 to $14,999 | 79 | 7.5% |
| $15,000 to $24,999 | 119 | 11.3% |
| $25,000 to $34,999 | 116 | 11.0% |
| $35,000 to $49,999 | 156 | 14.9% |
| $50,000 to $74,999 | 100 | 9.5% |
| $75,000 to $99,999 | 166 | 15.8% |
| $100,000 to $149,999 | 198 | 18.9% |
| $150,000 to $199,999 | 44 | 4.2% |
| $200,000+ | 0 | 0.0% |
Household Income by Householder Age in Hamilton
The median household income in Hamilton is $46,538, with the highest median household income of $81,326 found in the 25 to 44 years age bracket for the primary householder. A total of 311 households (29.6%) fall into this category. Meanwhile, the 65+ years age bracket for the primary householder has the lowest median household income of $32,448, with 373 households (35.5%) in this group.
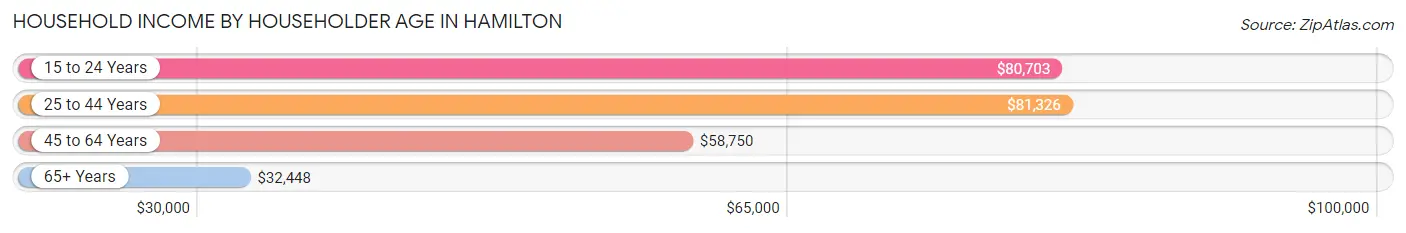
| Income Bracket | # Households | Median Income |
| 15 to 24 Years | 46 (4.4%) | $80,703 |
| 25 to 44 Years | 311 (29.6%) | $81,326 |
| 45 to 64 Years | 320 (30.5%) | $58,750 |
| 65+ Years | 373 (35.5%) | $32,448 |
| Total | 1,050 (100.0%) | $46,538 |
Poverty in Hamilton
Income Below Poverty by Sex and Age in Hamilton
With 15.6% poverty level for males and 14.5% for females among the residents of Hamilton, 55 to 64 year old males and 25 to 34 year old females are the most vulnerable to poverty, with 42 males (33.1%) and 46 females (30.5%) in their respective age groups living below the poverty level.
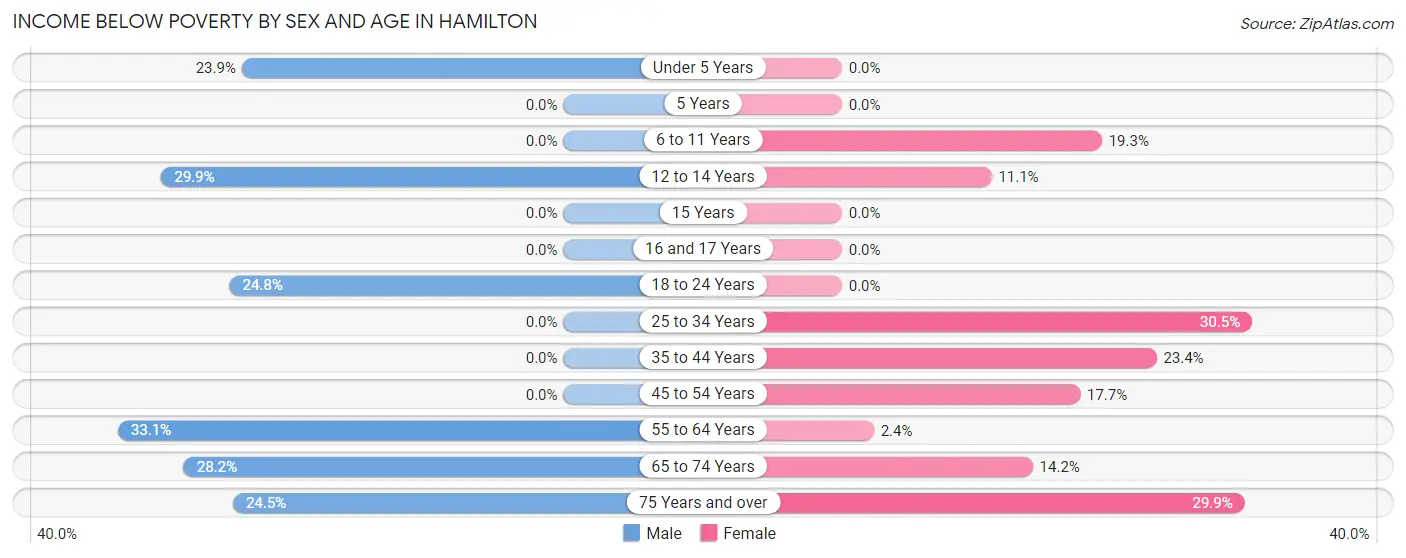
| Age Bracket | Male | Female |
| Under 5 Years | 16 (23.9%) | 0 (0.0%) |
| 5 Years | 0 (0.0%) | 0 (0.0%) |
| 6 to 11 Years | 0 (0.0%) | 11 (19.3%) |
| 12 to 14 Years | 20 (29.8%) | 12 (11.1%) |
| 15 Years | 0 (0.0%) | 0 (0.0%) |
| 16 and 17 Years | 0 (0.0%) | 0 (0.0%) |
| 18 to 24 Years | 56 (24.8%) | 0 (0.0%) |
| 25 to 34 Years | 0 (0.0%) | 46 (30.5%) |
| 35 to 44 Years | 0 (0.0%) | 57 (23.4%) |
| 45 to 54 Years | 0 (0.0%) | 23 (17.7%) |
| 55 to 64 Years | 42 (33.1%) | 6 (2.4%) |
| 65 to 74 Years | 51 (28.2%) | 18 (14.2%) |
| 75 Years and over | 26 (24.5%) | 29 (29.9%) |
| Total | 211 (15.6%) | 202 (14.5%) |
Income Above Poverty by Sex and Age in Hamilton
According to the poverty statistics in Hamilton, males aged 6 to 11 years and females aged under 5 years are the age groups that are most secure financially, with 100.0% of males and 100.0% of females in these age groups living above the poverty line.
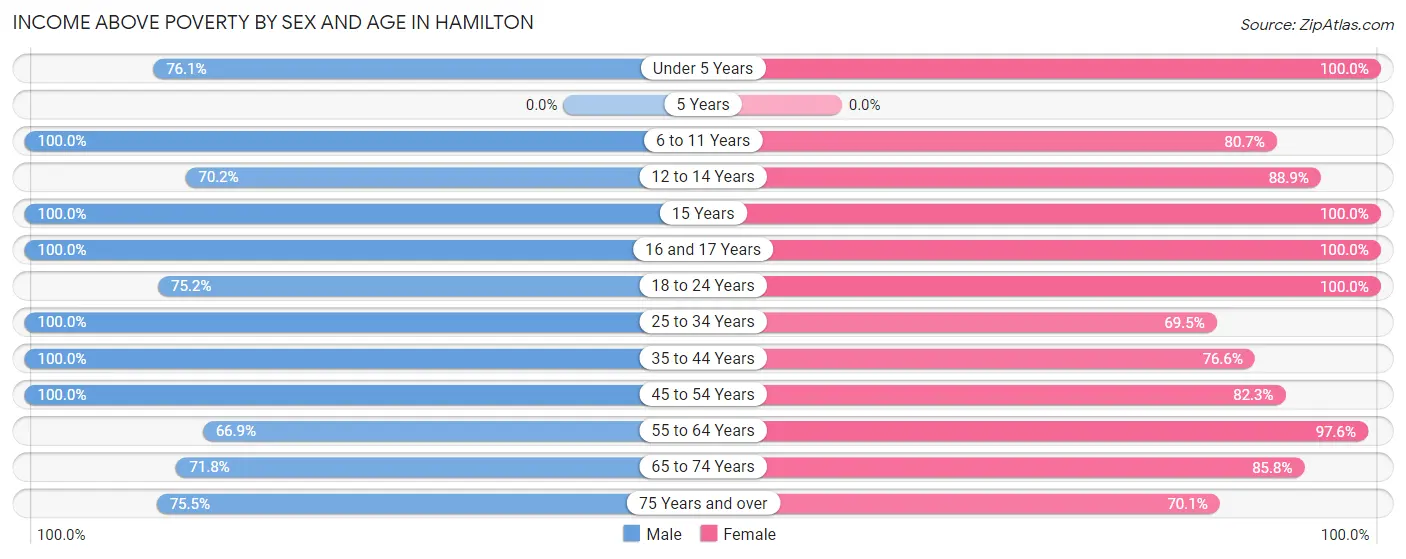
| Age Bracket | Male | Female |
| Under 5 Years | 51 (76.1%) | 38 (100.0%) |
| 5 Years | 0 (0.0%) | 0 (0.0%) |
| 6 to 11 Years | 144 (100.0%) | 46 (80.7%) |
| 12 to 14 Years | 47 (70.2%) | 96 (88.9%) |
| 15 Years | 12 (100.0%) | 38 (100.0%) |
| 16 and 17 Years | 53 (100.0%) | 6 (100.0%) |
| 18 to 24 Years | 170 (75.2%) | 142 (100.0%) |
| 25 to 34 Years | 81 (100.0%) | 105 (69.5%) |
| 35 to 44 Years | 167 (100.0%) | 187 (76.6%) |
| 45 to 54 Years | 118 (100.0%) | 107 (82.3%) |
| 55 to 64 Years | 85 (66.9%) | 247 (97.6%) |
| 65 to 74 Years | 130 (71.8%) | 109 (85.8%) |
| 75 Years and over | 80 (75.5%) | 68 (70.1%) |
| Total | 1,138 (84.4%) | 1,189 (85.5%) |
Income Below Poverty Among Married-Couple Families in Hamilton
The poverty statistics for married-couple families in Hamilton show that 4.3% or 15 of the total 351 families live below the poverty line. Families with no children have the highest poverty rate of 7.8%, comprising of 15 families. On the other hand, families with 1 or 2 children have the lowest poverty rate of 0.0%, which includes 0 families.
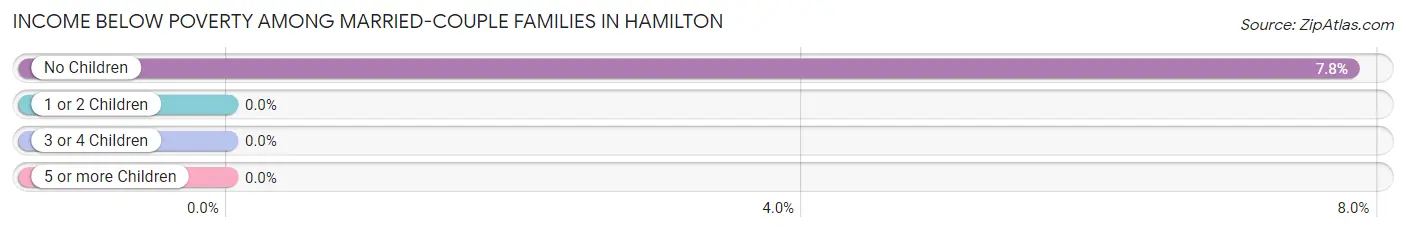
| Children | Above Poverty | Below Poverty |
| No Children | 177 (92.2%) | 15 (7.8%) |
| 1 or 2 Children | 110 (100.0%) | 0 (0.0%) |
| 3 or 4 Children | 4 (100.0%) | 0 (0.0%) |
| 5 or more Children | 45 (100.0%) | 0 (0.0%) |
| Total | 336 (95.7%) | 15 (4.3%) |
Income Below Poverty Among Single-Parent Households in Hamilton
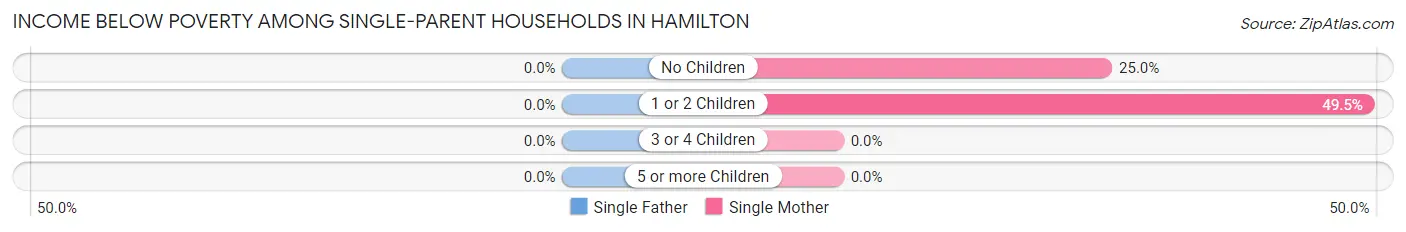
| Children | Single Father | Single Mother |
| No Children | 0 (0.0%) | 13 (25.0%) |
| 1 or 2 Children | 0 (0.0%) | 45 (49.4%) |
| 3 or 4 Children | 0 (0.0%) | 0 (0.0%) |
| 5 or more Children | 0 (0.0%) | 0 (0.0%) |
| Total | 0 (0.0%) | 58 (40.6%) |
Income Below Poverty Among Married-Couple vs Single-Parent Households in Hamilton
The poverty data for Hamilton shows that 15 of the married-couple family households (4.3%) and 58 of the single-parent households (24.7%) are living below the poverty level. Within the married-couple family households, those with no children have the highest poverty rate, with 15 households (7.8%) falling below the poverty line. Among the single-parent households, those with 1 or 2 children have the highest poverty rate, with 45 household (32.4%) living below poverty.
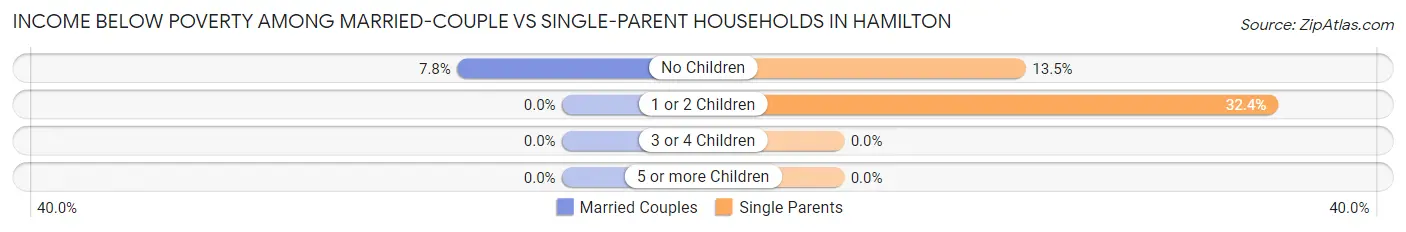
| Children | Married-Couple Families | Single-Parent Households |
| No Children | 15 (7.8%) | 13 (13.5%) |
| 1 or 2 Children | 0 (0.0%) | 45 (32.4%) |
| 3 or 4 Children | 0 (0.0%) | 0 (0.0%) |
| 5 or more Children | 0 (0.0%) | 0 (0.0%) |
| Total | 15 (4.3%) | 58 (24.7%) |
Race in Hamilton
The most populous races in Hamilton are White / Caucasian (2,367 | 81.7%), Hispanic or Latino (529 | 18.2%), and Two or more Races (487 | 16.8%).
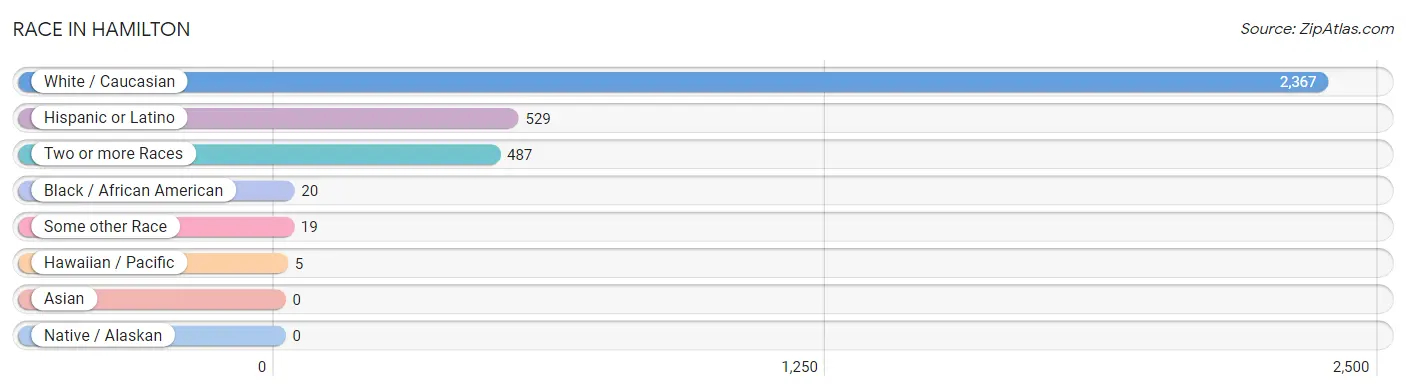
| Race | # Population | % Population |
| Asian | 0 | 0.0% |
| Black / African American | 20 | 0.7% |
| Hawaiian / Pacific | 5 | 0.2% |
| Hispanic or Latino | 529 | 18.2% |
| Native / Alaskan | 0 | 0.0% |
| White / Caucasian | 2,367 | 81.7% |
| Two or more Races | 487 | 16.8% |
| Some other Race | 19 | 0.7% |
| Total | 2,898 | 100.0% |
Ancestry in Hamilton
The most populous ancestries reported in Hamilton are Mexican (485 | 16.7%), English (362 | 12.5%), American (359 | 12.4%), Irish (335 | 11.6%), and German (311 | 10.7%), together accounting for 63.9% of all Hamilton residents.
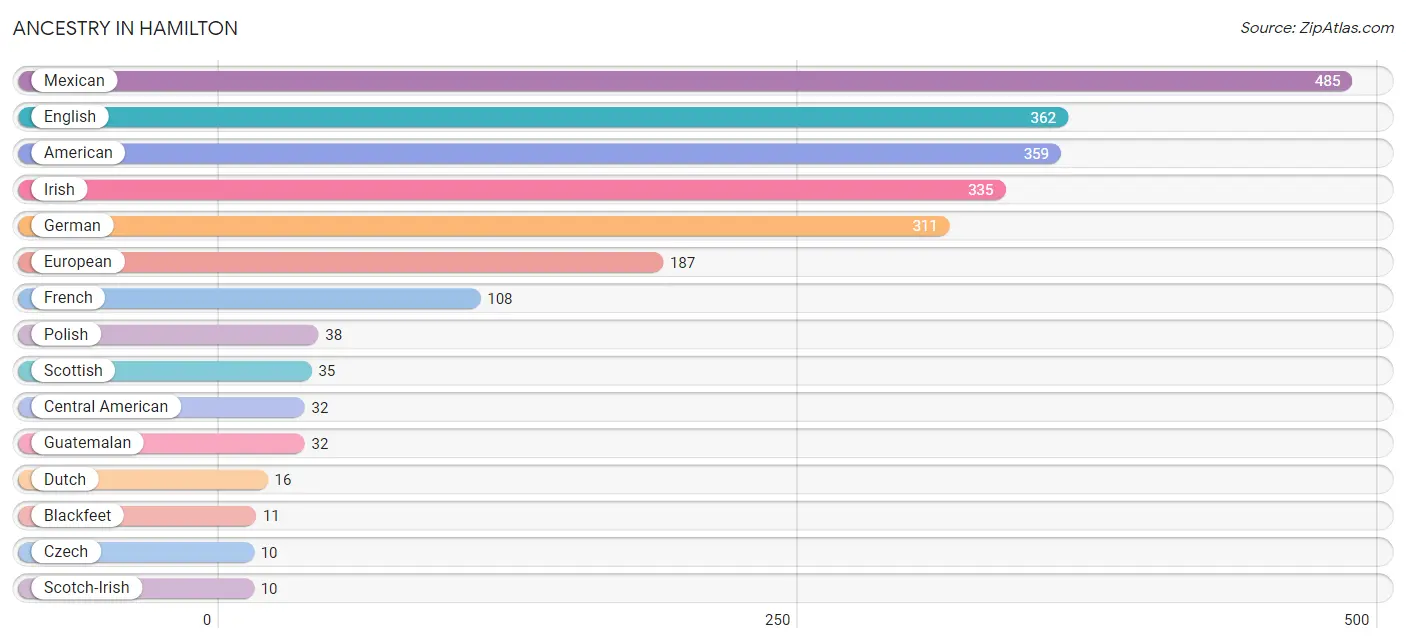
| Ancestry | # Population | % Population |
| American | 359 | 12.4% |
| Blackfeet | 11 | 0.4% |
| Central American | 32 | 1.1% |
| Cherokee | 1 | 0.0% |
| Crow | 7 | 0.2% |
| Czech | 10 | 0.4% |
| Dutch | 16 | 0.5% |
| English | 362 | 12.5% |
| European | 187 | 6.5% |
| French | 108 | 3.7% |
| French Canadian | 3 | 0.1% |
| German | 311 | 10.7% |
| Guatemalan | 32 | 1.1% |
| Irish | 335 | 11.6% |
| Italian | 8 | 0.3% |
| Mexican | 485 | 16.7% |
| Native Hawaiian | 5 | 0.2% |
| Nigerian | 4 | 0.1% |
| Norwegian | 5 | 0.2% |
| Polish | 38 | 1.3% |
| Scotch-Irish | 10 | 0.4% |
| Scottish | 35 | 1.2% |
| Subsaharan African | 4 | 0.1% | View All 23 Rows |
Immigrants in Hamilton
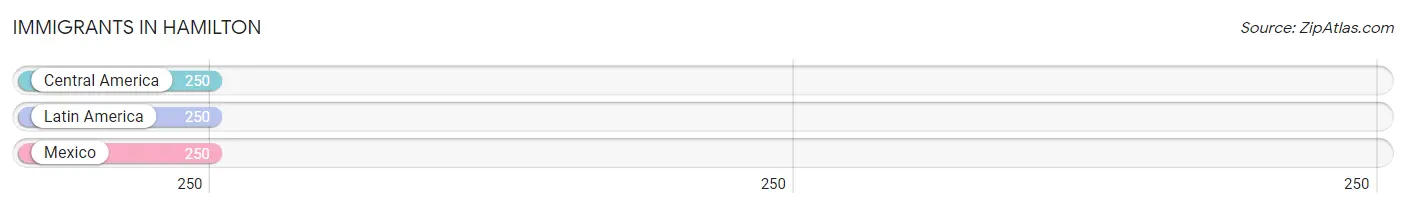
The most numerous immigrant groups reported in Hamilton came from Central America (250 | 8.6%), Latin America (250 | 8.6%), and Mexico (250 | 8.6%), together accounting for 25.9% of all Hamilton residents.
| Immigration Origin | # Population | % Population |
| Central America | 250 | 8.6% |
| Latin America | 250 | 8.6% |
| Mexico | 250 | 8.6% | View All 3 Rows |
Sex and Age in Hamilton
Sex and Age in Hamilton
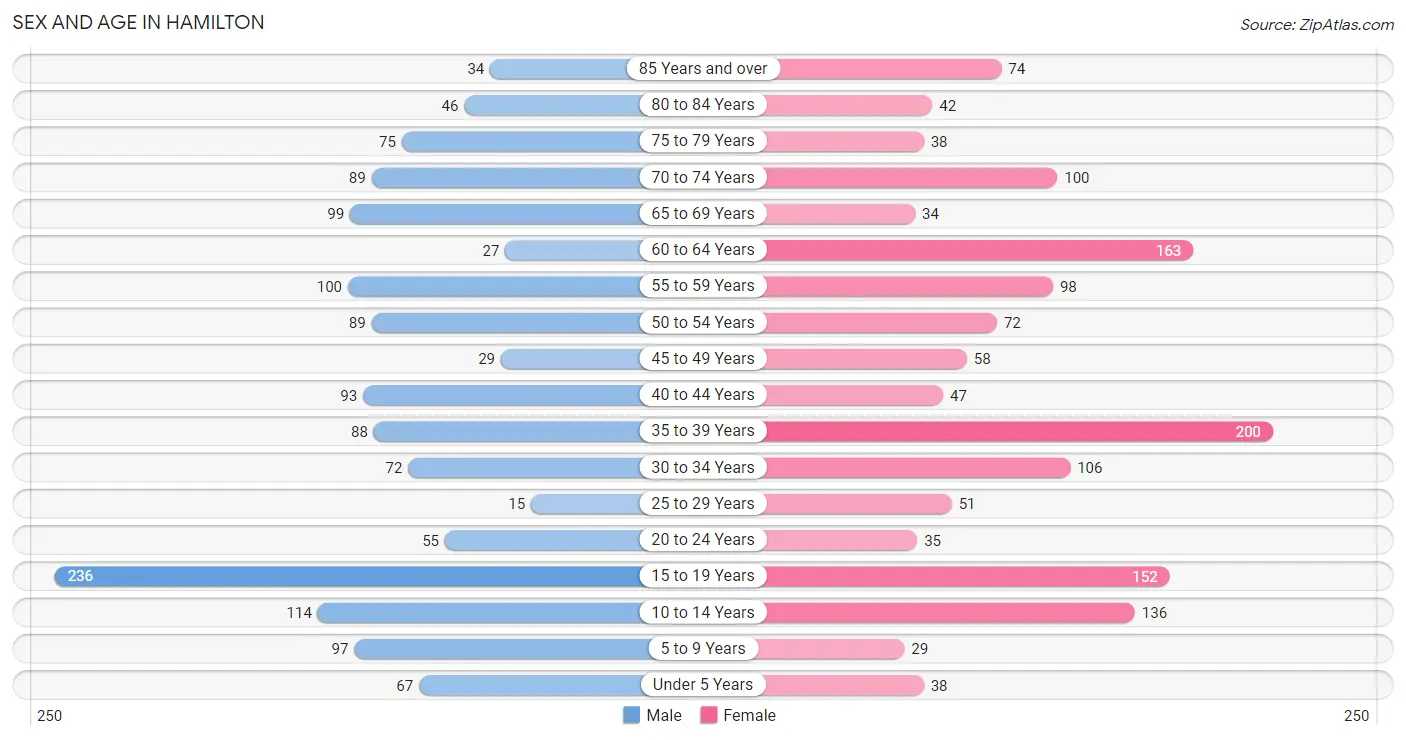
The most populous age groups in Hamilton are 15 to 19 Years (236 | 16.6%) for men and 35 to 39 Years (200 | 13.6%) for women.
| Age Bracket | Male | Female |
| Under 5 Years | 67 (4.7%) | 38 (2.6%) |
| 5 to 9 Years | 97 (6.8%) | 29 (2.0%) |
| 10 to 14 Years | 114 (8.0%) | 136 (9.2%) |
| 15 to 19 Years | 236 (16.6%) | 152 (10.3%) |
| 20 to 24 Years | 55 (3.9%) | 35 (2.4%) |
| 25 to 29 Years | 15 (1.1%) | 51 (3.5%) |
| 30 to 34 Years | 72 (5.1%) | 106 (7.2%) |
| 35 to 39 Years | 88 (6.2%) | 200 (13.6%) |
| 40 to 44 Years | 93 (6.5%) | 47 (3.2%) |
| 45 to 49 Years | 29 (2.0%) | 58 (3.9%) |
| 50 to 54 Years | 89 (6.2%) | 72 (4.9%) |
| 55 to 59 Years | 100 (7.0%) | 98 (6.7%) |
| 60 to 64 Years | 27 (1.9%) | 163 (11.1%) |
| 65 to 69 Years | 99 (7.0%) | 34 (2.3%) |
| 70 to 74 Years | 89 (6.2%) | 100 (6.8%) |
| 75 to 79 Years | 75 (5.3%) | 38 (2.6%) |
| 80 to 84 Years | 46 (3.2%) | 42 (2.9%) |
| 85 Years and over | 34 (2.4%) | 74 (5.0%) |
| Total | 1,425 (100.0%) | 1,473 (100.0%) |
Families and Households in Hamilton
Median Family Size in Hamilton
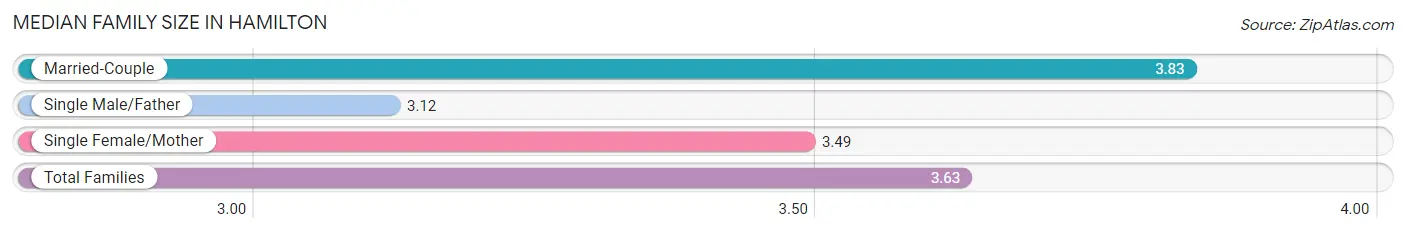
The median family size in Hamilton is 3.63 persons per family, with married-couple families (351 | 59.9%) accounting for the largest median family size of 3.83 persons per family. On the other hand, single male/father families (92 | 15.7%) represent the smallest median family size with 3.12 persons per family.
| Family Type | # Families | Family Size |
| Married-Couple | 351 (59.9%) | 3.83 |
| Single Male/Father | 92 (15.7%) | 3.12 |
| Single Female/Mother | 143 (24.4%) | 3.49 |
| Total Families | 586 (100.0%) | 3.63 |
Median Household Size in Hamilton
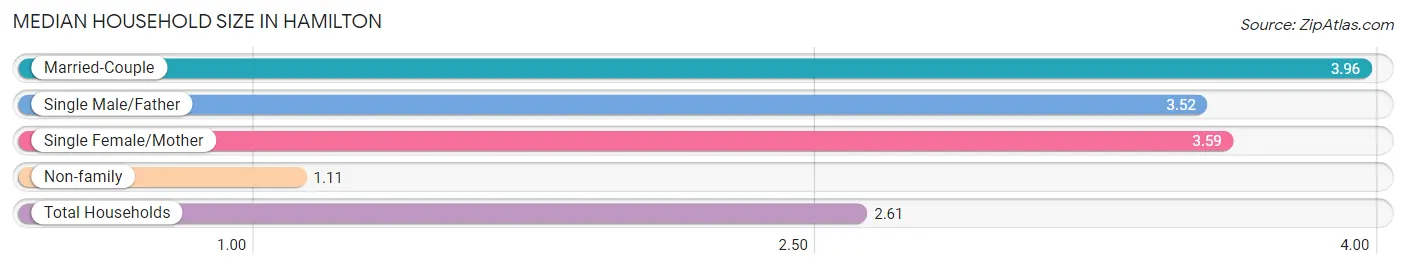
The median household size in Hamilton is 2.61 persons per household, with married-couple households (351 | 33.4%) accounting for the largest median household size of 3.96 persons per household. non-family households (464 | 44.2%) represent the smallest median household size with 1.11 persons per household.
| Household Type | # Households | Household Size |
| Married-Couple | 351 (33.4%) | 3.96 |
| Single Male/Father | 92 (8.8%) | 3.52 |
| Single Female/Mother | 143 (13.6%) | 3.59 |
| Non-family | 464 (44.2%) | 1.11 |
| Total Households | 1,050 (100.0%) | 2.61 |
Household Size by Marriage Status in Hamilton
Out of a total of 1,050 households in Hamilton, 586 (55.8%) are family households, while 464 (44.2%) are nonfamily households. The most numerous type of family households are 2-person households, comprising 320, and the most common type of nonfamily households are 1-person households, comprising 409.
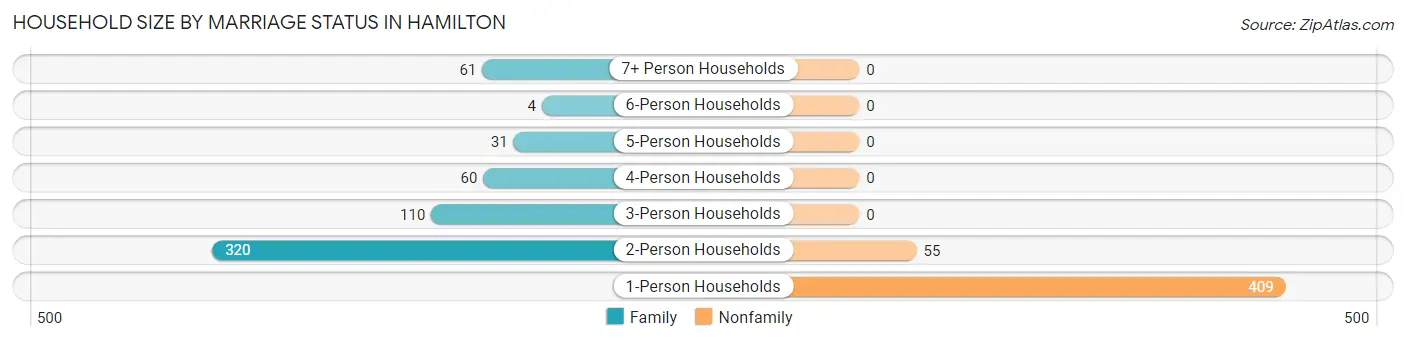
| Household Size | Family Households | Nonfamily Households |
| 1-Person Households | - | 409 (39.0%) |
| 2-Person Households | 320 (30.5%) | 55 (5.2%) |
| 3-Person Households | 110 (10.5%) | 0 (0.0%) |
| 4-Person Households | 60 (5.7%) | 0 (0.0%) |
| 5-Person Households | 31 (2.9%) | 0 (0.0%) |
| 6-Person Households | 4 (0.4%) | 0 (0.0%) |
| 7+ Person Households | 61 (5.8%) | 0 (0.0%) |
| Total | 586 (55.8%) | 464 (44.2%) |
Female Fertility in Hamilton
Fertility by Age in Hamilton
Average fertility rate in Hamilton is 18.0 births per 1,000 women. Women in the age bracket of 35 to 50 years have the highest fertility rate with 39.0 births per 1,000 women. Women in the age bracket of 35 to 50 years acount for 100.0% of all women with births.
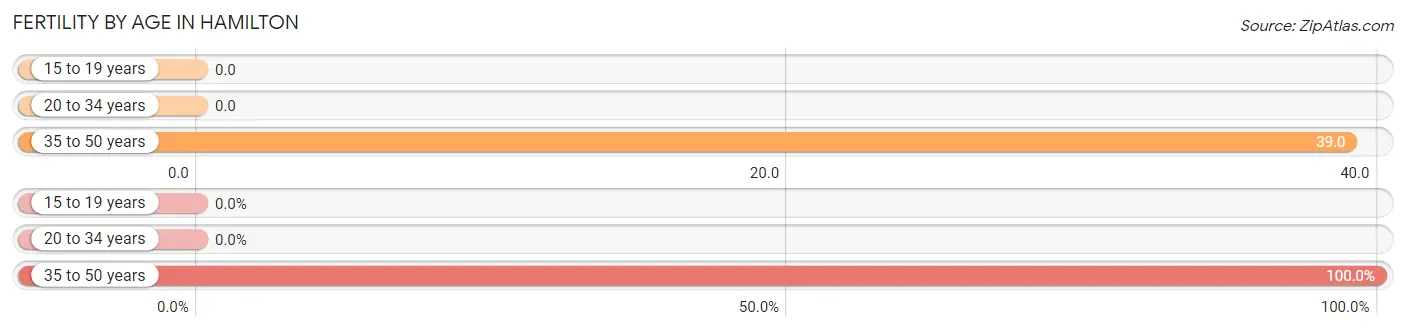
| Age Bracket | Women with Births | Births / 1,000 Women |
| 15 to 19 years | 0 (0.0%) | 0.0 |
| 20 to 34 years | 0 (0.0%) | 0.0 |
| 35 to 50 years | 12 (100.0%) | 39.0 |
| Total | 12 (100.0%) | 18.0 |
Fertility by Age by Marriage Status in Hamilton
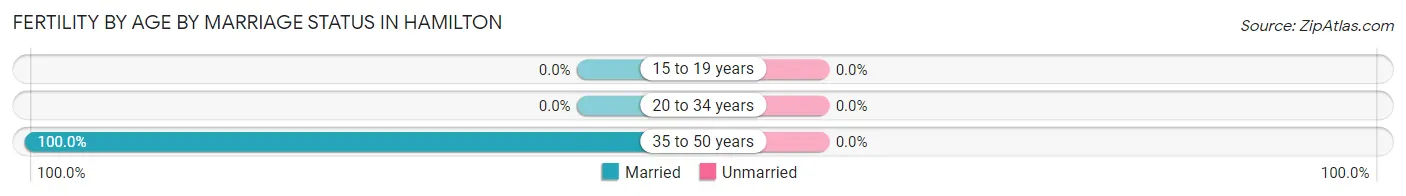
| Age Bracket | Married | Unmarried |
| 15 to 19 years | 0 (0.0%) | 0 (0.0%) |
| 20 to 34 years | 0 (0.0%) | 0 (0.0%) |
| 35 to 50 years | 12 (100.0%) | 0 (0.0%) |
| Total | 12 (100.0%) | 0 (0.0%) |
Fertility by Education in Hamilton
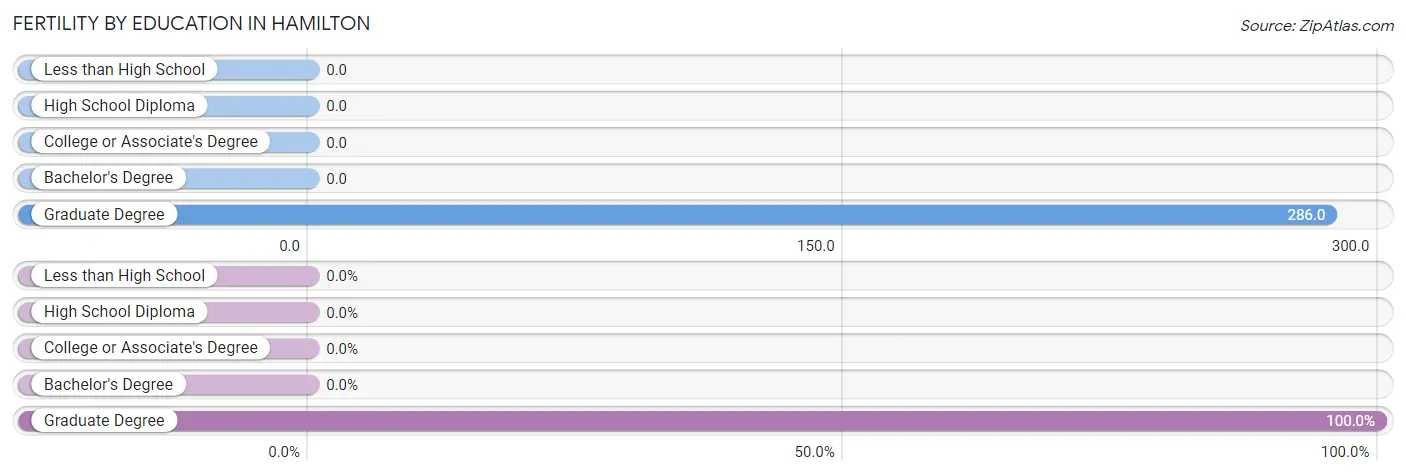
| Educational Attainment | Women with Births | Births / 1,000 Women |
| Less than High School | 0 (0.0%) | 0.0 |
| High School Diploma | 0 (0.0%) | 0.0 |
| College or Associate's Degree | 0 (0.0%) | 0.0 |
| Bachelor's Degree | 0 (0.0%) | 0.0 |
| Graduate Degree | 12 (100.0%) | 286.0 |
| Total | 12 (100.0%) | 18.0 |
Fertility by Education by Marriage Status in Hamilton
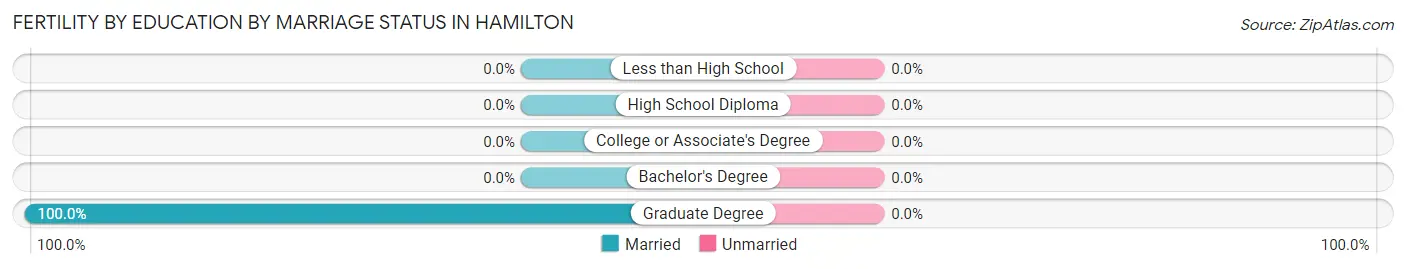
| Educational Attainment | Married | Unmarried |
| Less than High School | 0 (0.0%) | 0 (0.0%) |
| High School Diploma | 0 (0.0%) | 0 (0.0%) |
| College or Associate's Degree | 0 (0.0%) | 0 (0.0%) |
| Bachelor's Degree | 0 (0.0%) | 0 (0.0%) |
| Graduate Degree | 12 (100.0%) | 0 (0.0%) |
| Total | 12 (100.0%) | 0 (0.0%) |
Employment Characteristics in Hamilton
Employment by Class of Employer in Hamilton
Among the 1,326 employed individuals in Hamilton, private company employees (835 | 63.0%), local government employees (199 | 15.0%), and not-for-profit organizations (115 | 8.7%) make up the most common classes of employment.
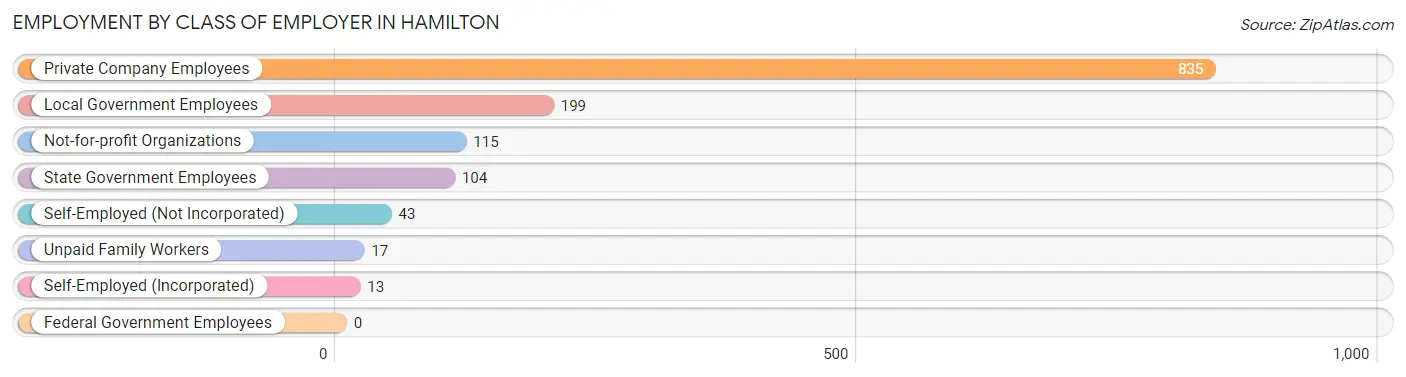
| Employer Class | # Employees | % Employees |
| Private Company Employees | 835 | 63.0% |
| Self-Employed (Incorporated) | 13 | 1.0% |
| Self-Employed (Not Incorporated) | 43 | 3.2% |
| Not-for-profit Organizations | 115 | 8.7% |
| Local Government Employees | 199 | 15.0% |
| State Government Employees | 104 | 7.8% |
| Federal Government Employees | 0 | 0.0% |
| Unpaid Family Workers | 17 | 1.3% |
| Total | 1,326 | 100.0% |
Employment Status by Age in Hamilton
According to the labor force statistics for Hamilton, out of the total population over 16 years of age (2,367), 58.5% or 1,385 individuals are in the labor force, with 2.2% or 30 of them unemployed. The age group with the highest labor force participation rate is 20 to 24 years, with 98.9% or 89 individuals in the labor force. Within the labor force, the 16 to 19 years age range has the highest percentage of unemployed individuals, with 14.4% or 31 of them being unemployed.
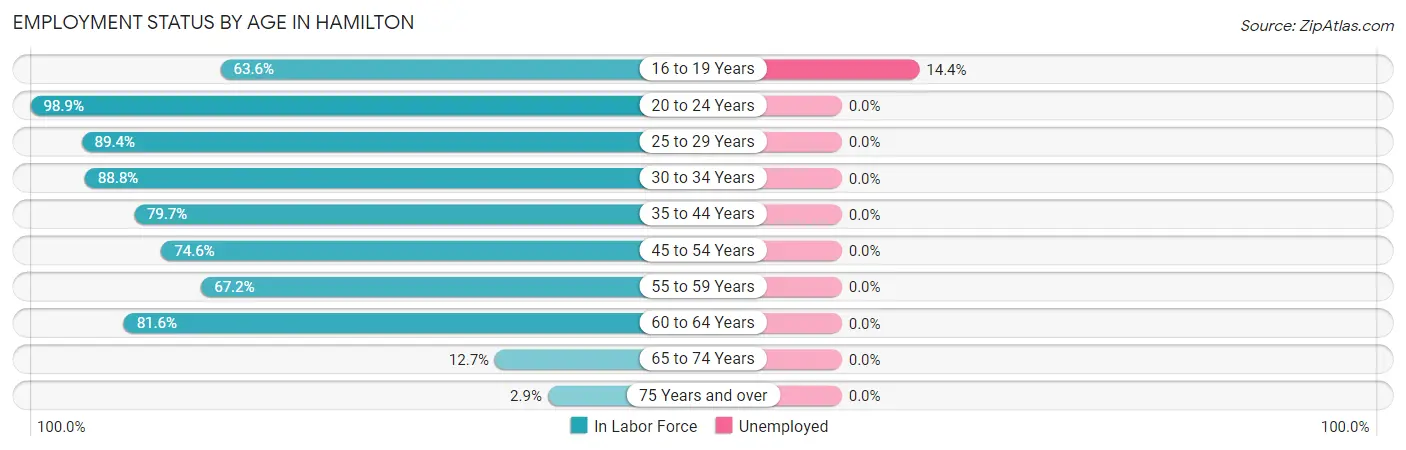
| Age Bracket | In Labor Force | Unemployed |
| 16 to 19 Years | 215 (63.6%) | 31 (14.4%) |
| 20 to 24 Years | 89 (98.9%) | 0 (0.0%) |
| 25 to 29 Years | 59 (89.4%) | 0 (0.0%) |
| 30 to 34 Years | 158 (88.8%) | 0 (0.0%) |
| 35 to 44 Years | 341 (79.7%) | 0 (0.0%) |
| 45 to 54 Years | 185 (74.6%) | 0 (0.0%) |
| 55 to 59 Years | 133 (67.2%) | 0 (0.0%) |
| 60 to 64 Years | 155 (81.6%) | 0 (0.0%) |
| 65 to 74 Years | 41 (12.7%) | 0 (0.0%) |
| 75 Years and over | 9 (2.9%) | 0 (0.0%) |
| Total | 1,385 (58.5%) | 30 (2.2%) |
Employment Status by Educational Attainment in Hamilton
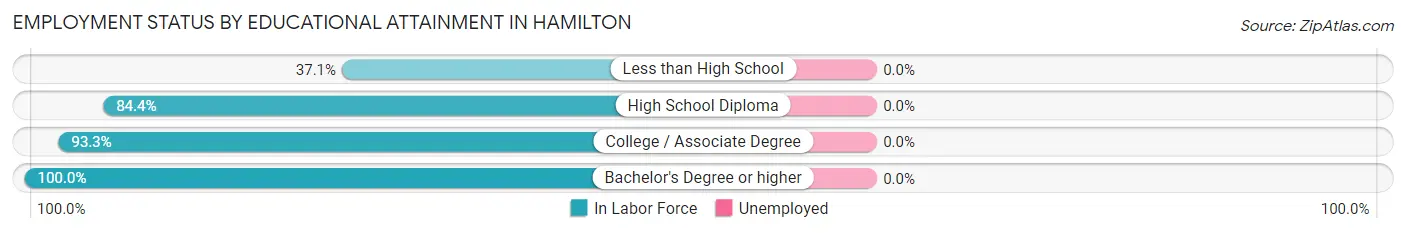
| Educational Attainment | In Labor Force | Unemployed |
| Less than High School | 105 (37.1%) | 0 (0.0%) |
| High School Diploma | 422 (84.4%) | 0 (0.0%) |
| College / Associate Degree | 291 (93.3%) | 0 (0.0%) |
| Bachelor's Degree or higher | 213 (100.0%) | 0 (0.0%) |
| Total | 1,031 (78.8%) | 0 (0.0%) |
Employment Occupations by Sex in Hamilton
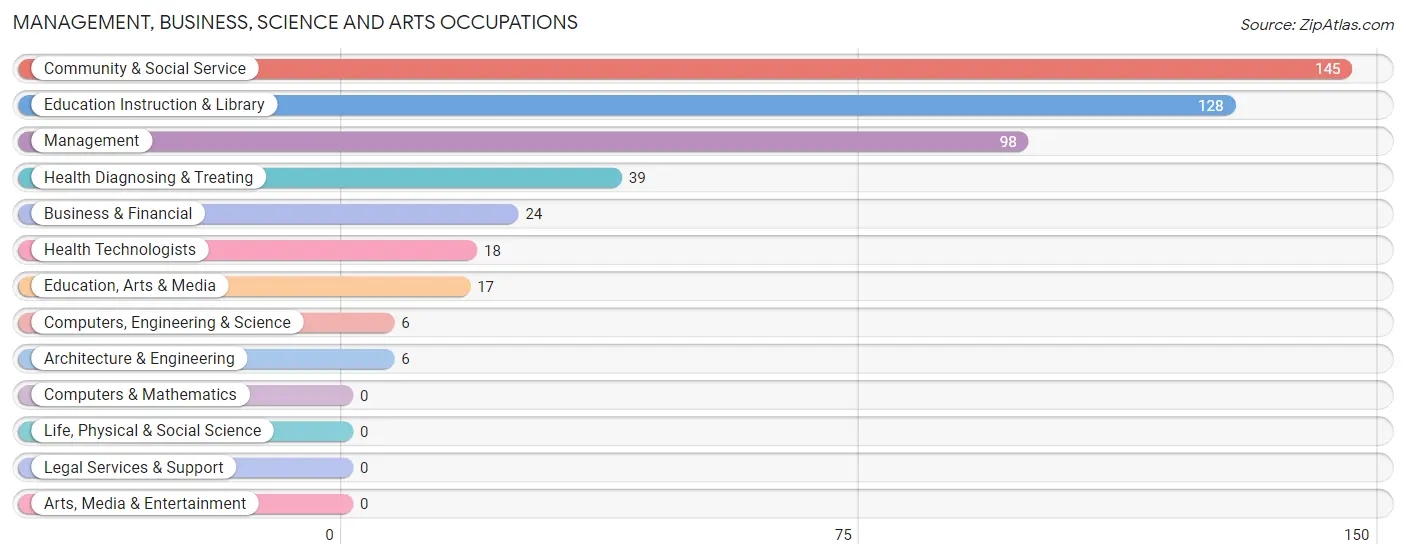
Management, Business, Science and Arts Occupations
The most common Management, Business, Science and Arts occupations in Hamilton are Community & Social Service (145 | 10.7%), Education Instruction & Library (128 | 9.5%), Management (98 | 7.2%), Health Diagnosing & Treating (39 | 2.9%), and Business & Financial (24 | 1.8%).
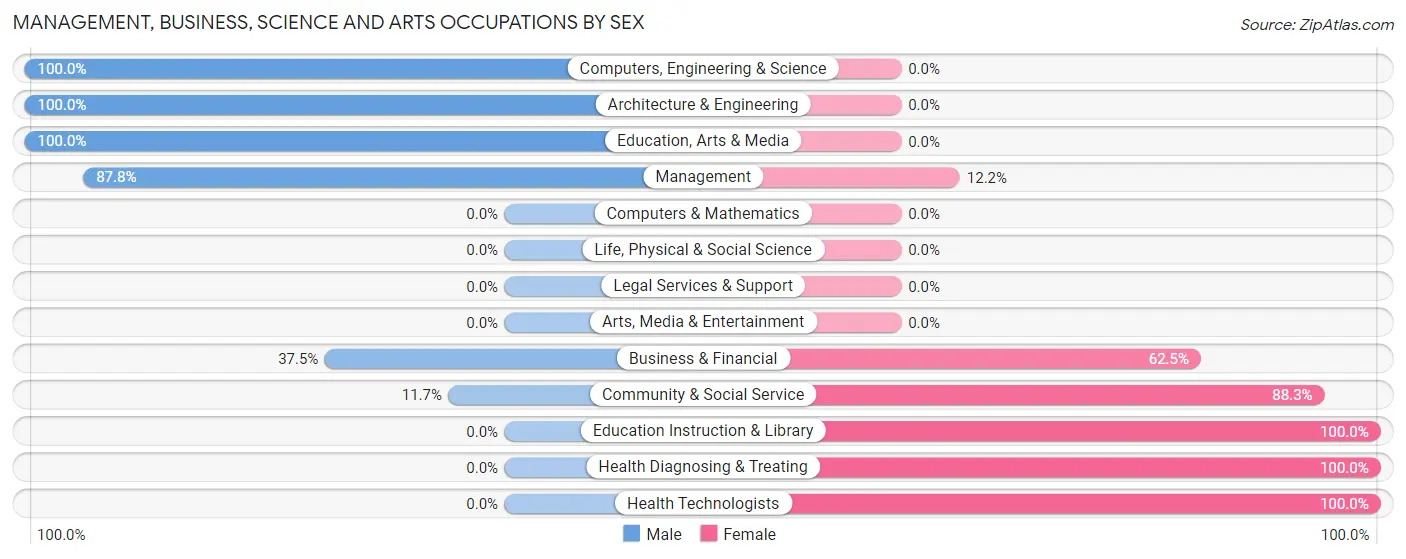
Management, Business, Science and Arts Occupations by Sex
Within the Management, Business, Science and Arts occupations in Hamilton, the most male-oriented occupations are Computers, Engineering & Science (100.0%), Architecture & Engineering (100.0%), and Education, Arts & Media (100.0%), while the most female-oriented occupations are Education Instruction & Library (100.0%), Health Diagnosing & Treating (100.0%), and Health Technologists (100.0%).
| Occupation | Male | Female |
| Management | 86 (87.8%) | 12 (12.2%) |
| Business & Financial | 9 (37.5%) | 15 (62.5%) |
| Computers, Engineering & Science | 6 (100.0%) | 0 (0.0%) |
| Computers & Mathematics | 0 (0.0%) | 0 (0.0%) |
| Architecture & Engineering | 6 (100.0%) | 0 (0.0%) |
| Life, Physical & Social Science | 0 (0.0%) | 0 (0.0%) |
| Community & Social Service | 17 (11.7%) | 128 (88.3%) |
| Education, Arts & Media | 17 (100.0%) | 0 (0.0%) |
| Legal Services & Support | 0 (0.0%) | 0 (0.0%) |
| Education Instruction & Library | 0 (0.0%) | 128 (100.0%) |
| Arts, Media & Entertainment | 0 (0.0%) | 0 (0.0%) |
| Health Diagnosing & Treating | 0 (0.0%) | 39 (100.0%) |
| Health Technologists | 0 (0.0%) | 18 (100.0%) |
| Total (Category) | 118 (37.8%) | 194 (62.2%) |
| Total (Overall) | 595 (43.9%) | 759 (56.1%) |
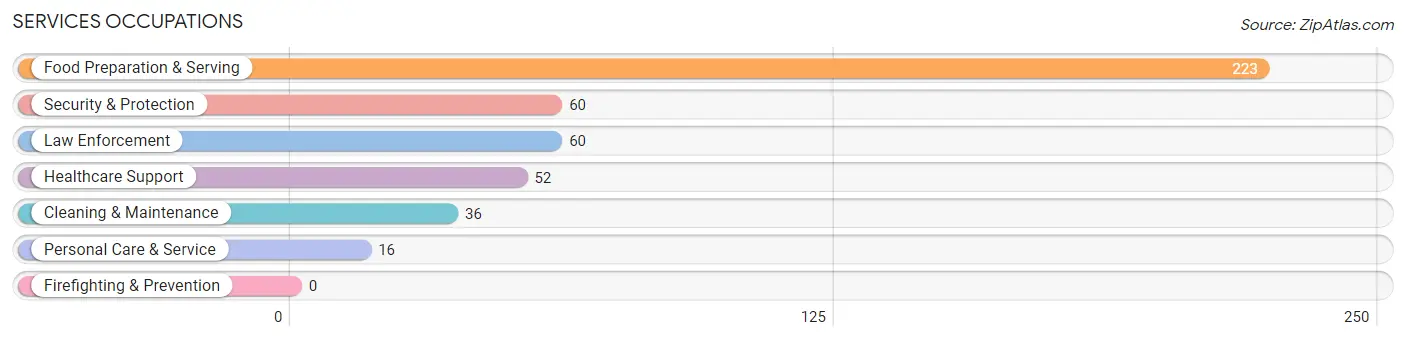
Services Occupations
The most common Services occupations in Hamilton are Food Preparation & Serving (223 | 16.5%), Security & Protection (60 | 4.4%), Law Enforcement (60 | 4.4%), Healthcare Support (52 | 3.8%), and Cleaning & Maintenance (36 | 2.7%).
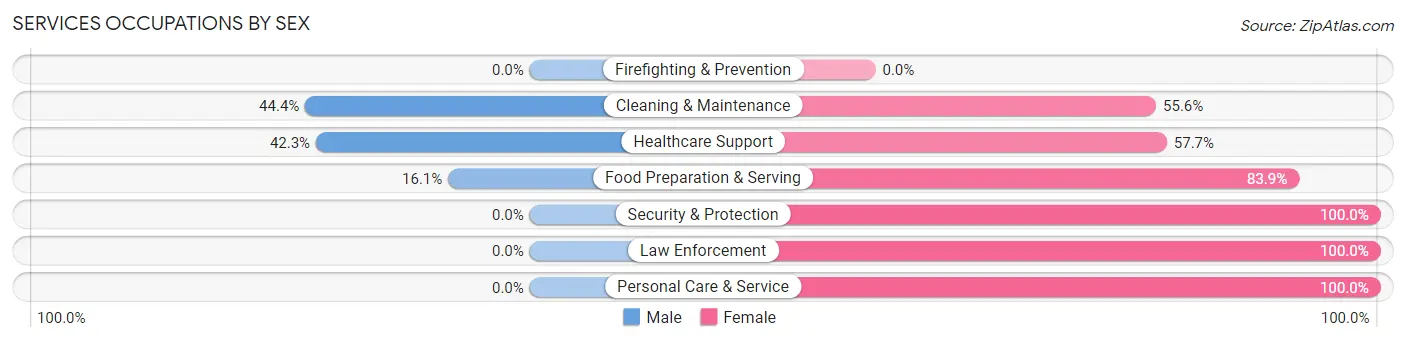
Services Occupations by Sex
Within the Services occupations in Hamilton, the most male-oriented occupations are Cleaning & Maintenance (44.4%), Healthcare Support (42.3%), and Food Preparation & Serving (16.1%), while the most female-oriented occupations are Security & Protection (100.0%), Law Enforcement (100.0%), and Personal Care & Service (100.0%).
| Occupation | Male | Female |
| Healthcare Support | 22 (42.3%) | 30 (57.7%) |
| Security & Protection | 0 (0.0%) | 60 (100.0%) |
| Firefighting & Prevention | 0 (0.0%) | 0 (0.0%) |
| Law Enforcement | 0 (0.0%) | 60 (100.0%) |
| Food Preparation & Serving | 36 (16.1%) | 187 (83.9%) |
| Cleaning & Maintenance | 16 (44.4%) | 20 (55.6%) |
| Personal Care & Service | 0 (0.0%) | 16 (100.0%) |
| Total (Category) | 74 (19.1%) | 313 (80.9%) |
| Total (Overall) | 595 (43.9%) | 759 (56.1%) |
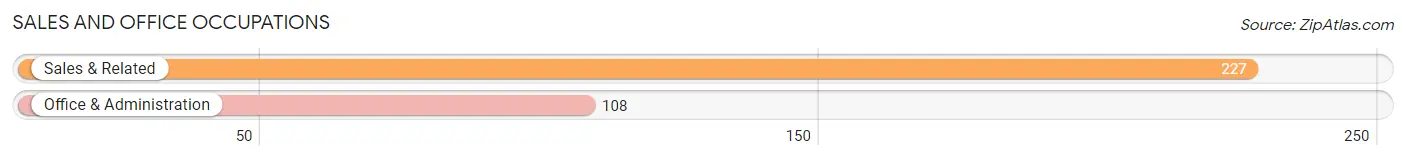
Sales and Office Occupations
The most common Sales and Office occupations in Hamilton are Sales & Related (227 | 16.8%), and Office & Administration (108 | 8.0%).
Sales and Office Occupations by Sex
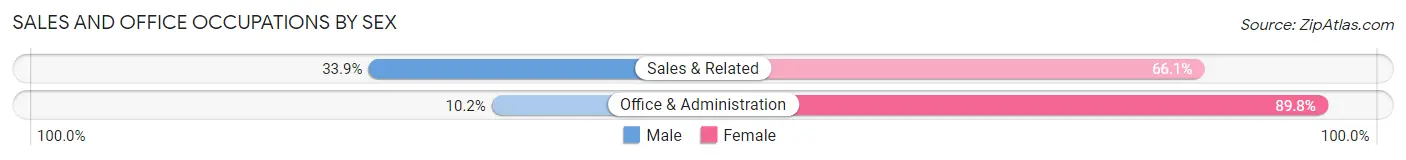
| Occupation | Male | Female |
| Sales & Related | 77 (33.9%) | 150 (66.1%) |
| Office & Administration | 11 (10.2%) | 97 (89.8%) |
| Total (Category) | 88 (26.3%) | 247 (73.7%) |
| Total (Overall) | 595 (43.9%) | 759 (56.1%) |
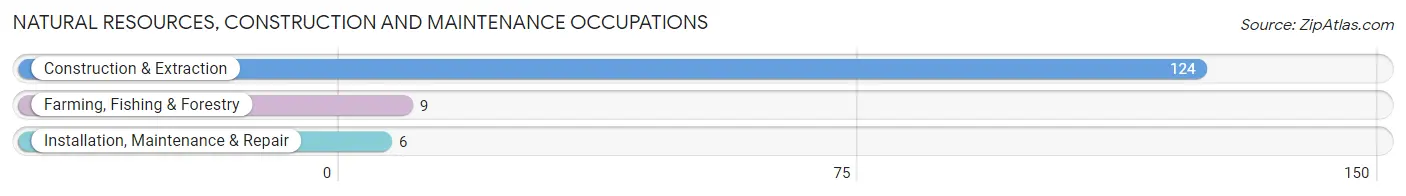
Natural Resources, Construction and Maintenance Occupations
The most common Natural Resources, Construction and Maintenance occupations in Hamilton are Construction & Extraction (124 | 9.2%), Farming, Fishing & Forestry (9 | 0.7%), and Installation, Maintenance & Repair (6 | 0.4%).
Natural Resources, Construction and Maintenance Occupations by Sex
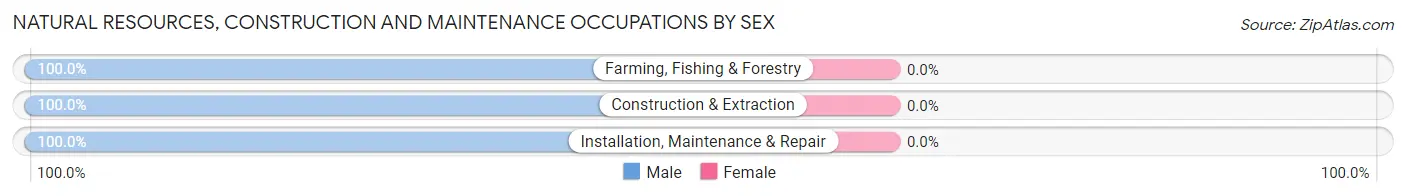
| Occupation | Male | Female |
| Farming, Fishing & Forestry | 9 (100.0%) | 0 (0.0%) |
| Construction & Extraction | 124 (100.0%) | 0 (0.0%) |
| Installation, Maintenance & Repair | 6 (100.0%) | 0 (0.0%) |
| Total (Category) | 139 (100.0%) | 0 (0.0%) |
| Total (Overall) | 595 (43.9%) | 759 (56.1%) |
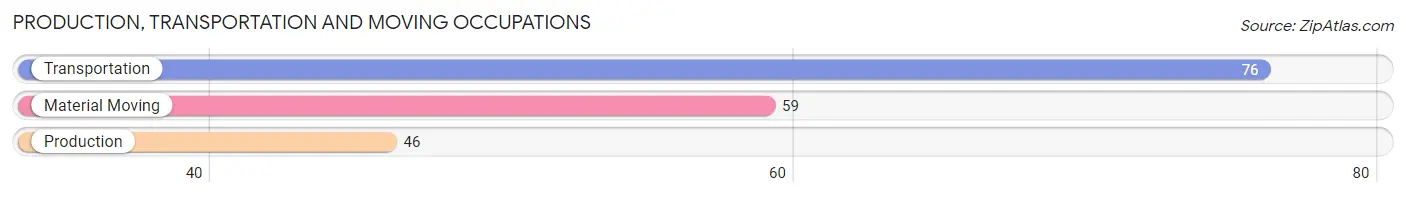
Production, Transportation and Moving Occupations
The most common Production, Transportation and Moving occupations in Hamilton are Transportation (76 | 5.6%), Material Moving (59 | 4.4%), and Production (46 | 3.4%).
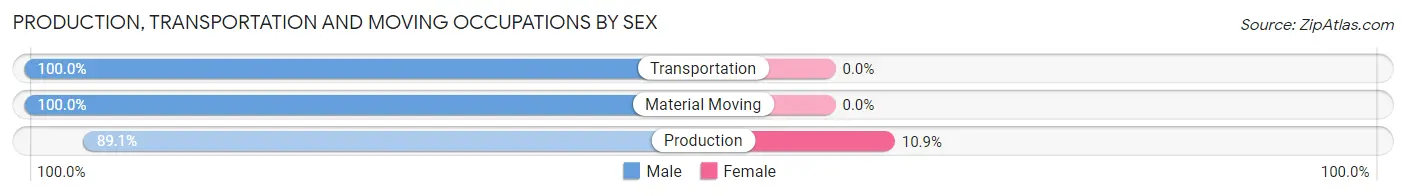
Production, Transportation and Moving Occupations by Sex
| Occupation | Male | Female |
| Production | 41 (89.1%) | 5 (10.9%) |
| Transportation | 76 (100.0%) | 0 (0.0%) |
| Material Moving | 59 (100.0%) | 0 (0.0%) |
| Total (Category) | 176 (97.2%) | 5 (2.8%) |
| Total (Overall) | 595 (43.9%) | 759 (56.1%) |
Employment Industries by Sex in Hamilton
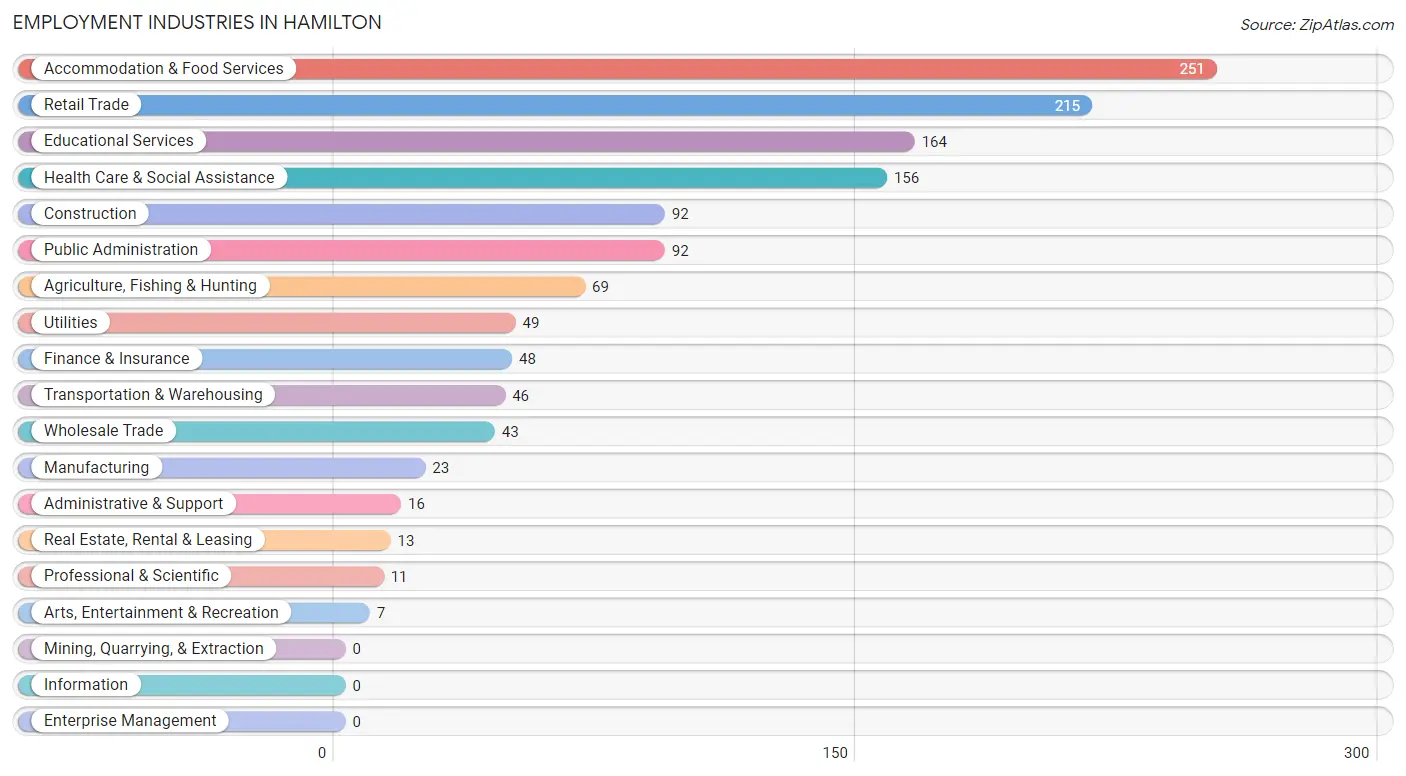
Employment Industries in Hamilton
The major employment industries in Hamilton include Accommodation & Food Services (251 | 18.5%), Retail Trade (215 | 15.9%), Educational Services (164 | 12.1%), Health Care & Social Assistance (156 | 11.5%), and Construction (92 | 6.8%).
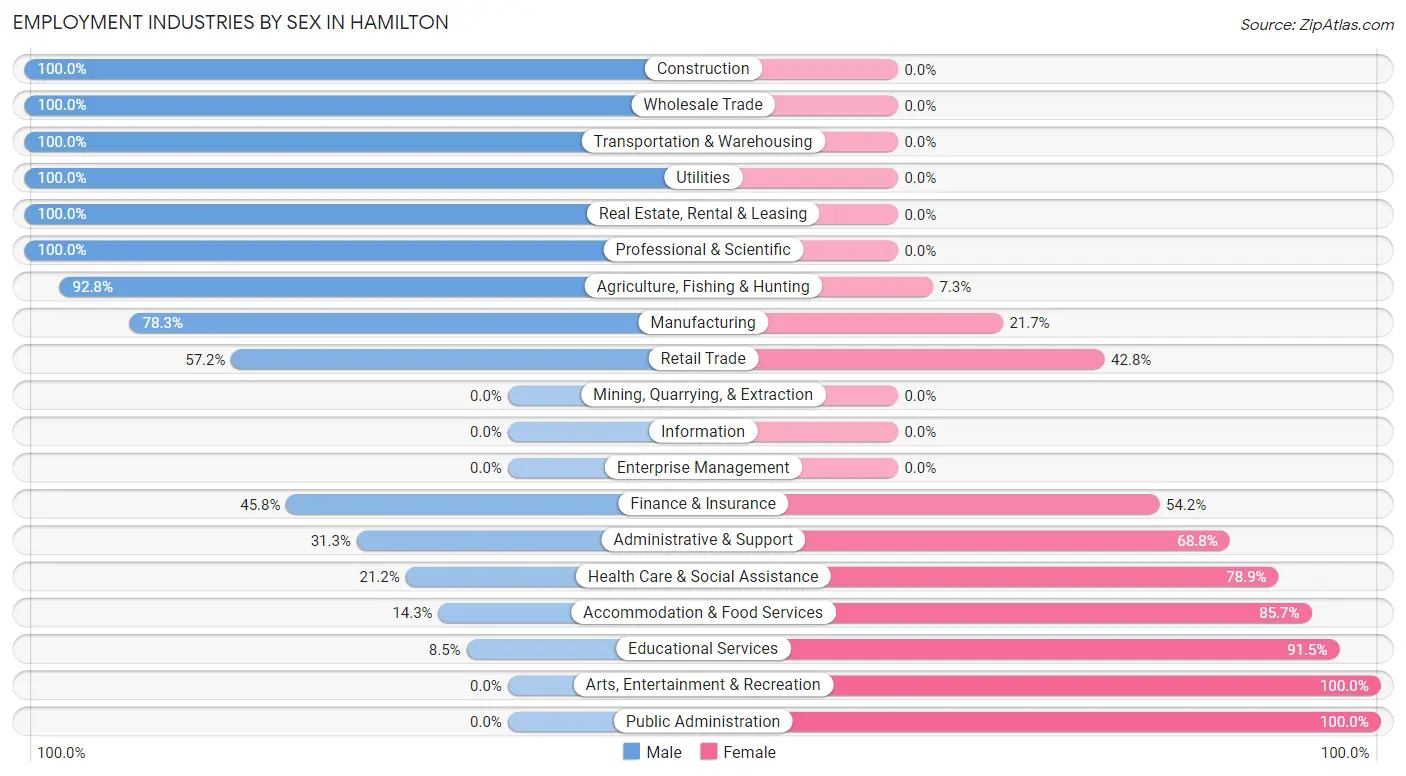
Employment Industries by Sex in Hamilton
The Hamilton industries that see more men than women are Construction (100.0%), Wholesale Trade (100.0%), and Transportation & Warehousing (100.0%), whereas the industries that tend to have a higher number of women are Arts, Entertainment & Recreation (100.0%), Public Administration (100.0%), and Educational Services (91.5%).
| Industry | Male | Female |
| Agriculture, Fishing & Hunting | 64 (92.7%) | 5 (7.2%) |
| Mining, Quarrying, & Extraction | 0 (0.0%) | 0 (0.0%) |
| Construction | 92 (100.0%) | 0 (0.0%) |
| Manufacturing | 18 (78.3%) | 5 (21.7%) |
| Wholesale Trade | 43 (100.0%) | 0 (0.0%) |
| Retail Trade | 123 (57.2%) | 92 (42.8%) |
| Transportation & Warehousing | 46 (100.0%) | 0 (0.0%) |
| Utilities | 49 (100.0%) | 0 (0.0%) |
| Information | 0 (0.0%) | 0 (0.0%) |
| Finance & Insurance | 22 (45.8%) | 26 (54.2%) |
| Real Estate, Rental & Leasing | 13 (100.0%) | 0 (0.0%) |
| Professional & Scientific | 11 (100.0%) | 0 (0.0%) |
| Enterprise Management | 0 (0.0%) | 0 (0.0%) |
| Administrative & Support | 5 (31.2%) | 11 (68.8%) |
| Educational Services | 14 (8.5%) | 150 (91.5%) |
| Health Care & Social Assistance | 33 (21.1%) | 123 (78.8%) |
| Arts, Entertainment & Recreation | 0 (0.0%) | 7 (100.0%) |
| Accommodation & Food Services | 36 (14.3%) | 215 (85.7%) |
| Public Administration | 0 (0.0%) | 92 (100.0%) |
| Total | 595 (43.9%) | 759 (56.1%) |
Education in Hamilton
School Enrollment in Hamilton
The most common levels of schooling among the 744 students in Hamilton are high school (301 | 40.5%), middle school (171 | 23.0%), and elementary school (144 | 19.4%).
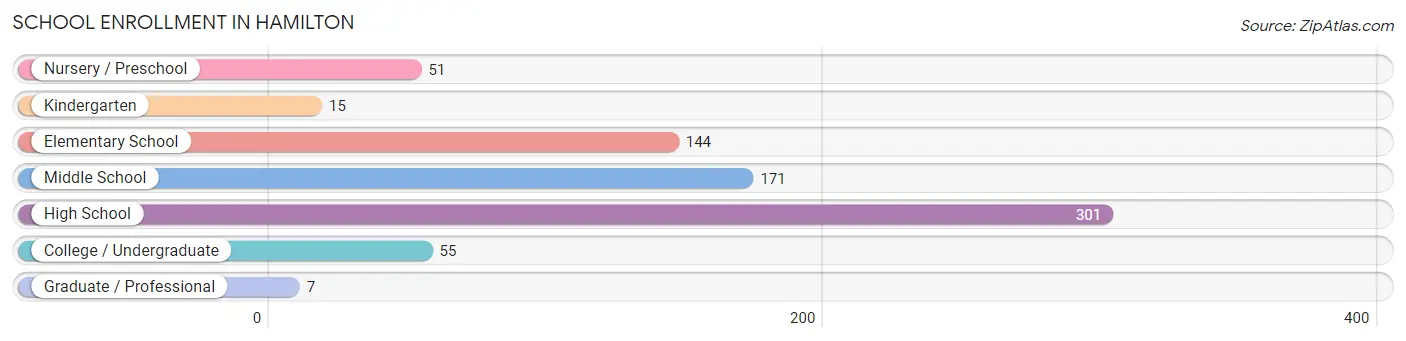
| School Level | # Students | % Students |
| Nursery / Preschool | 51 | 6.9% |
| Kindergarten | 15 | 2.0% |
| Elementary School | 144 | 19.4% |
| Middle School | 171 | 23.0% |
| High School | 301 | 40.5% |
| College / Undergraduate | 55 | 7.4% |
| Graduate / Professional | 7 | 0.9% |
| Total | 744 | 100.0% |
School Enrollment by Age by Funding Source in Hamilton
Out of a total of 744 students who are enrolled in schools in Hamilton, 13 (1.7%) attend a private institution, while the remaining 731 (98.3%) are enrolled in public schools. The age group of 3 to 4 year olds has the highest likelihood of being enrolled in private schools, with 13 (25.5% in the age bracket) enrolled. Conversely, the age group of 5 to 9 year old has the lowest likelihood of being enrolled in a private school, with 126 (100.0% in the age bracket) attending a public institution.
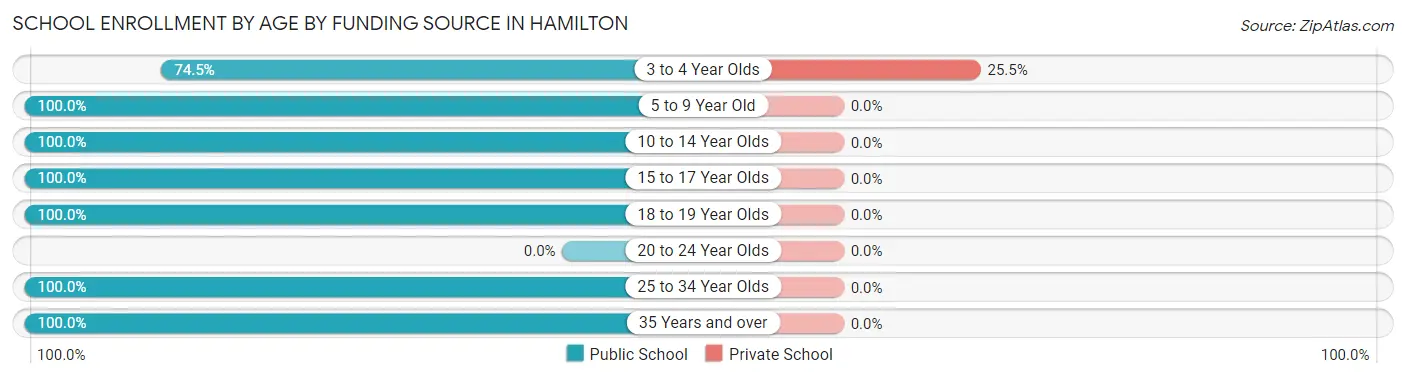
| Age Bracket | Public School | Private School |
| 3 to 4 Year Olds | 38 (74.5%) | 13 (25.5%) |
| 5 to 9 Year Old | 126 (100.0%) | 0 (0.0%) |
| 10 to 14 Year Olds | 209 (100.0%) | 0 (0.0%) |
| 15 to 17 Year Olds | 109 (100.0%) | 0 (0.0%) |
| 18 to 19 Year Olds | 218 (100.0%) | 0 (0.0%) |
| 20 to 24 Year Olds | 0 (0.0%) | 0 (0.0%) |
| 25 to 34 Year Olds | 12 (100.0%) | 0 (0.0%) |
| 35 Years and over | 19 (100.0%) | 0 (0.0%) |
| Total | 731 (98.3%) | 13 (1.7%) |
Educational Attainment by Field of Study in Hamilton
Education (98 | 34.6%), arts & humanities (49 | 17.3%), bio, nature & agricultural (41 | 14.5%), literature & languages (26 | 9.2%), and liberal arts & history (22 | 7.8%) are the most common fields of study among 283 individuals in Hamilton who have obtained a bachelor's degree or higher.
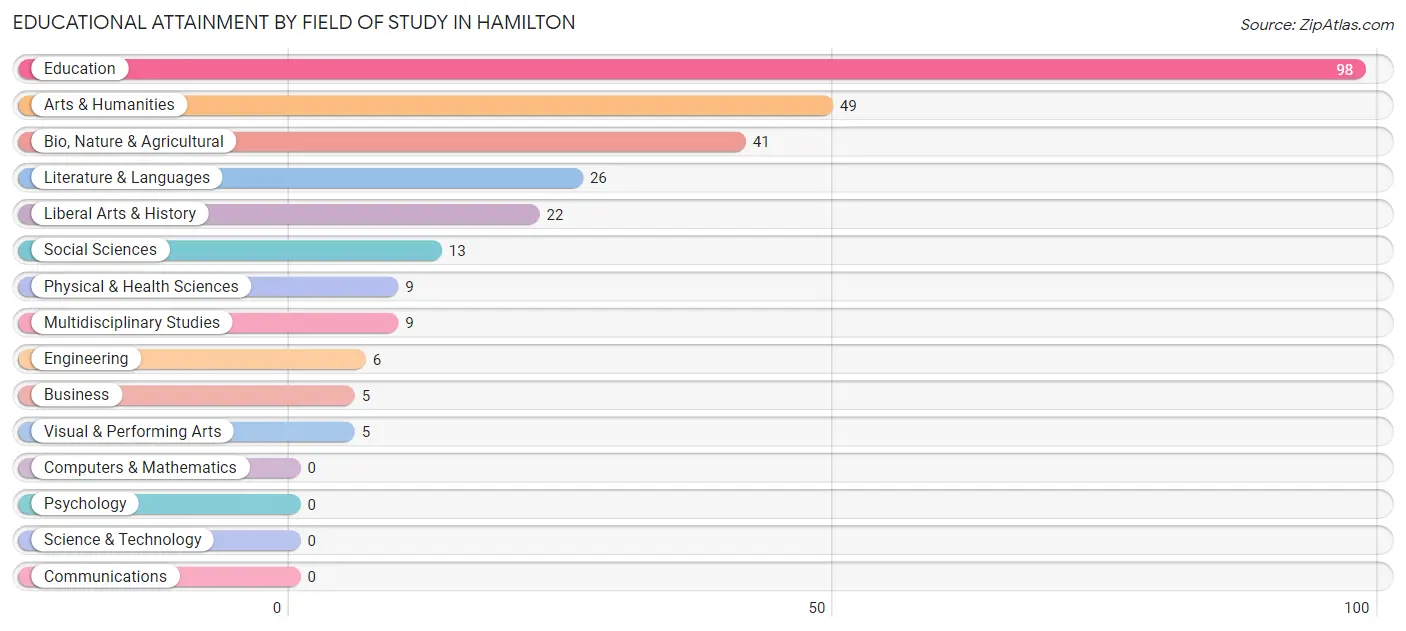
| Field of Study | # Graduates | % Graduates |
| Computers & Mathematics | 0 | 0.0% |
| Bio, Nature & Agricultural | 41 | 14.5% |
| Physical & Health Sciences | 9 | 3.2% |
| Psychology | 0 | 0.0% |
| Social Sciences | 13 | 4.6% |
| Engineering | 6 | 2.1% |
| Multidisciplinary Studies | 9 | 3.2% |
| Science & Technology | 0 | 0.0% |
| Business | 5 | 1.8% |
| Education | 98 | 34.6% |
| Literature & Languages | 26 | 9.2% |
| Liberal Arts & History | 22 | 7.8% |
| Visual & Performing Arts | 5 | 1.8% |
| Communications | 0 | 0.0% |
| Arts & Humanities | 49 | 17.3% |
| Total | 283 | 100.0% |
Transportation & Commute in Hamilton
Vehicle Availability by Sex in Hamilton
The most prevalent vehicle ownership categories in Hamilton are males with 2 vehicles (235, accounting for 40.7%) and females with 2 vehicles (448, making up 31.4%).
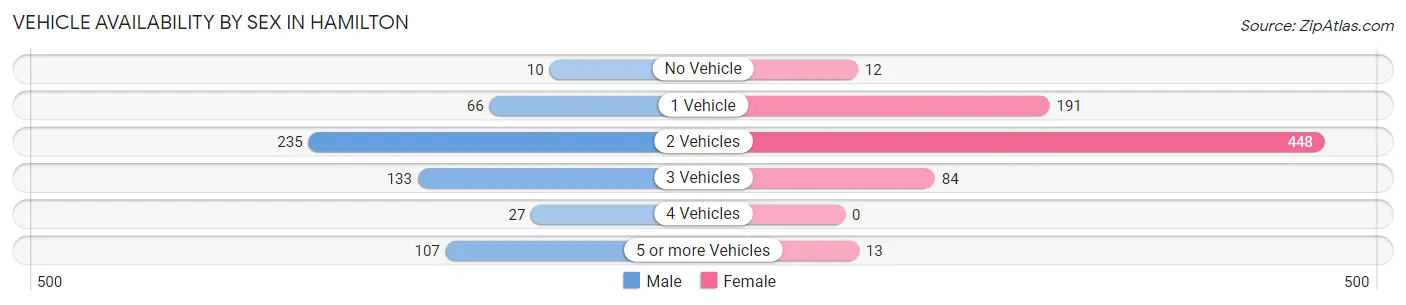
| Vehicles Available | Male | Female |
| No Vehicle | 10 (1.7%) | 12 (1.6%) |
| 1 Vehicle | 66 (11.4%) | 191 (25.5%) |
| 2 Vehicles | 235 (40.7%) | 448 (59.9%) |
| 3 Vehicles | 133 (23.0%) | 84 (11.2%) |
| 4 Vehicles | 27 (4.7%) | 0 (0.0%) |
| 5 or more Vehicles | 107 (18.5%) | 13 (1.7%) |
| Total | 578 (100.0%) | 748 (100.0%) |
Commute Time in Hamilton
The most frequently occuring commute durations in Hamilton are 5 to 9 minutes (769 commuters, 59.5%), 30 to 34 minutes (145 commuters, 11.2%), and less than 5 minutes (123 commuters, 9.5%).
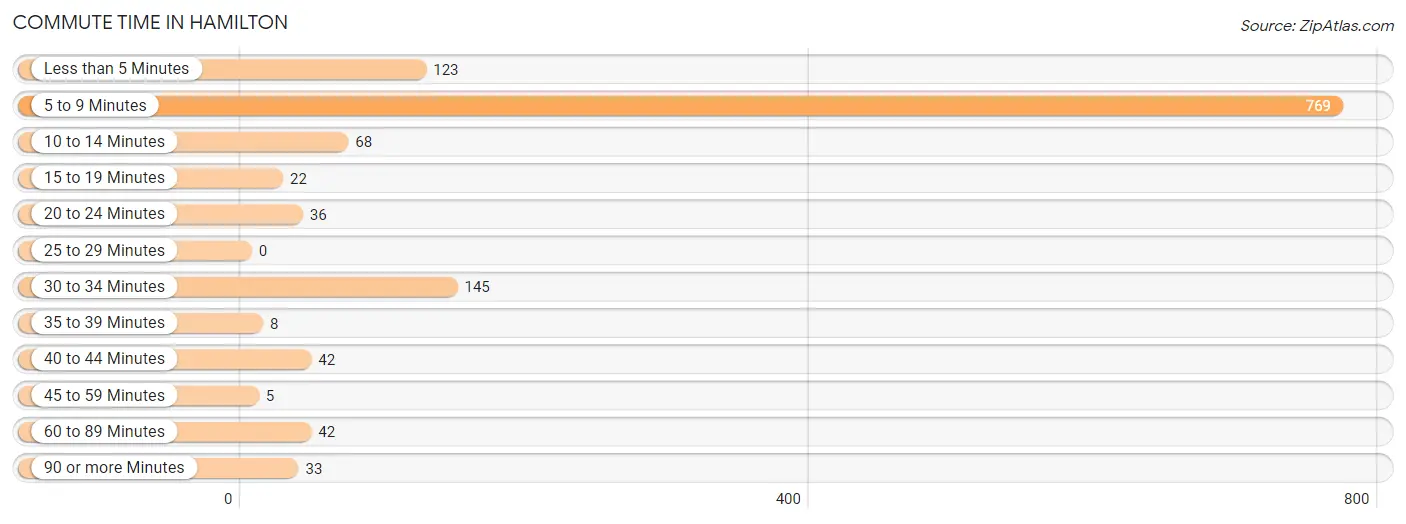
| Commute Time | # Commuters | % Commuters |
| Less than 5 Minutes | 123 | 9.5% |
| 5 to 9 Minutes | 769 | 59.5% |
| 10 to 14 Minutes | 68 | 5.3% |
| 15 to 19 Minutes | 22 | 1.7% |
| 20 to 24 Minutes | 36 | 2.8% |
| 25 to 29 Minutes | 0 | 0.0% |
| 30 to 34 Minutes | 145 | 11.2% |
| 35 to 39 Minutes | 8 | 0.6% |
| 40 to 44 Minutes | 42 | 3.3% |
| 45 to 59 Minutes | 5 | 0.4% |
| 60 to 89 Minutes | 42 | 3.3% |
| 90 or more Minutes | 33 | 2.5% |
Commute Time by Sex in Hamilton
The most common commute times in Hamilton are 5 to 9 minutes (259 commuters, 44.8%) for males and 5 to 9 minutes (510 commuters, 71.3%) for females.
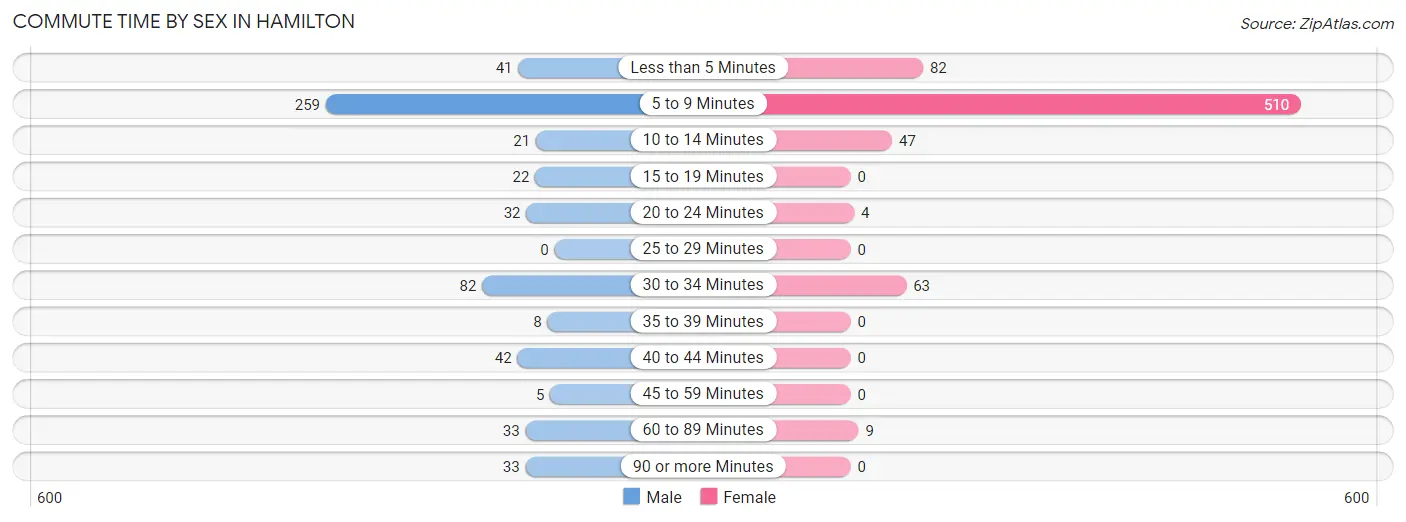
| Commute Time | Male | Female |
| Less than 5 Minutes | 41 (7.1%) | 82 (11.5%) |
| 5 to 9 Minutes | 259 (44.8%) | 510 (71.3%) |
| 10 to 14 Minutes | 21 (3.6%) | 47 (6.6%) |
| 15 to 19 Minutes | 22 (3.8%) | 0 (0.0%) |
| 20 to 24 Minutes | 32 (5.5%) | 4 (0.6%) |
| 25 to 29 Minutes | 0 (0.0%) | 0 (0.0%) |
| 30 to 34 Minutes | 82 (14.2%) | 63 (8.8%) |
| 35 to 39 Minutes | 8 (1.4%) | 0 (0.0%) |
| 40 to 44 Minutes | 42 (7.3%) | 0 (0.0%) |
| 45 to 59 Minutes | 5 (0.9%) | 0 (0.0%) |
| 60 to 89 Minutes | 33 (5.7%) | 9 (1.3%) |
| 90 or more Minutes | 33 (5.7%) | 0 (0.0%) |
Time of Departure to Work by Sex in Hamilton
The most frequent times of departure to work in Hamilton are 6:30 AM to 6:59 AM (124, 21.4%) for males and 7:00 AM to 7:29 AM (161, 22.5%) for females.
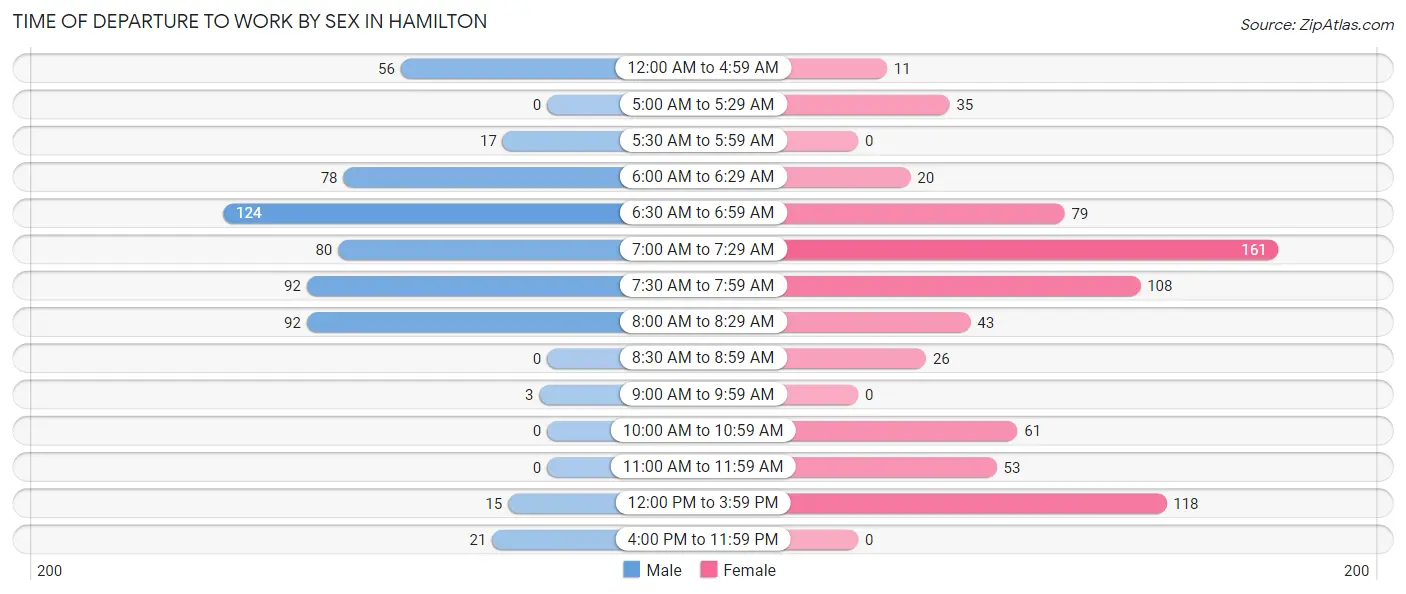
| Time of Departure | Male | Female |
| 12:00 AM to 4:59 AM | 56 (9.7%) | 11 (1.5%) |
| 5:00 AM to 5:29 AM | 0 (0.0%) | 35 (4.9%) |
| 5:30 AM to 5:59 AM | 17 (2.9%) | 0 (0.0%) |
| 6:00 AM to 6:29 AM | 78 (13.5%) | 20 (2.8%) |
| 6:30 AM to 6:59 AM | 124 (21.4%) | 79 (11.1%) |
| 7:00 AM to 7:29 AM | 80 (13.8%) | 161 (22.5%) |
| 7:30 AM to 7:59 AM | 92 (15.9%) | 108 (15.1%) |
| 8:00 AM to 8:29 AM | 92 (15.9%) | 43 (6.0%) |
| 8:30 AM to 8:59 AM | 0 (0.0%) | 26 (3.6%) |
| 9:00 AM to 9:59 AM | 3 (0.5%) | 0 (0.0%) |
| 10:00 AM to 10:59 AM | 0 (0.0%) | 61 (8.5%) |
| 11:00 AM to 11:59 AM | 0 (0.0%) | 53 (7.4%) |
| 12:00 PM to 3:59 PM | 15 (2.6%) | 118 (16.5%) |
| 4:00 PM to 11:59 PM | 21 (3.6%) | 0 (0.0%) |
| Total | 578 (100.0%) | 715 (100.0%) |
Housing Occupancy in Hamilton
Occupancy by Ownership in Hamilton
Of the total 1,050 dwellings in Hamilton, owner-occupied units account for 837 (79.7%), while renter-occupied units make up 213 (20.3%).
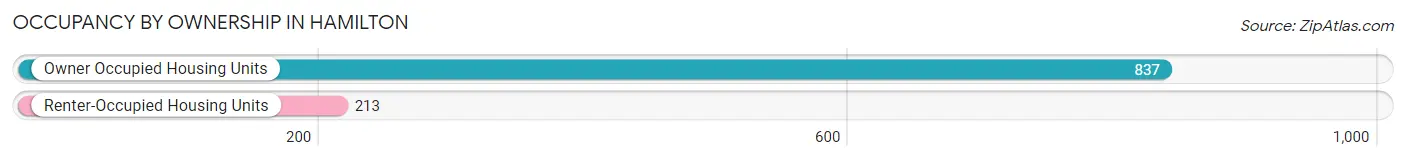
| Occupancy | # Housing Units | % Housing Units |
| Owner Occupied Housing Units | 837 | 79.7% |
| Renter-Occupied Housing Units | 213 | 20.3% |
| Total Occupied Housing Units | 1,050 | 100.0% |
Occupancy by Household Size in Hamilton
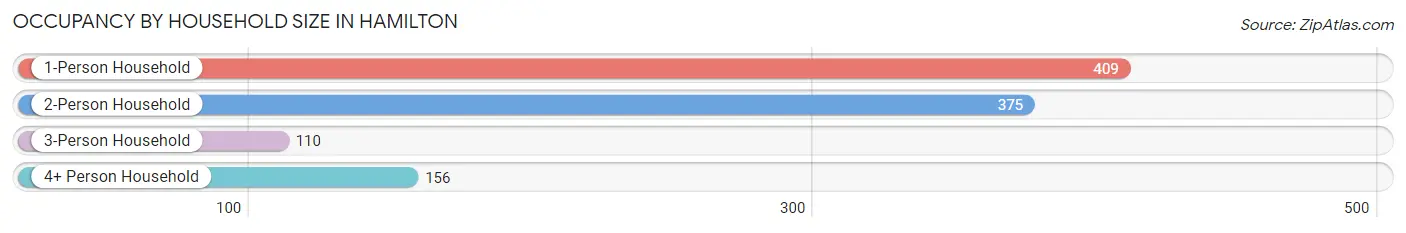
| Household Size | # Housing Units | % Housing Units |
| 1-Person Household | 409 | 39.0% |
| 2-Person Household | 375 | 35.7% |
| 3-Person Household | 110 | 10.5% |
| 4+ Person Household | 156 | 14.9% |
| Total Housing Units | 1,050 | 100.0% |
Occupancy by Ownership by Household Size in Hamilton
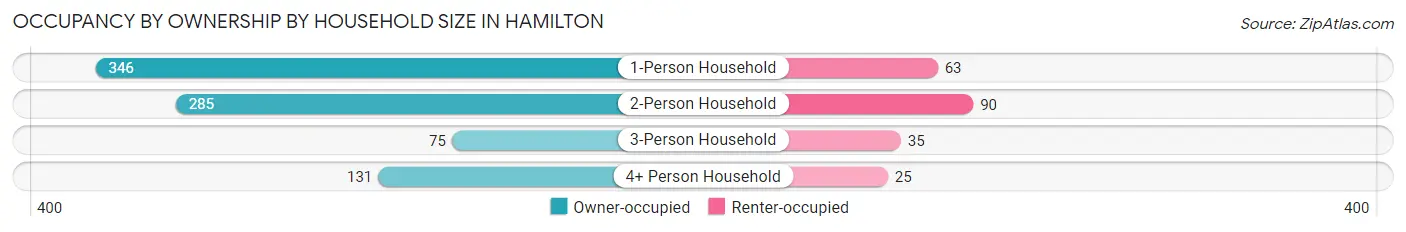
| Household Size | Owner-occupied | Renter-occupied |
| 1-Person Household | 346 (84.6%) | 63 (15.4%) |
| 2-Person Household | 285 (76.0%) | 90 (24.0%) |
| 3-Person Household | 75 (68.2%) | 35 (31.8%) |
| 4+ Person Household | 131 (84.0%) | 25 (16.0%) |
| Total Housing Units | 837 (79.7%) | 213 (20.3%) |
Occupancy by Educational Attainment in Hamilton
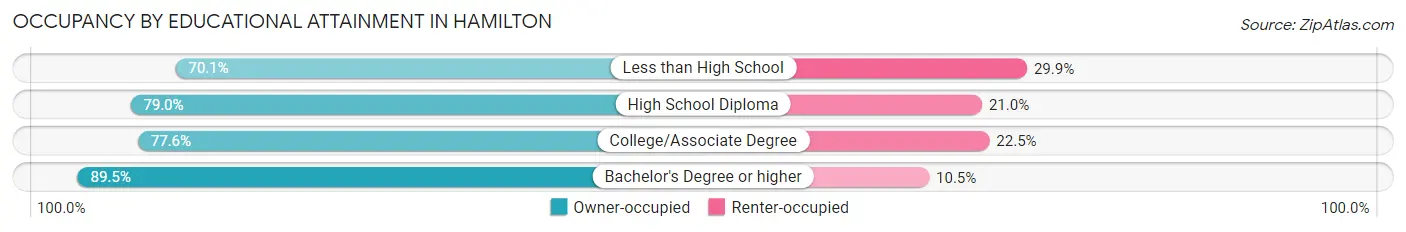
| Household Size | Owner-occupied | Renter-occupied |
| Less than High School | 68 (70.1%) | 29 (29.9%) |
| High School Diploma | 324 (79.0%) | 86 (21.0%) |
| College/Associate Degree | 266 (77.5%) | 77 (22.5%) |
| Bachelor's Degree or higher | 179 (89.5%) | 21 (10.5%) |
Occupancy by Age of Householder in Hamilton
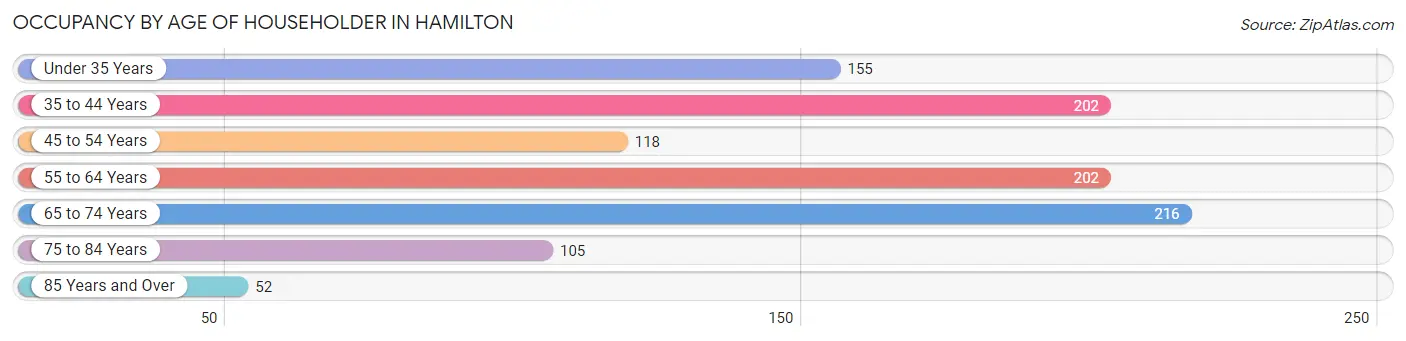
| Age Bracket | # Households | % Households |
| Under 35 Years | 155 | 14.8% |
| 35 to 44 Years | 202 | 19.2% |
| 45 to 54 Years | 118 | 11.2% |
| 55 to 64 Years | 202 | 19.2% |
| 65 to 74 Years | 216 | 20.6% |
| 75 to 84 Years | 105 | 10.0% |
| 85 Years and Over | 52 | 5.0% |
| Total | 1,050 | 100.0% |
Housing Finances in Hamilton
Median Income by Occupancy in Hamilton
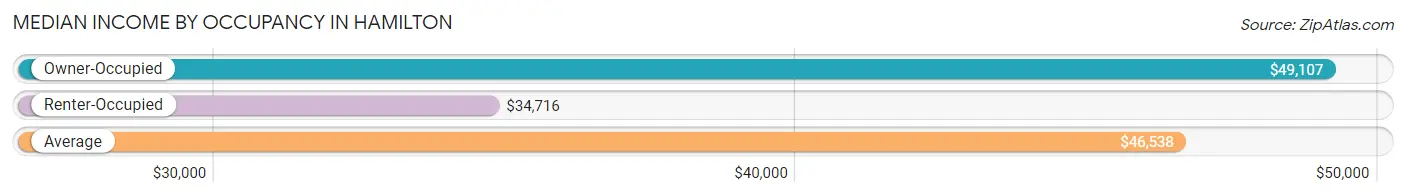
| Occupancy Type | # Households | Median Income |
| Owner-Occupied | 837 (79.7%) | $49,107 |
| Renter-Occupied | 213 (20.3%) | $34,716 |
| Average | 1,050 (100.0%) | $46,538 |
Occupancy by Householder Income Bracket in Hamilton
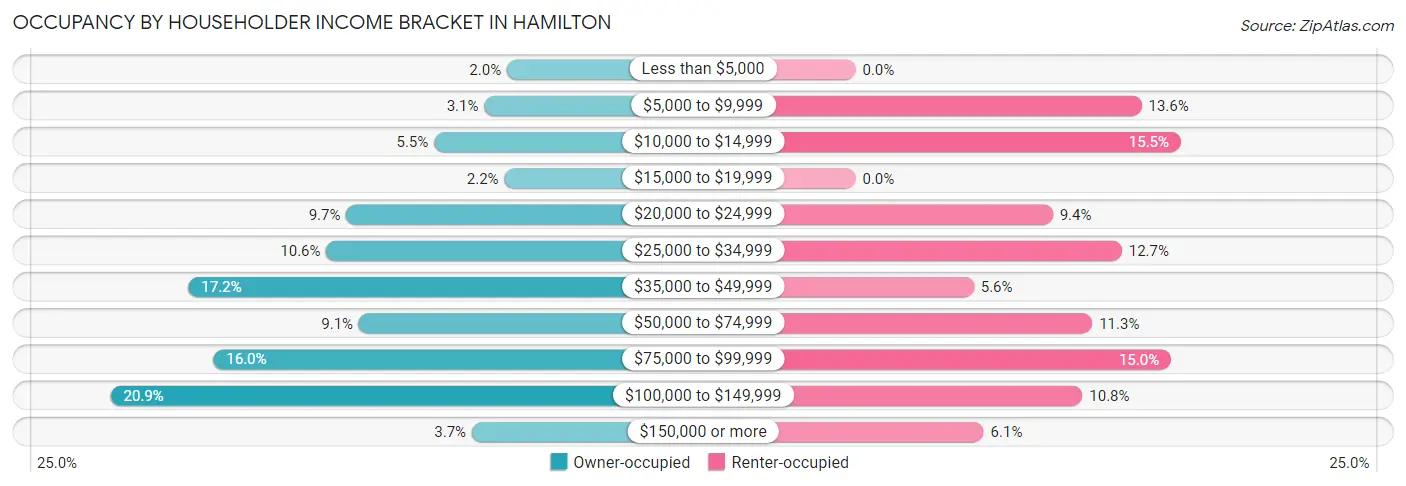
| Income Bracket | Owner-occupied | Renter-occupied |
| Less than $5,000 | 17 (2.0%) | 0 (0.0%) |
| $5,000 to $9,999 | 26 (3.1%) | 29 (13.6%) |
| $10,000 to $14,999 | 46 (5.5%) | 33 (15.5%) |
| $15,000 to $19,999 | 18 (2.1%) | 0 (0.0%) |
| $20,000 to $24,999 | 81 (9.7%) | 20 (9.4%) |
| $25,000 to $34,999 | 89 (10.6%) | 27 (12.7%) |
| $35,000 to $49,999 | 144 (17.2%) | 12 (5.6%) |
| $50,000 to $74,999 | 76 (9.1%) | 24 (11.3%) |
| $75,000 to $99,999 | 134 (16.0%) | 32 (15.0%) |
| $100,000 to $149,999 | 175 (20.9%) | 23 (10.8%) |
| $150,000 or more | 31 (3.7%) | 13 (6.1%) |
| Total | 837 (100.0%) | 213 (100.0%) |
Monthly Housing Cost Tiers in Hamilton
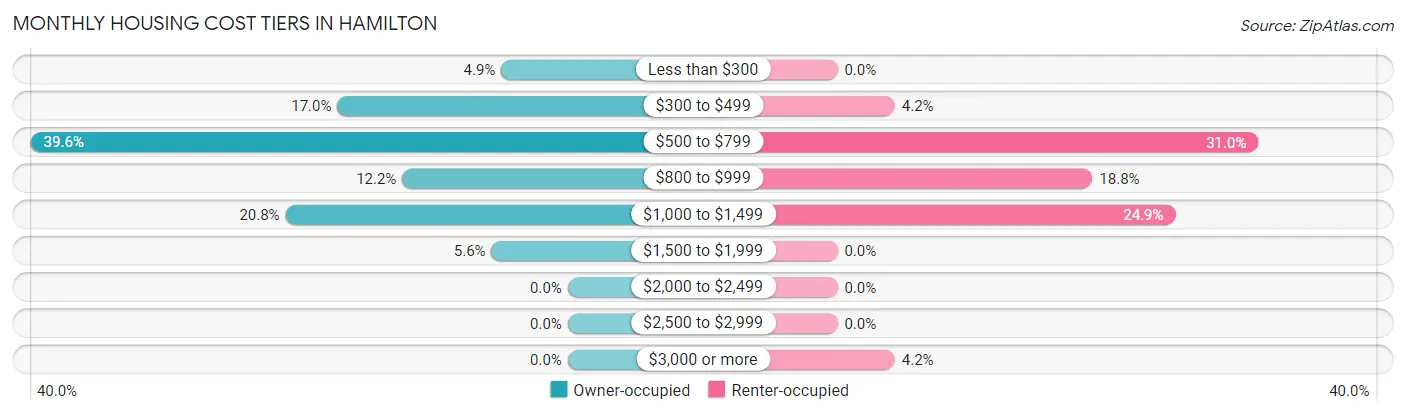
| Monthly Cost | Owner-occupied | Renter-occupied |
| Less than $300 | 41 (4.9%) | 0 (0.0%) |
| $300 to $499 | 142 (17.0%) | 9 (4.2%) |
| $500 to $799 | 331 (39.6%) | 66 (31.0%) |
| $800 to $999 | 102 (12.2%) | 40 (18.8%) |
| $1,000 to $1,499 | 174 (20.8%) | 53 (24.9%) |
| $1,500 to $1,999 | 47 (5.6%) | 0 (0.0%) |
| $2,000 to $2,499 | 0 (0.0%) | 0 (0.0%) |
| $2,500 to $2,999 | 0 (0.0%) | 0 (0.0%) |
| $3,000 or more | 0 (0.0%) | 9 (4.2%) |
| Total | 837 (100.0%) | 213 (100.0%) |
Physical Housing Characteristics in Hamilton
Housing Structures in Hamilton
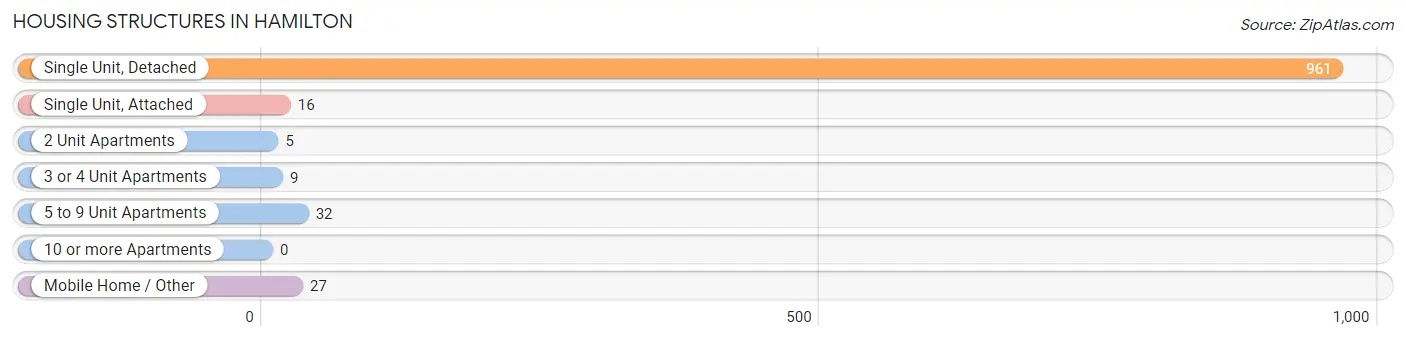
| Structure Type | # Housing Units | % Housing Units |
| Single Unit, Detached | 961 | 91.5% |
| Single Unit, Attached | 16 | 1.5% |
| 2 Unit Apartments | 5 | 0.5% |
| 3 or 4 Unit Apartments | 9 | 0.9% |
| 5 to 9 Unit Apartments | 32 | 3.0% |
| 10 or more Apartments | 0 | 0.0% |
| Mobile Home / Other | 27 | 2.6% |
| Total | 1,050 | 100.0% |
Housing Structures by Occupancy in Hamilton
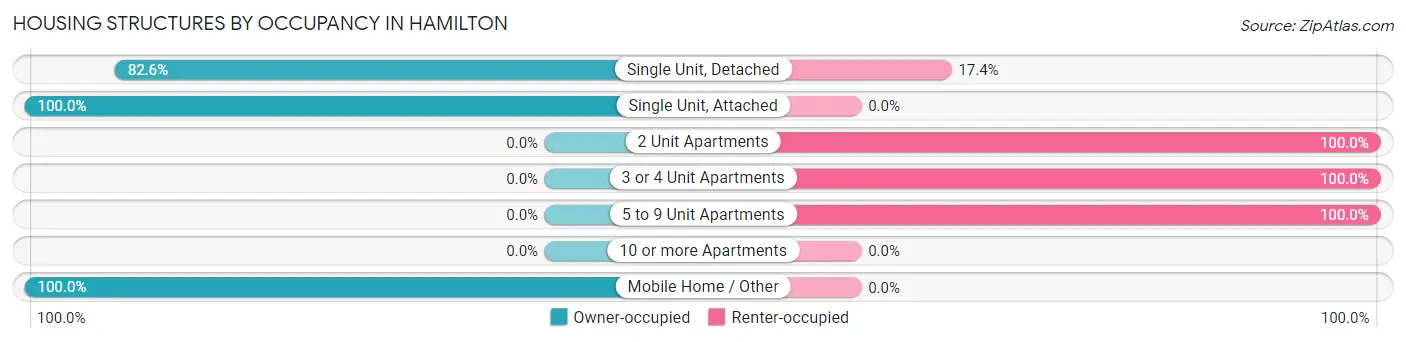
| Structure Type | Owner-occupied | Renter-occupied |
| Single Unit, Detached | 794 (82.6%) | 167 (17.4%) |
| Single Unit, Attached | 16 (100.0%) | 0 (0.0%) |
| 2 Unit Apartments | 0 (0.0%) | 5 (100.0%) |
| 3 or 4 Unit Apartments | 0 (0.0%) | 9 (100.0%) |
| 5 to 9 Unit Apartments | 0 (0.0%) | 32 (100.0%) |
| 10 or more Apartments | 0 (0.0%) | 0 (0.0%) |
| Mobile Home / Other | 27 (100.0%) | 0 (0.0%) |
| Total | 837 (79.7%) | 213 (20.3%) |
Housing Structures by Number of Rooms in Hamilton
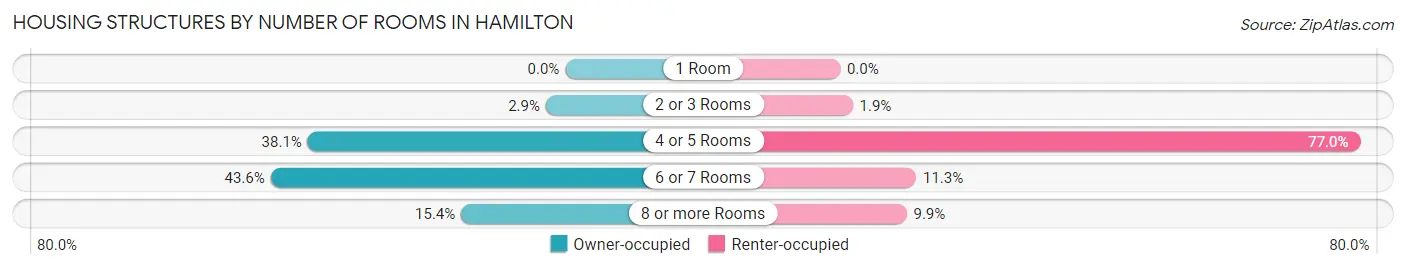
| Number of Rooms | Owner-occupied | Renter-occupied |
| 1 Room | 0 (0.0%) | 0 (0.0%) |
| 2 or 3 Rooms | 24 (2.9%) | 4 (1.9%) |
| 4 or 5 Rooms | 319 (38.1%) | 164 (77.0%) |
| 6 or 7 Rooms | 365 (43.6%) | 24 (11.3%) |
| 8 or more Rooms | 129 (15.4%) | 21 (9.9%) |
| Total | 837 (100.0%) | 213 (100.0%) |
Housing Structure by Heating Type in Hamilton
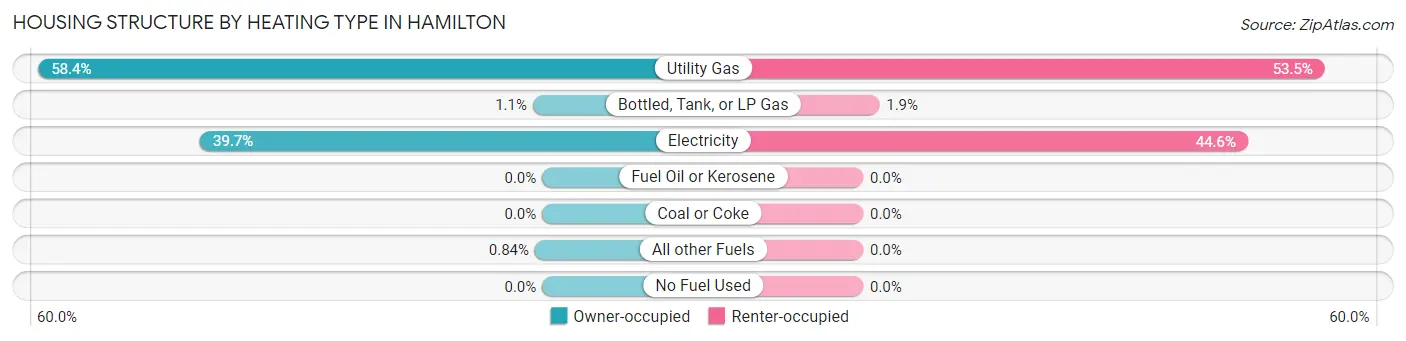
| Heating Type | Owner-occupied | Renter-occupied |
| Utility Gas | 489 (58.4%) | 114 (53.5%) |
| Bottled, Tank, or LP Gas | 9 (1.1%) | 4 (1.9%) |
| Electricity | 332 (39.7%) | 95 (44.6%) |
| Fuel Oil or Kerosene | 0 (0.0%) | 0 (0.0%) |
| Coal or Coke | 0 (0.0%) | 0 (0.0%) |
| All other Fuels | 7 (0.8%) | 0 (0.0%) |
| No Fuel Used | 0 (0.0%) | 0 (0.0%) |
| Total | 837 (100.0%) | 213 (100.0%) |
Household Vehicle Usage in Hamilton
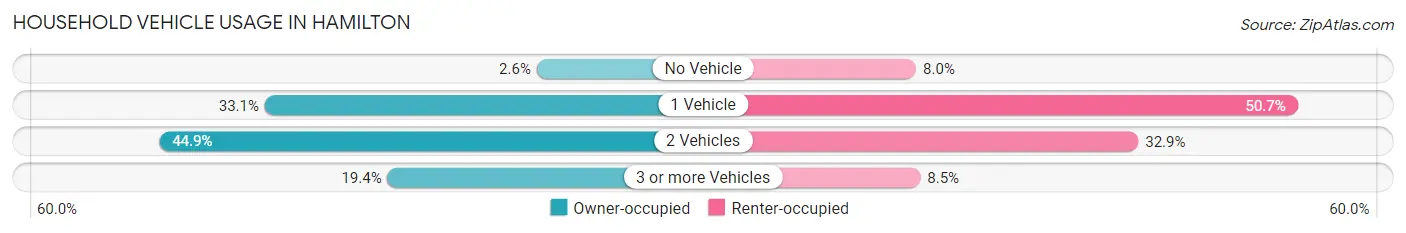
| Vehicles per Household | Owner-occupied | Renter-occupied |
| No Vehicle | 22 (2.6%) | 17 (8.0%) |
| 1 Vehicle | 277 (33.1%) | 108 (50.7%) |
| 2 Vehicles | 376 (44.9%) | 70 (32.9%) |
| 3 or more Vehicles | 162 (19.4%) | 18 (8.5%) |
| Total | 837 (100.0%) | 213 (100.0%) |
Real Estate & Mortgages in Hamilton
Real Estate and Mortgage Overview in Hamilton
| Characteristic | Without Mortgage | With Mortgage |
| Housing Units | 473 | 364 |
| Median Property Value | $101,400 | $100,900 |
| Median Household Income | $36,809 | $31 |
| Monthly Housing Costs | $556 | $0 |
| Real Estate Taxes | $1,509 | $8 |
Property Value by Mortgage Status in Hamilton
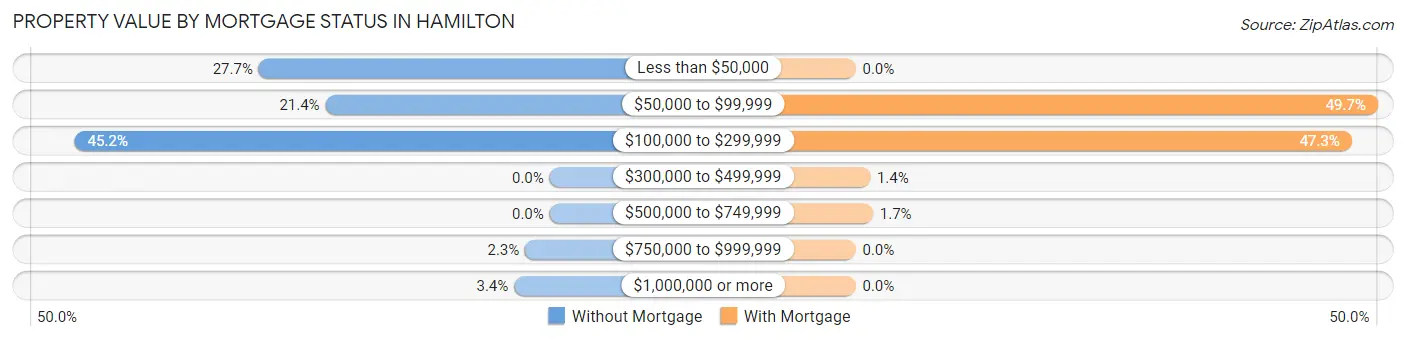
| Property Value | Without Mortgage | With Mortgage |
| Less than $50,000 | 131 (27.7%) | 0 (0.0%) |
| $50,000 to $99,999 | 101 (21.3%) | 181 (49.7%) |
| $100,000 to $299,999 | 214 (45.2%) | 172 (47.2%) |
| $300,000 to $499,999 | 0 (0.0%) | 5 (1.4%) |
| $500,000 to $749,999 | 0 (0.0%) | 6 (1.7%) |
| $750,000 to $999,999 | 11 (2.3%) | 0 (0.0%) |
| $1,000,000 or more | 16 (3.4%) | 0 (0.0%) |
| Total | 473 (100.0%) | 364 (100.0%) |
Household Income by Mortgage Status in Hamilton
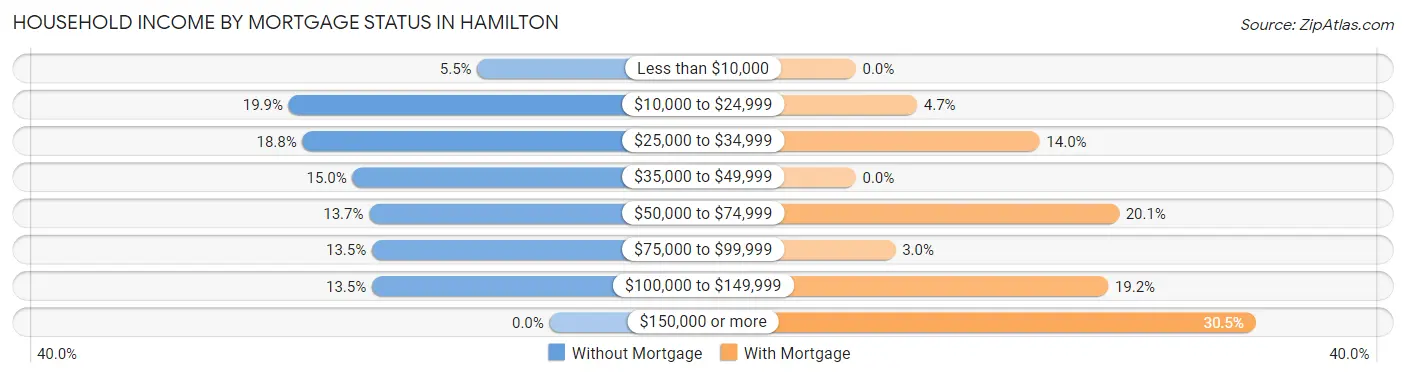
| Household Income | Without Mortgage | With Mortgage |
| Less than $10,000 | 26 (5.5%) | 0 (0.0%) |
| $10,000 to $24,999 | 94 (19.9%) | 17 (4.7%) |
| $25,000 to $34,999 | 89 (18.8%) | 51 (14.0%) |
| $35,000 to $49,999 | 71 (15.0%) | 0 (0.0%) |
| $50,000 to $74,999 | 65 (13.7%) | 73 (20.1%) |
| $75,000 to $99,999 | 64 (13.5%) | 11 (3.0%) |
| $100,000 to $149,999 | 64 (13.5%) | 70 (19.2%) |
| $150,000 or more | 0 (0.0%) | 111 (30.5%) |
| Total | 473 (100.0%) | 364 (100.0%) |
Property Value to Household Income Ratio in Hamilton
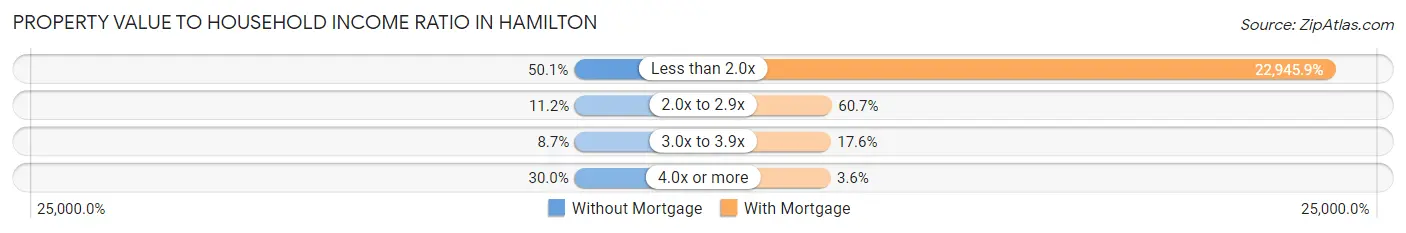
| Value-to-Income Ratio | Without Mortgage | With Mortgage |
| Less than 2.0x | 237 (50.1%) | 83,523 (22,945.9%) |
| 2.0x to 2.9x | 53 (11.2%) | 221 (60.7%) |
| 3.0x to 3.9x | 41 (8.7%) | 64 (17.6%) |
| 4.0x or more | 142 (30.0%) | 13 (3.6%) |
| Total | 473 (100.0%) | 364 (100.0%) |
Real Estate Taxes by Mortgage Status in Hamilton
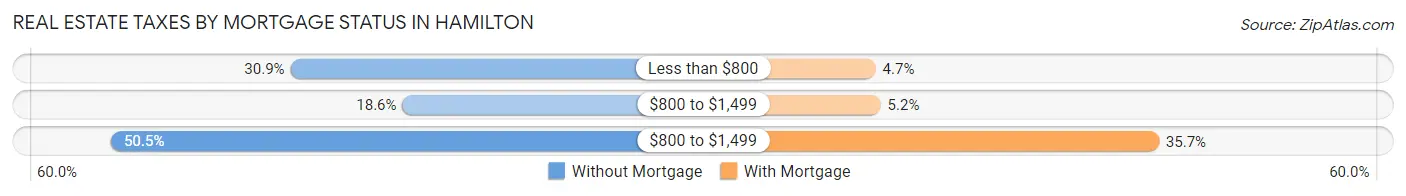
| Property Taxes | Without Mortgage | With Mortgage |
| Less than $800 | 146 (30.9%) | 17 (4.7%) |
| $800 to $1,499 | 88 (18.6%) | 19 (5.2%) |
| $800 to $1,499 | 239 (50.5%) | 130 (35.7%) |
| Total | 473 (100.0%) | 364 (100.0%) |
Health & Disability in Hamilton
Health Insurance Coverage by Age in Hamilton
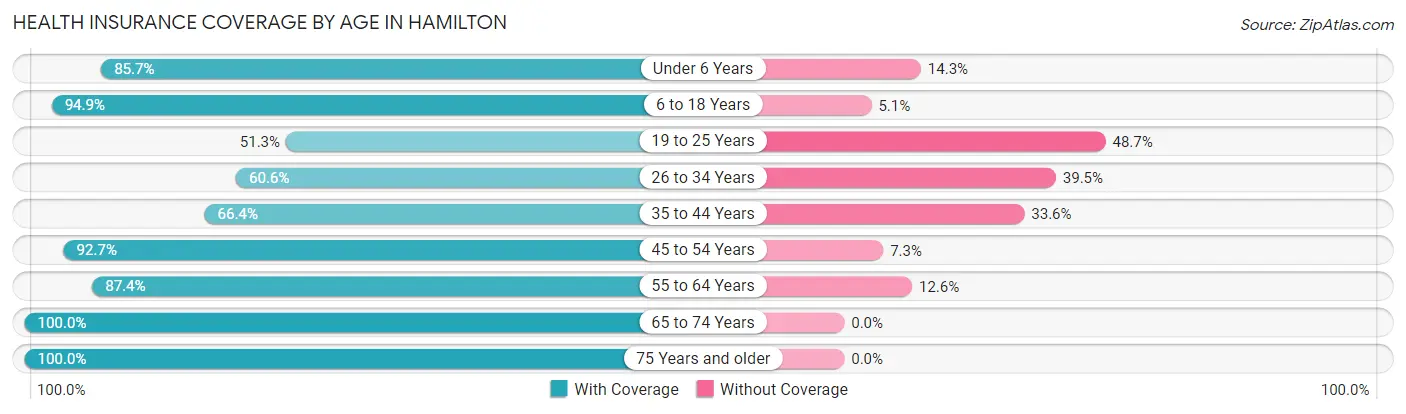
| Age Bracket | With Coverage | Without Coverage |
| Under 6 Years | 90 (85.7%) | 15 (14.3%) |
| 6 to 18 Years | 638 (94.9%) | 34 (5.1%) |
| 19 to 25 Years | 100 (51.3%) | 95 (48.7%) |
| 26 to 34 Years | 132 (60.6%) | 86 (39.5%) |
| 35 to 44 Years | 273 (66.4%) | 138 (33.6%) |
| 45 to 54 Years | 230 (92.7%) | 18 (7.3%) |
| 55 to 64 Years | 332 (87.4%) | 48 (12.6%) |
| 65 to 74 Years | 308 (100.0%) | 0 (0.0%) |
| 75 Years and older | 203 (100.0%) | 0 (0.0%) |
| Total | 2,306 (84.2%) | 434 (15.8%) |
Health Insurance Coverage by Citizenship Status in Hamilton
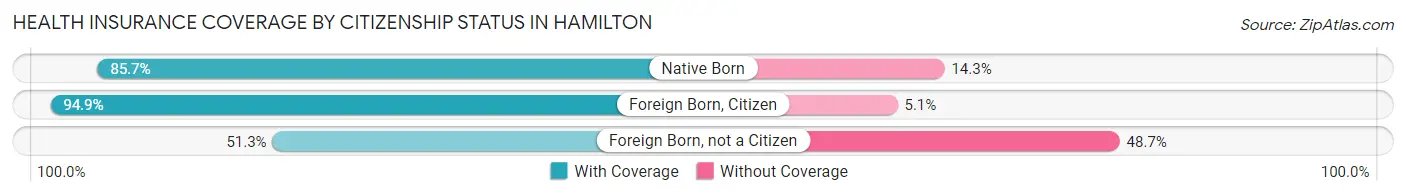
| Citizenship Status | With Coverage | Without Coverage |
| Native Born | 90 (85.7%) | 15 (14.3%) |
| Foreign Born, Citizen | 638 (94.9%) | 34 (5.1%) |
| Foreign Born, not a Citizen | 100 (51.3%) | 95 (48.7%) |
Health Insurance Coverage by Household Income in Hamilton
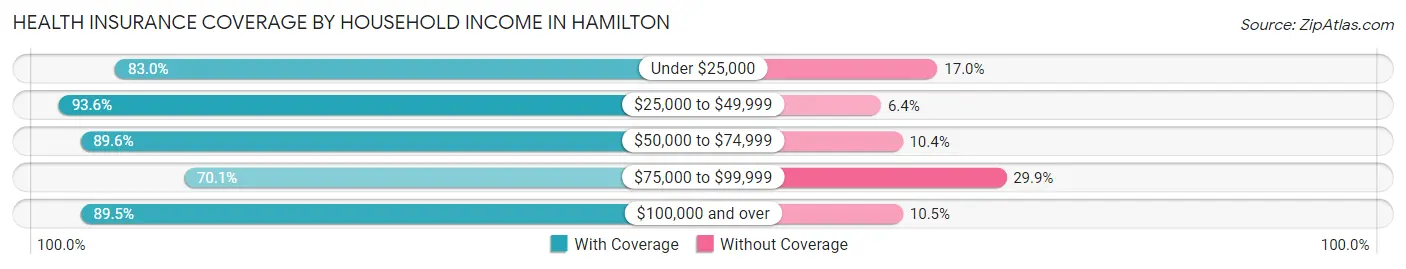
| Household Income | With Coverage | Without Coverage |
| Under $25,000 | 362 (83.0%) | 74 (17.0%) |
| $25,000 to $49,999 | 439 (93.6%) | 30 (6.4%) |
| $50,000 to $74,999 | 146 (89.6%) | 17 (10.4%) |
| $75,000 to $99,999 | 498 (70.1%) | 212 (29.9%) |
| $100,000 and over | 861 (89.5%) | 101 (10.5%) |
Public vs Private Health Insurance Coverage by Age in Hamilton
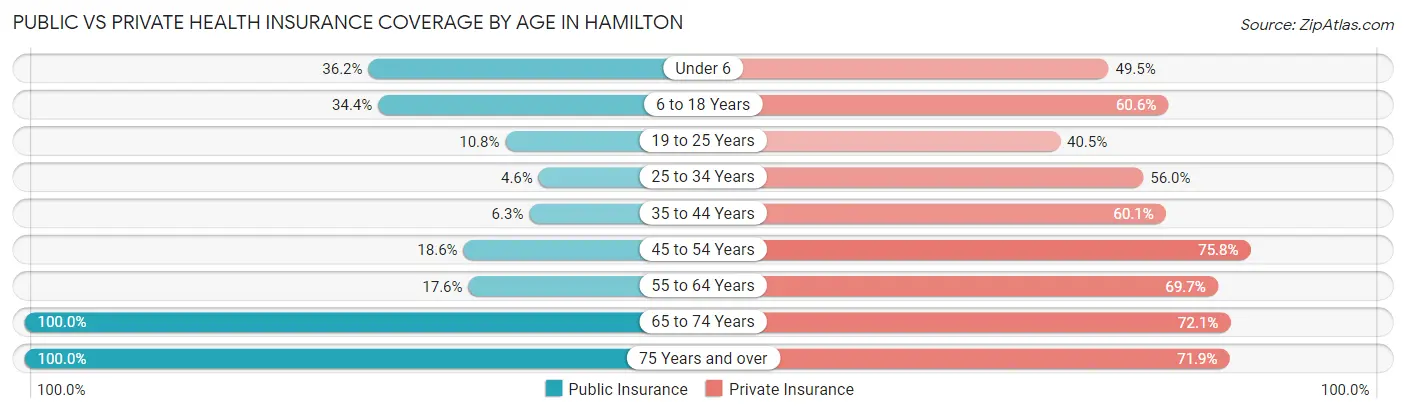
| Age Bracket | Public Insurance | Private Insurance |
| Under 6 | 38 (36.2%) | 52 (49.5%) |
| 6 to 18 Years | 231 (34.4%) | 407 (60.6%) |
| 19 to 25 Years | 21 (10.8%) | 79 (40.5%) |
| 25 to 34 Years | 10 (4.6%) | 122 (56.0%) |
| 35 to 44 Years | 26 (6.3%) | 247 (60.1%) |
| 45 to 54 Years | 46 (18.5%) | 188 (75.8%) |
| 55 to 64 Years | 67 (17.6%) | 265 (69.7%) |
| 65 to 74 Years | 308 (100.0%) | 222 (72.1%) |
| 75 Years and over | 203 (100.0%) | 146 (71.9%) |
| Total | 950 (34.7%) | 1,728 (63.1%) |
Disability Status by Sex by Age in Hamilton
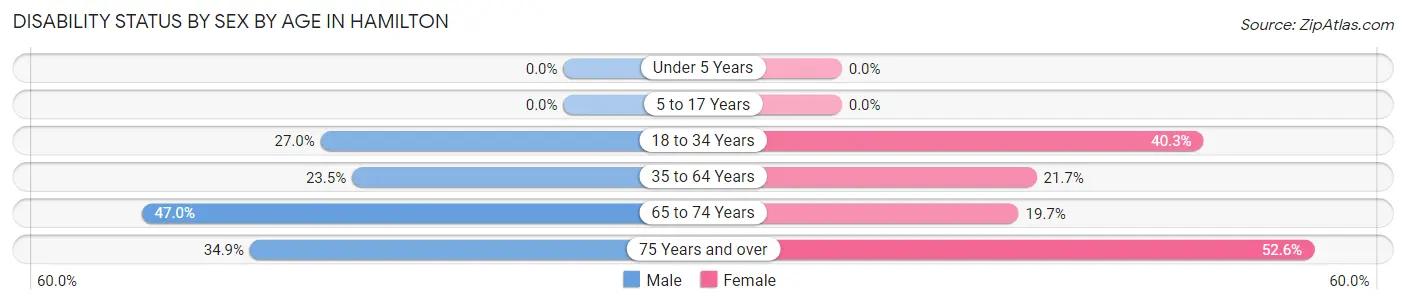
| Age Bracket | Male | Female |
| Under 5 Years | 0 (0.0%) | 0 (0.0%) |
| 5 to 17 Years | 0 (0.0%) | 0 (0.0%) |
| 18 to 34 Years | 83 (27.0%) | 118 (40.3%) |
| 35 to 64 Years | 97 (23.5%) | 136 (21.7%) |
| 65 to 74 Years | 85 (47.0%) | 25 (19.7%) |
| 75 Years and over | 37 (34.9%) | 51 (52.6%) |
Disability Class by Sex by Age in Hamilton
Disability Class: Hearing Difficulty
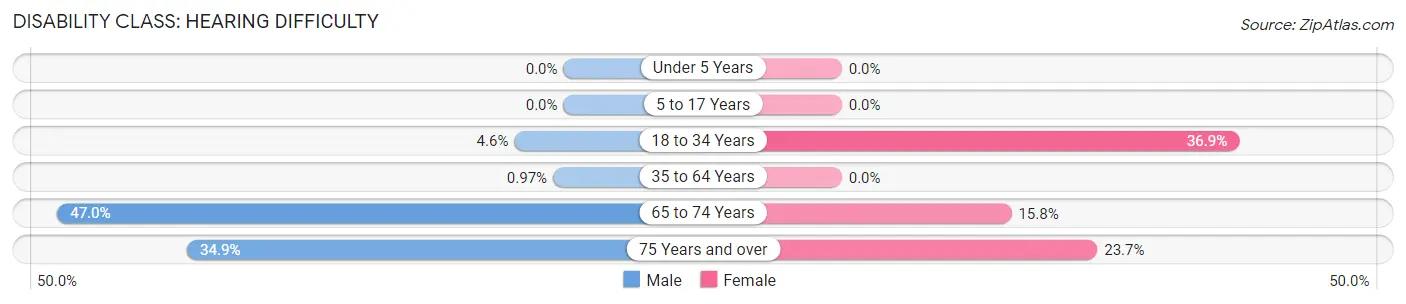
| Age Bracket | Male | Female |
| Under 5 Years | 0 (0.0%) | 0 (0.0%) |
| 5 to 17 Years | 0 (0.0%) | 0 (0.0%) |
| 18 to 34 Years | 14 (4.6%) | 108 (36.9%) |
| 35 to 64 Years | 4 (1.0%) | 0 (0.0%) |
| 65 to 74 Years | 85 (47.0%) | 20 (15.8%) |
| 75 Years and over | 37 (34.9%) | 23 (23.7%) |
Disability Class: Vision Difficulty
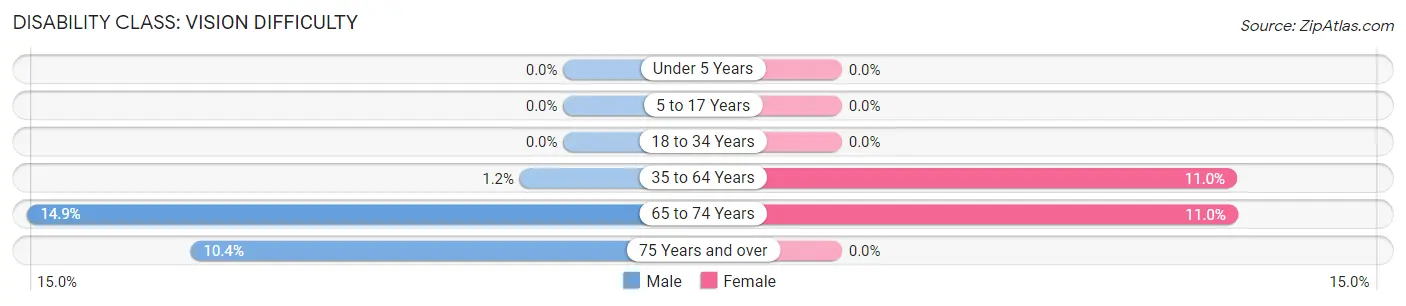
| Age Bracket | Male | Female |
| Under 5 Years | 0 (0.0%) | 0 (0.0%) |
| 5 to 17 Years | 0 (0.0%) | 0 (0.0%) |
| 18 to 34 Years | 0 (0.0%) | 0 (0.0%) |
| 35 to 64 Years | 5 (1.2%) | 69 (11.0%) |
| 65 to 74 Years | 27 (14.9%) | 14 (11.0%) |
| 75 Years and over | 11 (10.4%) | 0 (0.0%) |
Disability Class: Cognitive Difficulty
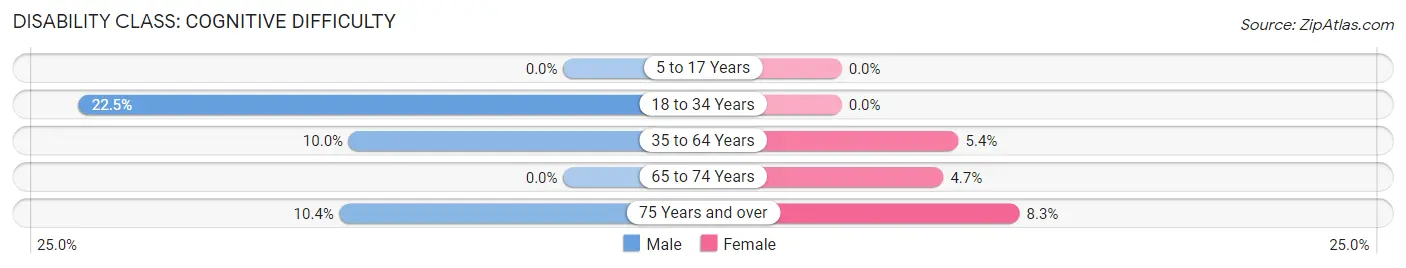
| Age Bracket | Male | Female |
| 5 to 17 Years | 0 (0.0%) | 0 (0.0%) |
| 18 to 34 Years | 69 (22.5%) | 0 (0.0%) |
| 35 to 64 Years | 41 (10.0%) | 34 (5.4%) |
| 65 to 74 Years | 0 (0.0%) | 6 (4.7%) |
| 75 Years and over | 11 (10.4%) | 8 (8.3%) |
Disability Class: Ambulatory Difficulty
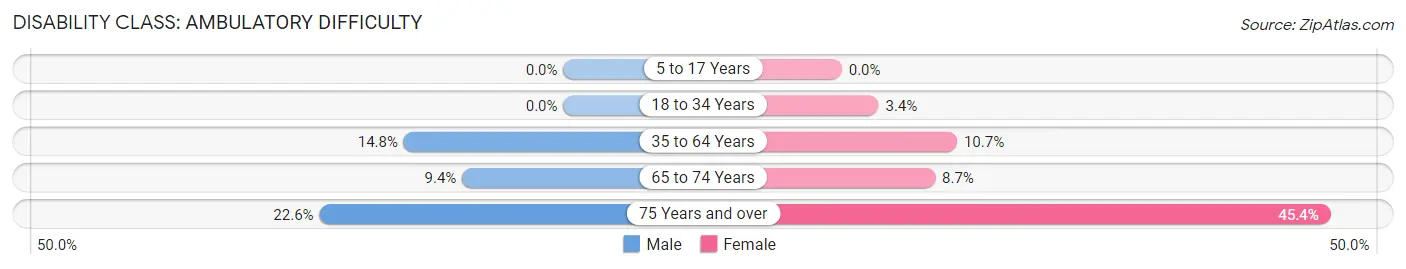
| Age Bracket | Male | Female |
| 5 to 17 Years | 0 (0.0%) | 0 (0.0%) |
| 18 to 34 Years | 0 (0.0%) | 10 (3.4%) |
| 35 to 64 Years | 61 (14.8%) | 67 (10.7%) |
| 65 to 74 Years | 17 (9.4%) | 11 (8.7%) |
| 75 Years and over | 24 (22.6%) | 44 (45.4%) |
Disability Class: Self-Care Difficulty
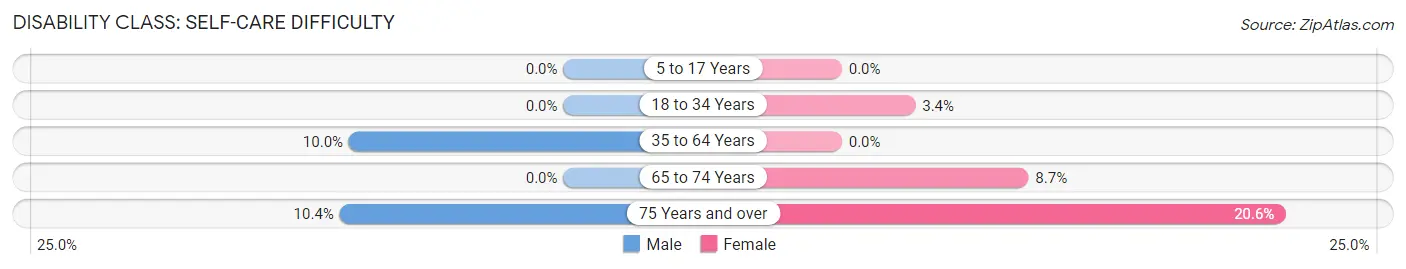
| Age Bracket | Male | Female |
| 5 to 17 Years | 0 (0.0%) | 0 (0.0%) |
| 18 to 34 Years | 0 (0.0%) | 10 (3.4%) |
| 35 to 64 Years | 41 (10.0%) | 0 (0.0%) |
| 65 to 74 Years | 0 (0.0%) | 11 (8.7%) |
| 75 Years and over | 11 (10.4%) | 20 (20.6%) |
Technology Access in Hamilton
Computing Device Access in Hamilton
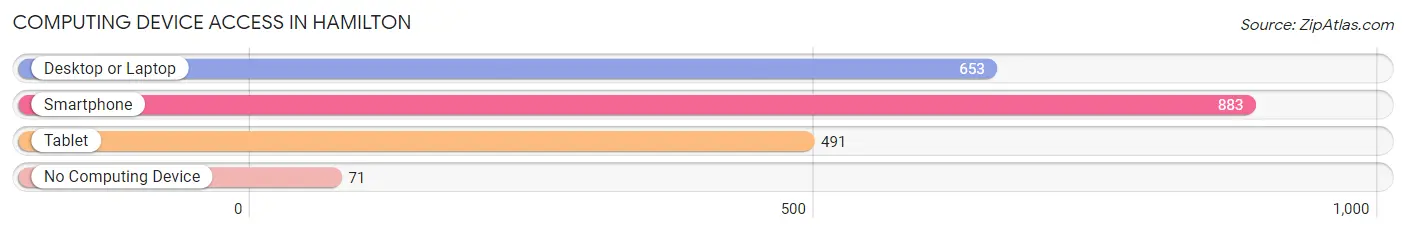
| Device Type | # Households | % Households |
| Desktop or Laptop | 653 | 62.2% |
| Smartphone | 883 | 84.1% |
| Tablet | 491 | 46.8% |
| No Computing Device | 71 | 6.8% |
| Total | 1,050 | 100.0% |
Internet Access in Hamilton
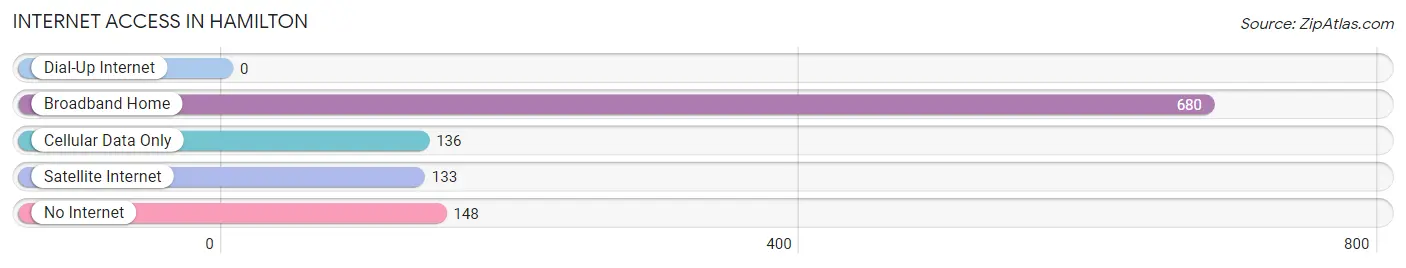
| Internet Type | # Households | % Households |
| Dial-Up Internet | 0 | 0.0% |
| Broadband Home | 680 | 64.8% |
| Cellular Data Only | 136 | 13.0% |
| Satellite Internet | 133 | 12.7% |
| No Internet | 148 | 14.1% |
| Total | 1,050 | 100.0% |
Hamilton Summary
Hamilton, Texas is a small city located in Hamilton County, Texas, United States. It is the county seat of Hamilton County and is located in the heart of the Texas Hill Country. The city has a population of 3,094 as of the 2010 census.
History
The area that is now Hamilton was first settled in the early 1850s by German immigrants. The town was originally named Hamilton’s Creek after the creek that ran through the area. In 1876, the town was renamed Hamilton after James Hamilton, a local rancher.
In 1877, the town was officially incorporated and the first post office was established. The town quickly grew and by the early 1900s, it had become a major center for the local ranching industry.
In the 1920s, the town began to experience a period of growth and development. The first bank was established in 1921 and the first newspaper was published in 1923. The town also saw the construction of a new courthouse and a new school.
In the 1940s, the town experienced a period of decline as the local ranching industry began to decline. However, the town was able to remain a viable community due to its proximity to the nearby cities of Abilene and San Angelo.
Geography
Hamilton is located in the Texas Hill Country, approximately 80 miles west of Waco and 100 miles south of Dallas. The city is situated at the intersection of U.S. Highway 281 and State Highway 22.
The city has a total area of 2.2 square miles, all of which is land. The terrain is mostly flat with some rolling hills. The climate is semi-arid with hot summers and mild winters.
Economy
The economy of Hamilton is largely based on agriculture and ranching. The city is home to several large ranches and farms, as well as a number of smaller operations.
The city also has a number of small businesses, including restaurants, retail stores, and service providers. The city is also home to a number of manufacturing and industrial businesses.
Demographics
As of the 2010 census, the population of Hamilton was 3,094. The racial makeup of the city was 79.3% White, 0.7% African American, 0.3% Native American, 0.2% Asian, 0.1% Pacific Islander, 17.7% from other races, and 1.9% from two or more races. Hispanic or Latino of any race were 33.2% of the population.
The median income for a household in the city was $31,250, and the median income for a family was $37,500. The per capita income for the city was $17,845. About 17.2% of families and 20.3% of the population were below the poverty line, including 28.2% of those under age 18 and 11.2% of those age 65 or over.
Common Questions
What is Per Capita Income in Hamilton?
Per Capita income in Hamilton is $25,495.
What is the Median Family Income in Hamilton?
Median Family Income in Hamilton is $83,125.
What is the Median Household income in Hamilton?
Median Household Income in Hamilton is $46,538.
What is Income or Wage Gap in Hamilton?
Income or Wage Gap in Hamilton is 16.6%.
Women in Hamilton earn 83.4 cents for every dollar earned by a man.
What is Inequality or Gini Index in Hamilton?
Inequality or Gini Index in Hamilton is 0.40.
What is the Total Population of Hamilton?
Total Population of Hamilton is 2,898.
What is the Total Male Population of Hamilton?
Total Male Population of Hamilton is 1,425.
What is the Total Female Population of Hamilton?
Total Female Population of Hamilton is 1,473.
What is the Ratio of Males per 100 Females in Hamilton?
There are 96.74 Males per 100 Females in Hamilton.
What is the Ratio of Females per 100 Males in Hamilton?
There are 103.37 Females per 100 Males in Hamilton.
What is the Median Population Age in Hamilton?
Median Population Age in Hamilton is 39.4 Years.
What is the Average Family Size in Hamilton
Average Family Size in Hamilton is 3.6 People.
What is the Average Household Size in Hamilton
Average Household Size in Hamilton is 2.6 People.
How Large is the Labor Force in Hamilton?
There are 1,385 People in the Labor Forcein in Hamilton.
What is the Percentage of People in the Labor Force in Hamilton?
58.5% of People are in the Labor Force in Hamilton.
What is the Unemployment Rate in Hamilton?
Unemployment Rate in Hamilton is 2.2%.