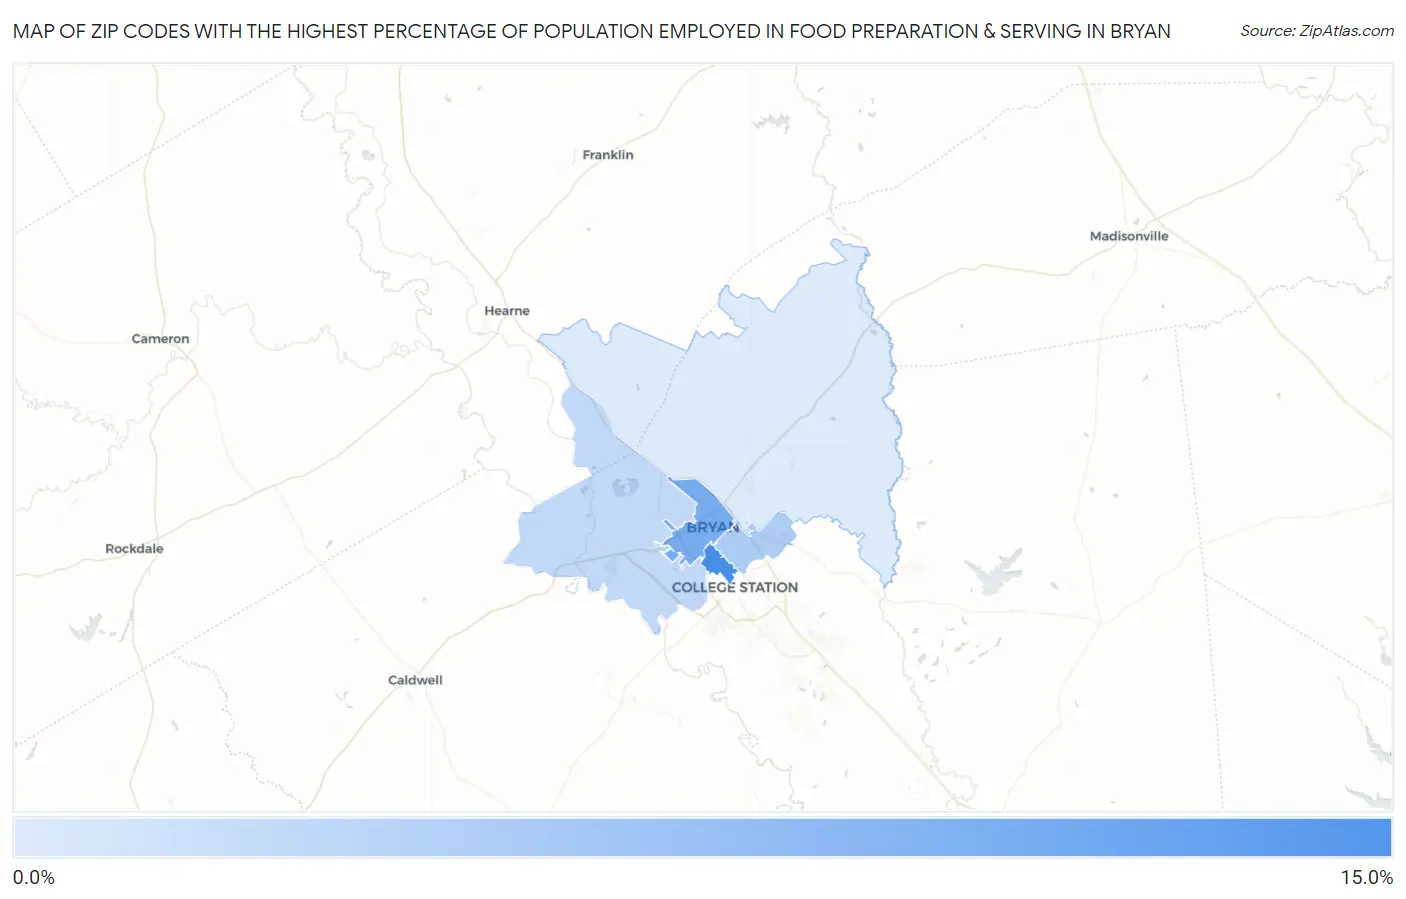
Zip Codes with the Highest Percentage of Population Employed in Food Preparation & Serving in Bryan, TX
RELATED REPORTS & OPTIONS
Food Preparation & Serving
Bryan
Compare Zip Codes
Map of Zip Codes with the Highest Percentage of Population Employed in Food Preparation & Serving in Bryan
1.4%
10.0%
Zip Codes with the Highest Percentage of Population Employed in Food Preparation & Serving in Bryan, TX
| Zip Code | % Employed | vs State | vs National | |
| 1. | 77801 | 10.0% | 5.4%(+4.68)#145 | 5.3%(+4.74)#2,610 |
| 2. | 77803 | 7.2% | 5.4%(+1.85)#388 | 5.3%(+1.91)#6,133 |
| 3. | 77802 | 4.1% | 5.4%(-1.24)#1,013 | 5.3%(-1.18)#16,666 |
| 4. | 77807 | 3.0% | 5.4%(-2.33)#1,265 | 5.3%(-2.26)#21,160 |
| 5. | 77808 | 1.4% | 5.4%(-3.91)#1,520 | 5.3%(-3.85)#26,131 |
1
Common Questions
What are the Top 3 Zip Codes with the Highest Percentage of Population Employed in Food Preparation & Serving in Bryan, TX?
Top 3 Zip Codes with the Highest Percentage of Population Employed in Food Preparation & Serving in Bryan, TX are:
What zip code has the Highest Percentage of Population Employed in Food Preparation & Serving in Bryan, TX?
77801 has the Highest Percentage of Population Employed in Food Preparation & Serving in Bryan, TX with 10.0%.
What is the Percentage of Population Employed in Food Preparation & Serving in Bryan, TX?
Percentage of Population Employed in Food Preparation & Serving in Bryan is 5.8%.
What is the Percentage of Population Employed in Food Preparation & Serving in Texas?
Percentage of Population Employed in Food Preparation & Serving in Texas is 5.4%.
What is the Percentage of Population Employed in Food Preparation & Serving in the United States?
Percentage of Population Employed in Food Preparation & Serving in the United States is 5.3%.