Zip Codes with the Highest Percentage of Population Employed in Food Preparation & Serving in Cleburne, TX
RELATED REPORTS & OPTIONS
Food Preparation & Serving
Cleburne
Compare Zip Codes
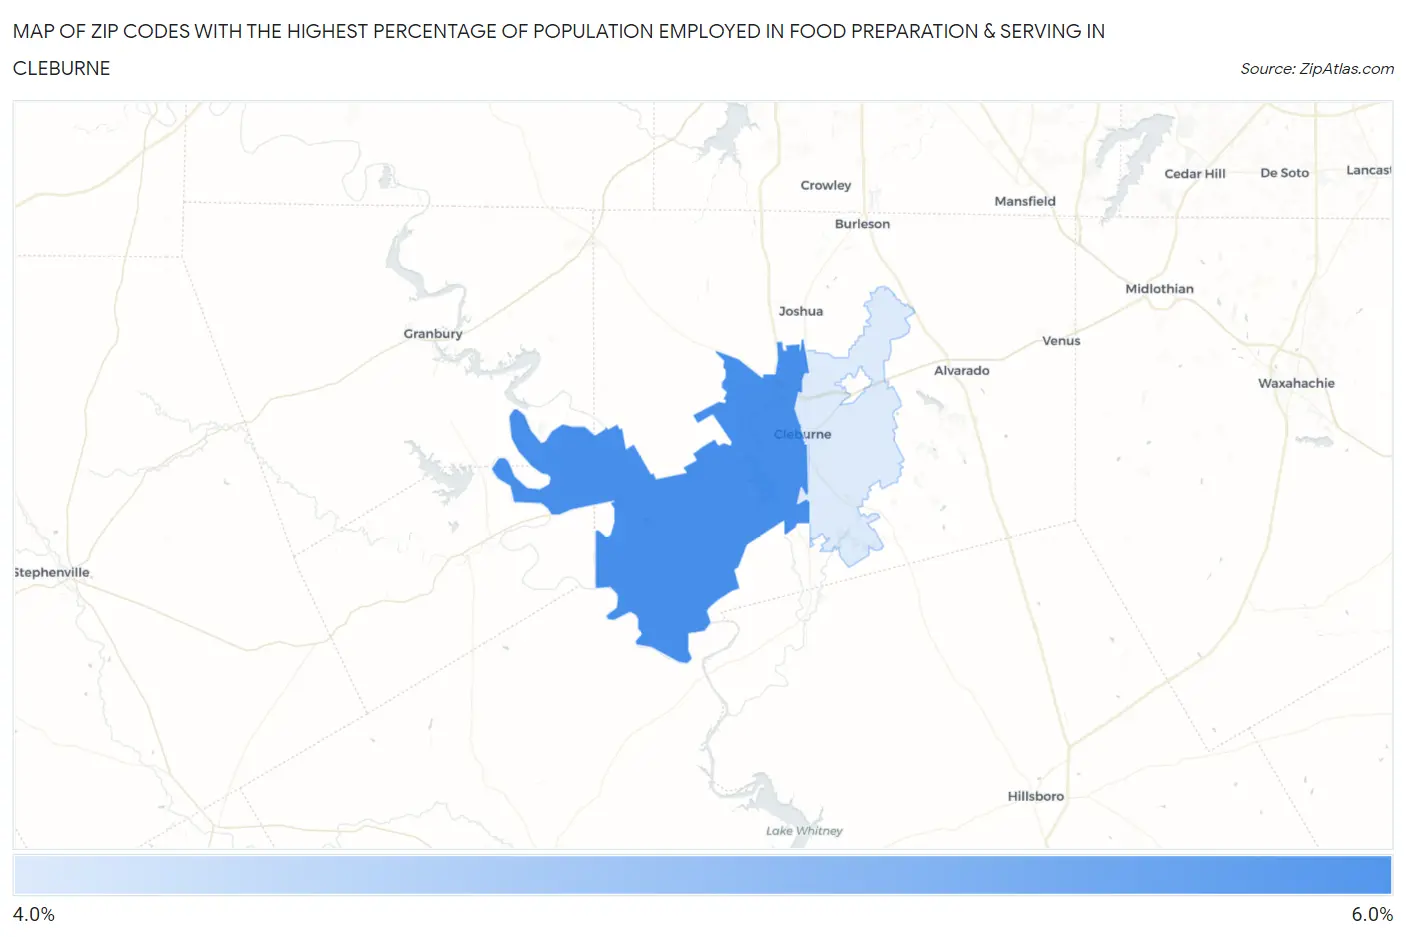
Map of Zip Codes with the Highest Percentage of Population Employed in Food Preparation & Serving in Cleburne
4.5%
5.1%
Zip Codes with the Highest Percentage of Population Employed in Food Preparation & Serving in Cleburne, TX
| Zip Code | % Employed | vs State | vs National | |
| 1. | 76033 | 5.1% | 5.4%(-0.273)#786 | 5.3%(-0.208)#12,624 |
| 2. | 76031 | 4.5% | 5.4%(-0.847)#927 | 5.3%(-0.781)#15,009 |
1
Common Questions
What are the Top Zip Codes with the Highest Percentage of Population Employed in Food Preparation & Serving in Cleburne, TX?
Top Zip Codes with the Highest Percentage of Population Employed in Food Preparation & Serving in Cleburne, TX are:
What zip code has the Highest Percentage of Population Employed in Food Preparation & Serving in Cleburne, TX?
76033 has the Highest Percentage of Population Employed in Food Preparation & Serving in Cleburne, TX with 5.1%.
What is the Percentage of Population Employed in Food Preparation & Serving in Cleburne, TX?
Percentage of Population Employed in Food Preparation & Serving in Cleburne is 4.9%.
What is the Percentage of Population Employed in Food Preparation & Serving in Texas?
Percentage of Population Employed in Food Preparation & Serving in Texas is 5.4%.
What is the Percentage of Population Employed in Food Preparation & Serving in the United States?
Percentage of Population Employed in Food Preparation & Serving in the United States is 5.3%.