San Juan, TX Map & Demographics
San Juan Map
San Juan Overview
$11,633
PER CAPITA INCOME
36.9%
WAGE / INCOME GAP [ % ]
63.1¢/ $1
WAGE / INCOME GAP [ $ ]
0.28
INEQUALITY / GINI INDEX
95
TOTAL POPULATION
57
MALE POPULATION
38
FEMALE POPULATION
150.00
MALES / 100 FEMALES
66.67
FEMALES / 100 MALES
23.8
MEDIAN AGE
3.6
AVG FAMILY SIZE
3.6
AVG HOUSEHOLD SIZE
23
LABOR FORCE [ PEOPLE ]
37.1%
PERCENT IN LABOR FORCE
San Juan Zip Codes
San Juan Area Codes
Income in San Juan
Income Overview in San Juan
| Characteristic | Number | Measure |
| Per Capita Income | 95 | $11,633 |
| Median Family Income | 26 | $0 |
| Mean Family Income | 26 | $36,931 |
| Median Household Income | 26 | $0 |
| Mean Household Income | 26 | $36,931 |
| Income Deficit | 26 | $0 |
| Wage / Income Gap (%) | 95 | 36.94% |
| Wage / Income Gap ($) | 95 | 63.06¢ per $1 |
| Gini / Inequality Index | 95 | 0.28 |
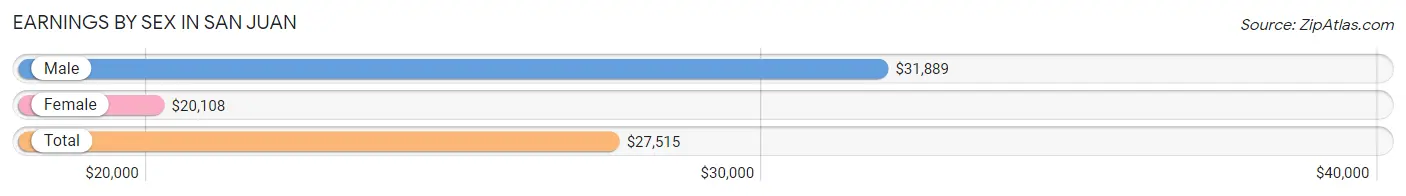
Earnings by Sex in San Juan
Average Earnings in San Juan are $27,515, $31,889 for men and $20,108 for women, a difference of 36.9%.
| Sex | Number | Average Earnings |
| Male | 9 (30.0%) | $31,889 |
| Female | 21 (70.0%) | $20,108 |
| Total | 30 (100.0%) | $27,515 |
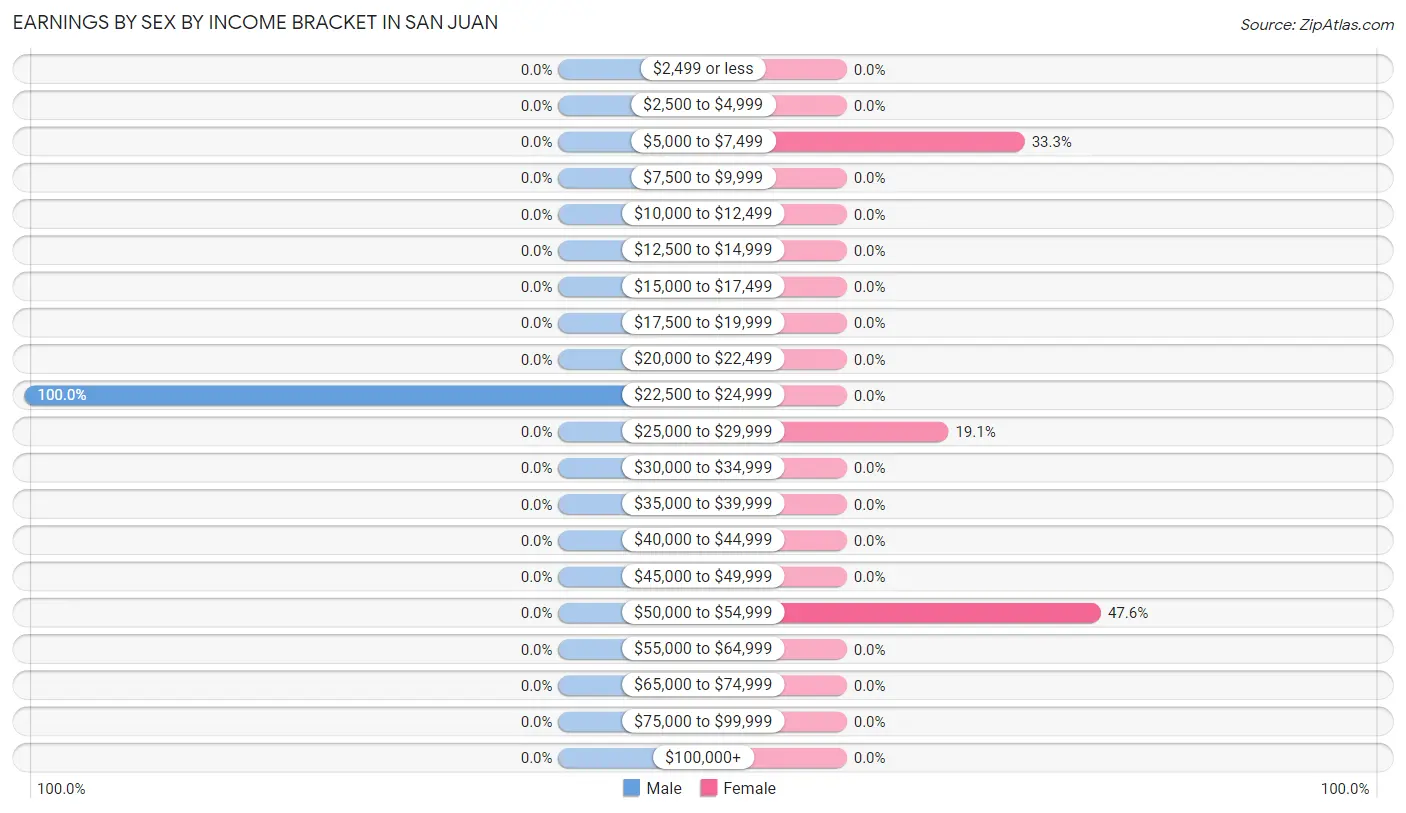
Earnings by Sex by Income Bracket in San Juan
The most common earnings brackets in San Juan are $22,500 to $24,999 for men (9 | 100.0%) and $50,000 to $54,999 for women (10 | 47.6%).
| Income | Male | Female |
| $2,499 or less | 0 (0.0%) | 0 (0.0%) |
| $2,500 to $4,999 | 0 (0.0%) | 0 (0.0%) |
| $5,000 to $7,499 | 0 (0.0%) | 7 (33.3%) |
| $7,500 to $9,999 | 0 (0.0%) | 0 (0.0%) |
| $10,000 to $12,499 | 0 (0.0%) | 0 (0.0%) |
| $12,500 to $14,999 | 0 (0.0%) | 0 (0.0%) |
| $15,000 to $17,499 | 0 (0.0%) | 0 (0.0%) |
| $17,500 to $19,999 | 0 (0.0%) | 0 (0.0%) |
| $20,000 to $22,499 | 0 (0.0%) | 0 (0.0%) |
| $22,500 to $24,999 | 9 (100.0%) | 0 (0.0%) |
| $25,000 to $29,999 | 0 (0.0%) | 4 (19.1%) |
| $30,000 to $34,999 | 0 (0.0%) | 0 (0.0%) |
| $35,000 to $39,999 | 0 (0.0%) | 0 (0.0%) |
| $40,000 to $44,999 | 0 (0.0%) | 0 (0.0%) |
| $45,000 to $49,999 | 0 (0.0%) | 0 (0.0%) |
| $50,000 to $54,999 | 0 (0.0%) | 10 (47.6%) |
| $55,000 to $64,999 | 0 (0.0%) | 0 (0.0%) |
| $65,000 to $74,999 | 0 (0.0%) | 0 (0.0%) |
| $75,000 to $99,999 | 0 (0.0%) | 0 (0.0%) |
| $100,000+ | 0 (0.0%) | 0 (0.0%) |
| Total | 9 (100.0%) | 21 (100.0%) |
Earnings by Sex by Educational Attainment in San Juan
| Educational Attainment | Male Income | Female Income |
| Less than High School | - | - |
| High School Diploma | - | - |
| College or Associate's Degree | - | - |
| Bachelor's Degree | - | - |
| Graduate Degree | - | - |
| Total | - | - |
Family Income in San Juan
Family Income Brackets in San Juan
According to the San Juan family income data, there are 14 families falling into the $50,000 to $74,999 income range, which is the most common income bracket and makes up 53.8% of all families.
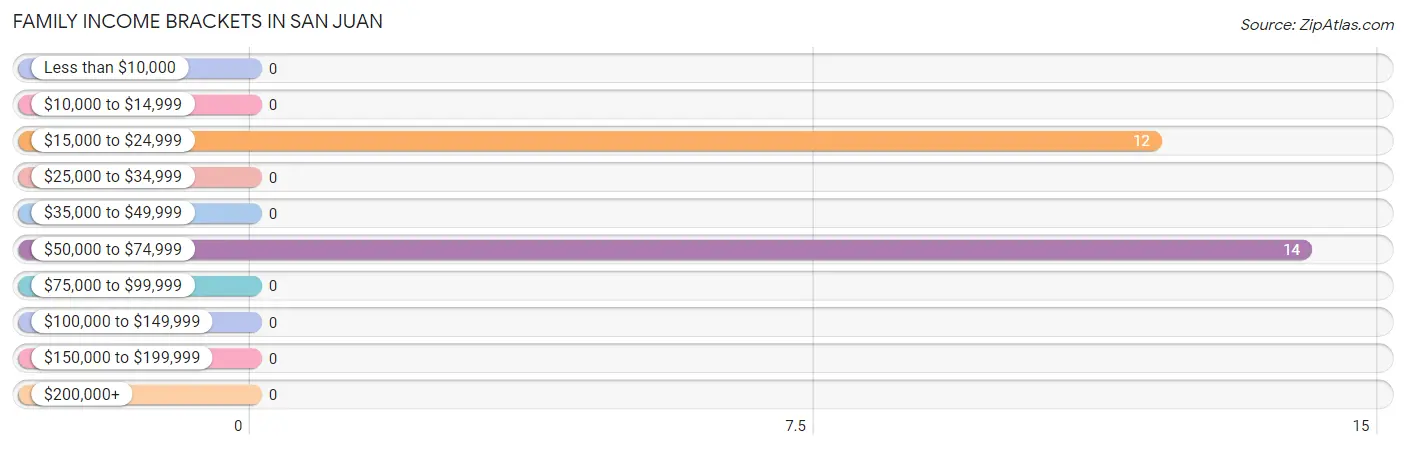
| Income Bracket | # Families | % Families |
| Less than $10,000 | 0 | 0.0% |
| $10,000 to $14,999 | 0 | 0.0% |
| $15,000 to $24,999 | 12 | 46.2% |
| $25,000 to $34,999 | 0 | 0.0% |
| $35,000 to $49,999 | 0 | 0.0% |
| $50,000 to $74,999 | 14 | 53.8% |
| $75,000 to $99,999 | 0 | 0.0% |
| $100,000 to $149,999 | 0 | 0.0% |
| $150,000 to $199,999 | 0 | 0.0% |
| $200,000+ | 0 | 0.0% |
Family Income by Famaliy Size in San Juan
| Income Bracket | # Families | Median Income |
| 2-Person Families | 12 (46.2%) | $0 |
| 3-Person Families | 4 (15.4%) | $0 |
| 4-Person Families | 0 (0.0%) | $0 |
| 5-Person Families | 10 (38.5%) | $0 |
| 6-Person Families | 0 (0.0%) | $0 |
| 7+ Person Families | 0 (0.0%) | $0 |
| Total | 26 (100.0%) | $0 |
Family Income by Number of Earners in San Juan
| Number of Earners | # Families | Median Income |
| No Earners | 12 (46.2%) | $0 |
| 1 Earner | 10 (38.5%) | $0 |
| 2 Earners | 0 (0.0%) | $0 |
| 3+ Earners | 4 (15.4%) | $0 |
| Total | 26 (100.0%) | $0 |
Household Income in San Juan
Household Income Brackets in San Juan
With 14 households falling in the category, the $50,000 to $74,999 income range is the most frequent in San Juan, accounting for 53.8% of all households.
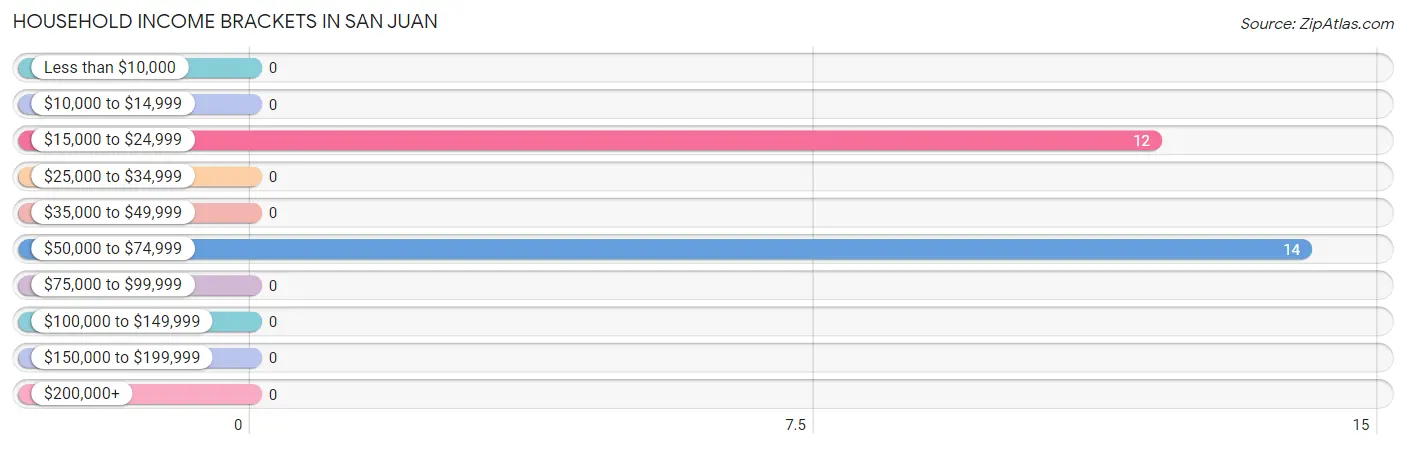
| Income Bracket | # Households | % Households |
| Less than $10,000 | 0 | 0.0% |
| $10,000 to $14,999 | 0 | 0.0% |
| $15,000 to $24,999 | 12 | 46.2% |
| $25,000 to $34,999 | 0 | 0.0% |
| $35,000 to $49,999 | 0 | 0.0% |
| $50,000 to $74,999 | 14 | 53.8% |
| $75,000 to $99,999 | 0 | 0.0% |
| $100,000 to $149,999 | 0 | 0.0% |
| $150,000 to $199,999 | 0 | 0.0% |
| $200,000+ | 0 | 0.0% |
Household Income by Householder Age in San Juan
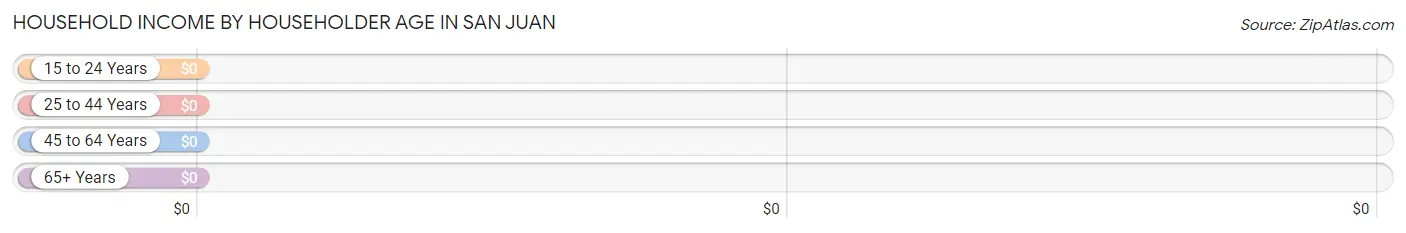
| Income Bracket | # Households | Median Income |
| 15 to 24 Years | 0 (0.0%) | $0 |
| 25 to 44 Years | 10 (38.5%) | $0 |
| 45 to 64 Years | 4 (15.4%) | $0 |
| 65+ Years | 12 (46.2%) | $0 |
| Total | 26 (100.0%) | $0 |
Poverty in San Juan
Income Below Poverty by Sex and Age in San Juan
With 22.8% poverty level for males and 31.6% for females among the residents of San Juan, 75 year old and over males and 65 to 74 year old females are the most vulnerable to poverty, with 13 males (100.0%) and 12 females (100.0%) in their respective age groups living below the poverty level.
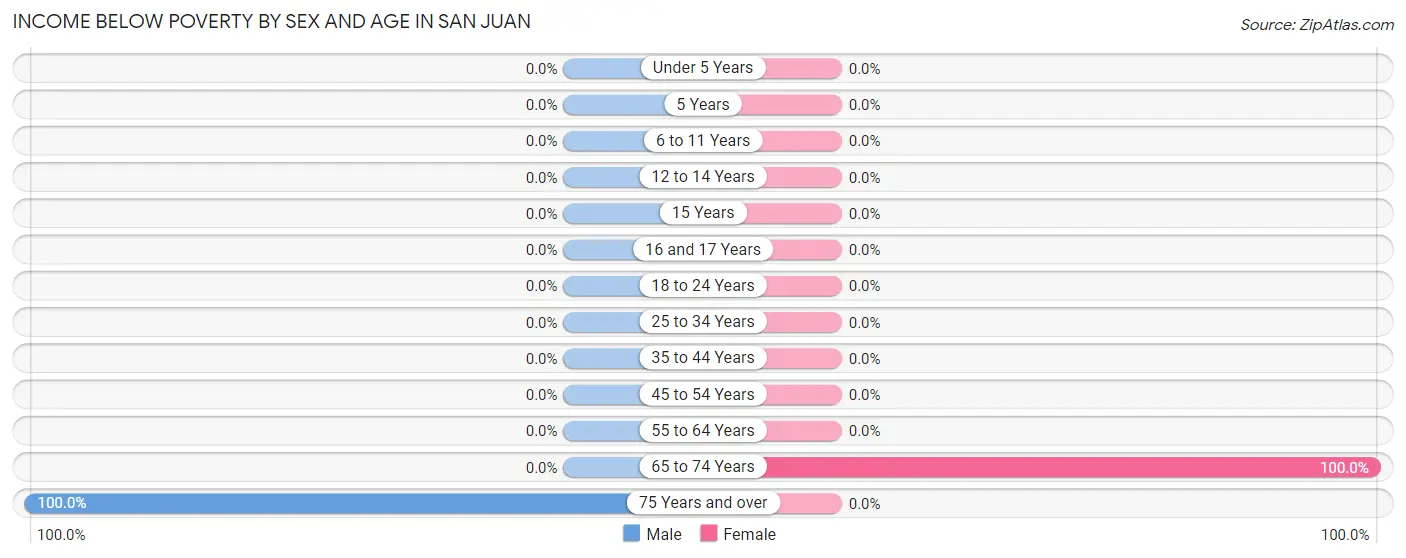
| Age Bracket | Male | Female |
| Under 5 Years | 0 (0.0%) | 0 (0.0%) |
| 5 Years | 0 (0.0%) | 0 (0.0%) |
| 6 to 11 Years | 0 (0.0%) | 0 (0.0%) |
| 12 to 14 Years | 0 (0.0%) | 0 (0.0%) |
| 15 Years | 0 (0.0%) | 0 (0.0%) |
| 16 and 17 Years | 0 (0.0%) | 0 (0.0%) |
| 18 to 24 Years | 0 (0.0%) | 0 (0.0%) |
| 25 to 34 Years | 0 (0.0%) | 0 (0.0%) |
| 35 to 44 Years | 0 (0.0%) | 0 (0.0%) |
| 45 to 54 Years | 0 (0.0%) | 0 (0.0%) |
| 55 to 64 Years | 0 (0.0%) | 0 (0.0%) |
| 65 to 74 Years | 0 (0.0%) | 12 (100.0%) |
| 75 Years and over | 13 (100.0%) | 0 (0.0%) |
| Total | 13 (22.8%) | 12 (31.6%) |
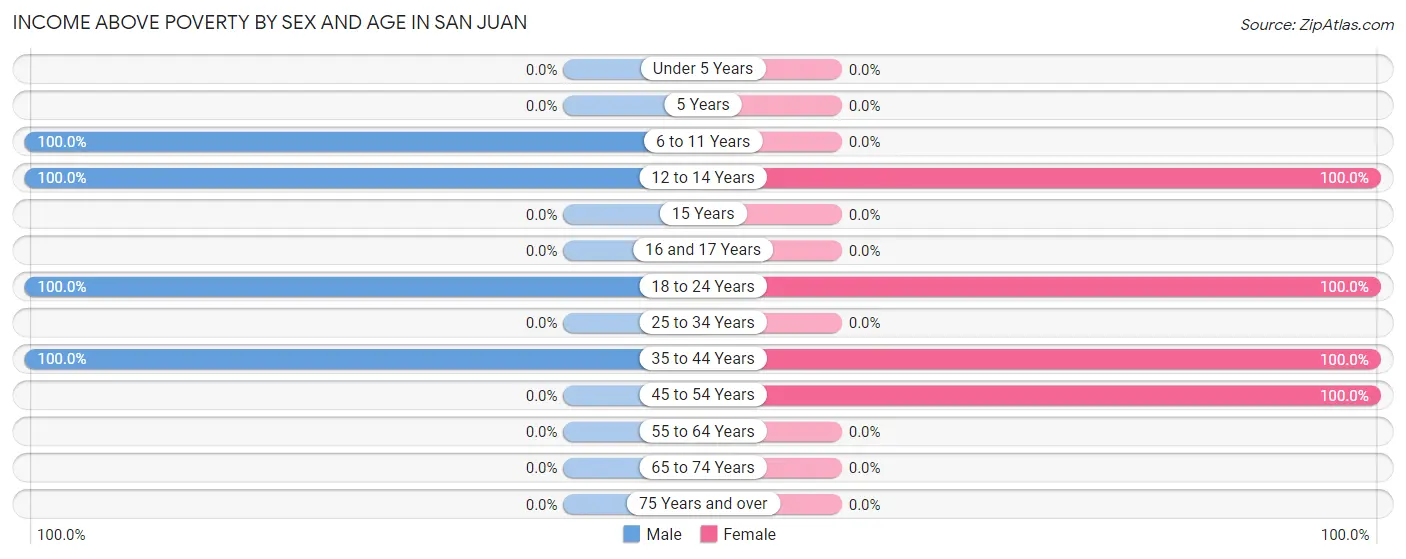
Income Above Poverty by Sex and Age in San Juan
According to the poverty statistics in San Juan, males aged 6 to 11 years and females aged 12 to 14 years are the age groups that are most secure financially, with 100.0% of males and 100.0% of females in these age groups living above the poverty line.
| Age Bracket | Male | Female |
| Under 5 Years | 0 (0.0%) | 0 (0.0%) |
| 5 Years | 0 (0.0%) | 0 (0.0%) |
| 6 to 11 Years | 14 (100.0%) | 0 (0.0%) |
| 12 to 14 Years | 14 (100.0%) | 5 (100.0%) |
| 15 Years | 0 (0.0%) | 0 (0.0%) |
| 16 and 17 Years | 0 (0.0%) | 0 (0.0%) |
| 18 to 24 Years | 9 (100.0%) | 7 (100.0%) |
| 25 to 34 Years | 0 (0.0%) | 0 (0.0%) |
| 35 to 44 Years | 7 (100.0%) | 10 (100.0%) |
| 45 to 54 Years | 0 (0.0%) | 4 (100.0%) |
| 55 to 64 Years | 0 (0.0%) | 0 (0.0%) |
| 65 to 74 Years | 0 (0.0%) | 0 (0.0%) |
| 75 Years and over | 0 (0.0%) | 0 (0.0%) |
| Total | 44 (77.2%) | 26 (68.4%) |
Income Below Poverty Among Married-Couple Families in San Juan
The poverty statistics for married-couple families in San Juan show that 54.5% or 12 of the total 22 families live below the poverty line. Families with no children have the highest poverty rate of 100.0%, comprising of 12 families. On the other hand, families with 3 or 4 children have the lowest poverty rate of 0.0%, which includes 0 families.
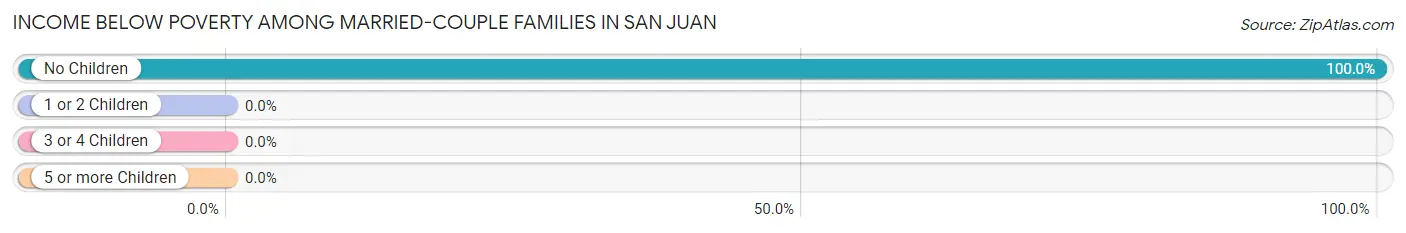
| Children | Above Poverty | Below Poverty |
| No Children | 0 (0.0%) | 12 (100.0%) |
| 1 or 2 Children | 0 (0.0%) | 0 (0.0%) |
| 3 or 4 Children | 10 (100.0%) | 0 (0.0%) |
| 5 or more Children | 0 (0.0%) | 0 (0.0%) |
| Total | 10 (45.5%) | 12 (54.5%) |
Income Below Poverty Among Single-Parent Households in San Juan
| Children | Single Father | Single Mother |
| No Children | 0 (0.0%) | 0 (0.0%) |
| 1 or 2 Children | 0 (0.0%) | 0 (0.0%) |
| 3 or 4 Children | 0 (0.0%) | 0 (0.0%) |
| 5 or more Children | 0 (0.0%) | 0 (0.0%) |
| Total | 0 (0.0%) | 0 (0.0%) |
Income Below Poverty Among Married-Couple vs Single-Parent Households in San Juan
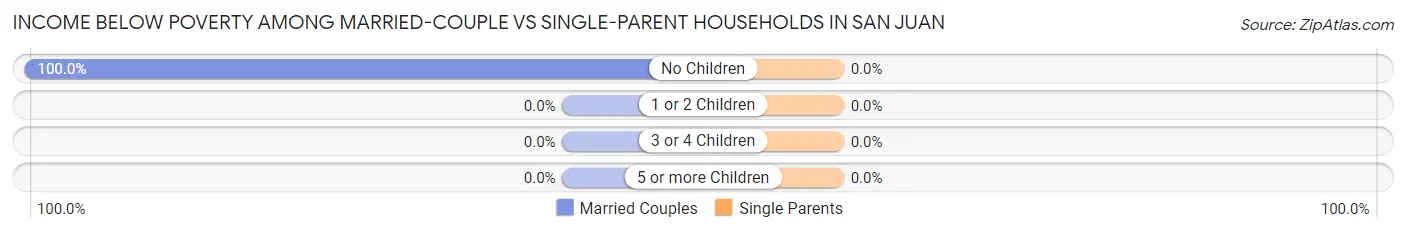
| Children | Married-Couple Families | Single-Parent Households |
| No Children | 12 (100.0%) | 0 (0.0%) |
| 1 or 2 Children | 0 (0.0%) | 0 (0.0%) |
| 3 or 4 Children | 0 (0.0%) | 0 (0.0%) |
| 5 or more Children | 0 (0.0%) | 0 (0.0%) |
| Total | 12 (54.5%) | 0 (0.0%) |
Race in San Juan
The most populous races in San Juan are Hispanic or Latino (95 | 100.0%), White / Caucasian (70 | 73.7%), and Some other Race (25 | 26.3%).
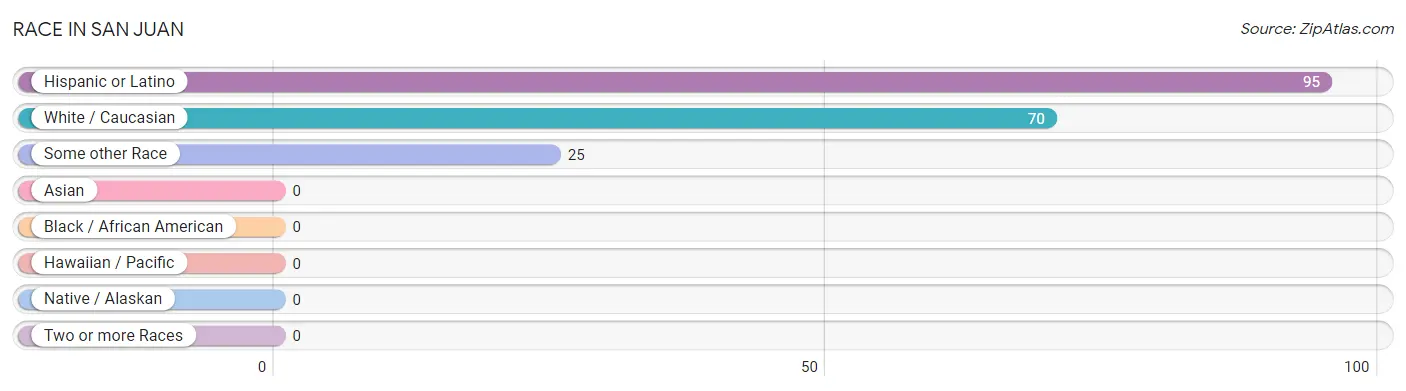
| Race | # Population | % Population |
| Asian | 0 | 0.0% |
| Black / African American | 0 | 0.0% |
| Hawaiian / Pacific | 0 | 0.0% |
| Hispanic or Latino | 95 | 100.0% |
| Native / Alaskan | 0 | 0.0% |
| White / Caucasian | 70 | 73.7% |
| Two or more Races | 0 | 0.0% |
| Some other Race | 25 | 26.3% |
| Total | 95 | 100.0% |
Ancestry in San Juan
The most populous ancestries reported in San Juan are , and Mexican (95 | 100.0%), together accounting for 100.0% of all San Juan residents.

| Ancestry | # Population | % Population |
| Mexican | 95 | 100.0% | View All 1 Rows |
Immigrants in San Juan
The most numerous immigrant groups reported in San Juan came from Central America (29 | 30.5%), Latin America (29 | 30.5%), and Mexico (29 | 30.5%), together accounting for 91.6% of all San Juan residents.
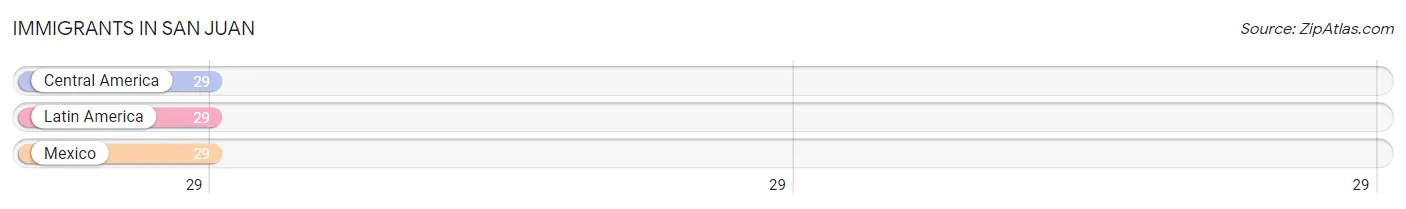
| Immigration Origin | # Population | % Population |
| Central America | 29 | 30.5% |
| Latin America | 29 | 30.5% |
| Mexico | 29 | 30.5% | View All 3 Rows |
Sex and Age in San Juan
Sex and Age in San Juan
The most populous age groups in San Juan are 5 to 9 Years (14 | 24.6%) for men and 70 to 74 Years (12 | 31.6%) for women.
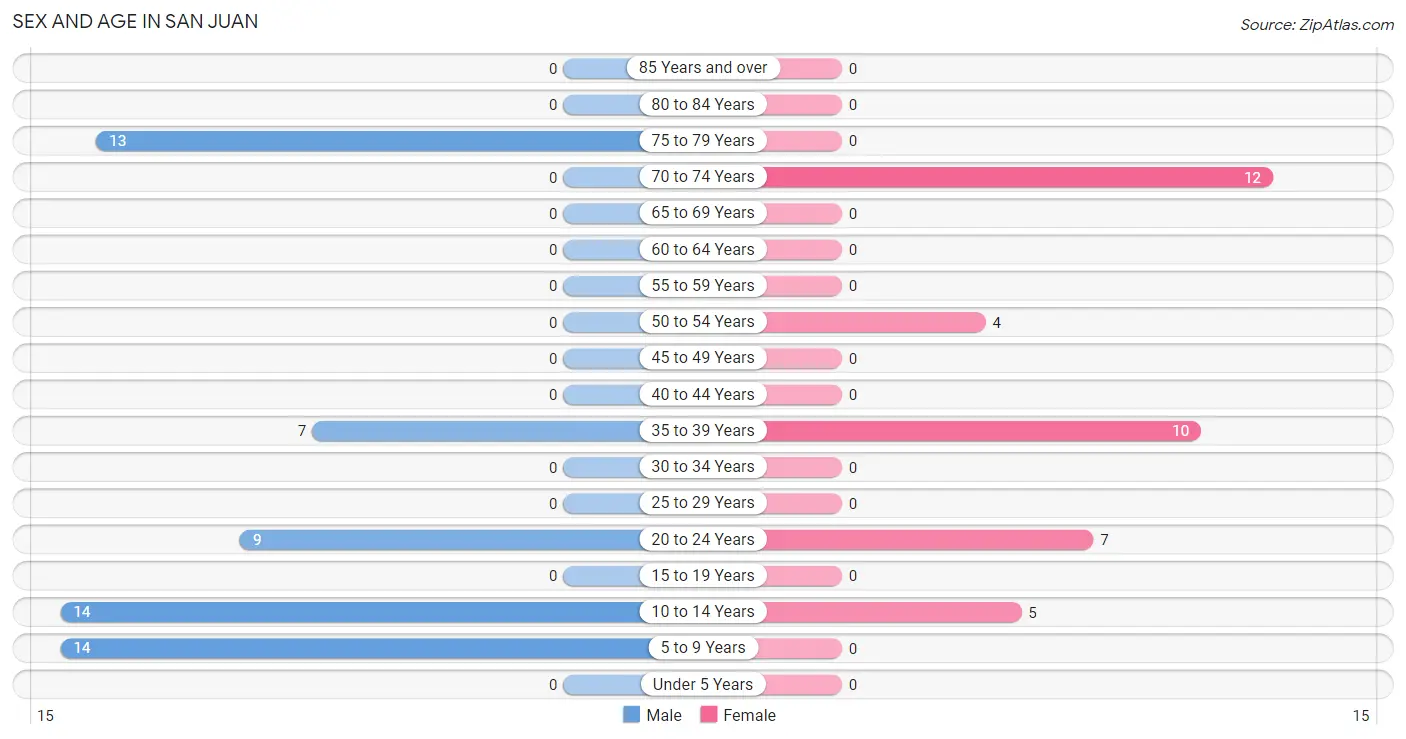
| Age Bracket | Male | Female |
| Under 5 Years | 0 (0.0%) | 0 (0.0%) |
| 5 to 9 Years | 14 (24.6%) | 0 (0.0%) |
| 10 to 14 Years | 14 (24.6%) | 5 (13.2%) |
| 15 to 19 Years | 0 (0.0%) | 0 (0.0%) |
| 20 to 24 Years | 9 (15.8%) | 7 (18.4%) |
| 25 to 29 Years | 0 (0.0%) | 0 (0.0%) |
| 30 to 34 Years | 0 (0.0%) | 0 (0.0%) |
| 35 to 39 Years | 7 (12.3%) | 10 (26.3%) |
| 40 to 44 Years | 0 (0.0%) | 0 (0.0%) |
| 45 to 49 Years | 0 (0.0%) | 0 (0.0%) |
| 50 to 54 Years | 0 (0.0%) | 4 (10.5%) |
| 55 to 59 Years | 0 (0.0%) | 0 (0.0%) |
| 60 to 64 Years | 0 (0.0%) | 0 (0.0%) |
| 65 to 69 Years | 0 (0.0%) | 0 (0.0%) |
| 70 to 74 Years | 0 (0.0%) | 12 (31.6%) |
| 75 to 79 Years | 13 (22.8%) | 0 (0.0%) |
| 80 to 84 Years | 0 (0.0%) | 0 (0.0%) |
| 85 Years and over | 0 (0.0%) | 0 (0.0%) |
| Total | 57 (100.0%) | 38 (100.0%) |
Families and Households in San Juan
Median Family Size in San Juan
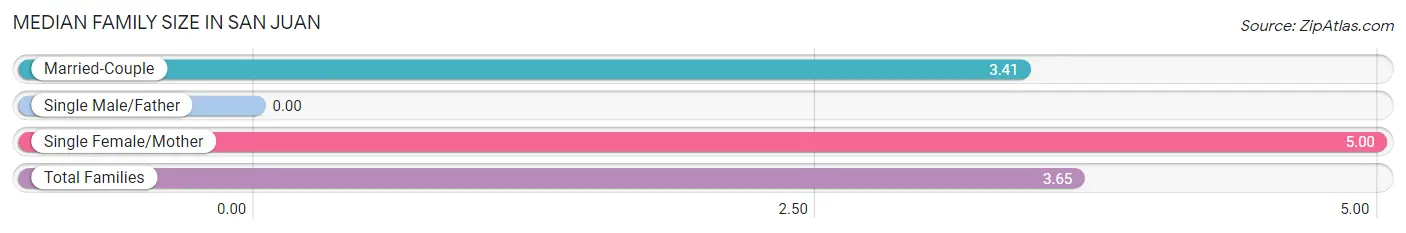
| Family Type | # Families | Family Size |
| Married-Couple | 22 (84.6%) | 3.41 |
| Single Male/Father | 0 (0.0%) | - |
| Single Female/Mother | 4 (15.4%) | 5.00 |
| Total Families | 26 (100.0%) | 3.65 |
Median Household Size in San Juan
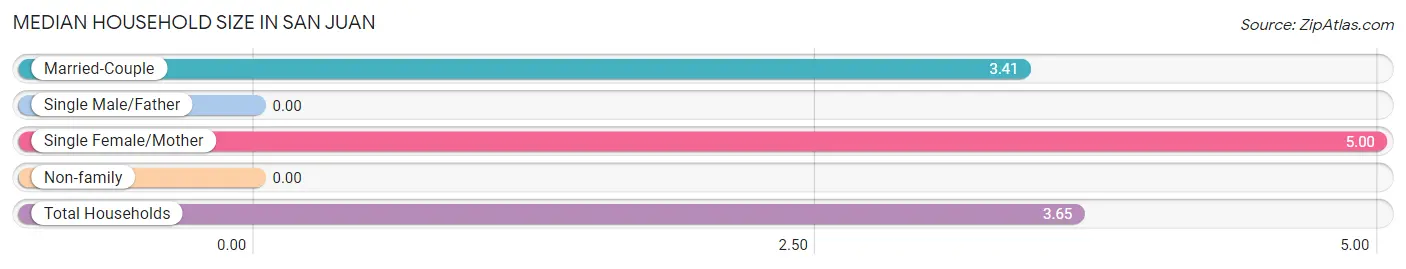
| Household Type | # Households | Household Size |
| Married-Couple | 22 (84.6%) | 3.41 |
| Single Male/Father | 0 (0.0%) | - |
| Single Female/Mother | 4 (15.4%) | 5.00 |
| Non-family | 0 (0.0%) | - |
| Total Households | 26 (100.0%) | 3.65 |
Household Size by Marriage Status in San Juan
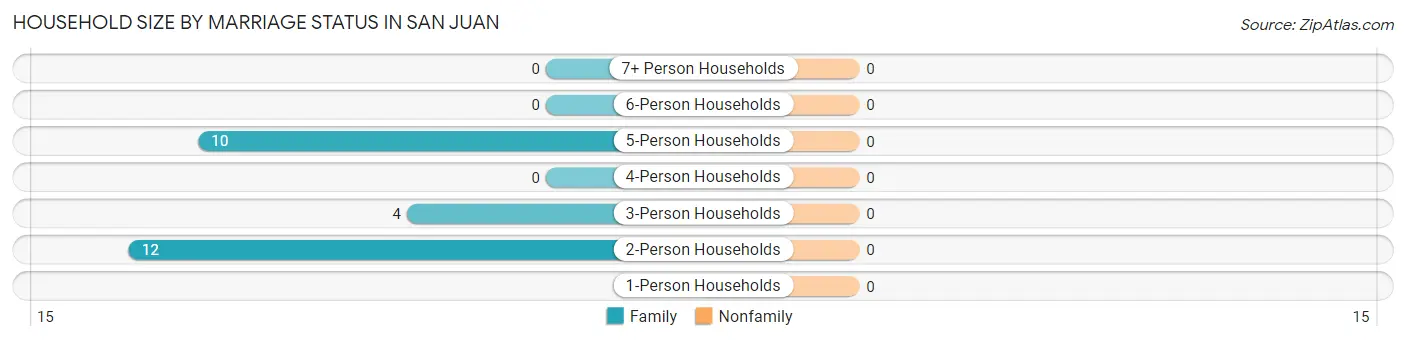
| Household Size | Family Households | Nonfamily Households |
| 1-Person Households | - | 0 (0.0%) |
| 2-Person Households | 12 (46.2%) | 0 (0.0%) |
| 3-Person Households | 4 (15.4%) | 0 (0.0%) |
| 4-Person Households | 0 (0.0%) | 0 (0.0%) |
| 5-Person Households | 10 (38.5%) | 0 (0.0%) |
| 6-Person Households | 0 (0.0%) | 0 (0.0%) |
| 7+ Person Households | 0 (0.0%) | 0 (0.0%) |
| Total | 26 (100.0%) | 0 (0.0%) |
Female Fertility in San Juan
Fertility by Age in San Juan
| Age Bracket | Women with Births | Births / 1,000 Women |
| 15 to 19 years | 0 (0.0%) | 0.0 |
| 20 to 34 years | 0 (0.0%) | 0.0 |
| 35 to 50 years | 0 (0.0%) | 0.0 |
| Total | 0 (0.0%) | 0.0 |
Fertility by Age by Marriage Status in San Juan
| Age Bracket | Married | Unmarried |
| 15 to 19 years | 0 (0.0%) | 0 (0.0%) |
| 20 to 34 years | 0 (0.0%) | 0 (0.0%) |
| 35 to 50 years | 0 (0.0%) | 0 (0.0%) |
| Total | 0 (0.0%) | 0 (0.0%) |
Fertility by Education in San Juan
| Educational Attainment | Women with Births | Births / 1,000 Women |
| Less than High School | 0 (0.0%) | 0.0 |
| High School Diploma | 0 (0.0%) | 0.0 |
| College or Associate's Degree | 0 (0.0%) | 0.0 |
| Bachelor's Degree | 0 (0.0%) | 0.0 |
| Graduate Degree | 0 (0.0%) | 0.0 |
| Total | 0 (0.0%) | 0.0 |
Fertility by Education by Marriage Status in San Juan
| Educational Attainment | Married | Unmarried |
| Less than High School | 0 (0.0%) | 0 (0.0%) |
| High School Diploma | 0 (0.0%) | 0 (0.0%) |
| College or Associate's Degree | 0 (0.0%) | 0 (0.0%) |
| Bachelor's Degree | 0 (0.0%) | 0 (0.0%) |
| Graduate Degree | 0 (0.0%) | 0 (0.0%) |
| Total | 0 (0.0%) | 0 (0.0%) |
Employment Characteristics in San Juan
Employment by Class of Employer in San Juan
Among the 23 employed individuals in San Juan, , and local government employees (23 | 100.0%) make up the most common classes of employment.
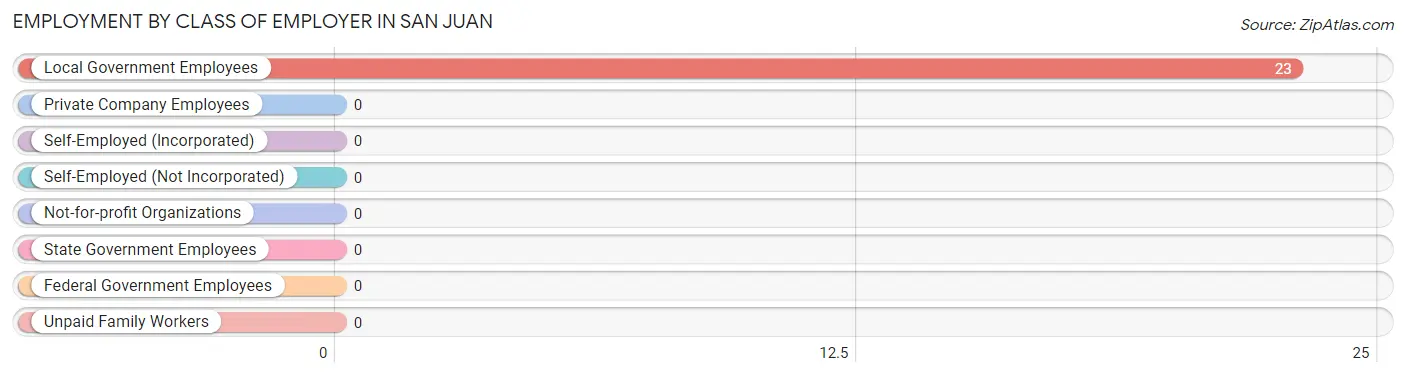
| Employer Class | # Employees | % Employees |
| Private Company Employees | 0 | 0.0% |
| Self-Employed (Incorporated) | 0 | 0.0% |
| Self-Employed (Not Incorporated) | 0 | 0.0% |
| Not-for-profit Organizations | 0 | 0.0% |
| Local Government Employees | 23 | 100.0% |
| State Government Employees | 0 | 0.0% |
| Federal Government Employees | 0 | 0.0% |
| Unpaid Family Workers | 0 | 0.0% |
| Total | 23 | 100.0% |
Employment Status by Age in San Juan
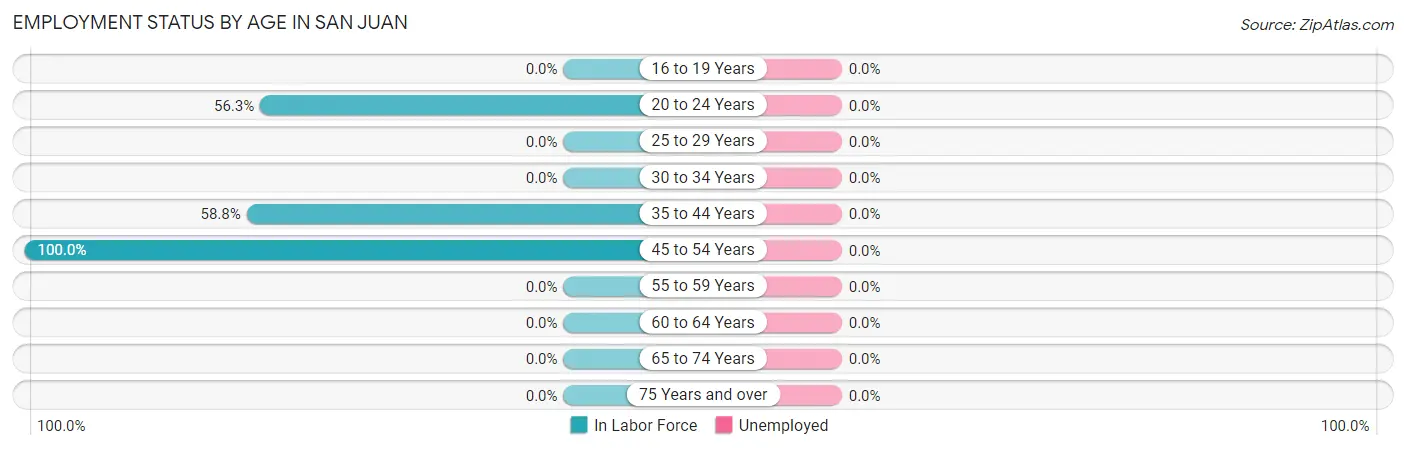
| Age Bracket | In Labor Force | Unemployed |
| 16 to 19 Years | 0 (0.0%) | 0 (0.0%) |
| 20 to 24 Years | 9 (56.3%) | 0 (0.0%) |
| 25 to 29 Years | 0 (0.0%) | 0 (0.0%) |
| 30 to 34 Years | 0 (0.0%) | 0 (0.0%) |
| 35 to 44 Years | 10 (58.8%) | 0 (0.0%) |
| 45 to 54 Years | 4 (100.0%) | 0 (0.0%) |
| 55 to 59 Years | 0 (0.0%) | 0 (0.0%) |
| 60 to 64 Years | 0 (0.0%) | 0 (0.0%) |
| 65 to 74 Years | 0 (0.0%) | 0 (0.0%) |
| 75 Years and over | 0 (0.0%) | 0 (0.0%) |
| Total | 23 (37.1%) | 0 (0.0%) |
Employment Status by Educational Attainment in San Juan
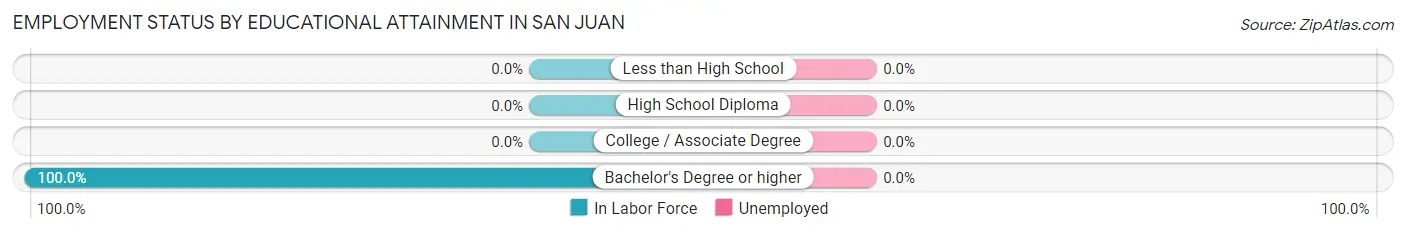
| Educational Attainment | In Labor Force | Unemployed |
| Less than High School | 0 (0.0%) | 0 (0.0%) |
| High School Diploma | 0 (0.0%) | 0 (0.0%) |
| College / Associate Degree | 0 (0.0%) | 0 (0.0%) |
| Bachelor's Degree or higher | 14 (100.0%) | 0 (0.0%) |
| Total | 14 (66.7%) | 0 (0.0%) |
Employment Occupations by Sex in San Juan
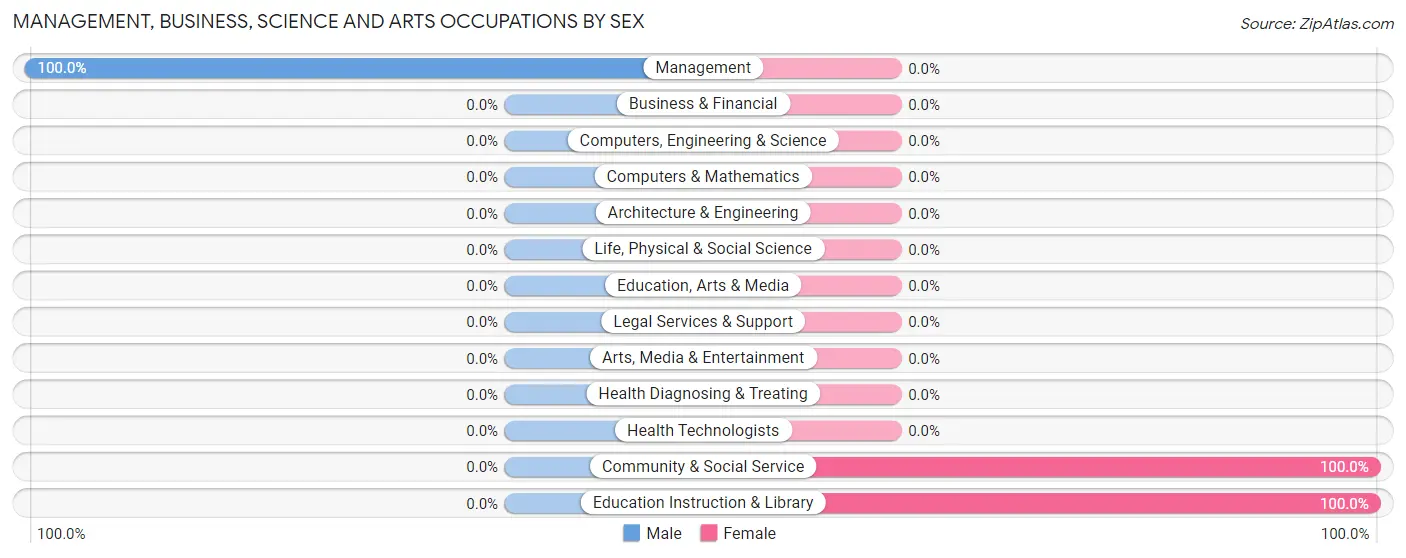
Management, Business, Science and Arts Occupations
The most common Management, Business, Science and Arts occupations in San Juan are Community & Social Service (10 | 43.5%), Education Instruction & Library (10 | 43.5%), and Management (9 | 39.1%).
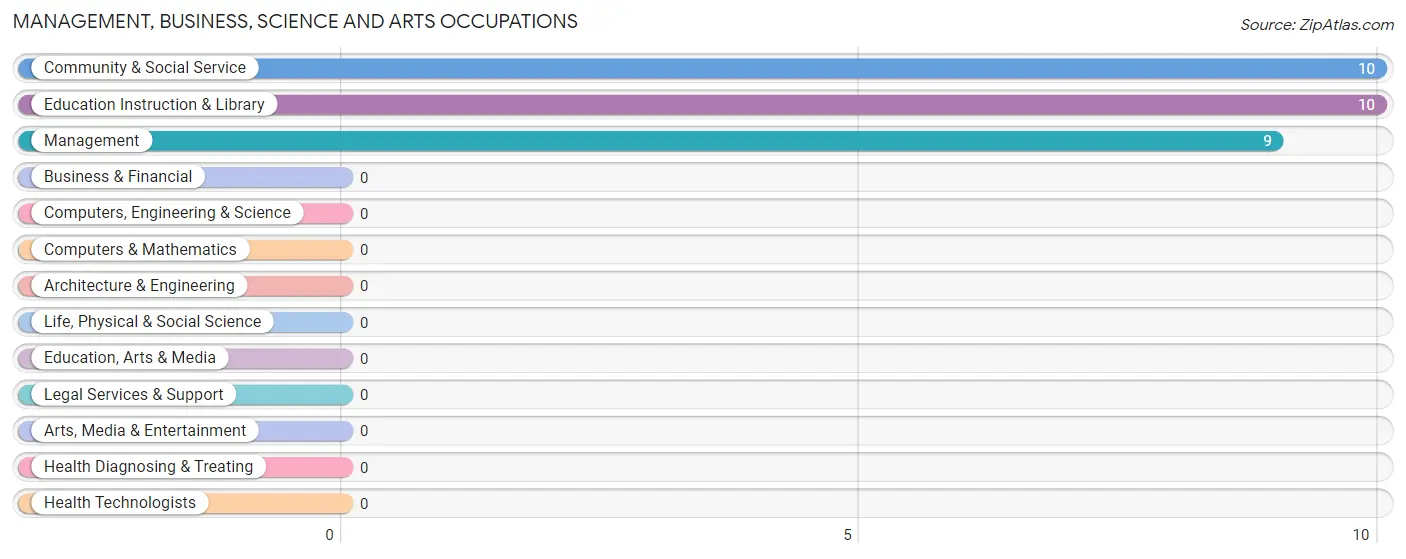
Management, Business, Science and Arts Occupations by Sex
| Occupation | Male | Female |
| Management | 9 (100.0%) | 0 (0.0%) |
| Business & Financial | 0 (0.0%) | 0 (0.0%) |
| Computers, Engineering & Science | 0 (0.0%) | 0 (0.0%) |
| Computers & Mathematics | 0 (0.0%) | 0 (0.0%) |
| Architecture & Engineering | 0 (0.0%) | 0 (0.0%) |
| Life, Physical & Social Science | 0 (0.0%) | 0 (0.0%) |
| Community & Social Service | 0 (0.0%) | 10 (100.0%) |
| Education, Arts & Media | 0 (0.0%) | 0 (0.0%) |
| Legal Services & Support | 0 (0.0%) | 0 (0.0%) |
| Education Instruction & Library | 0 (0.0%) | 10 (100.0%) |
| Arts, Media & Entertainment | 0 (0.0%) | 0 (0.0%) |
| Health Diagnosing & Treating | 0 (0.0%) | 0 (0.0%) |
| Health Technologists | 0 (0.0%) | 0 (0.0%) |
| Total (Category) | 9 (47.4%) | 10 (52.6%) |
| Total (Overall) | 9 (39.1%) | 14 (60.9%) |
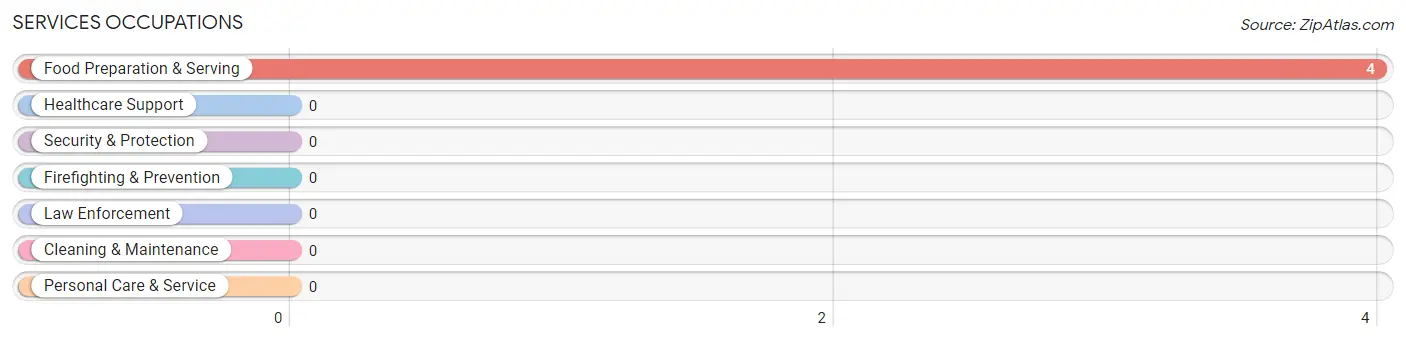
Services Occupations
The most common Services occupations in San Juan are , and Food Preparation & Serving (4 | 17.4%).
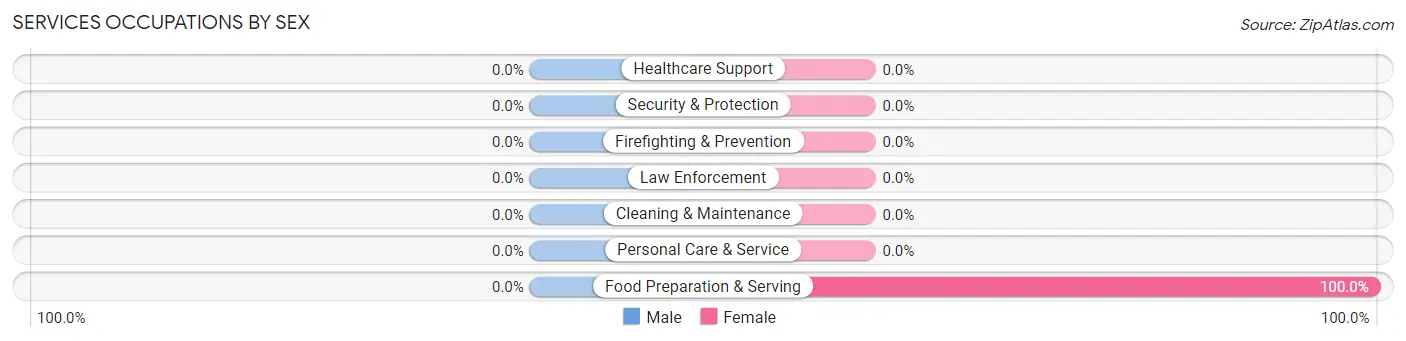
Services Occupations by Sex
| Occupation | Male | Female |
| Healthcare Support | 0 (0.0%) | 0 (0.0%) |
| Security & Protection | 0 (0.0%) | 0 (0.0%) |
| Firefighting & Prevention | 0 (0.0%) | 0 (0.0%) |
| Law Enforcement | 0 (0.0%) | 0 (0.0%) |
| Food Preparation & Serving | 0 (0.0%) | 4 (100.0%) |
| Cleaning & Maintenance | 0 (0.0%) | 0 (0.0%) |
| Personal Care & Service | 0 (0.0%) | 0 (0.0%) |
| Total (Category) | 0 (0.0%) | 4 (100.0%) |
| Total (Overall) | 9 (39.1%) | 14 (60.9%) |
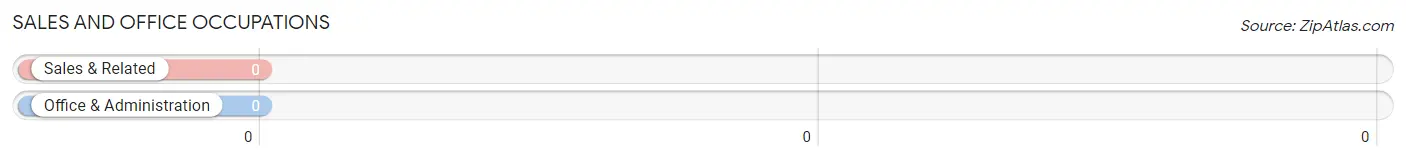
Sales and Office Occupations
Sales and Office Occupations by Sex
| Occupation | Male | Female |
| Sales & Related | 0 (0.0%) | 0 (0.0%) |
| Office & Administration | 0 (0.0%) | 0 (0.0%) |
| Total (Category) | 0 (0.0%) | 0 (0.0%) |
| Total (Overall) | 9 (39.1%) | 14 (60.9%) |
Natural Resources, Construction and Maintenance Occupations
Natural Resources, Construction and Maintenance Occupations by Sex
| Occupation | Male | Female |
| Farming, Fishing & Forestry | 0 (0.0%) | 0 (0.0%) |
| Construction & Extraction | 0 (0.0%) | 0 (0.0%) |
| Installation, Maintenance & Repair | 0 (0.0%) | 0 (0.0%) |
| Total (Category) | 0 (0.0%) | 0 (0.0%) |
| Total (Overall) | 9 (39.1%) | 14 (60.9%) |
Production, Transportation and Moving Occupations
Production, Transportation and Moving Occupations by Sex
| Occupation | Male | Female |
| Production | 0 (0.0%) | 0 (0.0%) |
| Transportation | 0 (0.0%) | 0 (0.0%) |
| Material Moving | 0 (0.0%) | 0 (0.0%) |
| Total (Category) | 0 (0.0%) | 0 (0.0%) |
| Total (Overall) | 9 (39.1%) | 14 (60.9%) |
Employment Industries by Sex in San Juan
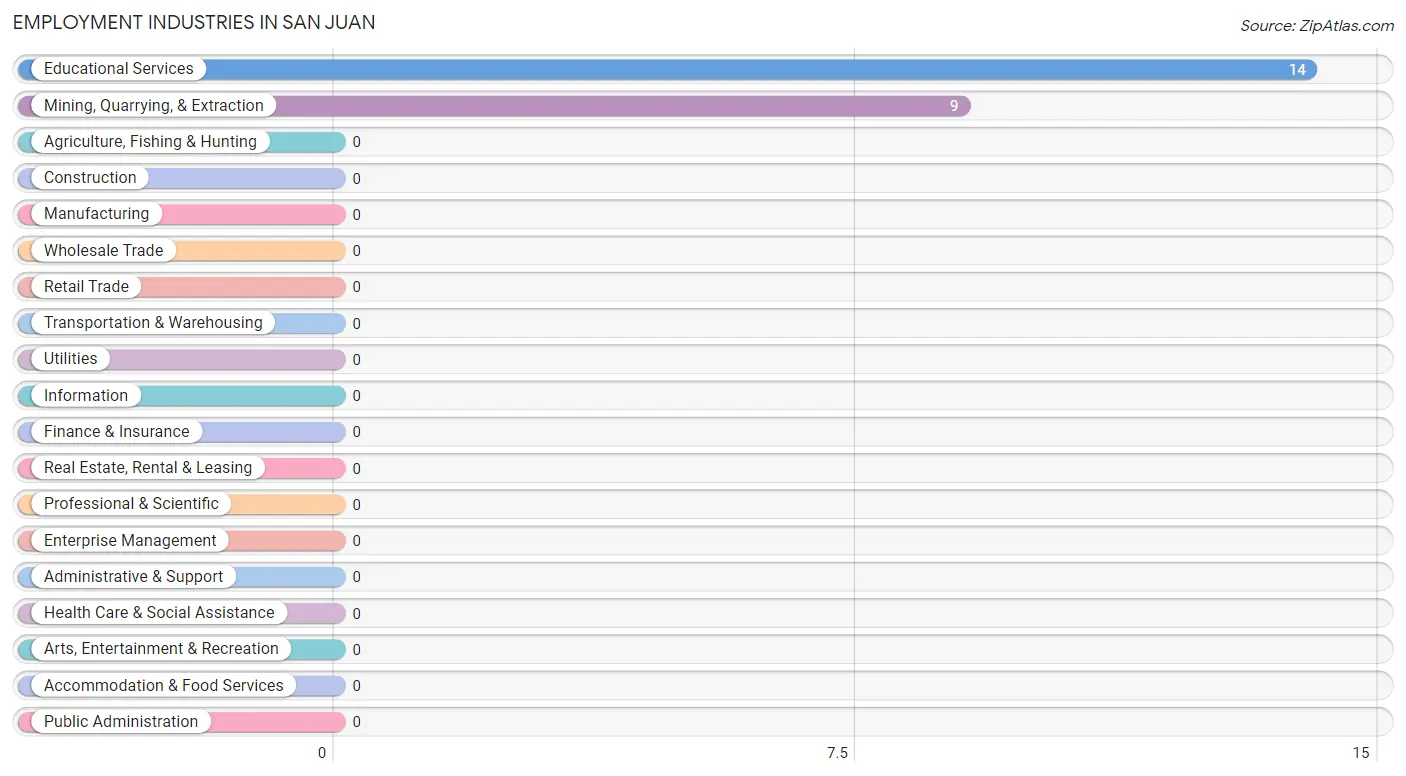
Employment Industries in San Juan
The major employment industries in San Juan include Educational Services (14 | 60.9%), and Mining, Quarrying, & Extraction (9 | 39.1%).
Employment Industries by Sex in San Juan
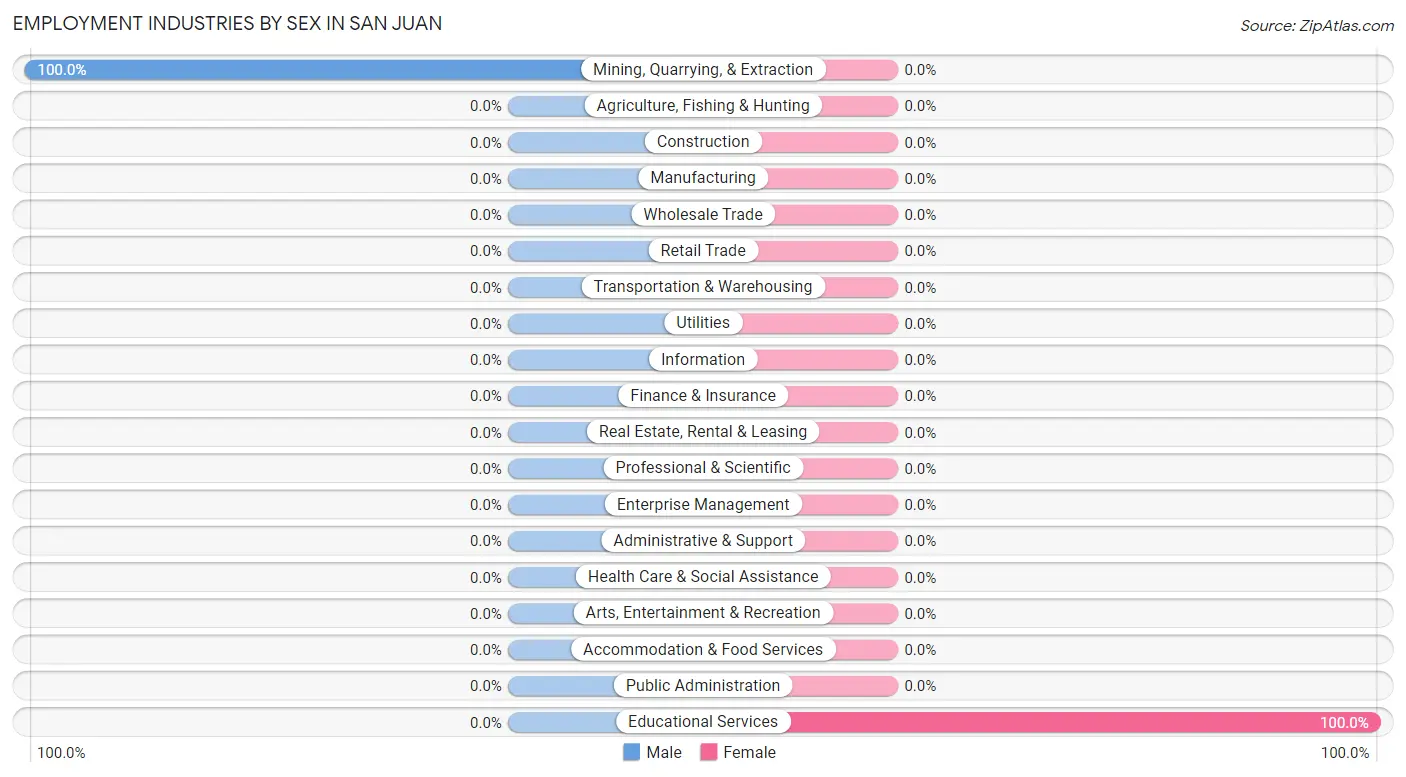
| Industry | Male | Female |
| Agriculture, Fishing & Hunting | 0 (0.0%) | 0 (0.0%) |
| Mining, Quarrying, & Extraction | 9 (100.0%) | 0 (0.0%) |
| Construction | 0 (0.0%) | 0 (0.0%) |
| Manufacturing | 0 (0.0%) | 0 (0.0%) |
| Wholesale Trade | 0 (0.0%) | 0 (0.0%) |
| Retail Trade | 0 (0.0%) | 0 (0.0%) |
| Transportation & Warehousing | 0 (0.0%) | 0 (0.0%) |
| Utilities | 0 (0.0%) | 0 (0.0%) |
| Information | 0 (0.0%) | 0 (0.0%) |
| Finance & Insurance | 0 (0.0%) | 0 (0.0%) |
| Real Estate, Rental & Leasing | 0 (0.0%) | 0 (0.0%) |
| Professional & Scientific | 0 (0.0%) | 0 (0.0%) |
| Enterprise Management | 0 (0.0%) | 0 (0.0%) |
| Administrative & Support | 0 (0.0%) | 0 (0.0%) |
| Educational Services | 0 (0.0%) | 14 (100.0%) |
| Health Care & Social Assistance | 0 (0.0%) | 0 (0.0%) |
| Arts, Entertainment & Recreation | 0 (0.0%) | 0 (0.0%) |
| Accommodation & Food Services | 0 (0.0%) | 0 (0.0%) |
| Public Administration | 0 (0.0%) | 0 (0.0%) |
| Total | 9 (39.1%) | 14 (60.9%) |
Education in San Juan
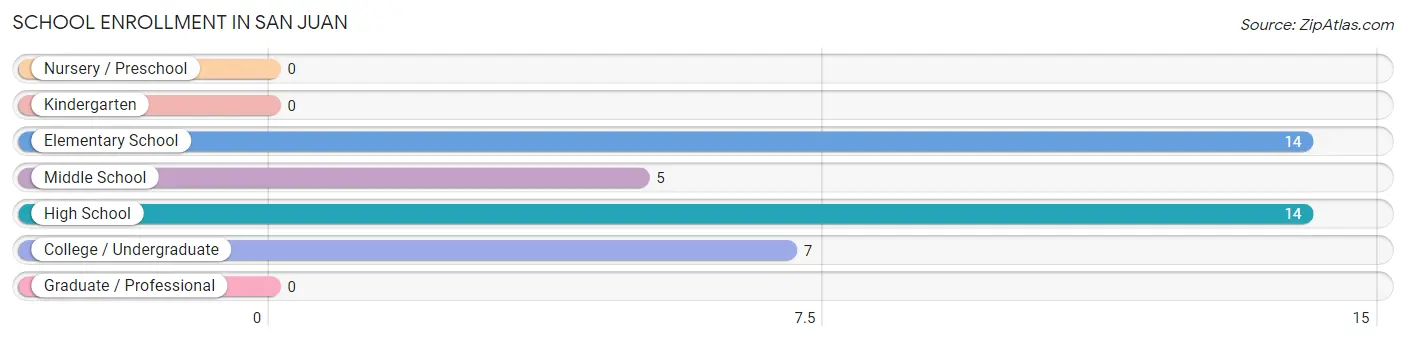
School Enrollment in San Juan
The most common levels of schooling among the 40 students in San Juan are elementary school (14 | 35.0%), high school (14 | 35.0%), and college / undergraduate (7 | 17.5%).
| School Level | # Students | % Students |
| Nursery / Preschool | 0 | 0.0% |
| Kindergarten | 0 | 0.0% |
| Elementary School | 14 | 35.0% |
| Middle School | 5 | 12.5% |
| High School | 14 | 35.0% |
| College / Undergraduate | 7 | 17.5% |
| Graduate / Professional | 0 | 0.0% |
| Total | 40 | 100.0% |
School Enrollment by Age by Funding Source in San Juan
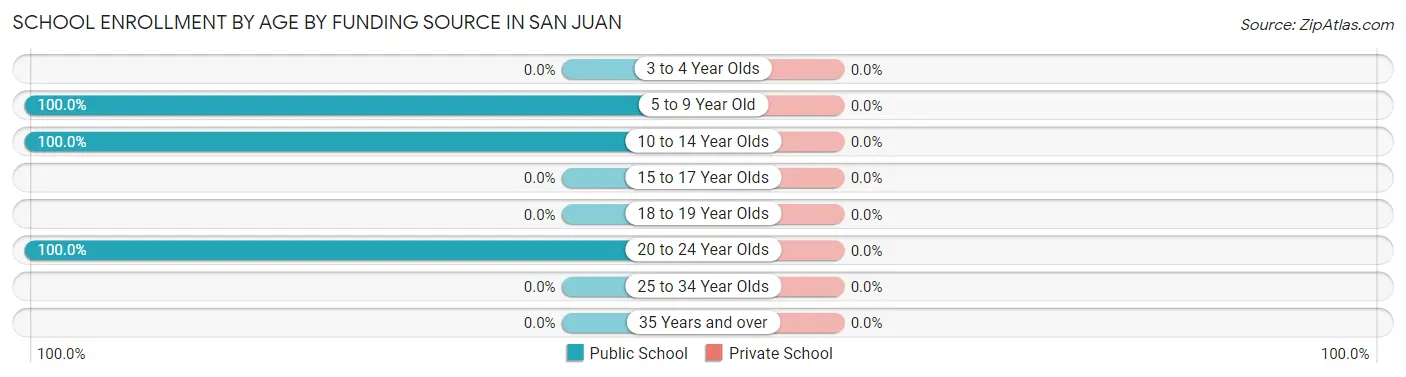
| Age Bracket | Public School | Private School |
| 3 to 4 Year Olds | 0 (0.0%) | 0 (0.0%) |
| 5 to 9 Year Old | 14 (100.0%) | 0 (0.0%) |
| 10 to 14 Year Olds | 19 (100.0%) | 0 (0.0%) |
| 15 to 17 Year Olds | 0 (0.0%) | 0 (0.0%) |
| 18 to 19 Year Olds | 0 (0.0%) | 0 (0.0%) |
| 20 to 24 Year Olds | 7 (100.0%) | 0 (0.0%) |
| 25 to 34 Year Olds | 0 (0.0%) | 0 (0.0%) |
| 35 Years and over | 0 (0.0%) | 0 (0.0%) |
| Total | 40 (100.0%) | 0 (0.0%) |
Educational Attainment by Field of Study in San Juan
Multidisciplinary studies (10 | 71.4%), and education (4 | 28.6%) are the most common fields of study among 14 individuals in San Juan who have obtained a bachelor's degree or higher.
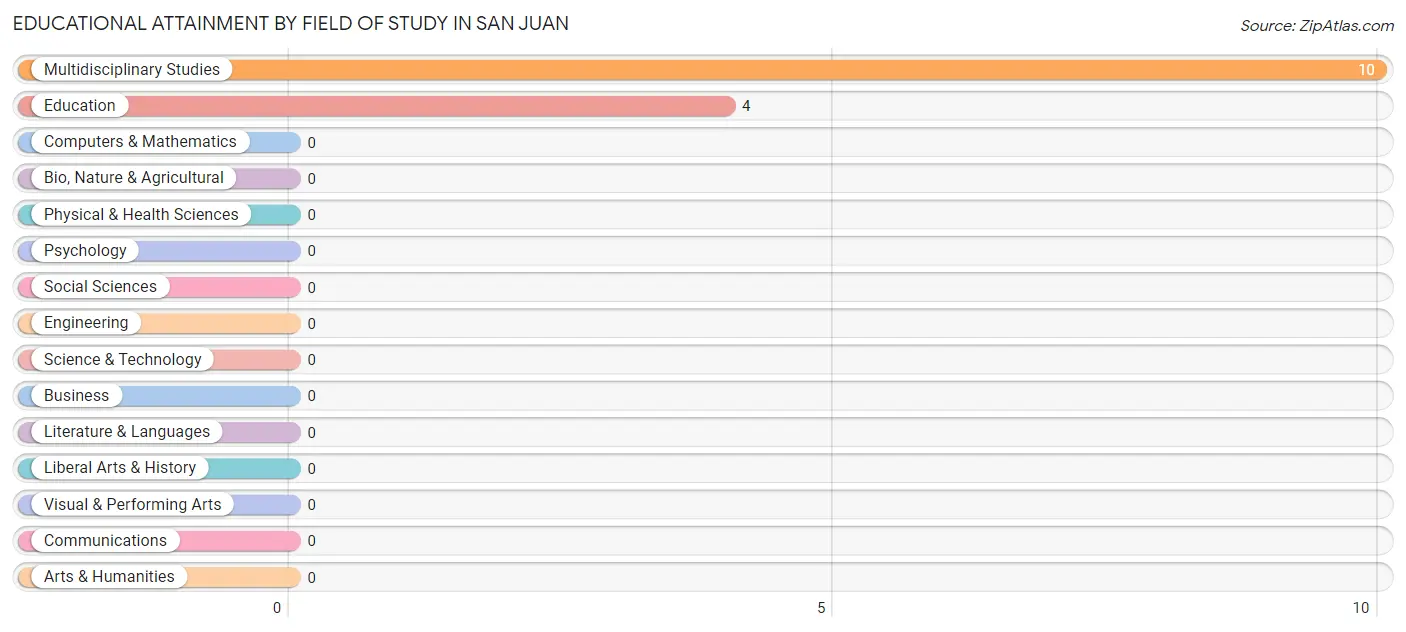
| Field of Study | # Graduates | % Graduates |
| Computers & Mathematics | 0 | 0.0% |
| Bio, Nature & Agricultural | 0 | 0.0% |
| Physical & Health Sciences | 0 | 0.0% |
| Psychology | 0 | 0.0% |
| Social Sciences | 0 | 0.0% |
| Engineering | 0 | 0.0% |
| Multidisciplinary Studies | 10 | 71.4% |
| Science & Technology | 0 | 0.0% |
| Business | 0 | 0.0% |
| Education | 4 | 28.6% |
| Literature & Languages | 0 | 0.0% |
| Liberal Arts & History | 0 | 0.0% |
| Visual & Performing Arts | 0 | 0.0% |
| Communications | 0 | 0.0% |
| Arts & Humanities | 0 | 0.0% |
| Total | 14 | 100.0% |
Transportation & Commute in San Juan
Vehicle Availability by Sex in San Juan
The most prevalent vehicle ownership categories in San Juan are males with 3 vehicles (9, accounting for 100.0%) and females with 3 vehicles (4, making up 64.3%).
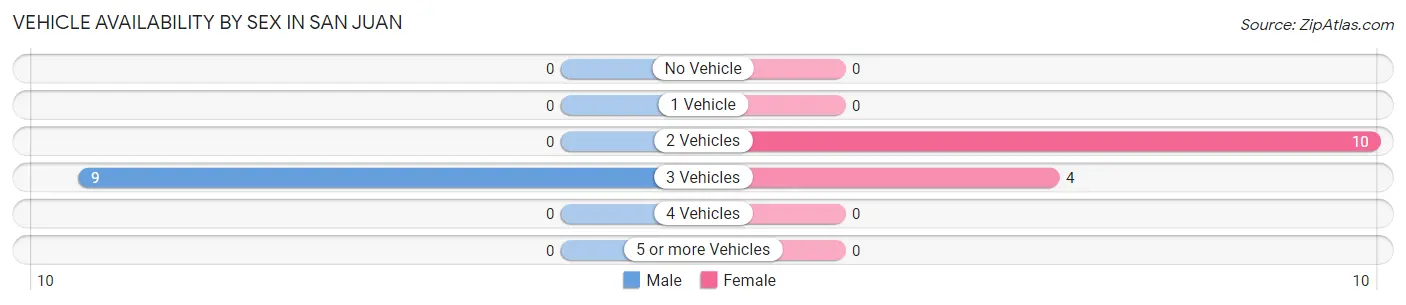
| Vehicles Available | Male | Female |
| No Vehicle | 0 (0.0%) | 0 (0.0%) |
| 1 Vehicle | 0 (0.0%) | 0 (0.0%) |
| 2 Vehicles | 0 (0.0%) | 10 (71.4%) |
| 3 Vehicles | 9 (100.0%) | 4 (28.6%) |
| 4 Vehicles | 0 (0.0%) | 0 (0.0%) |
| 5 or more Vehicles | 0 (0.0%) | 0 (0.0%) |
| Total | 9 (100.0%) | 14 (100.0%) |
Commute Time in San Juan
The most frequently occuring commute durations in San Juan are 5 to 9 minutes (14 commuters, 60.9%), 10 to 14 minutes (9 commuters, 39.1%), and less than 5 minutes (0 commuters, 0.0%).
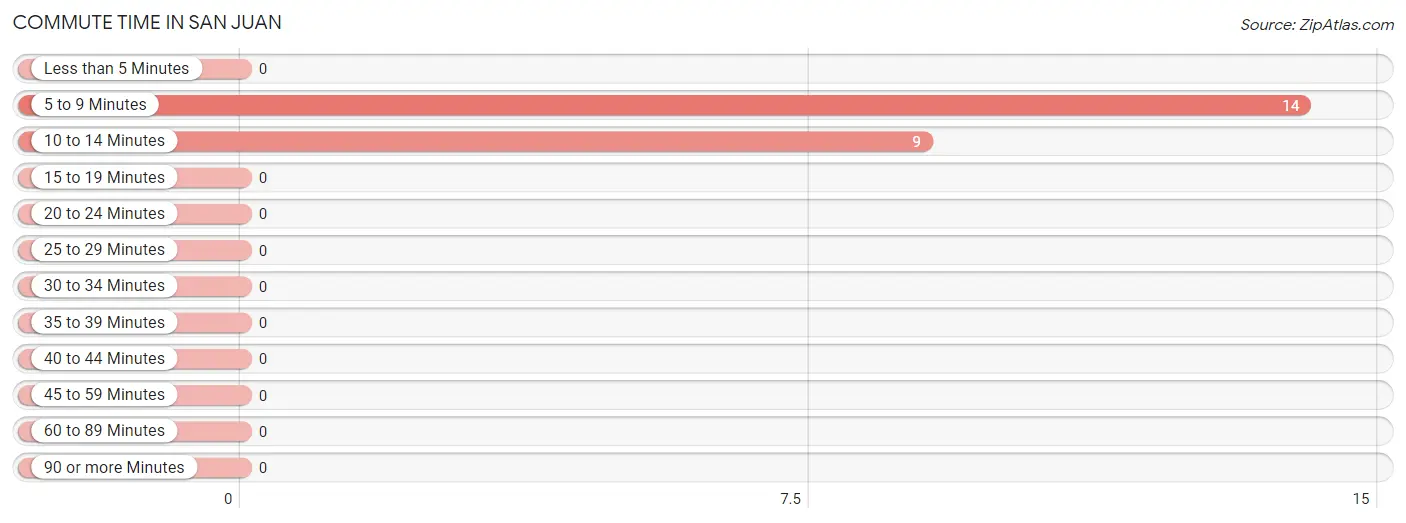
| Commute Time | # Commuters | % Commuters |
| Less than 5 Minutes | 0 | 0.0% |
| 5 to 9 Minutes | 14 | 60.9% |
| 10 to 14 Minutes | 9 | 39.1% |
| 15 to 19 Minutes | 0 | 0.0% |
| 20 to 24 Minutes | 0 | 0.0% |
| 25 to 29 Minutes | 0 | 0.0% |
| 30 to 34 Minutes | 0 | 0.0% |
| 35 to 39 Minutes | 0 | 0.0% |
| 40 to 44 Minutes | 0 | 0.0% |
| 45 to 59 Minutes | 0 | 0.0% |
| 60 to 89 Minutes | 0 | 0.0% |
| 90 or more Minutes | 0 | 0.0% |
Commute Time by Sex in San Juan
The most common commute times in San Juan are 10 to 14 minutes (9 commuters, 100.0%) for males and 5 to 9 minutes (14 commuters, 100.0%) for females.
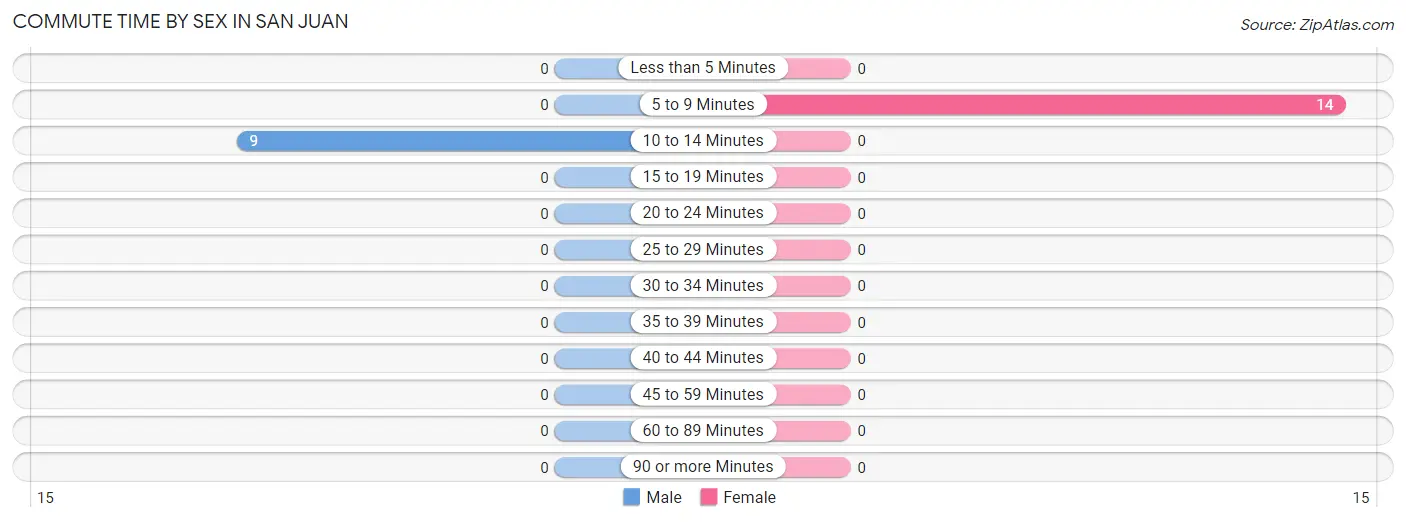
| Commute Time | Male | Female |
| Less than 5 Minutes | 0 (0.0%) | 0 (0.0%) |
| 5 to 9 Minutes | 0 (0.0%) | 14 (100.0%) |
| 10 to 14 Minutes | 9 (100.0%) | 0 (0.0%) |
| 15 to 19 Minutes | 0 (0.0%) | 0 (0.0%) |
| 20 to 24 Minutes | 0 (0.0%) | 0 (0.0%) |
| 25 to 29 Minutes | 0 (0.0%) | 0 (0.0%) |
| 30 to 34 Minutes | 0 (0.0%) | 0 (0.0%) |
| 35 to 39 Minutes | 0 (0.0%) | 0 (0.0%) |
| 40 to 44 Minutes | 0 (0.0%) | 0 (0.0%) |
| 45 to 59 Minutes | 0 (0.0%) | 0 (0.0%) |
| 60 to 89 Minutes | 0 (0.0%) | 0 (0.0%) |
| 90 or more Minutes | 0 (0.0%) | 0 (0.0%) |
Time of Departure to Work by Sex in San Juan
The most frequent times of departure to work in San Juan are 8:30 AM to 8:59 AM (9, 100.0%) for males and 7:30 AM to 7:59 AM (10, 71.4%) for females.
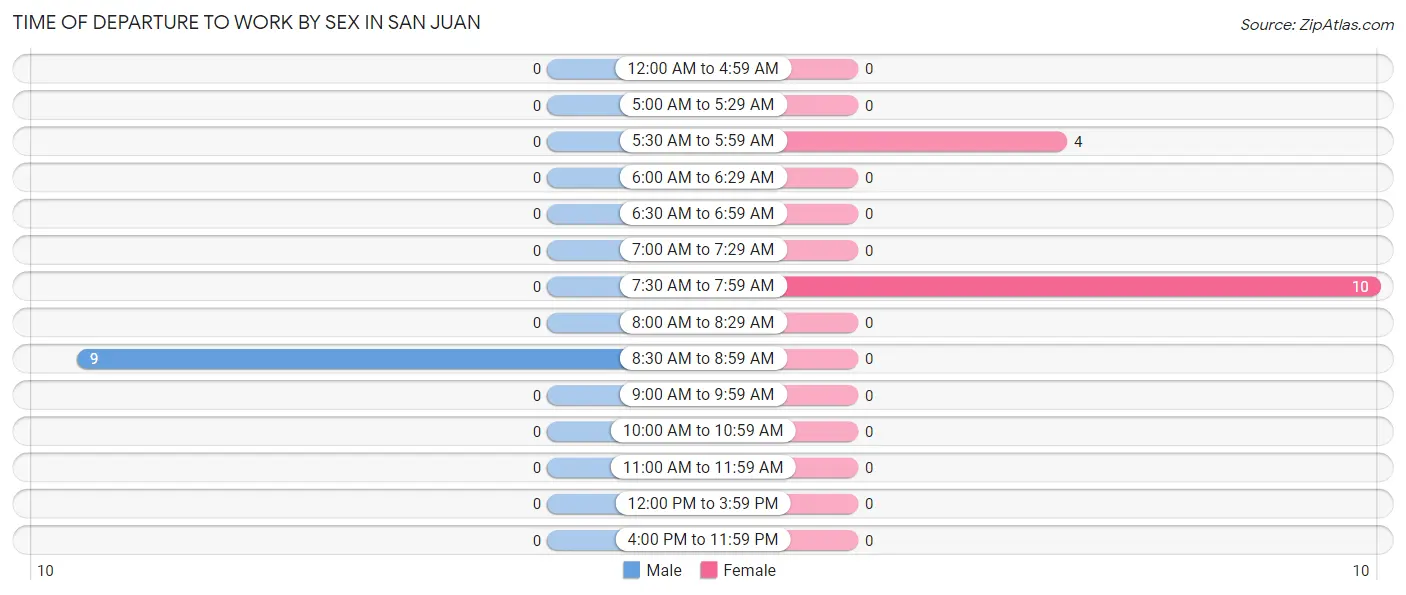
| Time of Departure | Male | Female |
| 12:00 AM to 4:59 AM | 0 (0.0%) | 0 (0.0%) |
| 5:00 AM to 5:29 AM | 0 (0.0%) | 0 (0.0%) |
| 5:30 AM to 5:59 AM | 0 (0.0%) | 4 (28.6%) |
| 6:00 AM to 6:29 AM | 0 (0.0%) | 0 (0.0%) |
| 6:30 AM to 6:59 AM | 0 (0.0%) | 0 (0.0%) |
| 7:00 AM to 7:29 AM | 0 (0.0%) | 0 (0.0%) |
| 7:30 AM to 7:59 AM | 0 (0.0%) | 10 (71.4%) |
| 8:00 AM to 8:29 AM | 0 (0.0%) | 0 (0.0%) |
| 8:30 AM to 8:59 AM | 9 (100.0%) | 0 (0.0%) |
| 9:00 AM to 9:59 AM | 0 (0.0%) | 0 (0.0%) |
| 10:00 AM to 10:59 AM | 0 (0.0%) | 0 (0.0%) |
| 11:00 AM to 11:59 AM | 0 (0.0%) | 0 (0.0%) |
| 12:00 PM to 3:59 PM | 0 (0.0%) | 0 (0.0%) |
| 4:00 PM to 11:59 PM | 0 (0.0%) | 0 (0.0%) |
| Total | 9 (100.0%) | 14 (100.0%) |
Housing Occupancy in San Juan
Occupancy by Ownership in San Juan
Of the total 9,938 dwellings in San Juan, owner-occupied units account for 7,737 (77.8%), while renter-occupied units make up 2,201 (22.2%).
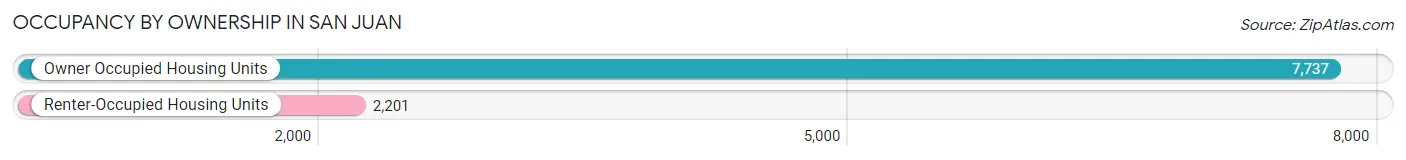
| Occupancy | # Housing Units | % Housing Units |
| Owner Occupied Housing Units | 7,737 | 77.8% |
| Renter-Occupied Housing Units | 2,201 | 22.2% |
| Total Occupied Housing Units | 9,938 | 100.0% |
Occupancy by Household Size in San Juan
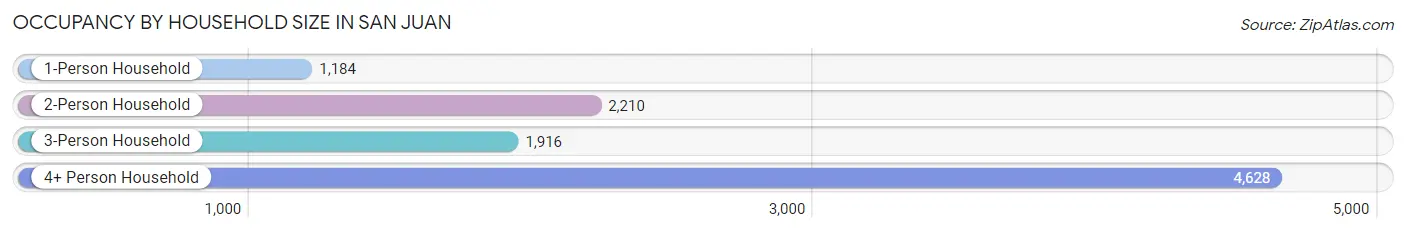
| Household Size | # Housing Units | % Housing Units |
| 1-Person Household | 1,184 | 11.9% |
| 2-Person Household | 2,210 | 22.2% |
| 3-Person Household | 1,916 | 19.3% |
| 4+ Person Household | 4,628 | 46.6% |
| Total Housing Units | 9,938 | 100.0% |
Occupancy by Ownership by Household Size in San Juan
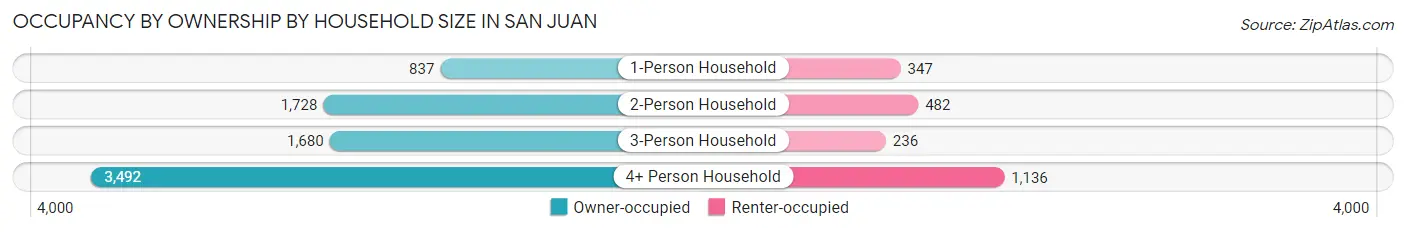
| Household Size | Owner-occupied | Renter-occupied |
| 1-Person Household | 837 (70.7%) | 347 (29.3%) |
| 2-Person Household | 1,728 (78.2%) | 482 (21.8%) |
| 3-Person Household | 1,680 (87.7%) | 236 (12.3%) |
| 4+ Person Household | 3,492 (75.4%) | 1,136 (24.5%) |
| Total Housing Units | 7,737 (77.8%) | 2,201 (22.2%) |
Occupancy by Educational Attainment in San Juan
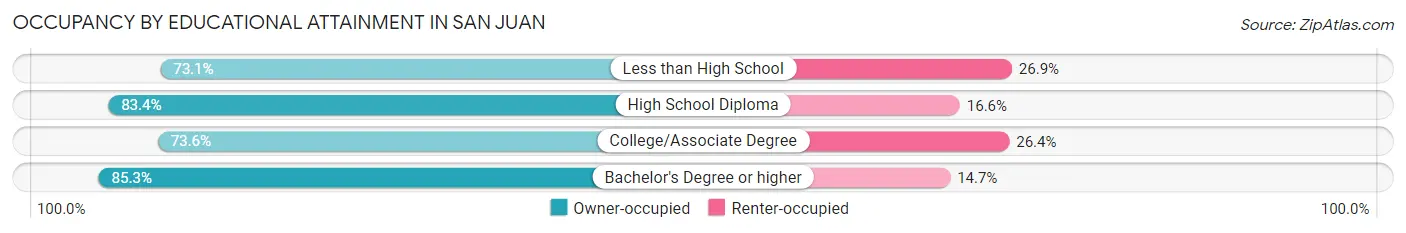
| Household Size | Owner-occupied | Renter-occupied |
| Less than High School | 2,553 (73.1%) | 940 (26.9%) |
| High School Diploma | 2,137 (83.4%) | 425 (16.6%) |
| College/Associate Degree | 1,670 (73.6%) | 599 (26.4%) |
| Bachelor's Degree or higher | 1,377 (85.3%) | 237 (14.7%) |
Occupancy by Age of Householder in San Juan
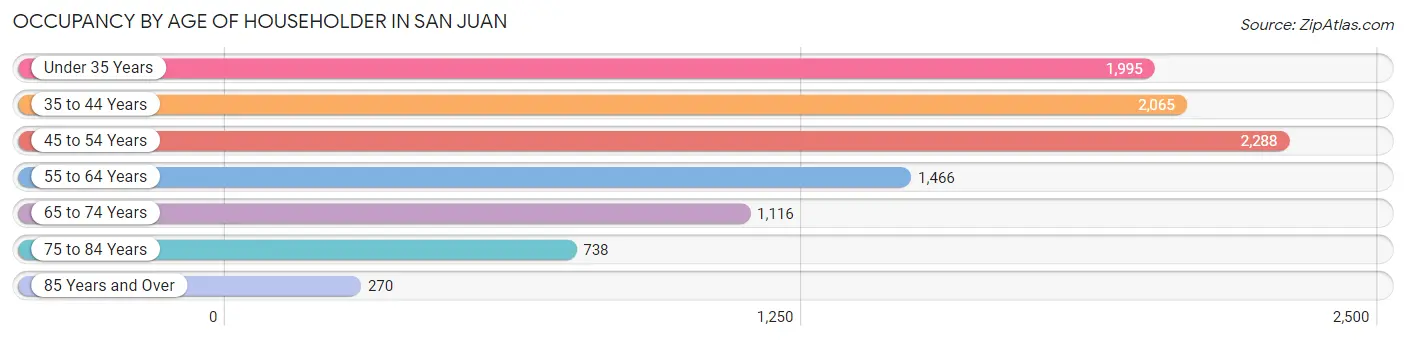
| Age Bracket | # Households | % Households |
| Under 35 Years | 1,995 | 20.1% |
| 35 to 44 Years | 2,065 | 20.8% |
| 45 to 54 Years | 2,288 | 23.0% |
| 55 to 64 Years | 1,466 | 14.7% |
| 65 to 74 Years | 1,116 | 11.2% |
| 75 to 84 Years | 738 | 7.4% |
| 85 Years and Over | 270 | 2.7% |
| Total | 9,938 | 100.0% |
Housing Finances in San Juan
Median Income by Occupancy in San Juan
| Occupancy Type | # Households | Median Income |
| Owner-Occupied | 26 (100.0%) | $0 |
| Renter-Occupied | 0 (0.0%) | $0 |
| Average | 26 (100.0%) | $0 |
Occupancy by Householder Income Bracket in San Juan
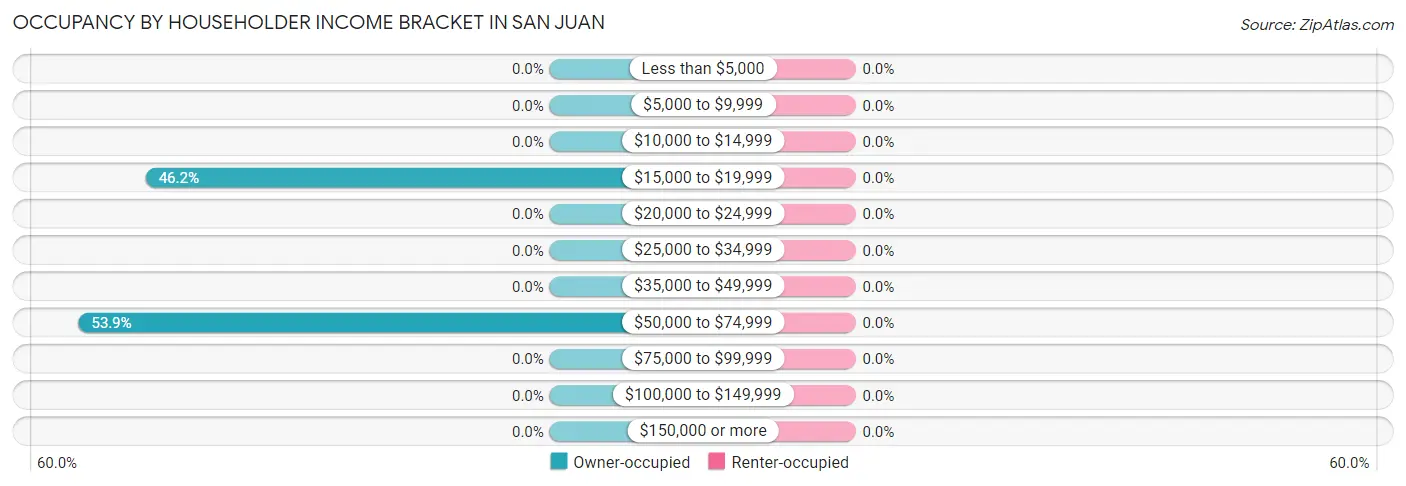
| Income Bracket | Owner-occupied | Renter-occupied |
| Less than $5,000 | 0 (0.0%) | 0 (0.0%) |
| $5,000 to $9,999 | 0 (0.0%) | 0 (0.0%) |
| $10,000 to $14,999 | 0 (0.0%) | 0 (0.0%) |
| $15,000 to $19,999 | 12 (46.2%) | 0 (0.0%) |
| $20,000 to $24,999 | 0 (0.0%) | 0 (0.0%) |
| $25,000 to $34,999 | 0 (0.0%) | 0 (0.0%) |
| $35,000 to $49,999 | 0 (0.0%) | 0 (0.0%) |
| $50,000 to $74,999 | 14 (53.8%) | 0 (0.0%) |
| $75,000 to $99,999 | 0 (0.0%) | 0 (0.0%) |
| $100,000 to $149,999 | 0 (0.0%) | 0 (0.0%) |
| $150,000 or more | 0 (0.0%) | 0 (0.0%) |
| Total | 26 (100.0%) | 0 (0.0%) |
Monthly Housing Cost Tiers in San Juan
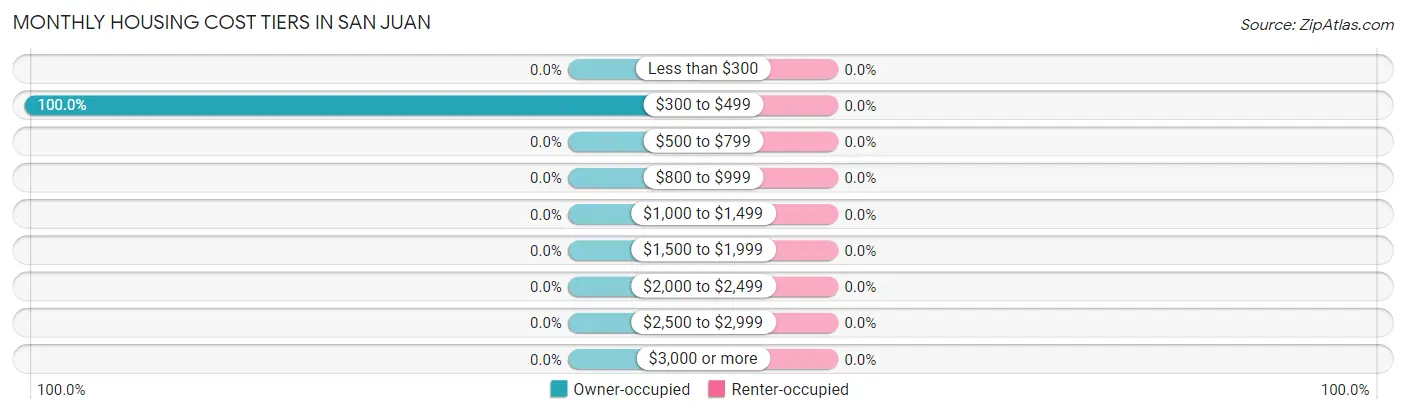
| Monthly Cost | Owner-occupied | Renter-occupied |
| Less than $300 | 0 (0.0%) | 0 (0.0%) |
| $300 to $499 | 26 (100.0%) | 0 (0.0%) |
| $500 to $799 | 0 (0.0%) | 0 (0.0%) |
| $800 to $999 | 0 (0.0%) | 0 (0.0%) |
| $1,000 to $1,499 | 0 (0.0%) | 0 (0.0%) |
| $1,500 to $1,999 | 0 (0.0%) | 0 (0.0%) |
| $2,000 to $2,499 | 0 (0.0%) | 0 (0.0%) |
| $2,500 to $2,999 | 0 (0.0%) | 0 (0.0%) |
| $3,000 or more | 0 (0.0%) | 0 (0.0%) |
| Total | 26 (100.0%) | 0 (0.0%) |
Physical Housing Characteristics in San Juan
Housing Structures in San Juan
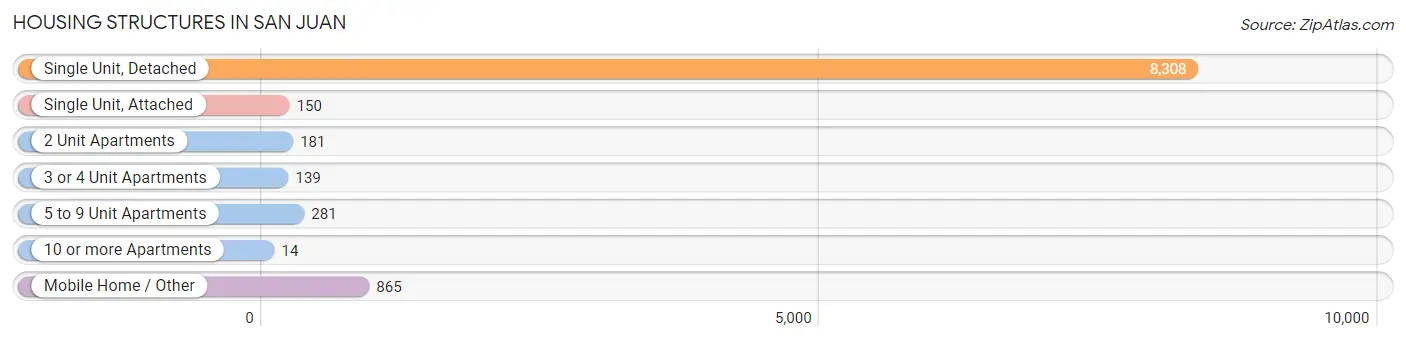
| Structure Type | # Housing Units | % Housing Units |
| Single Unit, Detached | 8,308 | 83.6% |
| Single Unit, Attached | 150 | 1.5% |
| 2 Unit Apartments | 181 | 1.8% |
| 3 or 4 Unit Apartments | 139 | 1.4% |
| 5 to 9 Unit Apartments | 281 | 2.8% |
| 10 or more Apartments | 14 | 0.1% |
| Mobile Home / Other | 865 | 8.7% |
| Total | 9,938 | 100.0% |
Housing Structures by Occupancy in San Juan
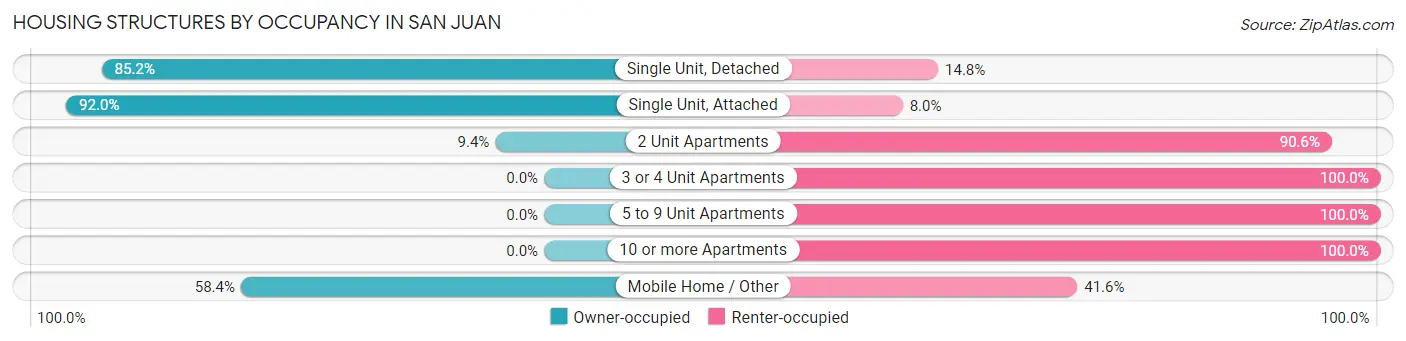
| Structure Type | Owner-occupied | Renter-occupied |
| Single Unit, Detached | 7,077 (85.2%) | 1,231 (14.8%) |
| Single Unit, Attached | 138 (92.0%) | 12 (8.0%) |
| 2 Unit Apartments | 17 (9.4%) | 164 (90.6%) |
| 3 or 4 Unit Apartments | 0 (0.0%) | 139 (100.0%) |
| 5 to 9 Unit Apartments | 0 (0.0%) | 281 (100.0%) |
| 10 or more Apartments | 0 (0.0%) | 14 (100.0%) |
| Mobile Home / Other | 505 (58.4%) | 360 (41.6%) |
| Total | 7,737 (77.8%) | 2,201 (22.2%) |
Housing Structures by Number of Rooms in San Juan
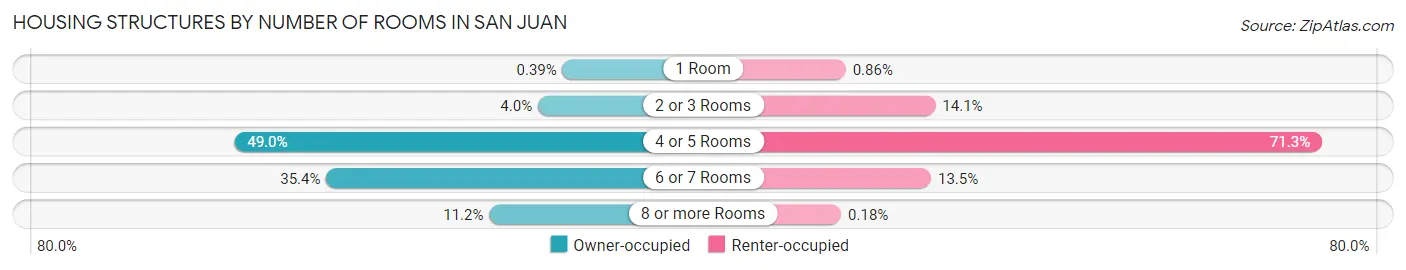
| Number of Rooms | Owner-occupied | Renter-occupied |
| 1 Room | 30 (0.4%) | 19 (0.9%) |
| 2 or 3 Rooms | 312 (4.0%) | 311 (14.1%) |
| 4 or 5 Rooms | 3,789 (49.0%) | 1,570 (71.3%) |
| 6 or 7 Rooms | 2,736 (35.4%) | 297 (13.5%) |
| 8 or more Rooms | 870 (11.2%) | 4 (0.2%) |
| Total | 7,737 (100.0%) | 2,201 (100.0%) |
Housing Structure by Heating Type in San Juan
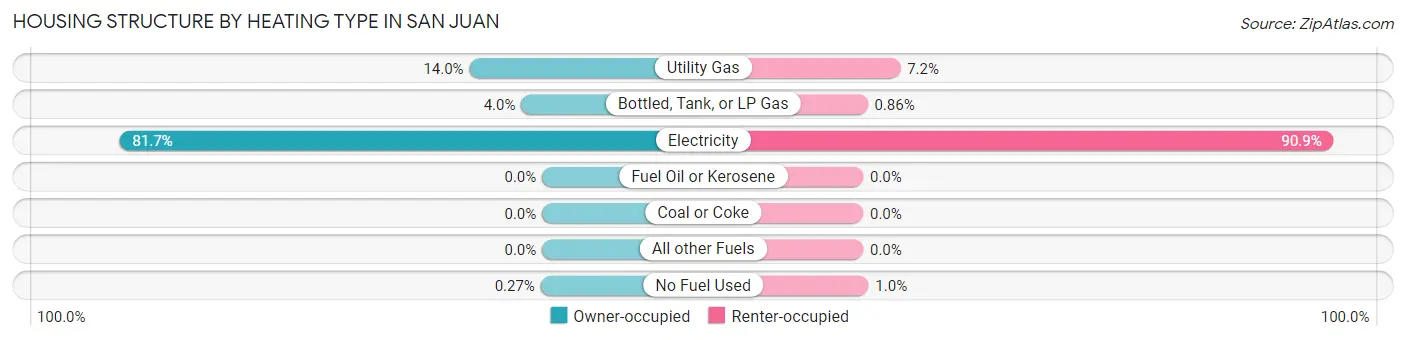
| Heating Type | Owner-occupied | Renter-occupied |
| Utility Gas | 1,086 (14.0%) | 158 (7.2%) |
| Bottled, Tank, or LP Gas | 311 (4.0%) | 19 (0.9%) |
| Electricity | 6,319 (81.7%) | 2,001 (90.9%) |
| Fuel Oil or Kerosene | 0 (0.0%) | 0 (0.0%) |
| Coal or Coke | 0 (0.0%) | 0 (0.0%) |
| All other Fuels | 0 (0.0%) | 0 (0.0%) |
| No Fuel Used | 21 (0.3%) | 23 (1.0%) |
| Total | 7,737 (100.0%) | 2,201 (100.0%) |
Household Vehicle Usage in San Juan
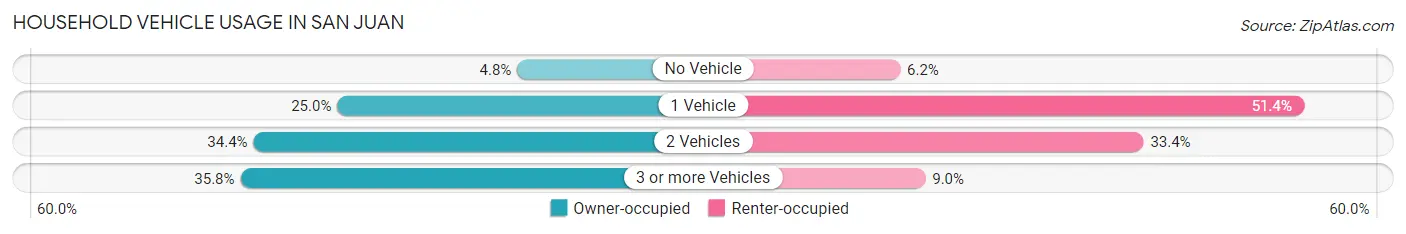
| Vehicles per Household | Owner-occupied | Renter-occupied |
| No Vehicle | 373 (4.8%) | 136 (6.2%) |
| 1 Vehicle | 1,933 (25.0%) | 1,131 (51.4%) |
| 2 Vehicles | 2,659 (34.4%) | 736 (33.4%) |
| 3 or more Vehicles | 2,772 (35.8%) | 198 (9.0%) |
| Total | 7,737 (100.0%) | 2,201 (100.0%) |
Real Estate & Mortgages in San Juan
Real Estate and Mortgage Overview in San Juan
| Characteristic | Without Mortgage | With Mortgage |
| Housing Units | 4,474 | 0 |
| Median Property Value | $80,900 | $0 |
| Median Household Income | $50,765 | $0 |
| Monthly Housing Costs | $424 | $0 |
| Real Estate Taxes | $1,467 | $0 |
Property Value by Mortgage Status in San Juan
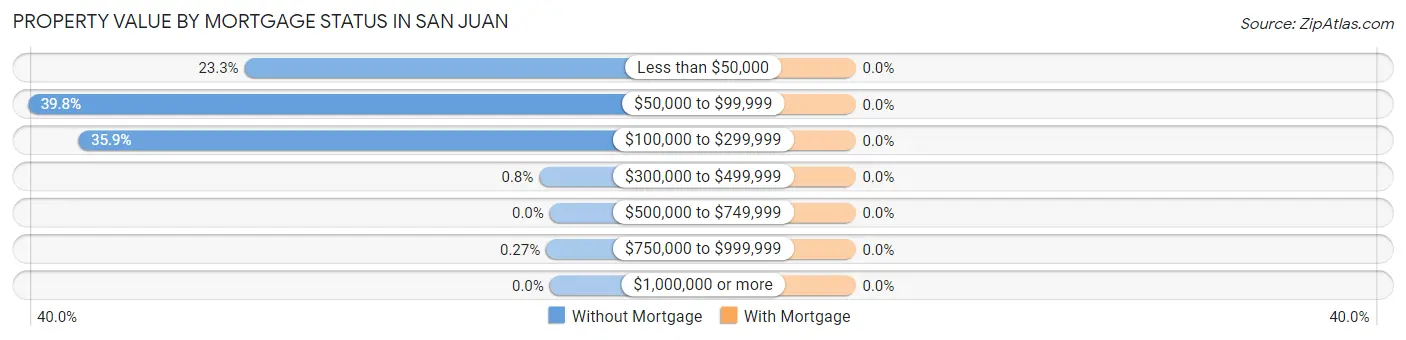
| Property Value | Without Mortgage | With Mortgage |
| Less than $50,000 | 1,040 (23.3%) | 0 (0.0%) |
| $50,000 to $99,999 | 1,779 (39.8%) | 0 (0.0%) |
| $100,000 to $299,999 | 1,607 (35.9%) | 0 (0.0%) |
| $300,000 to $499,999 | 36 (0.8%) | 0 (0.0%) |
| $500,000 to $749,999 | 0 (0.0%) | 0 (0.0%) |
| $750,000 to $999,999 | 12 (0.3%) | 0 (0.0%) |
| $1,000,000 or more | 0 (0.0%) | 0 (0.0%) |
| Total | 4,474 (100.0%) | 0 (0.0%) |
Household Income by Mortgage Status in San Juan
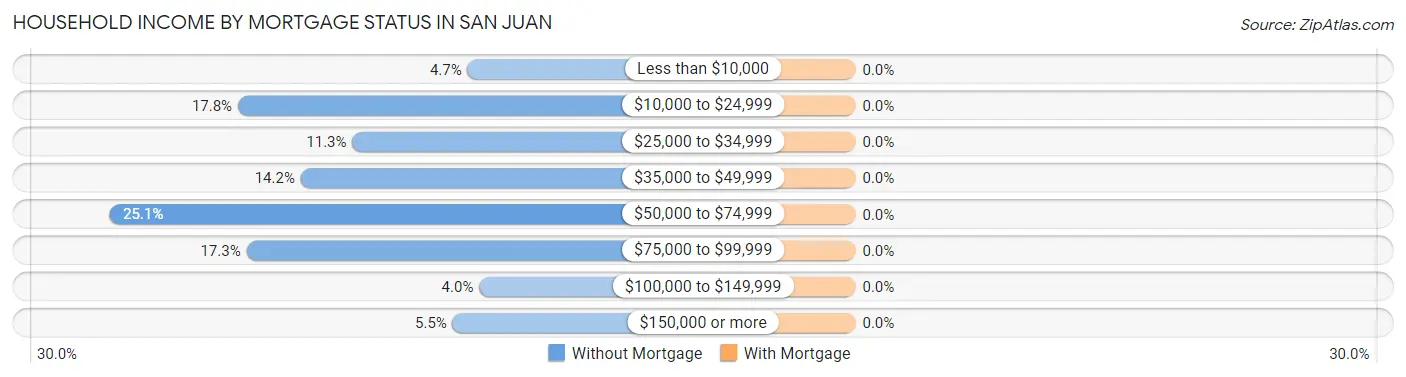
| Household Income | Without Mortgage | With Mortgage |
| Less than $10,000 | 210 (4.7%) | 0 (0.0%) |
| $10,000 to $24,999 | 797 (17.8%) | 0 (0.0%) |
| $25,000 to $34,999 | 504 (11.3%) | 0 (0.0%) |
| $35,000 to $49,999 | 636 (14.2%) | 0 (0.0%) |
| $50,000 to $74,999 | 1,124 (25.1%) | 0 (0.0%) |
| $75,000 to $99,999 | 775 (17.3%) | 0 (0.0%) |
| $100,000 to $149,999 | 180 (4.0%) | 0 (0.0%) |
| $150,000 or more | 248 (5.5%) | 0 (0.0%) |
| Total | 4,474 (100.0%) | 0 (0.0%) |
Property Value to Household Income Ratio in San Juan
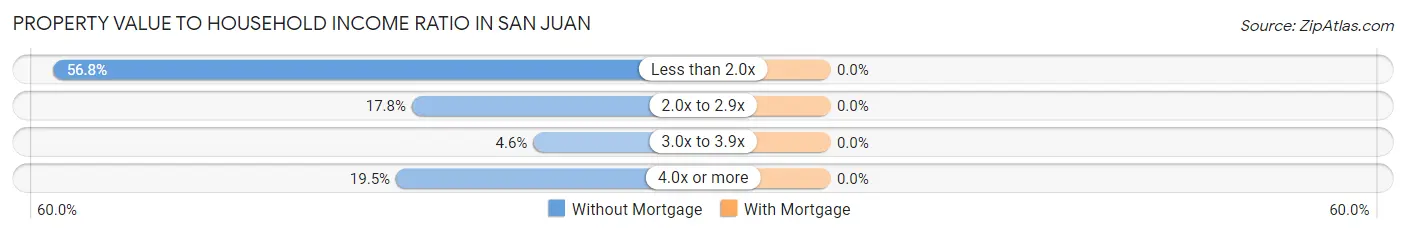
| Value-to-Income Ratio | Without Mortgage | With Mortgage |
| Less than 2.0x | 2,542 (56.8%) | 0 (0.0%) |
| 2.0x to 2.9x | 797 (17.8%) | 0 (0.0%) |
| 3.0x to 3.9x | 205 (4.6%) | 0 (0.0%) |
| 4.0x or more | 874 (19.5%) | 0 (0.0%) |
| Total | 4,474 (100.0%) | 0 (0.0%) |
Real Estate Taxes by Mortgage Status in San Juan
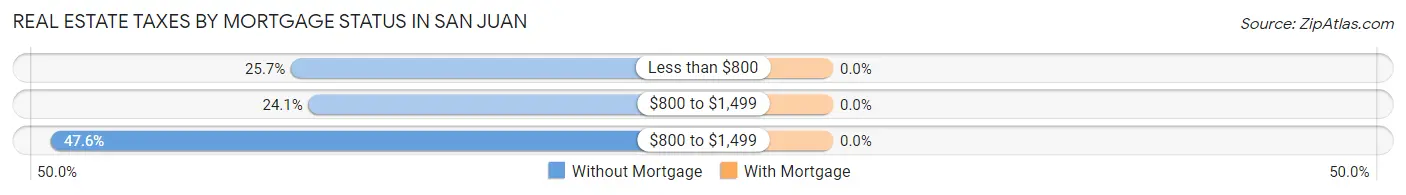
| Property Taxes | Without Mortgage | With Mortgage |
| Less than $800 | 1,148 (25.7%) | 0 (0.0%) |
| $800 to $1,499 | 1,077 (24.1%) | 0 (0.0%) |
| $800 to $1,499 | 2,129 (47.6%) | 0 (0.0%) |
| Total | 4,474 (100.0%) | 0 (0.0%) |
Health & Disability in San Juan
Health Insurance Coverage by Age in San Juan
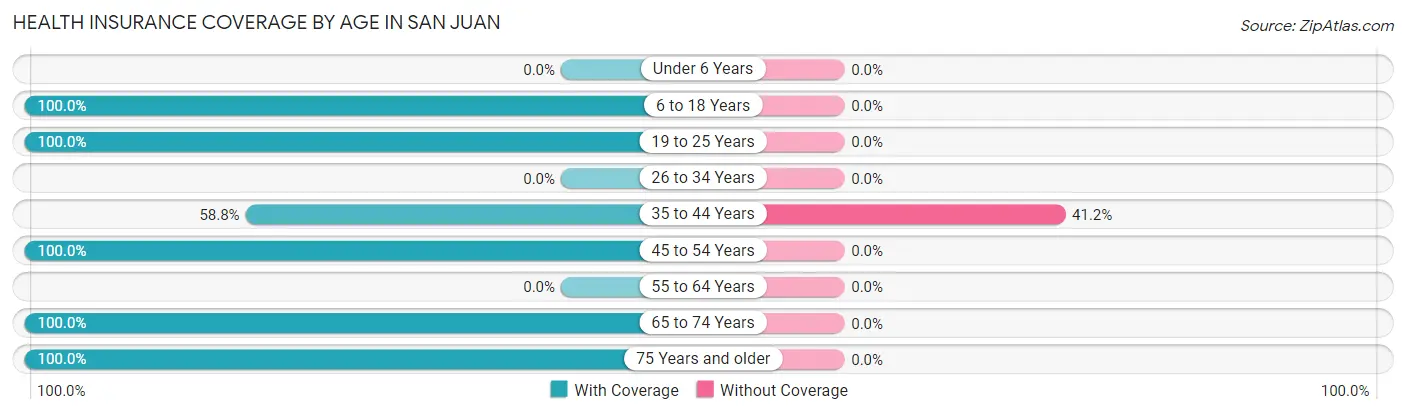
| Age Bracket | With Coverage | Without Coverage |
| Under 6 Years | 0 (0.0%) | 0 (0.0%) |
| 6 to 18 Years | 33 (100.0%) | 0 (0.0%) |
| 19 to 25 Years | 16 (100.0%) | 0 (0.0%) |
| 26 to 34 Years | 0 (0.0%) | 0 (0.0%) |
| 35 to 44 Years | 10 (58.8%) | 7 (41.2%) |
| 45 to 54 Years | 4 (100.0%) | 0 (0.0%) |
| 55 to 64 Years | 0 (0.0%) | 0 (0.0%) |
| 65 to 74 Years | 12 (100.0%) | 0 (0.0%) |
| 75 Years and older | 13 (100.0%) | 0 (0.0%) |
| Total | 88 (92.6%) | 7 (7.4%) |
Health Insurance Coverage by Citizenship Status in San Juan
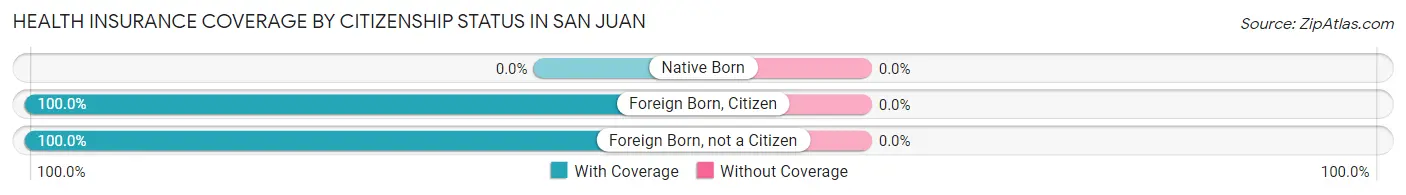
| Citizenship Status | With Coverage | Without Coverage |
| Native Born | 0 (0.0%) | 0 (0.0%) |
| Foreign Born, Citizen | 33 (100.0%) | 0 (0.0%) |
| Foreign Born, not a Citizen | 16 (100.0%) | 0 (0.0%) |
Health Insurance Coverage by Household Income in San Juan
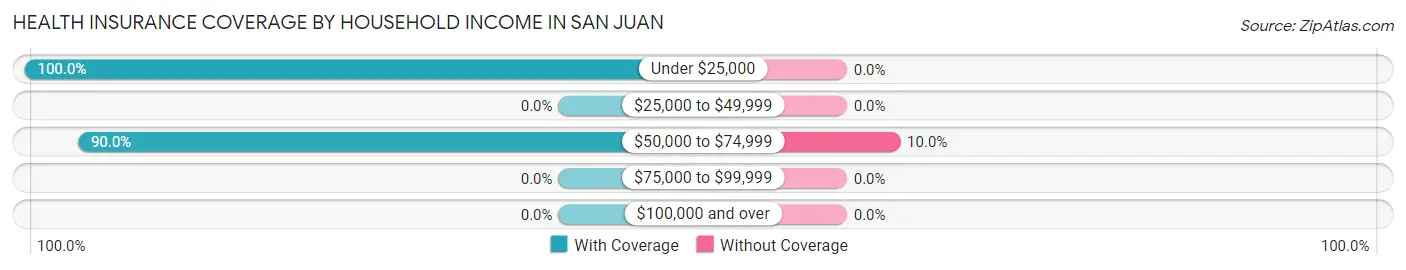
| Household Income | With Coverage | Without Coverage |
| Under $25,000 | 25 (100.0%) | 0 (0.0%) |
| $25,000 to $49,999 | 0 (0.0%) | 0 (0.0%) |
| $50,000 to $74,999 | 63 (90.0%) | 7 (10.0%) |
| $75,000 to $99,999 | 0 (0.0%) | 0 (0.0%) |
| $100,000 and over | 0 (0.0%) | 0 (0.0%) |
Public vs Private Health Insurance Coverage by Age in San Juan
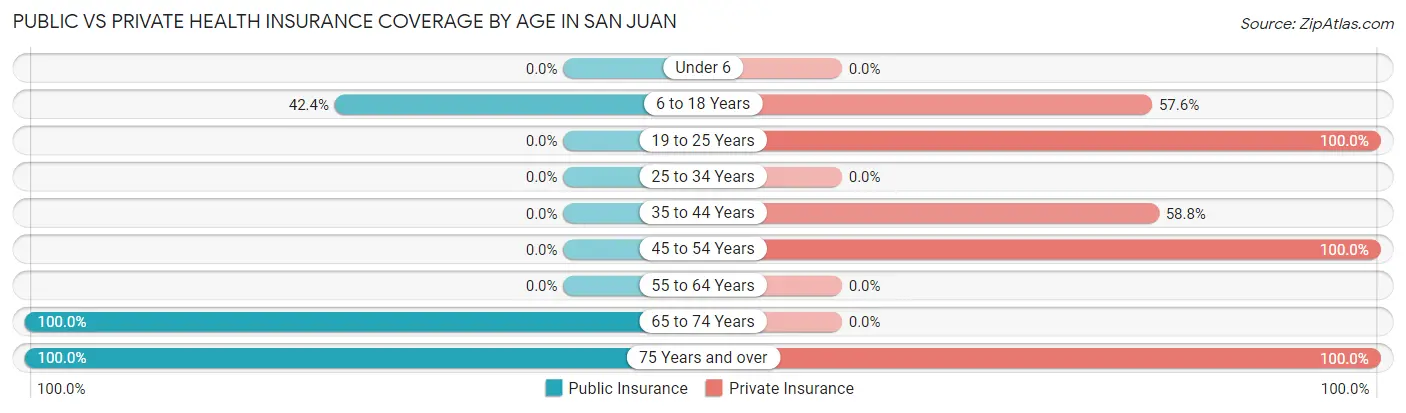
| Age Bracket | Public Insurance | Private Insurance |
| Under 6 | 0 (0.0%) | 0 (0.0%) |
| 6 to 18 Years | 14 (42.4%) | 19 (57.6%) |
| 19 to 25 Years | 0 (0.0%) | 16 (100.0%) |
| 25 to 34 Years | 0 (0.0%) | 0 (0.0%) |
| 35 to 44 Years | 0 (0.0%) | 10 (58.8%) |
| 45 to 54 Years | 0 (0.0%) | 4 (100.0%) |
| 55 to 64 Years | 0 (0.0%) | 0 (0.0%) |
| 65 to 74 Years | 12 (100.0%) | 0 (0.0%) |
| 75 Years and over | 13 (100.0%) | 13 (100.0%) |
| Total | 39 (41.0%) | 62 (65.3%) |
Disability Status by Sex by Age in San Juan
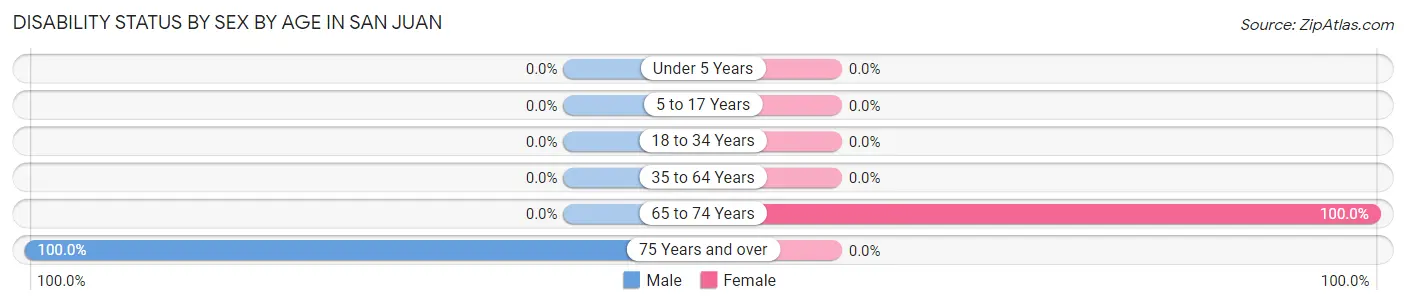
| Age Bracket | Male | Female |
| Under 5 Years | 0 (0.0%) | 0 (0.0%) |
| 5 to 17 Years | 0 (0.0%) | 0 (0.0%) |
| 18 to 34 Years | 0 (0.0%) | 0 (0.0%) |
| 35 to 64 Years | 0 (0.0%) | 0 (0.0%) |
| 65 to 74 Years | 0 (0.0%) | 12 (100.0%) |
| 75 Years and over | 13 (100.0%) | 0 (0.0%) |
Disability Class by Sex by Age in San Juan
Disability Class: Hearing Difficulty
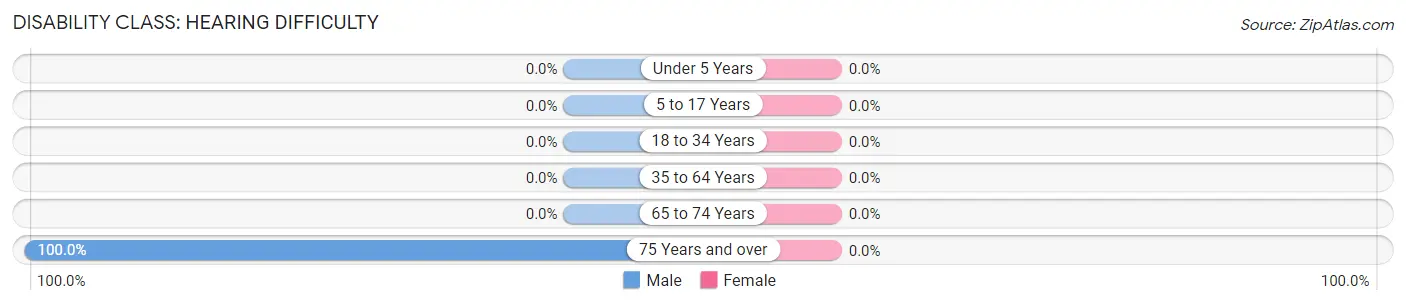
| Age Bracket | Male | Female |
| Under 5 Years | 0 (0.0%) | 0 (0.0%) |
| 5 to 17 Years | 0 (0.0%) | 0 (0.0%) |
| 18 to 34 Years | 0 (0.0%) | 0 (0.0%) |
| 35 to 64 Years | 0 (0.0%) | 0 (0.0%) |
| 65 to 74 Years | 0 (0.0%) | 0 (0.0%) |
| 75 Years and over | 13 (100.0%) | 0 (0.0%) |
Disability Class: Vision Difficulty
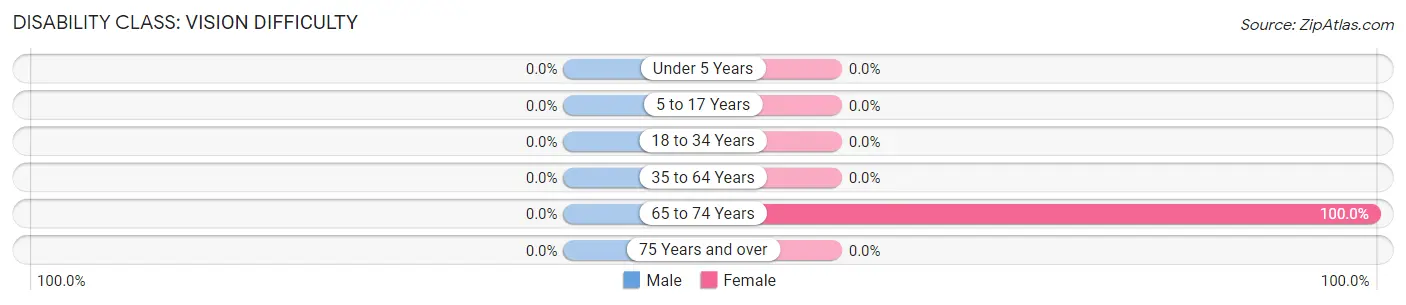
| Age Bracket | Male | Female |
| Under 5 Years | 0 (0.0%) | 0 (0.0%) |
| 5 to 17 Years | 0 (0.0%) | 0 (0.0%) |
| 18 to 34 Years | 0 (0.0%) | 0 (0.0%) |
| 35 to 64 Years | 0 (0.0%) | 0 (0.0%) |
| 65 to 74 Years | 0 (0.0%) | 12 (100.0%) |
| 75 Years and over | 0 (0.0%) | 0 (0.0%) |
Disability Class: Cognitive Difficulty
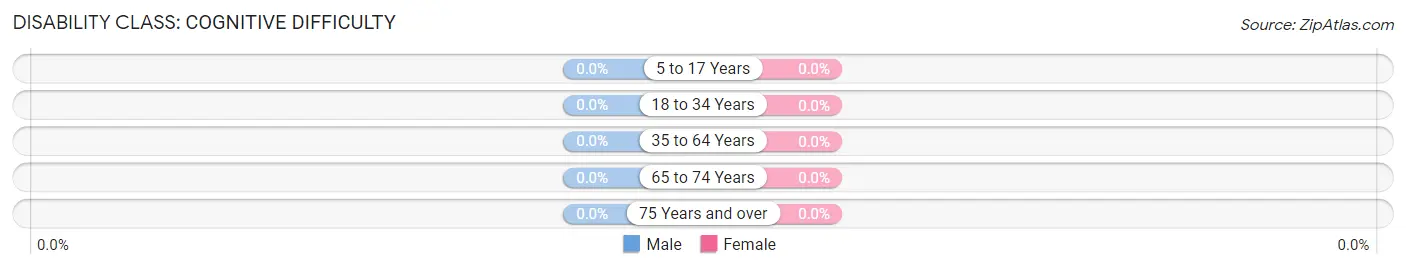
| Age Bracket | Male | Female |
| 5 to 17 Years | 0 (0.0%) | 0 (0.0%) |
| 18 to 34 Years | 0 (0.0%) | 0 (0.0%) |
| 35 to 64 Years | 0 (0.0%) | 0 (0.0%) |
| 65 to 74 Years | 0 (0.0%) | 0 (0.0%) |
| 75 Years and over | 0 (0.0%) | 0 (0.0%) |
Disability Class: Ambulatory Difficulty
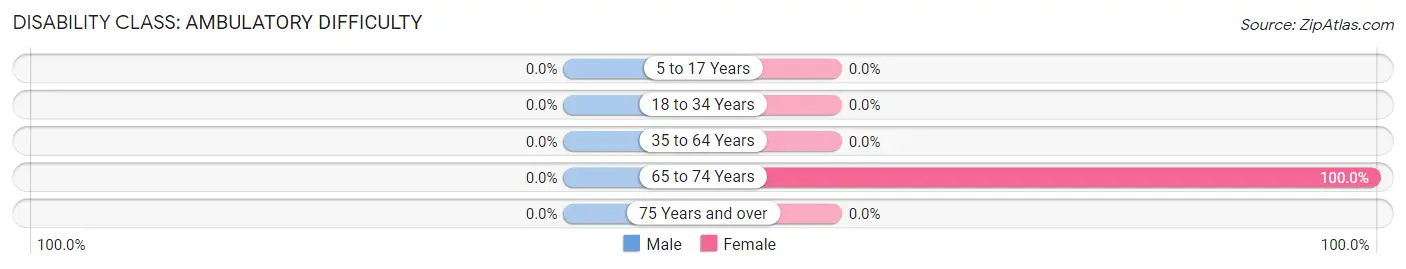
| Age Bracket | Male | Female |
| 5 to 17 Years | 0 (0.0%) | 0 (0.0%) |
| 18 to 34 Years | 0 (0.0%) | 0 (0.0%) |
| 35 to 64 Years | 0 (0.0%) | 0 (0.0%) |
| 65 to 74 Years | 0 (0.0%) | 12 (100.0%) |
| 75 Years and over | 0 (0.0%) | 0 (0.0%) |
Disability Class: Self-Care Difficulty

| Age Bracket | Male | Female |
| 5 to 17 Years | 0 (0.0%) | 0 (0.0%) |
| 18 to 34 Years | 0 (0.0%) | 0 (0.0%) |
| 35 to 64 Years | 0 (0.0%) | 0 (0.0%) |
| 65 to 74 Years | 0 (0.0%) | 12 (100.0%) |
| 75 Years and over | 0 (0.0%) | 0 (0.0%) |
Technology Access in San Juan
Computing Device Access in San Juan
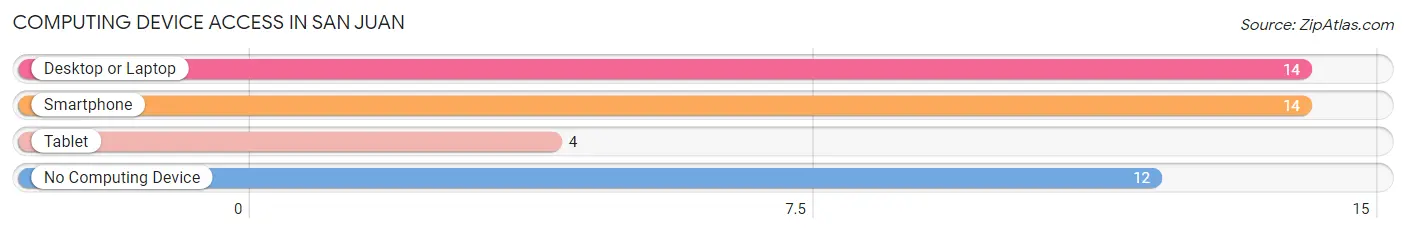
| Device Type | # Households | % Households |
| Desktop or Laptop | 14 | 53.8% |
| Smartphone | 14 | 53.8% |
| Tablet | 4 | 15.4% |
| No Computing Device | 12 | 46.2% |
| Total | 26 | 100.0% |
Internet Access in San Juan
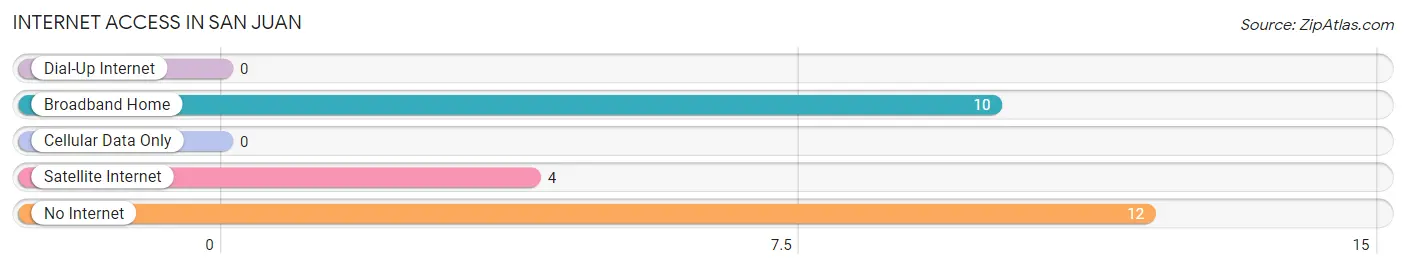
| Internet Type | # Households | % Households |
| Dial-Up Internet | 0 | 0.0% |
| Broadband Home | 10 | 38.5% |
| Cellular Data Only | 0 | 0.0% |
| Satellite Internet | 4 | 15.4% |
| No Internet | 12 | 46.2% |
| Total | 26 | 100.0% |
San Juan Summary
San Juan, Texas is a small city located in Hidalgo County, Texas. It is situated on the Rio Grande River, just south of the city of McAllen. The city has a population of approximately 15,000 people and is part of the McAllen-Edinburg-Mission Metropolitan Statistical Area.
History
San Juan was founded in 1848 by a group of settlers from the Mexican state of Tamaulipas. The settlers named the town after the San Juan de Dios River, which flows through the area. The town was originally a farming community, but in the late 19th century, it began to develop into a commercial center. In the early 20th century, the town was home to a number of businesses, including a cotton gin, a flour mill, and a brick factory.
In the 1950s, San Juan began to experience rapid growth due to the influx of Mexican immigrants. The population of the city increased from 2,000 in 1950 to over 15,000 in 2000. This growth was largely due to the city's proximity to the Mexican border and its access to the Rio Grande River.
Geography
San Juan is located in the Rio Grande Valley of South Texas. The city is situated on the Rio Grande River, just south of the city of McAllen. The city is surrounded by agricultural land and is located near the Santa Ana National Wildlife Refuge. The climate in San Juan is subtropical, with hot summers and mild winters.
Economy
San Juan's economy is largely based on agriculture and tourism. The city is home to a number of agricultural businesses, including farms, ranches, and nurseries. The city is also home to a number of tourist attractions, including the Santa Ana National Wildlife Refuge, the San Juan National Historic Site, and the San Juan Museum of Art.
Demographics
As of the 2010 census, the population of San Juan was 15,746. The racial makeup of the city was 79.3% Hispanic or Latino, 16.2% White, 0.7% African American, 0.3% Native American, 0.1% Asian, and 3.4% from other races. The median household income in San Juan was $25,945, and the median family income was $30,945. The per capita income in San Juan was $12,945.
Conclusion
San Juan, Texas is a small city located in Hidalgo County, Texas. It is situated on the Rio Grande River, just south of the city of McAllen. The city has a population of approximately 15,000 people and is part of the McAllen-Edinburg-Mission Metropolitan Statistical Area. San Juan's economy is largely based on agriculture and tourism, and the city is home to a number of tourist attractions. The population of San Juan is largely Hispanic or Latino, and the median household income in the city is $25,945.
Common Questions
What is Per Capita Income in San Juan?
Per Capita income in San Juan is $11,633.
What is Income or Wage Gap in San Juan?
Income or Wage Gap in San Juan is 36.9%.
Women in San Juan earn 63.1 cents for every dollar earned by a man.
What is Inequality or Gini Index in San Juan?
Inequality or Gini Index in San Juan is 0.28.
What is the Total Population of San Juan?
Total Population of San Juan is 95.
What is the Total Male Population of San Juan?
Total Male Population of San Juan is 57.
What is the Total Female Population of San Juan?
Total Female Population of San Juan is 38.
What is the Ratio of Males per 100 Females in San Juan?
There are 150.00 Males per 100 Females in San Juan.
What is the Ratio of Females per 100 Males in San Juan?
There are 66.67 Females per 100 Males in San Juan.
What is the Median Population Age in San Juan?
Median Population Age in San Juan is 23.8 Years.
What is the Average Family Size in San Juan
Average Family Size in San Juan is 3.6 People.
What is the Average Household Size in San Juan
Average Household Size in San Juan is 3.6 People.
How Large is the Labor Force in San Juan?
There are 23 People in the Labor Forcein in San Juan.
What is the Percentage of People in the Labor Force in San Juan?
37.1% of People are in the Labor Force in San Juan.