Zip Codes with the Highest Percentage of Population Employed in Food Preparation & Serving in Gilmer, TX
RELATED REPORTS & OPTIONS
Food Preparation & Serving
Gilmer
Compare Zip Codes
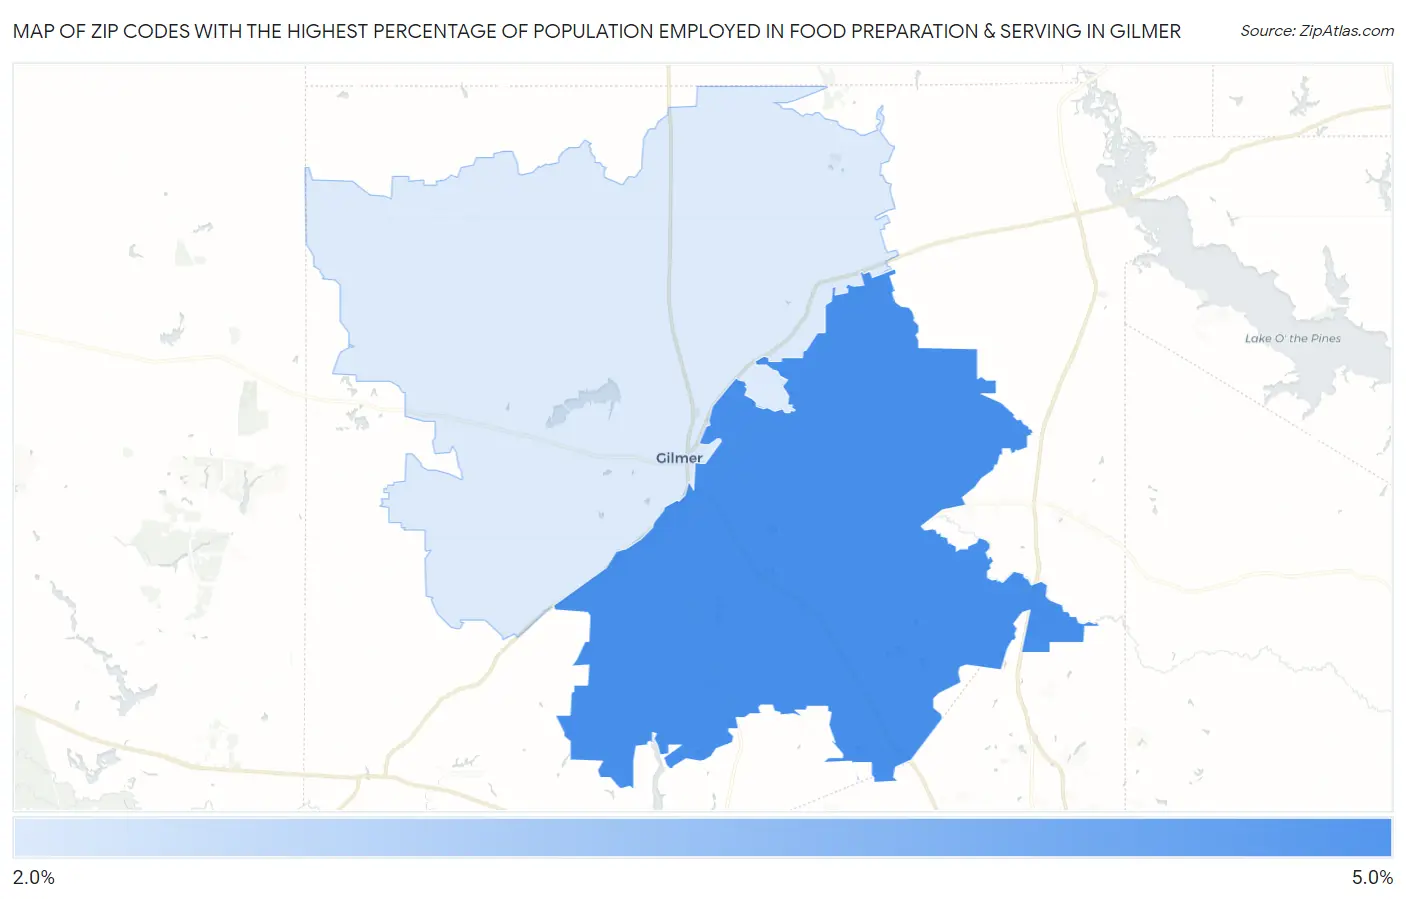
Map of Zip Codes with the Highest Percentage of Population Employed in Food Preparation & Serving in Gilmer
2.0%
4.4%
Zip Codes with the Highest Percentage of Population Employed in Food Preparation & Serving in Gilmer, TX
| Zip Code | % Employed | vs State | vs National | |
| 1. | 75645 | 4.4% | 5.4%(-0.910)#933 | 5.3%(-0.844)#15,239 |
| 2. | 75644 | 2.0% | 5.4%(-3.32)#1,432 | 5.3%(-3.25)#24,607 |
1
Common Questions
What are the Top Zip Codes with the Highest Percentage of Population Employed in Food Preparation & Serving in Gilmer, TX?
Top Zip Codes with the Highest Percentage of Population Employed in Food Preparation & Serving in Gilmer, TX are:
What zip code has the Highest Percentage of Population Employed in Food Preparation & Serving in Gilmer, TX?
75645 has the Highest Percentage of Population Employed in Food Preparation & Serving in Gilmer, TX with 4.4%.
What is the Percentage of Population Employed in Food Preparation & Serving in Gilmer, TX?
Percentage of Population Employed in Food Preparation & Serving in Gilmer is 4.0%.
What is the Percentage of Population Employed in Food Preparation & Serving in Texas?
Percentage of Population Employed in Food Preparation & Serving in Texas is 5.4%.
What is the Percentage of Population Employed in Food Preparation & Serving in the United States?
Percentage of Population Employed in Food Preparation & Serving in the United States is 5.3%.