Markham, TX Map & Demographics
Markham Map
Markham Overview
$16,392
PER CAPITA INCOME
$46,313
AVG FAMILY INCOME
$59,410
AVG HOUSEHOLD INCOME
0.37
INEQUALITY / GINI INDEX
1,222
TOTAL POPULATION
587
MALE POPULATION
635
FEMALE POPULATION
92.44
MALES / 100 FEMALES
108.18
FEMALES / 100 MALES
20.7
MEDIAN AGE
4.1
AVG FAMILY SIZE
3.7
AVG HOUSEHOLD SIZE
330
LABOR FORCE [ PEOPLE ]
39.2%
PERCENT IN LABOR FORCE
Markham Zip Codes
Income in Markham
Income Overview in Markham
Per Capita Income in Markham is $16,392, while median incomes of families and households are $46,313 and $59,410 respectively.
| Characteristic | Number | Measure |
| Per Capita Income | 1,222 | $16,392 |
| Median Family Income | 281 | $46,313 |
| Mean Family Income | 281 | $62,906 |
| Median Household Income | 331 | $59,410 |
| Mean Household Income | 331 | $61,687 |
| Income Deficit | 281 | $0 |
| Wage / Income Gap (%) | 1,222 | 0.00% |
| Wage / Income Gap ($) | 1,222 | 100.00¢ per $1 |
| Gini / Inequality Index | 1,222 | 0.37 |
Earnings by Sex in Markham
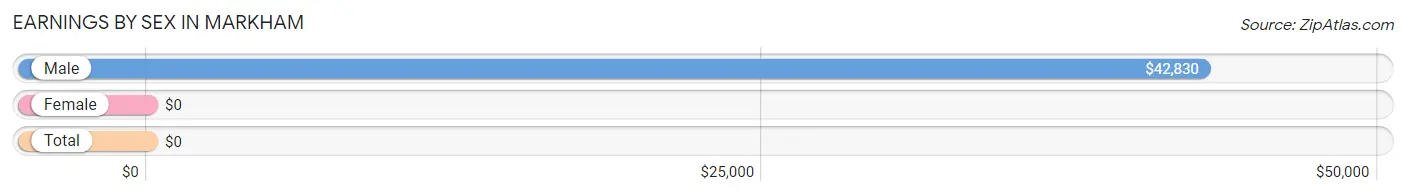
| Sex | Number | Average Earnings |
| Male | 196 (44.6%) | $42,830 |
| Female | 244 (55.4%) | $0 |
| Total | 440 (100.0%) | $0 |
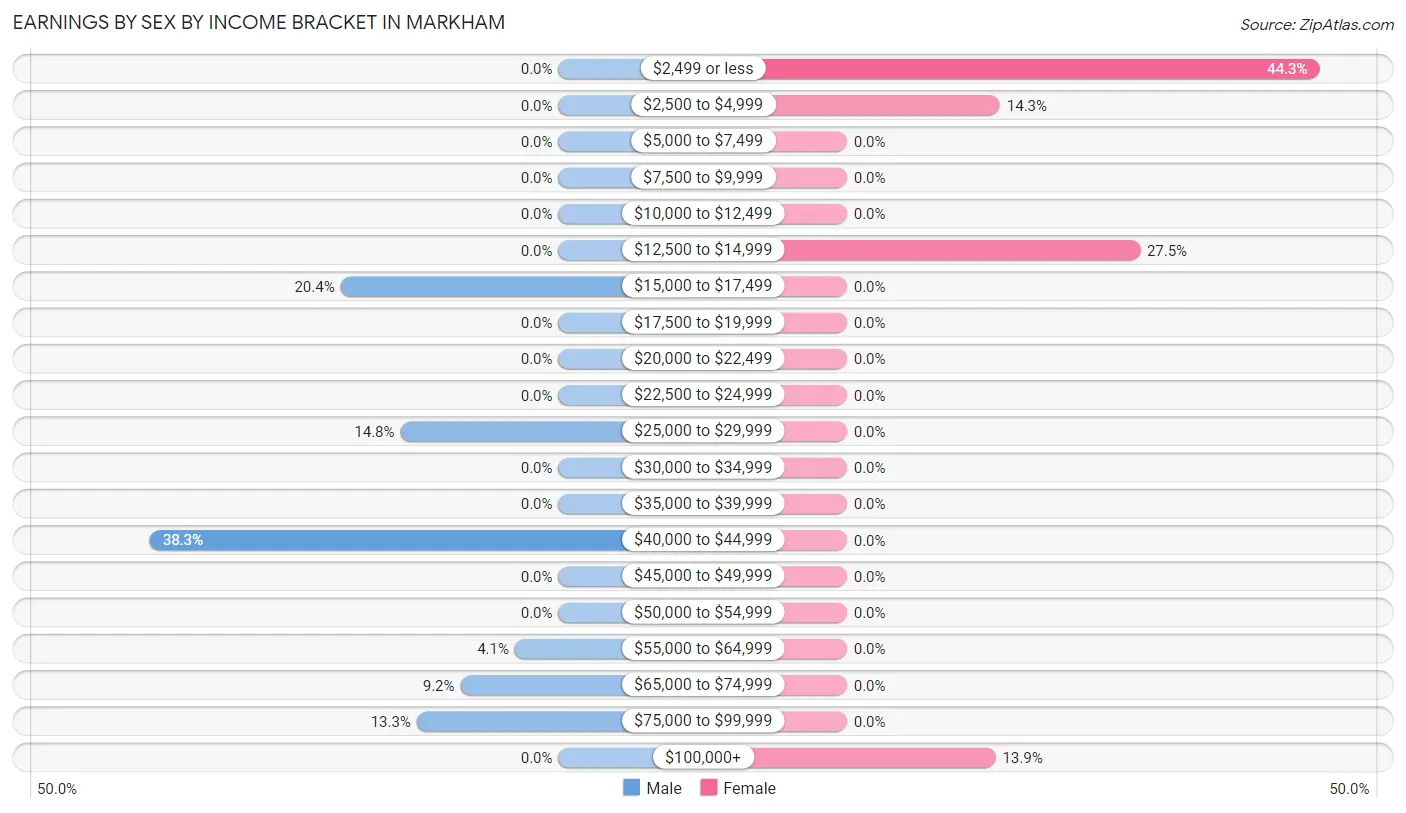
Earnings by Sex by Income Bracket in Markham
The most common earnings brackets in Markham are $40,000 to $44,999 for men (75 | 38.3%) and $2,499 or less for women (108 | 44.3%).
| Income | Male | Female |
| $2,499 or less | 0 (0.0%) | 108 (44.3%) |
| $2,500 to $4,999 | 0 (0.0%) | 35 (14.3%) |
| $5,000 to $7,499 | 0 (0.0%) | 0 (0.0%) |
| $7,500 to $9,999 | 0 (0.0%) | 0 (0.0%) |
| $10,000 to $12,499 | 0 (0.0%) | 0 (0.0%) |
| $12,500 to $14,999 | 0 (0.0%) | 67 (27.5%) |
| $15,000 to $17,499 | 40 (20.4%) | 0 (0.0%) |
| $17,500 to $19,999 | 0 (0.0%) | 0 (0.0%) |
| $20,000 to $22,499 | 0 (0.0%) | 0 (0.0%) |
| $22,500 to $24,999 | 0 (0.0%) | 0 (0.0%) |
| $25,000 to $29,999 | 29 (14.8%) | 0 (0.0%) |
| $30,000 to $34,999 | 0 (0.0%) | 0 (0.0%) |
| $35,000 to $39,999 | 0 (0.0%) | 0 (0.0%) |
| $40,000 to $44,999 | 75 (38.3%) | 0 (0.0%) |
| $45,000 to $49,999 | 0 (0.0%) | 0 (0.0%) |
| $50,000 to $54,999 | 0 (0.0%) | 0 (0.0%) |
| $55,000 to $64,999 | 8 (4.1%) | 0 (0.0%) |
| $65,000 to $74,999 | 18 (9.2%) | 0 (0.0%) |
| $75,000 to $99,999 | 26 (13.3%) | 0 (0.0%) |
| $100,000+ | 0 (0.0%) | 34 (13.9%) |
| Total | 196 (100.0%) | 244 (100.0%) |
Earnings by Sex by Educational Attainment in Markham
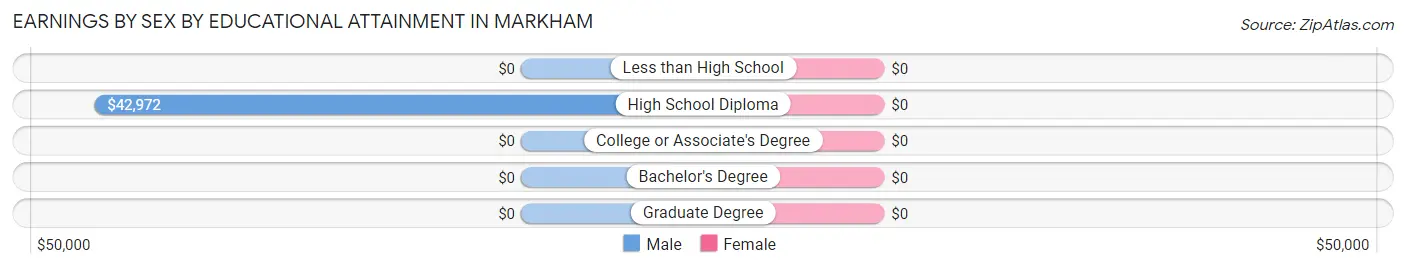
| Educational Attainment | Male Income | Female Income |
| Less than High School | - | - |
| High School Diploma | $42,972 | $0 |
| College or Associate's Degree | - | - |
| Bachelor's Degree | - | - |
| Graduate Degree | - | - |
| Total | $43,774 | $0 |
Family Income in Markham
Family Income Brackets in Markham
According to the Markham family income data, there are 105 families falling into the $50,000 to $74,999 income range, which is the most common income bracket and makes up 37.4% of all families.
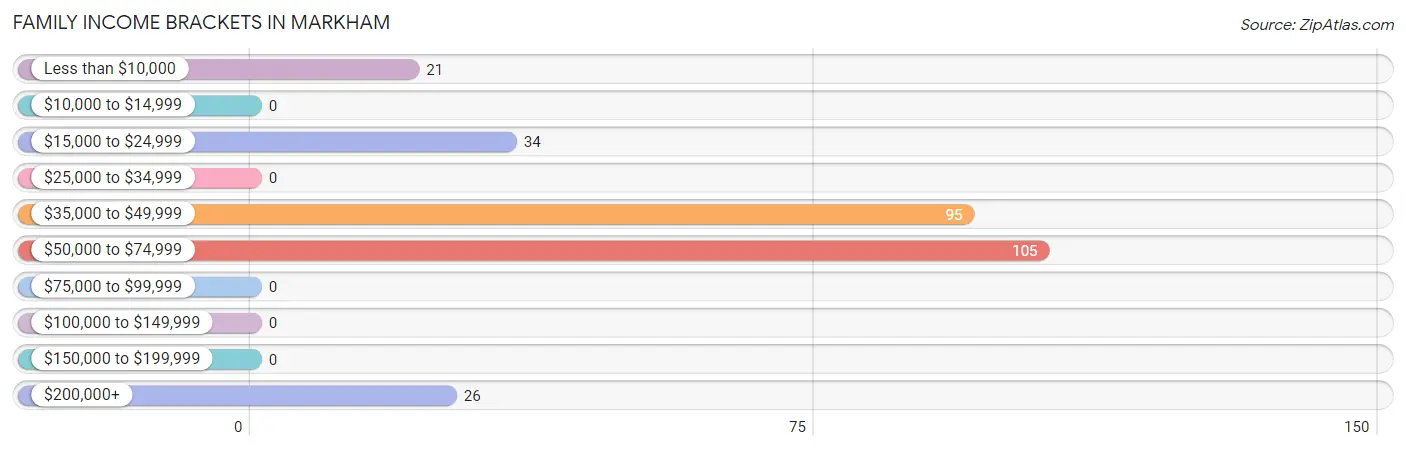
| Income Bracket | # Families | % Families |
| Less than $10,000 | 21 | 7.5% |
| $10,000 to $14,999 | 0 | 0.0% |
| $15,000 to $24,999 | 34 | 12.1% |
| $25,000 to $34,999 | 0 | 0.0% |
| $35,000 to $49,999 | 95 | 33.8% |
| $50,000 to $74,999 | 105 | 37.4% |
| $75,000 to $99,999 | 0 | 0.0% |
| $100,000 to $149,999 | 0 | 0.0% |
| $150,000 to $199,999 | 0 | 0.0% |
| $200,000+ | 26 | 9.3% |
Family Income by Famaliy Size in Markham
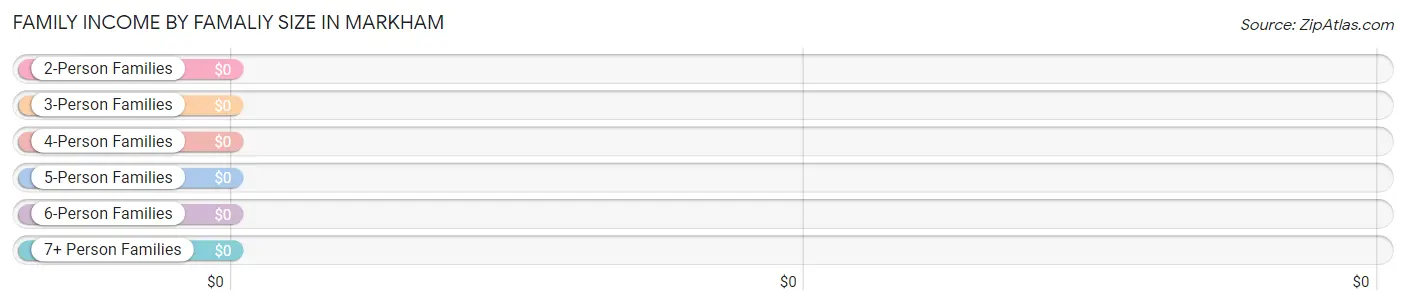
| Income Bracket | # Families | Median Income |
| 2-Person Families | 111 (39.5%) | $0 |
| 3-Person Families | 26 (9.2%) | $0 |
| 4-Person Families | 0 (0.0%) | $0 |
| 5-Person Families | 79 (28.1%) | $0 |
| 6-Person Families | 47 (16.7%) | $0 |
| 7+ Person Families | 18 (6.4%) | $0 |
| Total | 281 (100.0%) | $46,313 |
Family Income by Number of Earners in Markham
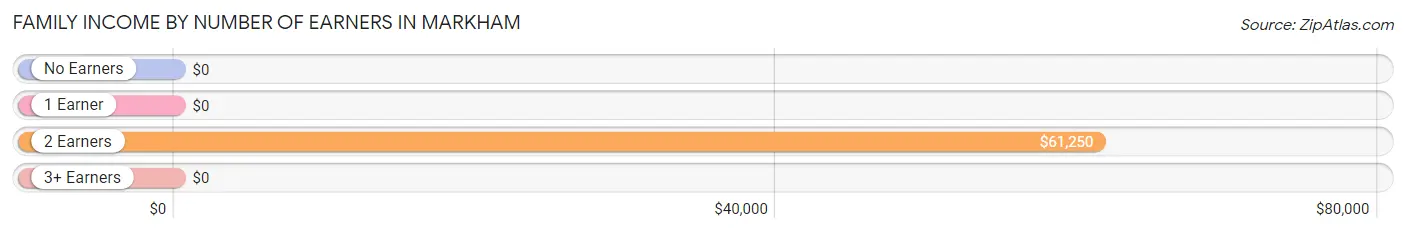
| Number of Earners | # Families | Median Income |
| No Earners | 89 (31.7%) | $0 |
| 1 Earner | 40 (14.2%) | $0 |
| 2 Earners | 152 (54.1%) | $61,250 |
| 3+ Earners | 0 (0.0%) | $0 |
| Total | 281 (100.0%) | $46,313 |
Household Income in Markham
Household Income Brackets in Markham
With 188 households falling in the category, the $50,000 to $74,999 income range is the most frequent in Markham, accounting for 56.8% of all households.
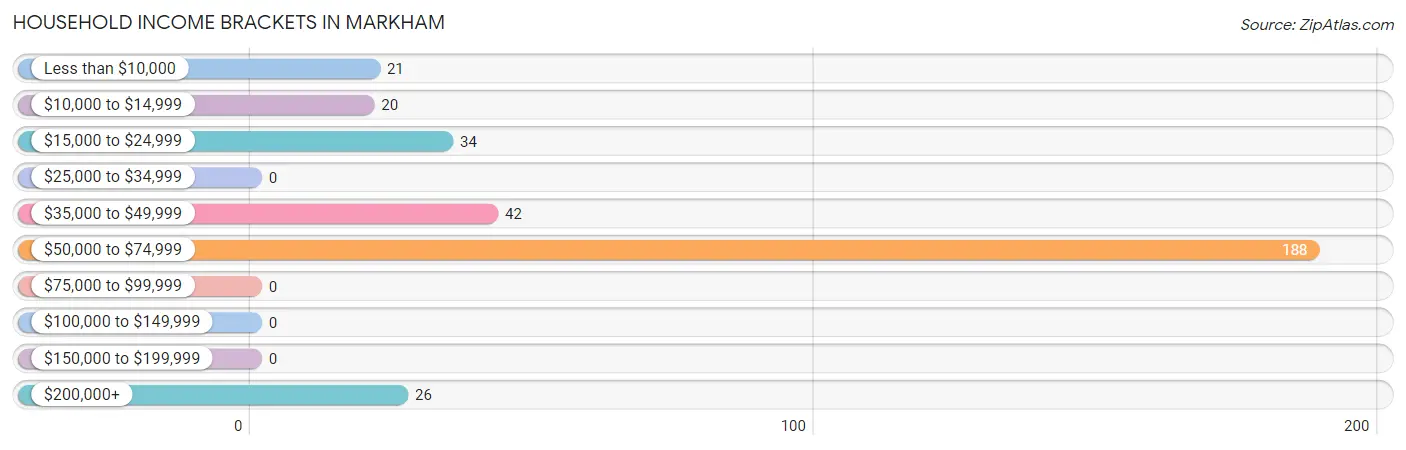
| Income Bracket | # Households | % Households |
| Less than $10,000 | 21 | 6.3% |
| $10,000 to $14,999 | 20 | 6.0% |
| $15,000 to $24,999 | 34 | 10.3% |
| $25,000 to $34,999 | 0 | 0.0% |
| $35,000 to $49,999 | 42 | 12.7% |
| $50,000 to $74,999 | 188 | 56.8% |
| $75,000 to $99,999 | 0 | 0.0% |
| $100,000 to $149,999 | 0 | 0.0% |
| $150,000 to $199,999 | 0 | 0.0% |
| $200,000+ | 26 | 7.9% |
Household Income by Householder Age in Markham
The median household income in Markham is $59,410, with the highest median household income of $51,250 found in the 65+ years age bracket for the primary householder. A total of 120 households (36.2%) fall into this category.
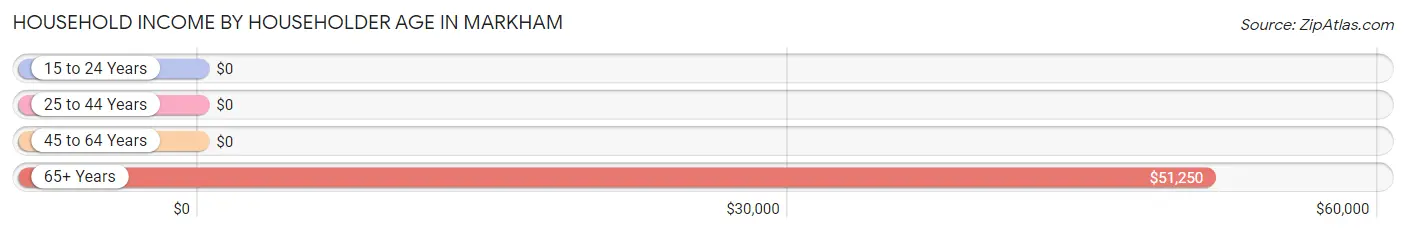
| Income Bracket | # Households | Median Income |
| 15 to 24 Years | 0 (0.0%) | $0 |
| 25 to 44 Years | 97 (29.3%) | $0 |
| 45 to 64 Years | 114 (34.4%) | $0 |
| 65+ Years | 120 (36.2%) | $51,250 |
| Total | 331 (100.0%) | $59,410 |
Poverty in Markham
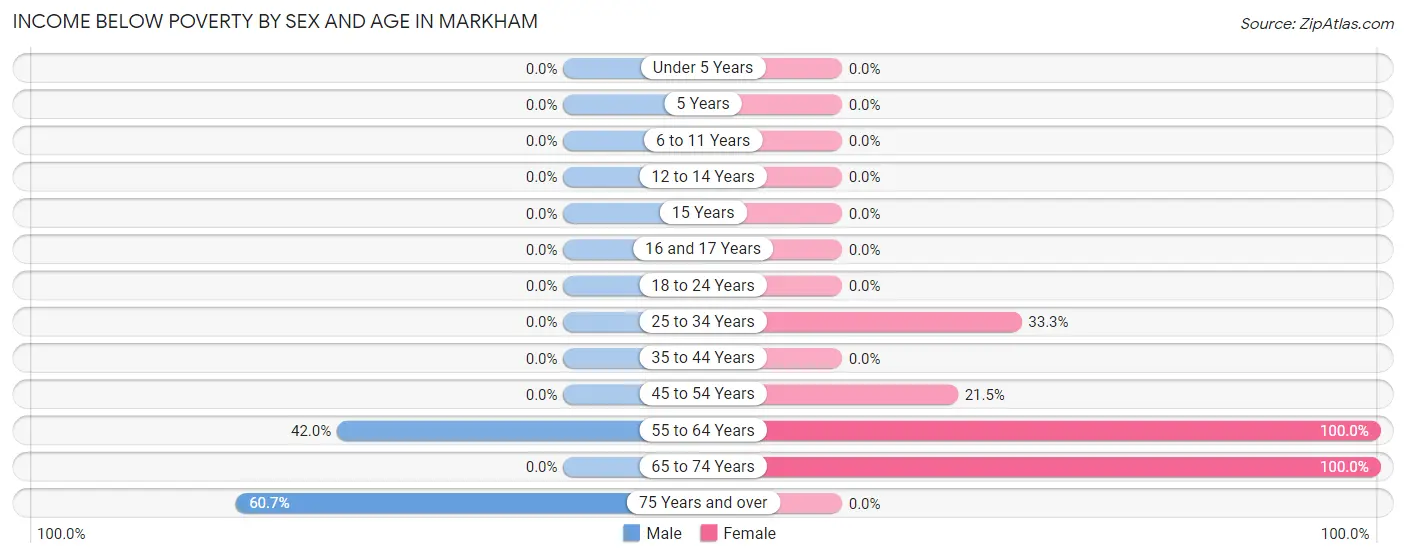
Income Below Poverty by Sex and Age in Markham
With 9.4% poverty level for males and 15.3% for females among the residents of Markham, 75 year old and over males and 55 to 64 year old females are the most vulnerable to poverty, with 34 males (60.7%) and 24 females (100.0%) in their respective age groups living below the poverty level.
| Age Bracket | Male | Female |
| Under 5 Years | 0 (0.0%) | 0 (0.0%) |
| 5 Years | 0 (0.0%) | 0 (0.0%) |
| 6 to 11 Years | 0 (0.0%) | 0 (0.0%) |
| 12 to 14 Years | 0 (0.0%) | 0 (0.0%) |
| 15 Years | 0 (0.0%) | 0 (0.0%) |
| 16 and 17 Years | 0 (0.0%) | 0 (0.0%) |
| 18 to 24 Years | 0 (0.0%) | 0 (0.0%) |
| 25 to 34 Years | 0 (0.0%) | 29 (33.3%) |
| 35 to 44 Years | 0 (0.0%) | 0 (0.0%) |
| 45 to 54 Years | 0 (0.0%) | 20 (21.5%) |
| 55 to 64 Years | 21 (42.0%) | 24 (100.0%) |
| 65 to 74 Years | 0 (0.0%) | 24 (100.0%) |
| 75 Years and over | 34 (60.7%) | 0 (0.0%) |
| Total | 55 (9.4%) | 97 (15.3%) |
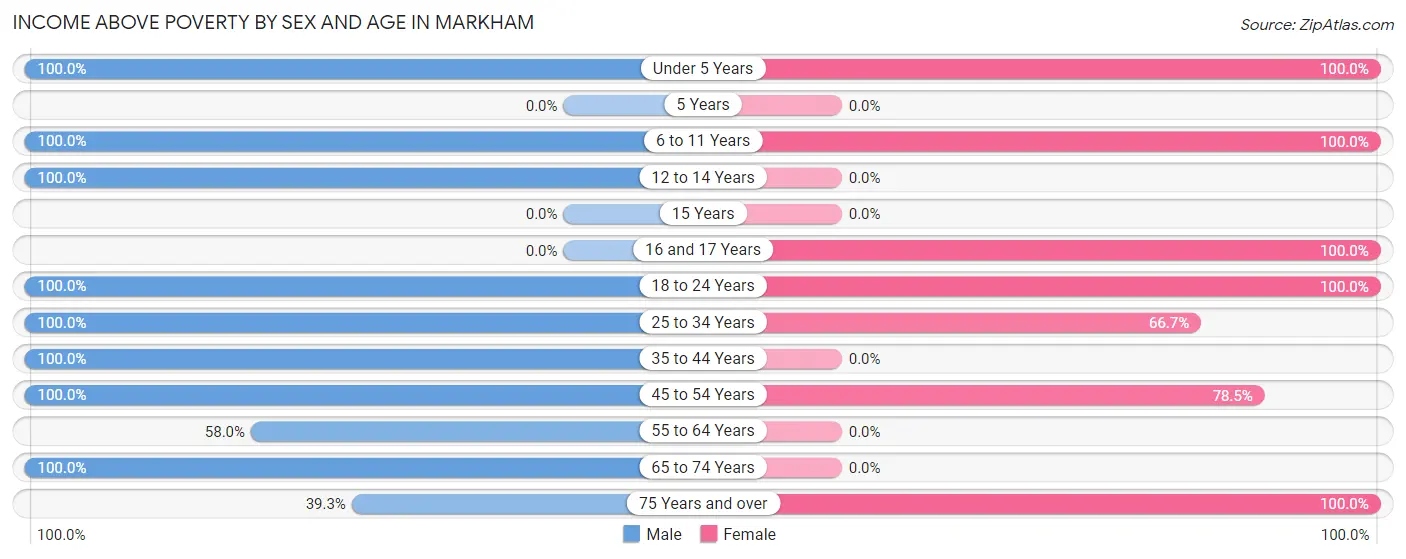
Income Above Poverty by Sex and Age in Markham
According to the poverty statistics in Markham, males aged under 5 years and females aged under 5 years are the age groups that are most secure financially, with 100.0% of males and 100.0% of females in these age groups living above the poverty line.
| Age Bracket | Male | Female |
| Under 5 Years | 145 (100.0%) | 67 (100.0%) |
| 5 Years | 0 (0.0%) | 0 (0.0%) |
| 6 to 11 Years | 34 (100.0%) | 55 (100.0%) |
| 12 to 14 Years | 80 (100.0%) | 0 (0.0%) |
| 15 Years | 0 (0.0%) | 0 (0.0%) |
| 16 and 17 Years | 0 (0.0%) | 86 (100.0%) |
| 18 to 24 Years | 40 (100.0%) | 132 (100.0%) |
| 25 to 34 Years | 52 (100.0%) | 58 (66.7%) |
| 35 to 44 Years | 53 (100.0%) | 0 (0.0%) |
| 45 to 54 Years | 29 (100.0%) | 73 (78.5%) |
| 55 to 64 Years | 29 (58.0%) | 0 (0.0%) |
| 65 to 74 Years | 48 (100.0%) | 0 (0.0%) |
| 75 Years and over | 22 (39.3%) | 67 (100.0%) |
| Total | 532 (90.6%) | 538 (84.7%) |
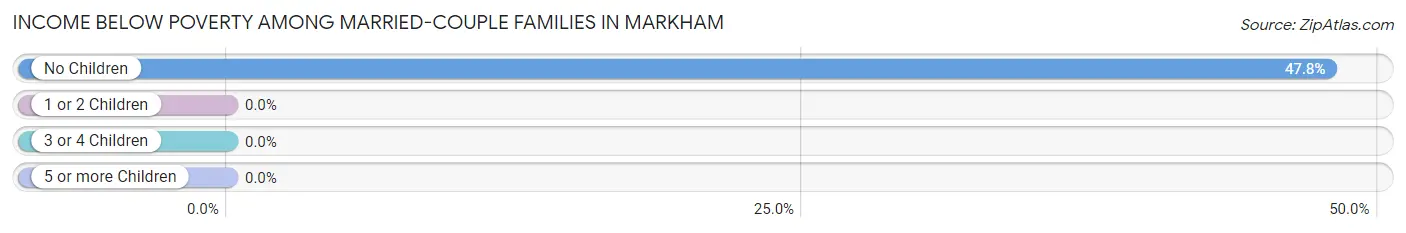
Income Below Poverty Among Married-Couple Families in Markham
The poverty statistics for married-couple families in Markham show that 26.7% or 55 of the total 206 families live below the poverty line. Families with no children have the highest poverty rate of 47.8%, comprising of 55 families. On the other hand, families with 1 or 2 children have the lowest poverty rate of 0.0%, which includes 0 families.
| Children | Above Poverty | Below Poverty |
| No Children | 60 (52.2%) | 55 (47.8%) |
| 1 or 2 Children | 47 (100.0%) | 0 (0.0%) |
| 3 or 4 Children | 26 (100.0%) | 0 (0.0%) |
| 5 or more Children | 18 (100.0%) | 0 (0.0%) |
| Total | 151 (73.3%) | 55 (26.7%) |
Income Below Poverty Among Single-Parent Households in Markham
| Children | Single Father | Single Mother |
| No Children | 0 (0.0%) | 0 (0.0%) |
| 1 or 2 Children | 0 (0.0%) | 0 (0.0%) |
| 3 or 4 Children | 0 (0.0%) | 0 (0.0%) |
| 5 or more Children | 0 (0.0%) | 0 (0.0%) |
| Total | 0 (0.0%) | 0 (0.0%) |
Income Below Poverty Among Married-Couple vs Single-Parent Households in Markham
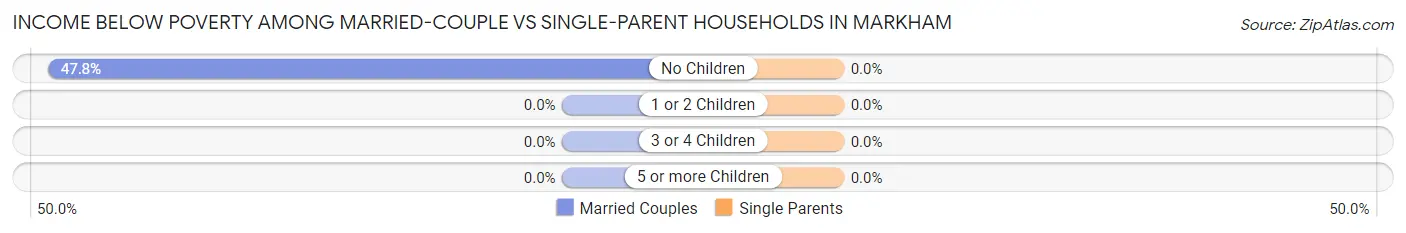
| Children | Married-Couple Families | Single-Parent Households |
| No Children | 55 (47.8%) | 0 (0.0%) |
| 1 or 2 Children | 0 (0.0%) | 0 (0.0%) |
| 3 or 4 Children | 0 (0.0%) | 0 (0.0%) |
| 5 or more Children | 0 (0.0%) | 0 (0.0%) |
| Total | 55 (26.7%) | 0 (0.0%) |
Race in Markham
The most populous races in Markham are White / Caucasian (848 | 69.4%), Hispanic or Latino (287 | 23.5%), and Two or more Races (259 | 21.2%).
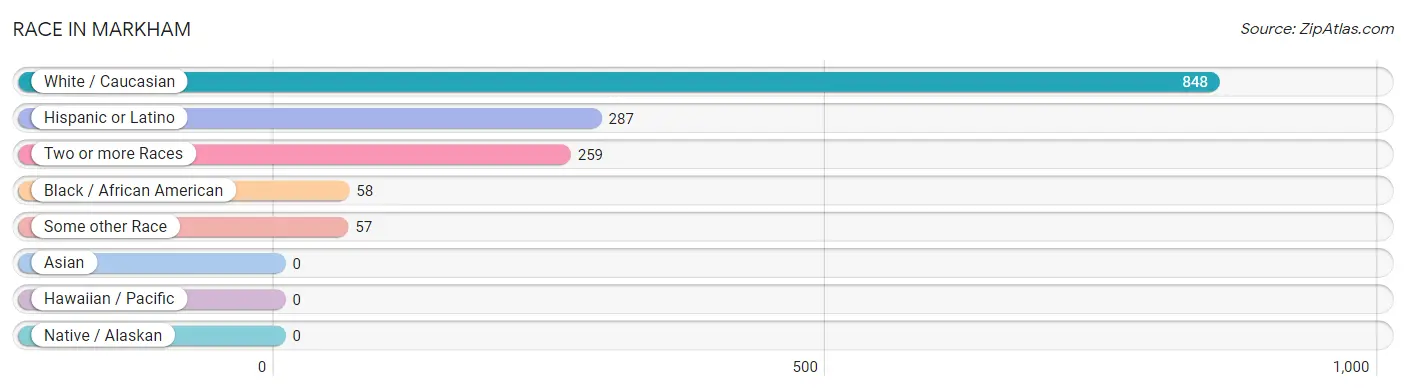
| Race | # Population | % Population |
| Asian | 0 | 0.0% |
| Black / African American | 58 | 4.8% |
| Hawaiian / Pacific | 0 | 0.0% |
| Hispanic or Latino | 287 | 23.5% |
| Native / Alaskan | 0 | 0.0% |
| White / Caucasian | 848 | 69.4% |
| Two or more Races | 259 | 21.2% |
| Some other Race | 57 | 4.7% |
| Total | 1,222 | 100.0% |
Ancestry in Markham
The most populous ancestries reported in Markham are German (378 | 30.9%), Mexican (287 | 23.5%), American (257 | 21.0%), Czech (193 | 15.8%), and Italian (163 | 13.3%), together accounting for 104.6% of all Markham residents.
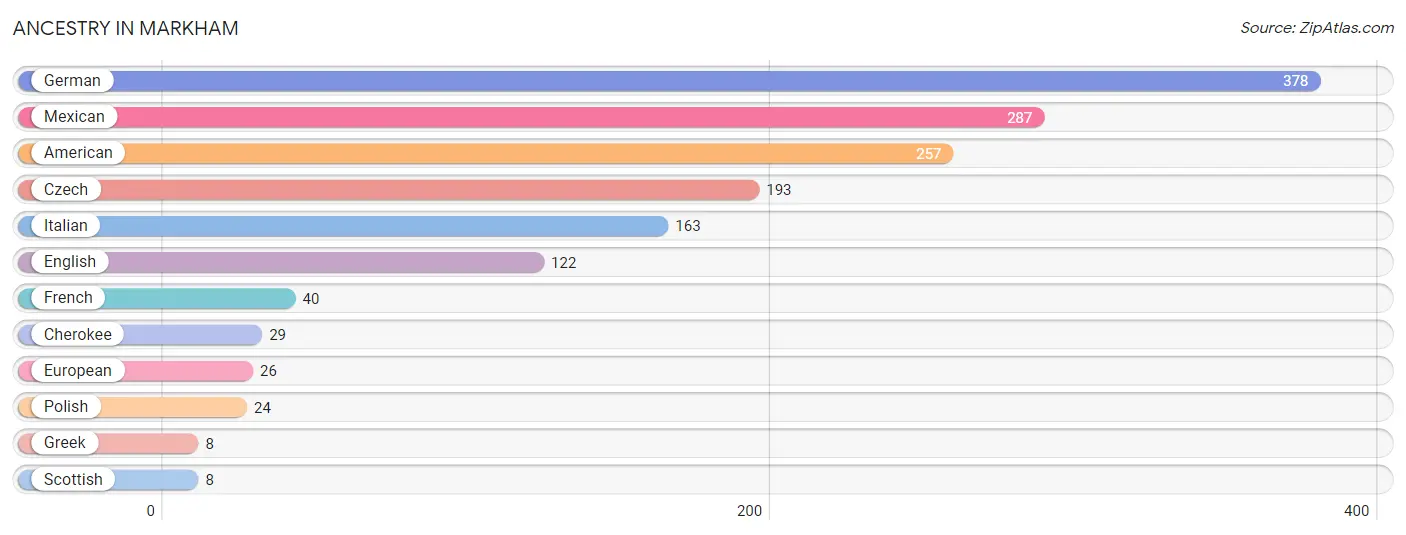
| Ancestry | # Population | % Population |
| American | 257 | 21.0% |
| Cherokee | 29 | 2.4% |
| Czech | 193 | 15.8% |
| English | 122 | 10.0% |
| European | 26 | 2.1% |
| French | 40 | 3.3% |
| German | 378 | 30.9% |
| Greek | 8 | 0.6% |
| Italian | 163 | 13.3% |
| Mexican | 287 | 23.5% |
| Polish | 24 | 2.0% |
| Scottish | 8 | 0.6% | View All 12 Rows |
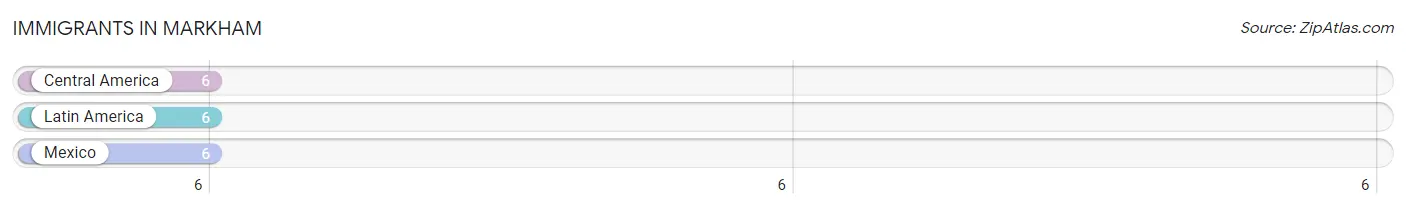
Immigrants in Markham
The most numerous immigrant groups reported in Markham came from Central America (6 | 0.5%), Latin America (6 | 0.5%), and Mexico (6 | 0.5%), together accounting for 1.5% of all Markham residents.
| Immigration Origin | # Population | % Population |
| Central America | 6 | 0.5% |
| Latin America | 6 | 0.5% |
| Mexico | 6 | 0.5% | View All 3 Rows |
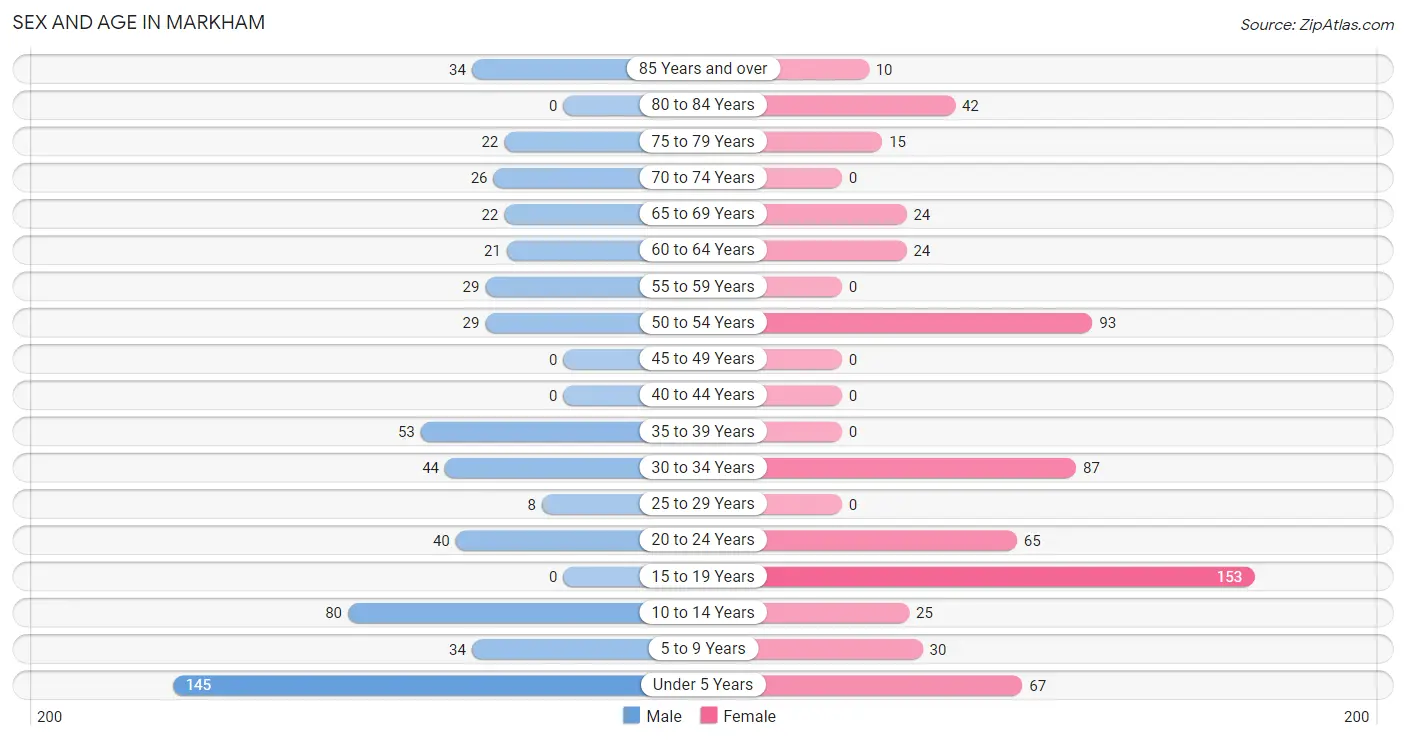
Sex and Age in Markham
Sex and Age in Markham
The most populous age groups in Markham are Under 5 Years (145 | 24.7%) for men and 15 to 19 Years (153 | 24.1%) for women.
| Age Bracket | Male | Female |
| Under 5 Years | 145 (24.7%) | 67 (10.5%) |
| 5 to 9 Years | 34 (5.8%) | 30 (4.7%) |
| 10 to 14 Years | 80 (13.6%) | 25 (3.9%) |
| 15 to 19 Years | 0 (0.0%) | 153 (24.1%) |
| 20 to 24 Years | 40 (6.8%) | 65 (10.2%) |
| 25 to 29 Years | 8 (1.4%) | 0 (0.0%) |
| 30 to 34 Years | 44 (7.5%) | 87 (13.7%) |
| 35 to 39 Years | 53 (9.0%) | 0 (0.0%) |
| 40 to 44 Years | 0 (0.0%) | 0 (0.0%) |
| 45 to 49 Years | 0 (0.0%) | 0 (0.0%) |
| 50 to 54 Years | 29 (4.9%) | 93 (14.6%) |
| 55 to 59 Years | 29 (4.9%) | 0 (0.0%) |
| 60 to 64 Years | 21 (3.6%) | 24 (3.8%) |
| 65 to 69 Years | 22 (3.7%) | 24 (3.8%) |
| 70 to 74 Years | 26 (4.4%) | 0 (0.0%) |
| 75 to 79 Years | 22 (3.7%) | 15 (2.4%) |
| 80 to 84 Years | 0 (0.0%) | 42 (6.6%) |
| 85 Years and over | 34 (5.8%) | 10 (1.6%) |
| Total | 587 (100.0%) | 635 (100.0%) |
Families and Households in Markham
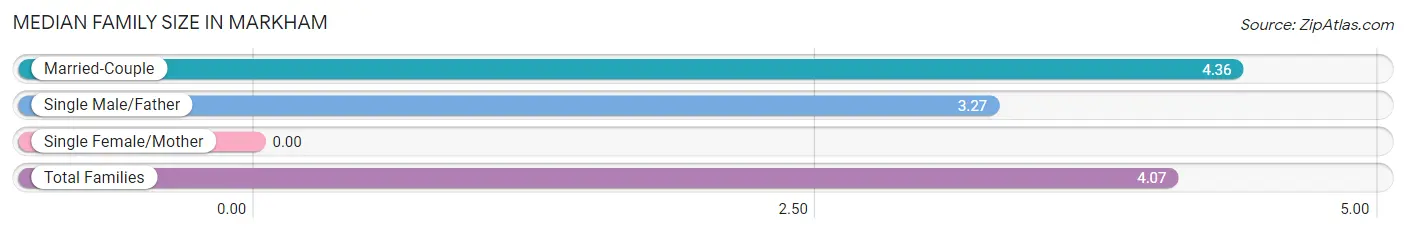
Median Family Size in Markham
| Family Type | # Families | Family Size |
| Married-Couple | 206 (73.3%) | 4.36 |
| Single Male/Father | 75 (26.7%) | 3.27 |
| Single Female/Mother | 0 (0.0%) | - |
| Total Families | 281 (100.0%) | 4.07 |
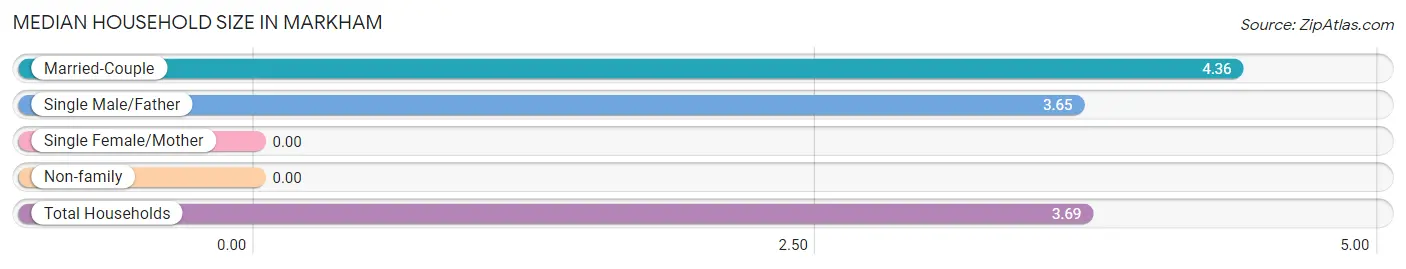
Median Household Size in Markham
| Household Type | # Households | Household Size |
| Married-Couple | 206 (62.2%) | 4.36 |
| Single Male/Father | 75 (22.7%) | 3.65 |
| Single Female/Mother | 0 (0.0%) | - |
| Non-family | 50 (15.1%) | - |
| Total Households | 331 (100.0%) | 3.69 |
Household Size by Marriage Status in Markham
Out of a total of 331 households in Markham, 281 (84.9%) are family households, while 50 (15.1%) are nonfamily households. The most numerous type of family households are 2-person households, comprising 111, and the most common type of nonfamily households are 1-person households, comprising 50.
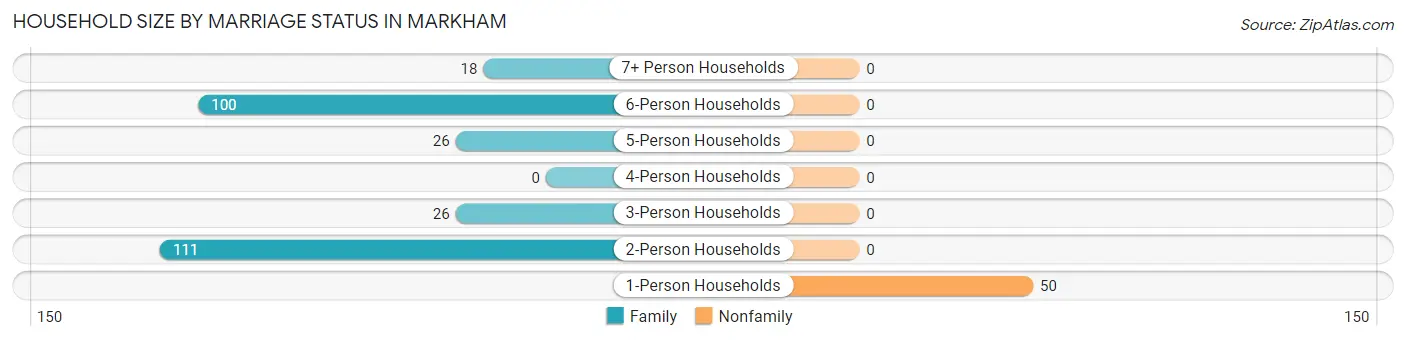
| Household Size | Family Households | Nonfamily Households |
| 1-Person Households | - | 50 (15.1%) |
| 2-Person Households | 111 (33.5%) | 0 (0.0%) |
| 3-Person Households | 26 (7.9%) | 0 (0.0%) |
| 4-Person Households | 0 (0.0%) | 0 (0.0%) |
| 5-Person Households | 26 (7.9%) | 0 (0.0%) |
| 6-Person Households | 100 (30.2%) | 0 (0.0%) |
| 7+ Person Households | 18 (5.4%) | 0 (0.0%) |
| Total | 281 (84.9%) | 50 (15.1%) |
Female Fertility in Markham
Fertility by Age in Markham
| Age Bracket | Women with Births | Births / 1,000 Women |
| 15 to 19 years | 0 (0.0%) | 0.0 |
| 20 to 34 years | 0 (0.0%) | 0.0 |
| 35 to 50 years | 0 (0.0%) | 0.0 |
| Total | 0 (0.0%) | 0.0 |
Fertility by Age by Marriage Status in Markham
| Age Bracket | Married | Unmarried |
| 15 to 19 years | 0 (0.0%) | 0 (0.0%) |
| 20 to 34 years | 0 (0.0%) | 0 (0.0%) |
| 35 to 50 years | 0 (0.0%) | 0 (0.0%) |
| Total | 0 (0.0%) | 0 (0.0%) |
Fertility by Education in Markham
| Educational Attainment | Women with Births | Births / 1,000 Women |
| Less than High School | 0 (0.0%) | 0.0 |
| High School Diploma | 0 (0.0%) | 0.0 |
| College or Associate's Degree | 0 (0.0%) | 0.0 |
| Bachelor's Degree | 0 (0.0%) | 0.0 |
| Graduate Degree | 0 (0.0%) | 0.0 |
| Total | 0 (0.0%) | 0.0 |
Fertility by Education by Marriage Status in Markham
| Educational Attainment | Married | Unmarried |
| Less than High School | 0 (0.0%) | 0 (0.0%) |
| High School Diploma | 0 (0.0%) | 0 (0.0%) |
| College or Associate's Degree | 0 (0.0%) | 0 (0.0%) |
| Bachelor's Degree | 0 (0.0%) | 0 (0.0%) |
| Graduate Degree | 0 (0.0%) | 0 (0.0%) |
| Total | 0 (0.0%) | 0 (0.0%) |
Employment Characteristics in Markham
Employment by Class of Employer in Markham
Among the 330 employed individuals in Markham, private company employees (295 | 89.4%), self-employed (not incorporated) (29 | 8.8%), and not-for-profit organizations (6 | 1.8%) make up the most common classes of employment.
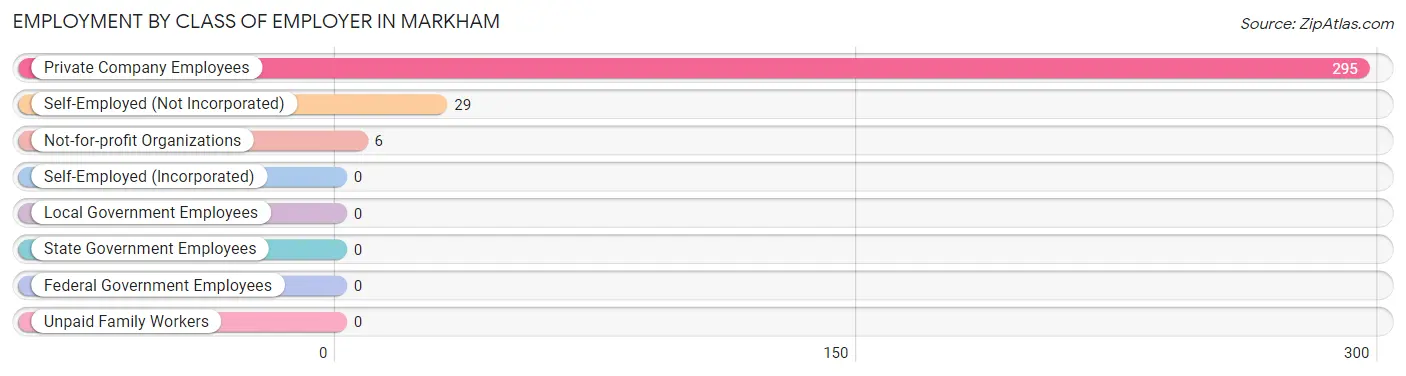
| Employer Class | # Employees | % Employees |
| Private Company Employees | 295 | 89.4% |
| Self-Employed (Incorporated) | 0 | 0.0% |
| Self-Employed (Not Incorporated) | 29 | 8.8% |
| Not-for-profit Organizations | 6 | 1.8% |
| Local Government Employees | 0 | 0.0% |
| State Government Employees | 0 | 0.0% |
| Federal Government Employees | 0 | 0.0% |
| Unpaid Family Workers | 0 | 0.0% |
| Total | 330 | 100.0% |
Employment Status by Age in Markham
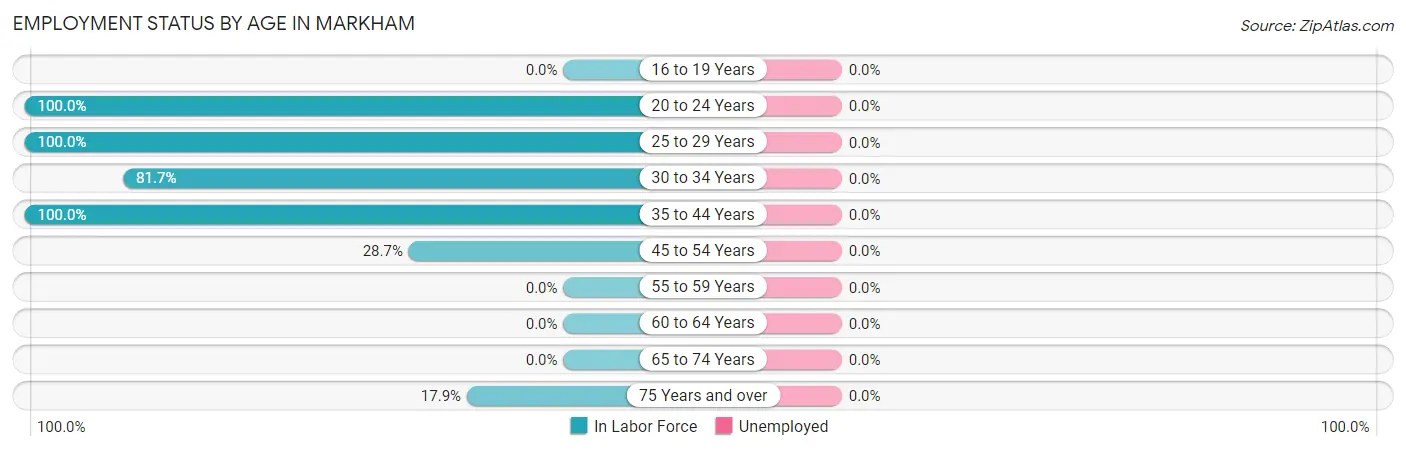
| Age Bracket | In Labor Force | Unemployed |
| 16 to 19 Years | 0 (0.0%) | 0 (0.0%) |
| 20 to 24 Years | 105 (100.0%) | 0 (0.0%) |
| 25 to 29 Years | 8 (100.0%) | 0 (0.0%) |
| 30 to 34 Years | 107 (81.7%) | 0 (0.0%) |
| 35 to 44 Years | 53 (100.0%) | 0 (0.0%) |
| 45 to 54 Years | 35 (28.7%) | 0 (0.0%) |
| 55 to 59 Years | 0 (0.0%) | 0 (0.0%) |
| 60 to 64 Years | 0 (0.0%) | 0 (0.0%) |
| 65 to 74 Years | 0 (0.0%) | 0 (0.0%) |
| 75 Years and over | 22 (17.9%) | 0 (0.0%) |
| Total | 330 (39.2%) | 0 (0.0%) |
Employment Status by Educational Attainment in Markham
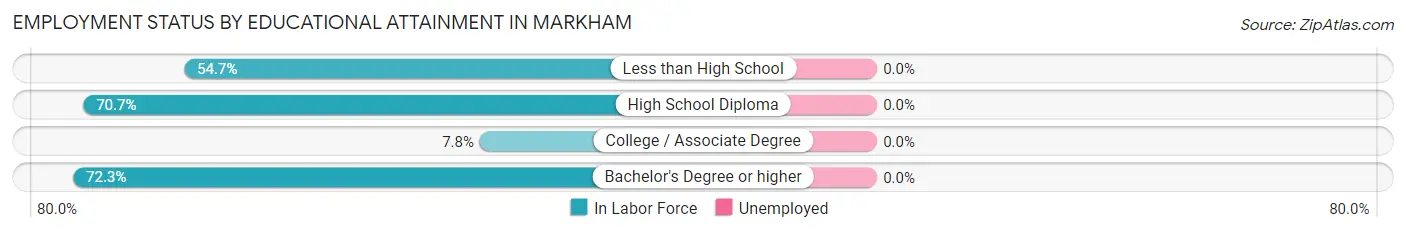
| Educational Attainment | In Labor Force | Unemployed |
| Less than High School | 29 (54.7%) | 0 (0.0%) |
| High School Diploma | 106 (70.7%) | 0 (0.0%) |
| College / Associate Degree | 8 (7.8%) | 0 (0.0%) |
| Bachelor's Degree or higher | 60 (72.3%) | 0 (0.0%) |
| Total | 203 (52.3%) | 0 (0.0%) |
Employment Occupations by Sex in Markham
Management, Business, Science and Arts Occupations
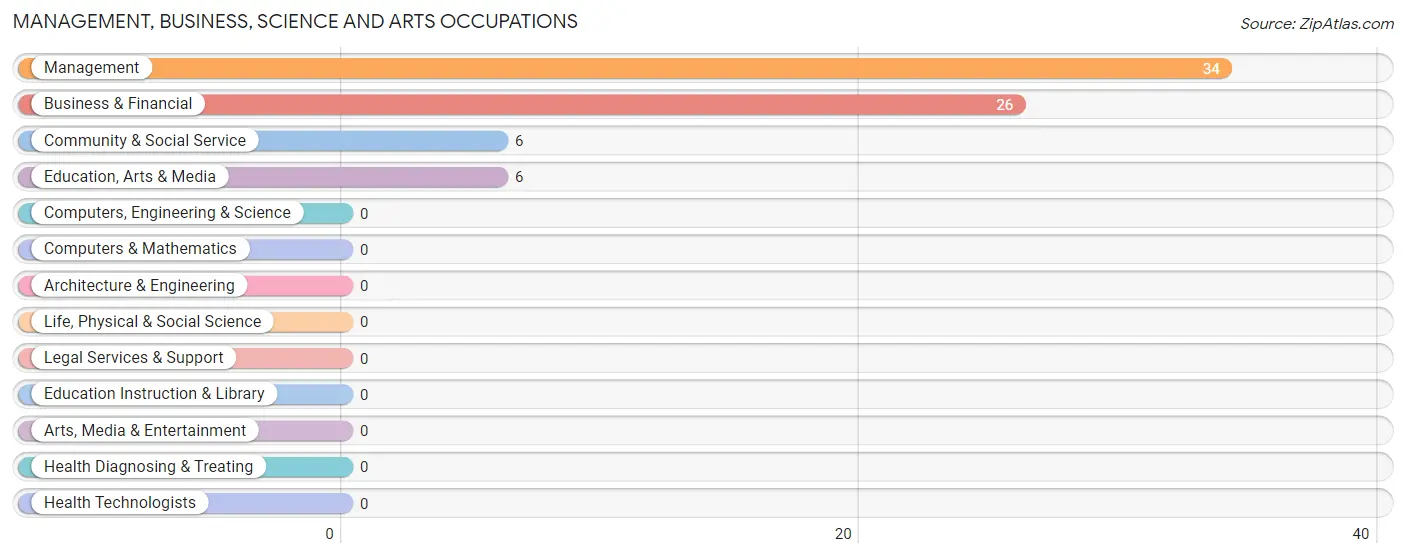
The most common Management, Business, Science and Arts occupations in Markham are Management (34 | 10.3%), Business & Financial (26 | 7.9%), Community & Social Service (6 | 1.8%), and Education, Arts & Media (6 | 1.8%).
Management, Business, Science and Arts Occupations by Sex
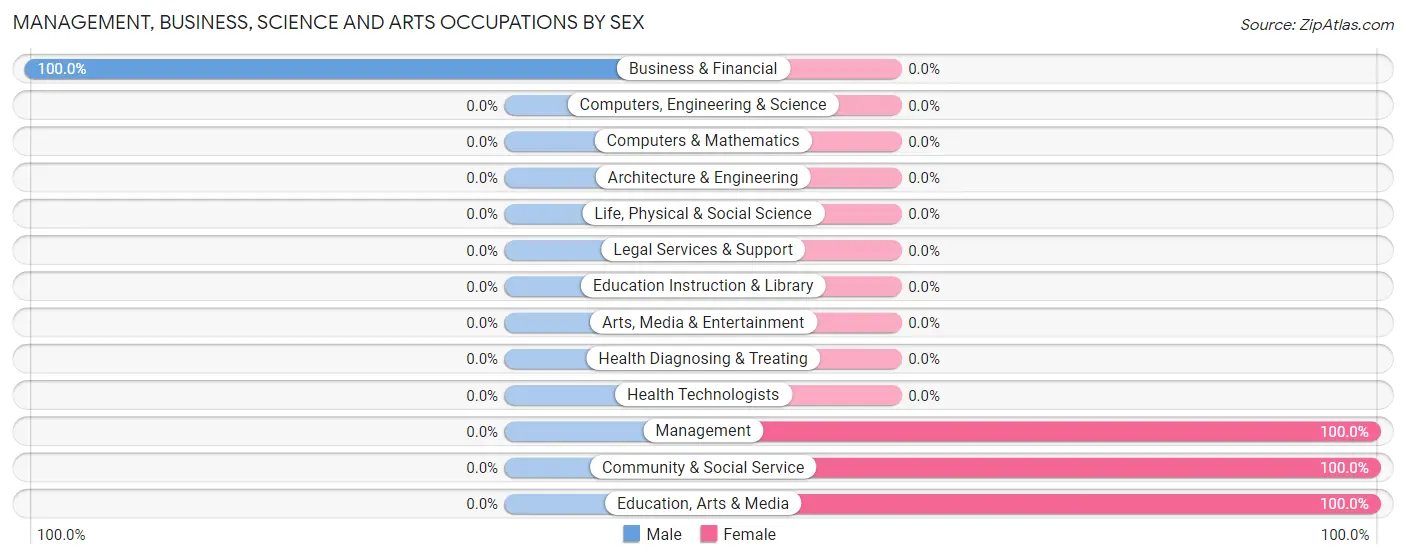
| Occupation | Male | Female |
| Management | 0 (0.0%) | 34 (100.0%) |
| Business & Financial | 26 (100.0%) | 0 (0.0%) |
| Computers, Engineering & Science | 0 (0.0%) | 0 (0.0%) |
| Computers & Mathematics | 0 (0.0%) | 0 (0.0%) |
| Architecture & Engineering | 0 (0.0%) | 0 (0.0%) |
| Life, Physical & Social Science | 0 (0.0%) | 0 (0.0%) |
| Community & Social Service | 0 (0.0%) | 6 (100.0%) |
| Education, Arts & Media | 0 (0.0%) | 6 (100.0%) |
| Legal Services & Support | 0 (0.0%) | 0 (0.0%) |
| Education Instruction & Library | 0 (0.0%) | 0 (0.0%) |
| Arts, Media & Entertainment | 0 (0.0%) | 0 (0.0%) |
| Health Diagnosing & Treating | 0 (0.0%) | 0 (0.0%) |
| Health Technologists | 0 (0.0%) | 0 (0.0%) |
| Total (Category) | 26 (39.4%) | 40 (60.6%) |
| Total (Overall) | 196 (59.4%) | 134 (40.6%) |
Services Occupations
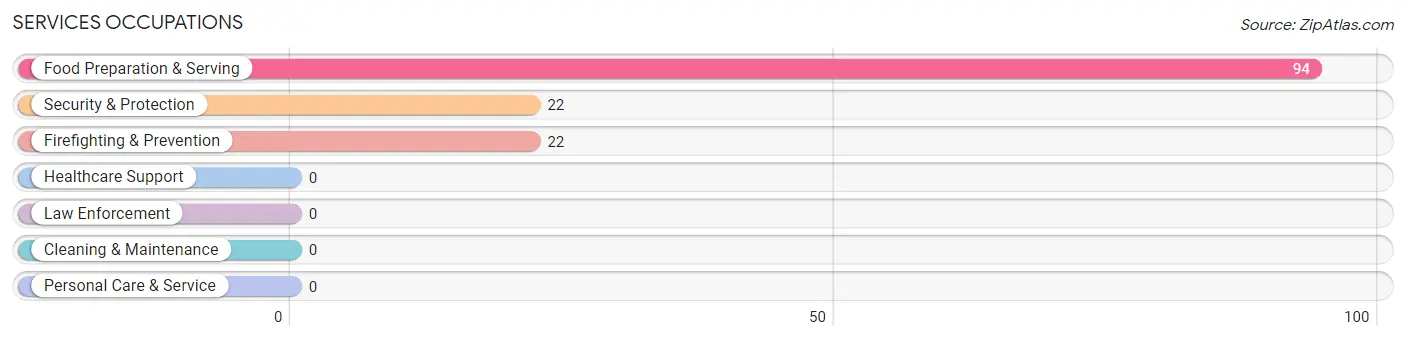
The most common Services occupations in Markham are Food Preparation & Serving (94 | 28.5%), Security & Protection (22 | 6.7%), and Firefighting & Prevention (22 | 6.7%).
Services Occupations by Sex
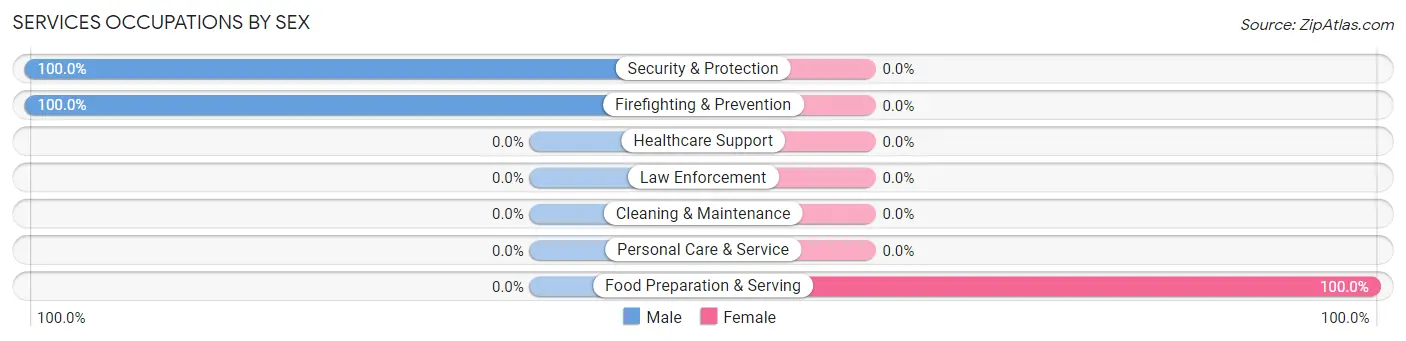
| Occupation | Male | Female |
| Healthcare Support | 0 (0.0%) | 0 (0.0%) |
| Security & Protection | 22 (100.0%) | 0 (0.0%) |
| Firefighting & Prevention | 22 (100.0%) | 0 (0.0%) |
| Law Enforcement | 0 (0.0%) | 0 (0.0%) |
| Food Preparation & Serving | 0 (0.0%) | 94 (100.0%) |
| Cleaning & Maintenance | 0 (0.0%) | 0 (0.0%) |
| Personal Care & Service | 0 (0.0%) | 0 (0.0%) |
| Total (Category) | 22 (19.0%) | 94 (81.0%) |
| Total (Overall) | 196 (59.4%) | 134 (40.6%) |
Sales and Office Occupations
Sales and Office Occupations by Sex
| Occupation | Male | Female |
| Sales & Related | 0 (0.0%) | 0 (0.0%) |
| Office & Administration | 0 (0.0%) | 0 (0.0%) |
| Total (Category) | 0 (0.0%) | 0 (0.0%) |
| Total (Overall) | 196 (59.4%) | 134 (40.6%) |
Natural Resources, Construction and Maintenance Occupations
Natural Resources, Construction and Maintenance Occupations by Sex
| Occupation | Male | Female |
| Farming, Fishing & Forestry | 0 (0.0%) | 0 (0.0%) |
| Construction & Extraction | 0 (0.0%) | 0 (0.0%) |
| Installation, Maintenance & Repair | 0 (0.0%) | 0 (0.0%) |
| Total (Category) | 0 (0.0%) | 0 (0.0%) |
| Total (Overall) | 196 (59.4%) | 134 (40.6%) |
Production, Transportation and Moving Occupations
The most common Production, Transportation and Moving occupations in Markham are Production (79 | 23.9%), Material Moving (40 | 12.1%), and Transportation (29 | 8.8%).
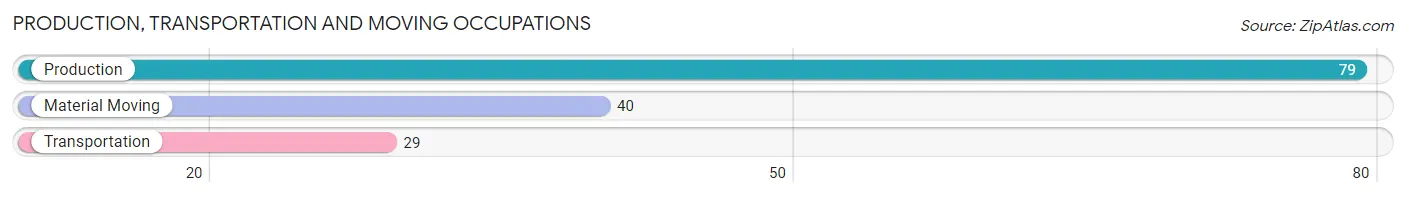
Production, Transportation and Moving Occupations by Sex
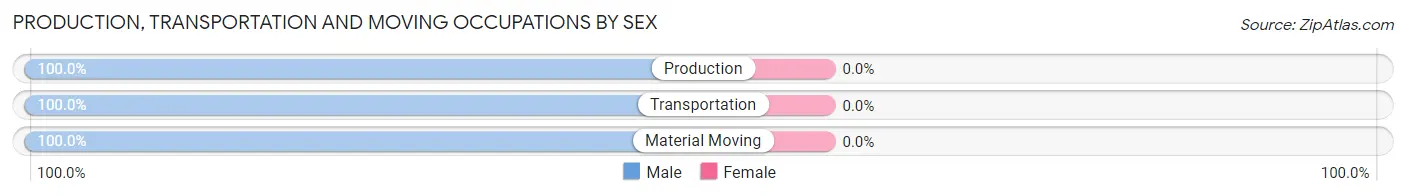
| Occupation | Male | Female |
| Production | 79 (100.0%) | 0 (0.0%) |
| Transportation | 29 (100.0%) | 0 (0.0%) |
| Material Moving | 40 (100.0%) | 0 (0.0%) |
| Total (Category) | 148 (100.0%) | 0 (0.0%) |
| Total (Overall) | 196 (59.4%) | 134 (40.6%) |
Employment Industries by Sex in Markham
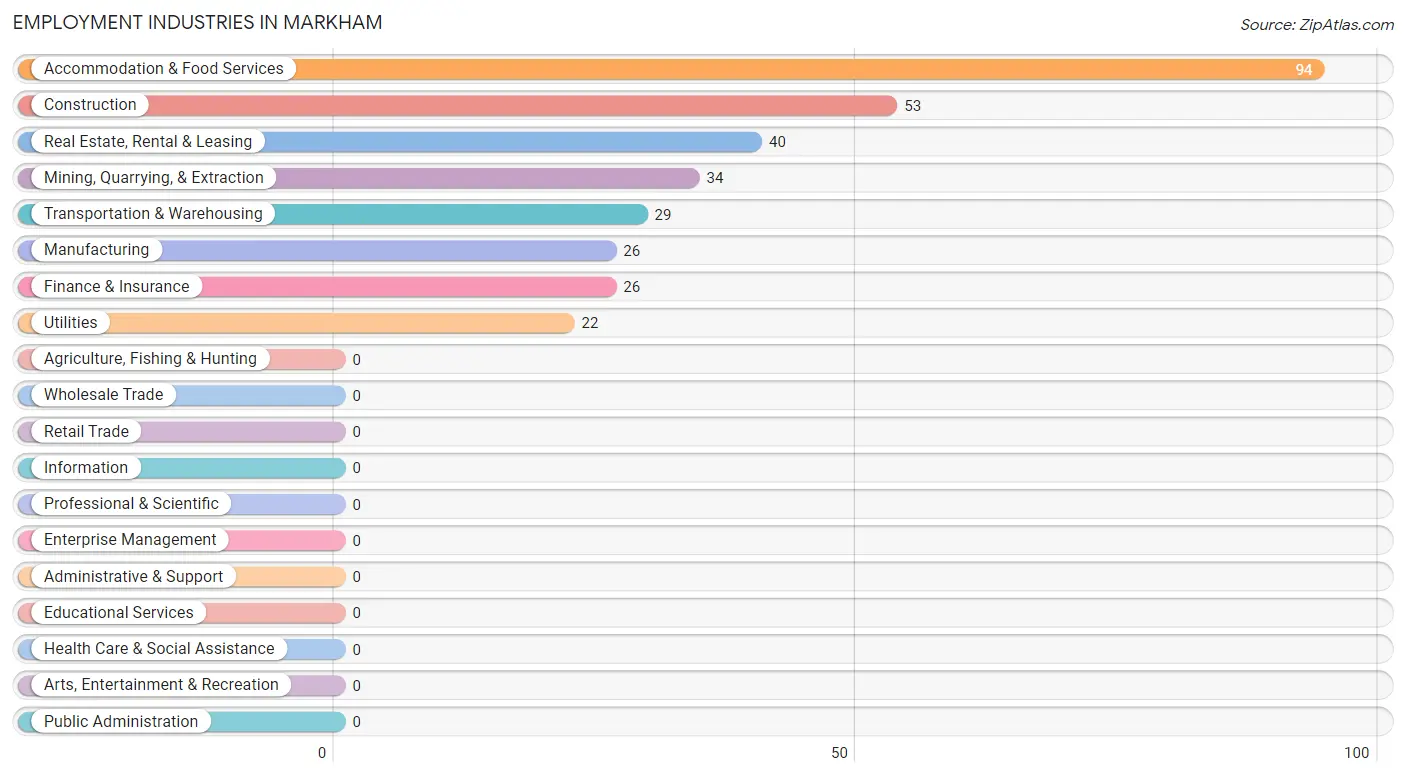
Employment Industries in Markham
The major employment industries in Markham include Accommodation & Food Services (94 | 28.5%), Construction (53 | 16.1%), Real Estate, Rental & Leasing (40 | 12.1%), Mining, Quarrying, & Extraction (34 | 10.3%), and Transportation & Warehousing (29 | 8.8%).
Employment Industries by Sex in Markham
The Markham industries that see more men than women are Construction (100.0%), Manufacturing (100.0%), and Transportation & Warehousing (100.0%), whereas the industries that tend to have a higher number of women are Mining, Quarrying, & Extraction (100.0%), and Accommodation & Food Services (100.0%).
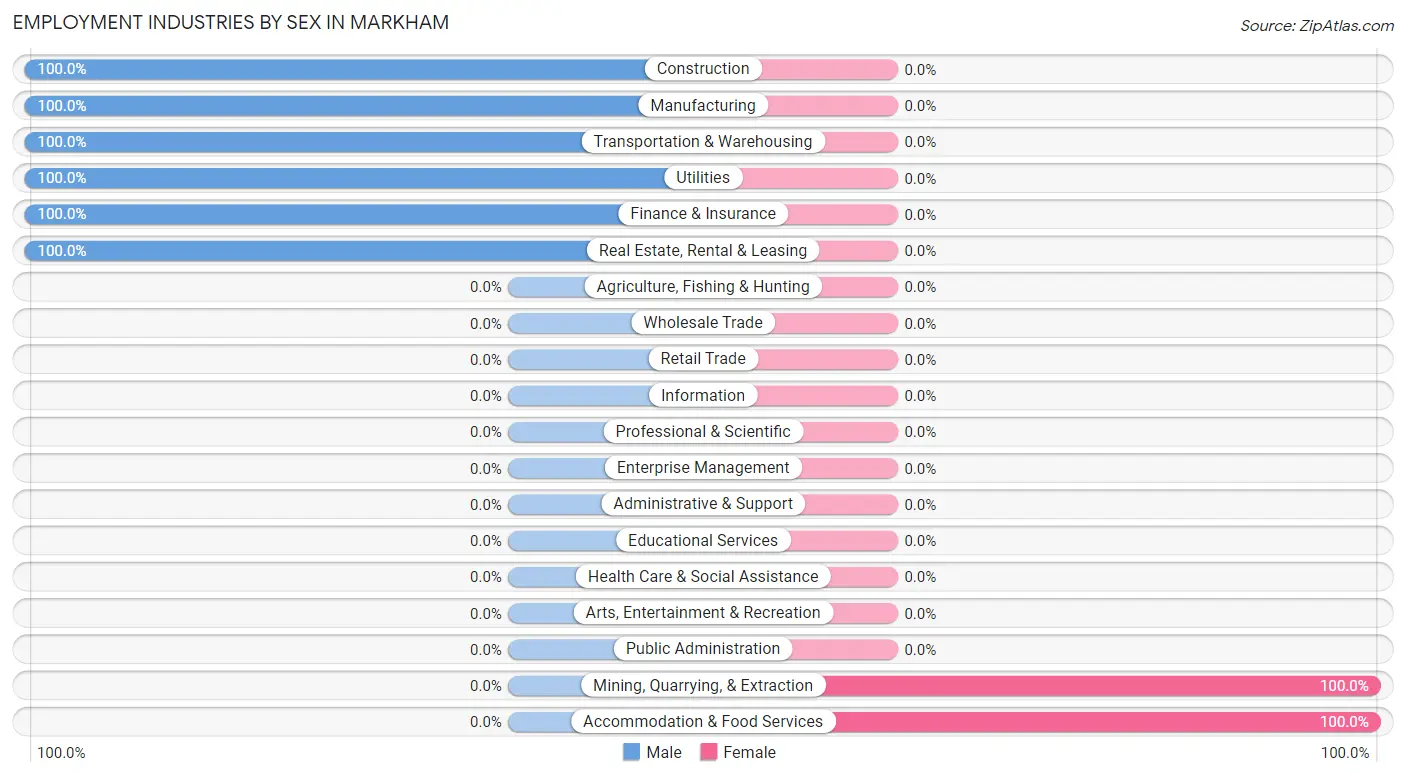
| Industry | Male | Female |
| Agriculture, Fishing & Hunting | 0 (0.0%) | 0 (0.0%) |
| Mining, Quarrying, & Extraction | 0 (0.0%) | 34 (100.0%) |
| Construction | 53 (100.0%) | 0 (0.0%) |
| Manufacturing | 26 (100.0%) | 0 (0.0%) |
| Wholesale Trade | 0 (0.0%) | 0 (0.0%) |
| Retail Trade | 0 (0.0%) | 0 (0.0%) |
| Transportation & Warehousing | 29 (100.0%) | 0 (0.0%) |
| Utilities | 22 (100.0%) | 0 (0.0%) |
| Information | 0 (0.0%) | 0 (0.0%) |
| Finance & Insurance | 26 (100.0%) | 0 (0.0%) |
| Real Estate, Rental & Leasing | 40 (100.0%) | 0 (0.0%) |
| Professional & Scientific | 0 (0.0%) | 0 (0.0%) |
| Enterprise Management | 0 (0.0%) | 0 (0.0%) |
| Administrative & Support | 0 (0.0%) | 0 (0.0%) |
| Educational Services | 0 (0.0%) | 0 (0.0%) |
| Health Care & Social Assistance | 0 (0.0%) | 0 (0.0%) |
| Arts, Entertainment & Recreation | 0 (0.0%) | 0 (0.0%) |
| Accommodation & Food Services | 0 (0.0%) | 94 (100.0%) |
| Public Administration | 0 (0.0%) | 0 (0.0%) |
| Total | 196 (59.4%) | 134 (40.6%) |
Education in Markham
School Enrollment in Markham
The most common levels of schooling among the 384 students in Markham are high school (153 | 39.8%), middle school (80 | 20.8%), and elementary school (64 | 16.7%).
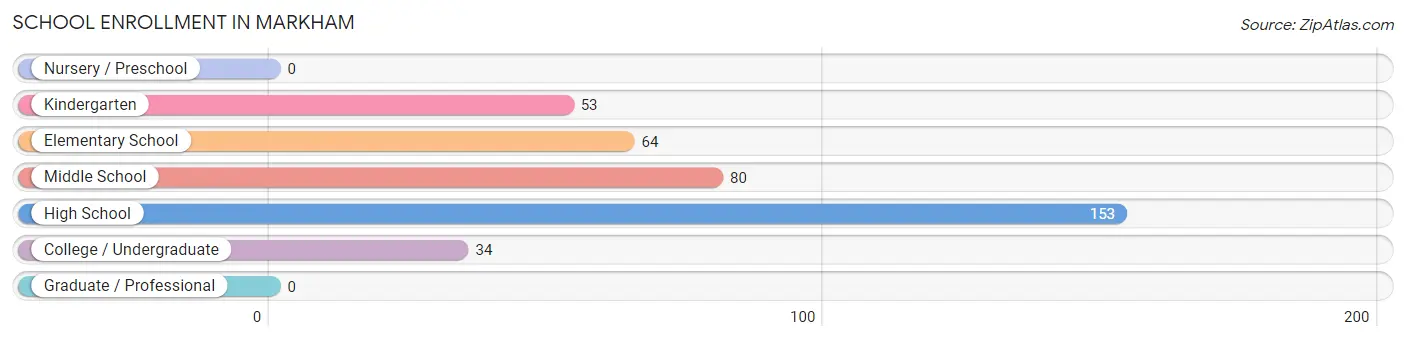
| School Level | # Students | % Students |
| Nursery / Preschool | 0 | 0.0% |
| Kindergarten | 53 | 13.8% |
| Elementary School | 64 | 16.7% |
| Middle School | 80 | 20.8% |
| High School | 153 | 39.8% |
| College / Undergraduate | 34 | 8.8% |
| Graduate / Professional | 0 | 0.0% |
| Total | 384 | 100.0% |
School Enrollment by Age by Funding Source in Markham
Out of a total of 384 students who are enrolled in schools in Markham, 142 (37.0%) attend a private institution, while the remaining 242 (63.0%) are enrolled in public schools. The age group of 18 to 19 year olds has the highest likelihood of being enrolled in private schools, with 67 (100.0% in the age bracket) enrolled. Conversely, the age group of 3 to 4 year olds has the lowest likelihood of being enrolled in a private school, with 53 (100.0% in the age bracket) attending a public institution.
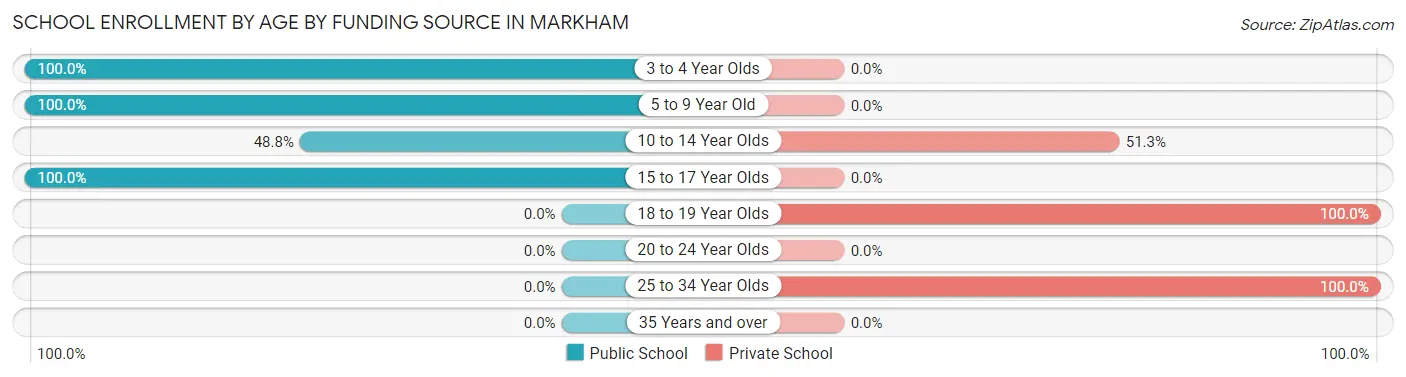
| Age Bracket | Public School | Private School |
| 3 to 4 Year Olds | 53 (100.0%) | 0 (0.0%) |
| 5 to 9 Year Old | 64 (100.0%) | 0 (0.0%) |
| 10 to 14 Year Olds | 39 (48.7%) | 41 (51.2%) |
| 15 to 17 Year Olds | 86 (100.0%) | 0 (0.0%) |
| 18 to 19 Year Olds | 0 (0.0%) | 67 (100.0%) |
| 20 to 24 Year Olds | 0 (0.0%) | 0 (0.0%) |
| 25 to 34 Year Olds | 0 (0.0%) | 34 (100.0%) |
| 35 Years and over | 0 (0.0%) | 0 (0.0%) |
| Total | 242 (63.0%) | 142 (37.0%) |
Educational Attainment by Field of Study in Markham
Liberal arts & history (34 | 41.0%), engineering (26 | 31.3%), and business (23 | 27.7%) are the most common fields of study among 83 individuals in Markham who have obtained a bachelor's degree or higher.
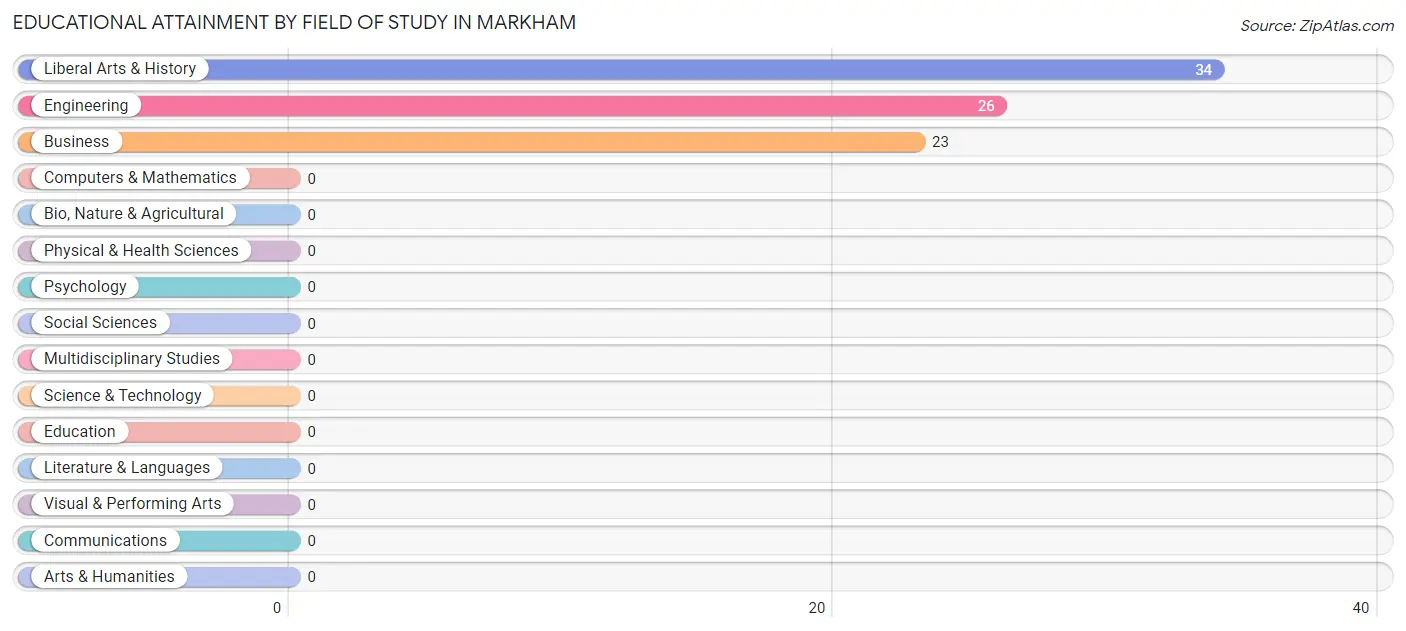
| Field of Study | # Graduates | % Graduates |
| Computers & Mathematics | 0 | 0.0% |
| Bio, Nature & Agricultural | 0 | 0.0% |
| Physical & Health Sciences | 0 | 0.0% |
| Psychology | 0 | 0.0% |
| Social Sciences | 0 | 0.0% |
| Engineering | 26 | 31.3% |
| Multidisciplinary Studies | 0 | 0.0% |
| Science & Technology | 0 | 0.0% |
| Business | 23 | 27.7% |
| Education | 0 | 0.0% |
| Literature & Languages | 0 | 0.0% |
| Liberal Arts & History | 34 | 41.0% |
| Visual & Performing Arts | 0 | 0.0% |
| Communications | 0 | 0.0% |
| Arts & Humanities | 0 | 0.0% |
| Total | 83 | 100.0% |
Transportation & Commute in Markham
Vehicle Availability by Sex in Markham
The most prevalent vehicle ownership categories in Markham are males with 2 vehicles (117, accounting for 59.7%) and females with 2 vehicles (34, making up 87.3%).
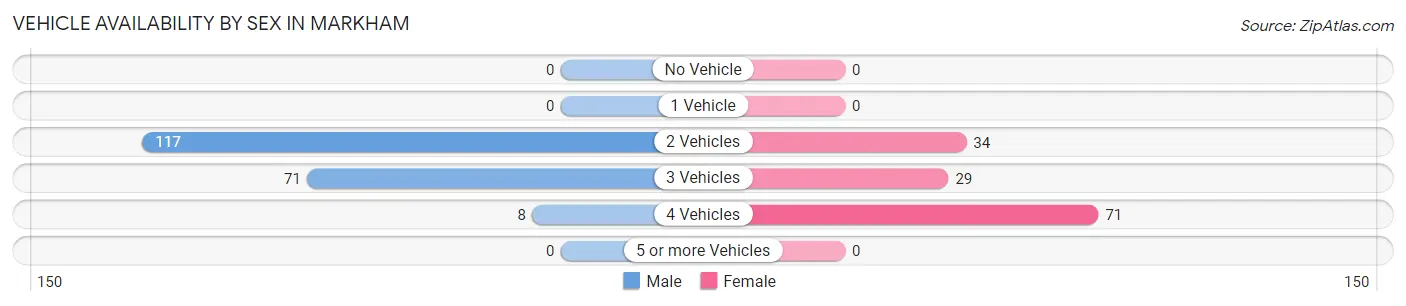
| Vehicles Available | Male | Female |
| No Vehicle | 0 (0.0%) | 0 (0.0%) |
| 1 Vehicle | 0 (0.0%) | 0 (0.0%) |
| 2 Vehicles | 117 (59.7%) | 34 (25.4%) |
| 3 Vehicles | 71 (36.2%) | 29 (21.6%) |
| 4 Vehicles | 8 (4.1%) | 71 (53.0%) |
| 5 or more Vehicles | 0 (0.0%) | 0 (0.0%) |
| Total | 196 (100.0%) | 134 (100.0%) |
Commute Time in Markham
The most frequently occuring commute durations in Markham are 15 to 19 minutes (120 commuters, 36.4%), 60 to 89 minutes (79 commuters, 23.9%), and less than 5 minutes (65 commuters, 19.7%).
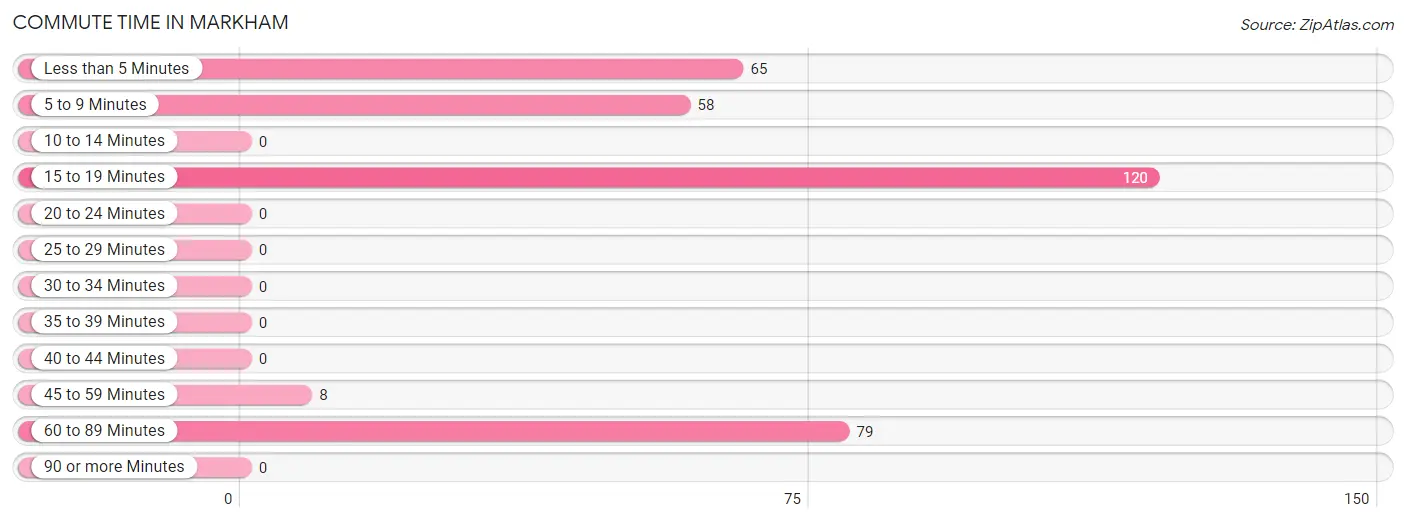
| Commute Time | # Commuters | % Commuters |
| Less than 5 Minutes | 65 | 19.7% |
| 5 to 9 Minutes | 58 | 17.6% |
| 10 to 14 Minutes | 0 | 0.0% |
| 15 to 19 Minutes | 120 | 36.4% |
| 20 to 24 Minutes | 0 | 0.0% |
| 25 to 29 Minutes | 0 | 0.0% |
| 30 to 34 Minutes | 0 | 0.0% |
| 35 to 39 Minutes | 0 | 0.0% |
| 40 to 44 Minutes | 0 | 0.0% |
| 45 to 59 Minutes | 8 | 2.4% |
| 60 to 89 Minutes | 79 | 23.9% |
| 90 or more Minutes | 0 | 0.0% |
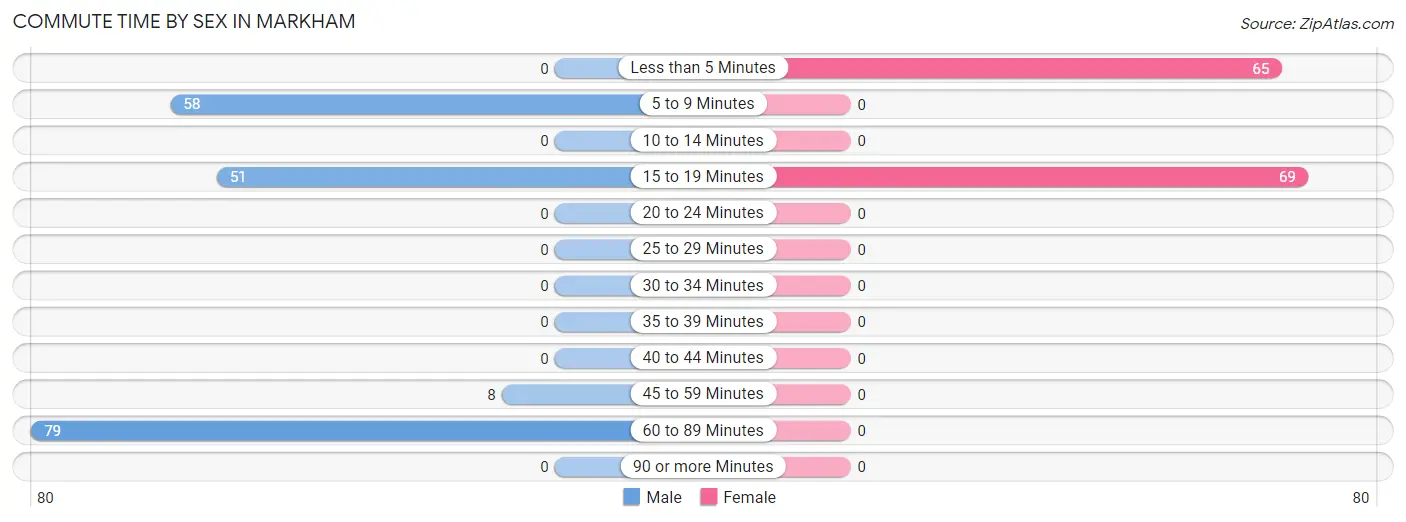
Commute Time by Sex in Markham
The most common commute times in Markham are 60 to 89 minutes (79 commuters, 40.3%) for males and 15 to 19 minutes (69 commuters, 51.5%) for females.
| Commute Time | Male | Female |
| Less than 5 Minutes | 0 (0.0%) | 65 (48.5%) |
| 5 to 9 Minutes | 58 (29.6%) | 0 (0.0%) |
| 10 to 14 Minutes | 0 (0.0%) | 0 (0.0%) |
| 15 to 19 Minutes | 51 (26.0%) | 69 (51.5%) |
| 20 to 24 Minutes | 0 (0.0%) | 0 (0.0%) |
| 25 to 29 Minutes | 0 (0.0%) | 0 (0.0%) |
| 30 to 34 Minutes | 0 (0.0%) | 0 (0.0%) |
| 35 to 39 Minutes | 0 (0.0%) | 0 (0.0%) |
| 40 to 44 Minutes | 0 (0.0%) | 0 (0.0%) |
| 45 to 59 Minutes | 8 (4.1%) | 0 (0.0%) |
| 60 to 89 Minutes | 79 (40.3%) | 0 (0.0%) |
| 90 or more Minutes | 0 (0.0%) | 0 (0.0%) |
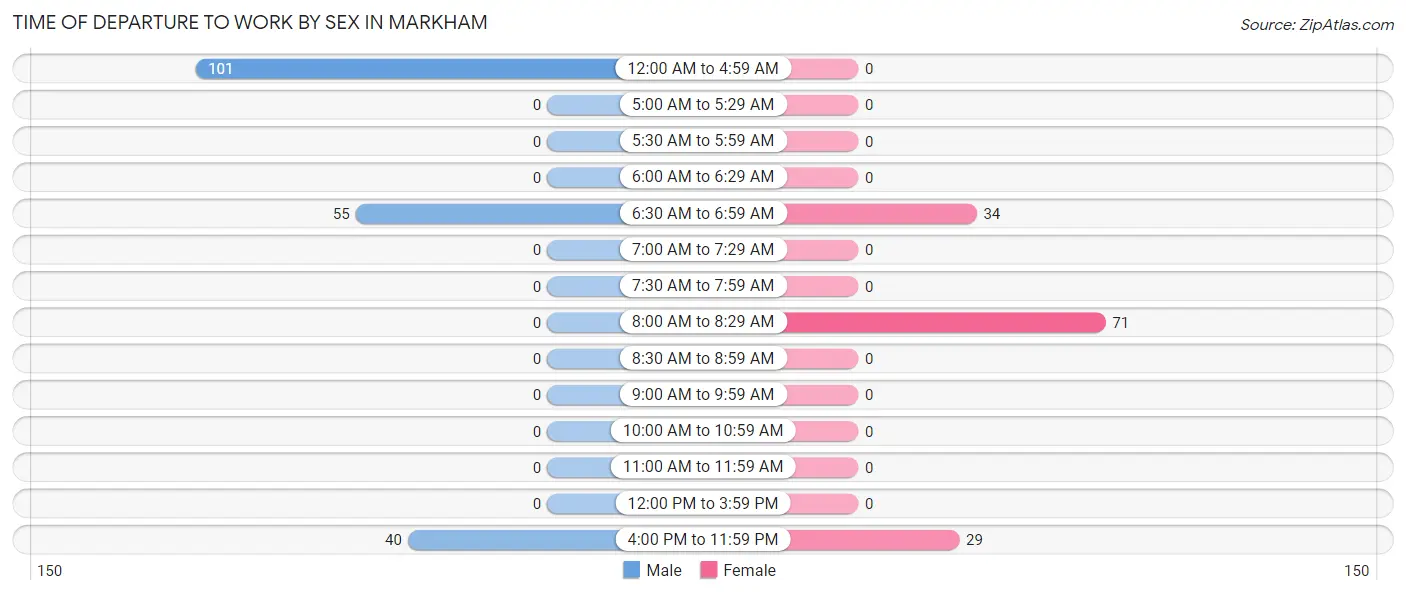
Time of Departure to Work by Sex in Markham
The most frequent times of departure to work in Markham are 12:00 AM to 4:59 AM (101, 51.5%) for males and 8:00 AM to 8:29 AM (71, 53.0%) for females.
| Time of Departure | Male | Female |
| 12:00 AM to 4:59 AM | 101 (51.5%) | 0 (0.0%) |
| 5:00 AM to 5:29 AM | 0 (0.0%) | 0 (0.0%) |
| 5:30 AM to 5:59 AM | 0 (0.0%) | 0 (0.0%) |
| 6:00 AM to 6:29 AM | 0 (0.0%) | 0 (0.0%) |
| 6:30 AM to 6:59 AM | 55 (28.1%) | 34 (25.4%) |
| 7:00 AM to 7:29 AM | 0 (0.0%) | 0 (0.0%) |
| 7:30 AM to 7:59 AM | 0 (0.0%) | 0 (0.0%) |
| 8:00 AM to 8:29 AM | 0 (0.0%) | 71 (53.0%) |
| 8:30 AM to 8:59 AM | 0 (0.0%) | 0 (0.0%) |
| 9:00 AM to 9:59 AM | 0 (0.0%) | 0 (0.0%) |
| 10:00 AM to 10:59 AM | 0 (0.0%) | 0 (0.0%) |
| 11:00 AM to 11:59 AM | 0 (0.0%) | 0 (0.0%) |
| 12:00 PM to 3:59 PM | 0 (0.0%) | 0 (0.0%) |
| 4:00 PM to 11:59 PM | 40 (20.4%) | 29 (21.6%) |
| Total | 196 (100.0%) | 134 (100.0%) |
Housing Occupancy in Markham
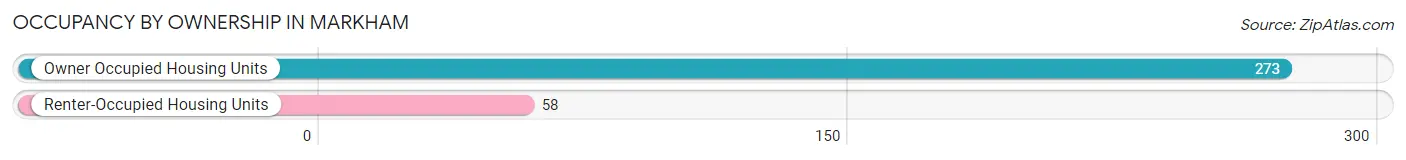
Occupancy by Ownership in Markham
Of the total 331 dwellings in Markham, owner-occupied units account for 273 (82.5%), while renter-occupied units make up 58 (17.5%).
| Occupancy | # Housing Units | % Housing Units |
| Owner Occupied Housing Units | 273 | 82.5% |
| Renter-Occupied Housing Units | 58 | 17.5% |
| Total Occupied Housing Units | 331 | 100.0% |
Occupancy by Household Size in Markham
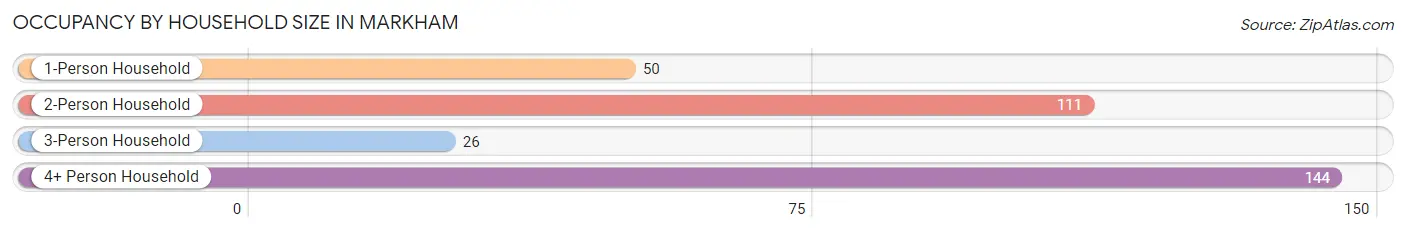
| Household Size | # Housing Units | % Housing Units |
| 1-Person Household | 50 | 15.1% |
| 2-Person Household | 111 | 33.5% |
| 3-Person Household | 26 | 7.9% |
| 4+ Person Household | 144 | 43.5% |
| Total Housing Units | 331 | 100.0% |
Occupancy by Ownership by Household Size in Markham
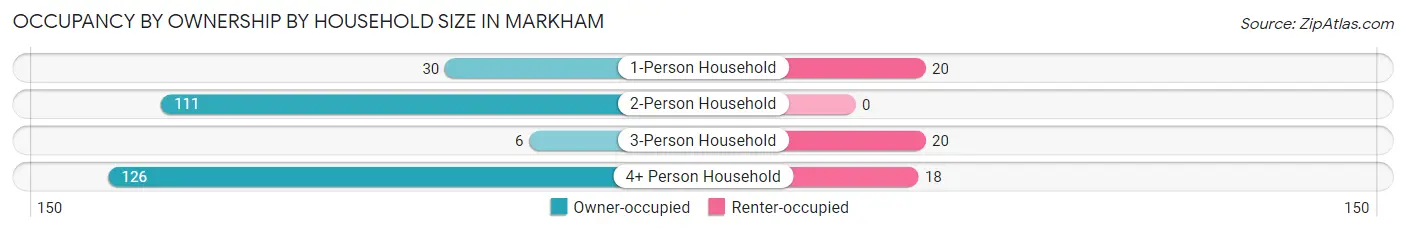
| Household Size | Owner-occupied | Renter-occupied |
| 1-Person Household | 30 (60.0%) | 20 (40.0%) |
| 2-Person Household | 111 (100.0%) | 0 (0.0%) |
| 3-Person Household | 6 (23.1%) | 20 (76.9%) |
| 4+ Person Household | 126 (87.5%) | 18 (12.5%) |
| Total Housing Units | 273 (82.5%) | 58 (17.5%) |
Occupancy by Educational Attainment in Markham
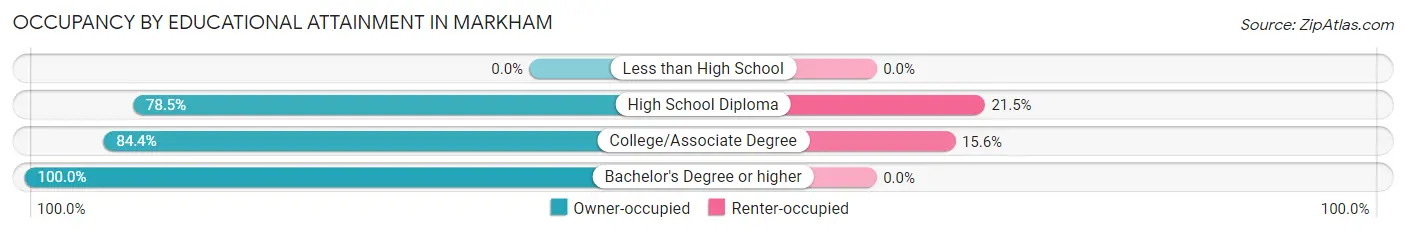
| Household Size | Owner-occupied | Renter-occupied |
| Less than High School | 0 (0.0%) | 0 (0.0%) |
| High School Diploma | 139 (78.5%) | 38 (21.5%) |
| College/Associate Degree | 108 (84.4%) | 20 (15.6%) |
| Bachelor's Degree or higher | 26 (100.0%) | 0 (0.0%) |
Occupancy by Age of Householder in Markham
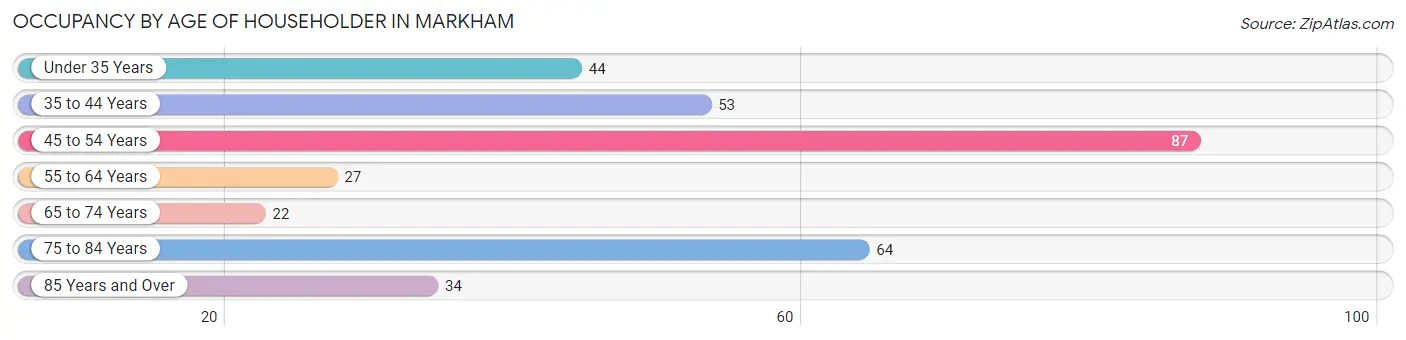
| Age Bracket | # Households | % Households |
| Under 35 Years | 44 | 13.3% |
| 35 to 44 Years | 53 | 16.0% |
| 45 to 54 Years | 87 | 26.3% |
| 55 to 64 Years | 27 | 8.2% |
| 65 to 74 Years | 22 | 6.7% |
| 75 to 84 Years | 64 | 19.3% |
| 85 Years and Over | 34 | 10.3% |
| Total | 331 | 100.0% |
Housing Finances in Markham
Median Income by Occupancy in Markham
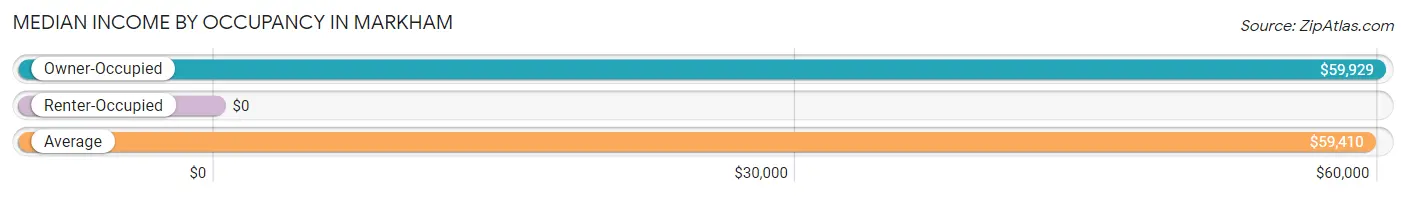
| Occupancy Type | # Households | Median Income |
| Owner-Occupied | 273 (82.5%) | $59,929 |
| Renter-Occupied | 58 (17.5%) | $0 |
| Average | 331 (100.0%) | $59,410 |
Occupancy by Householder Income Bracket in Markham
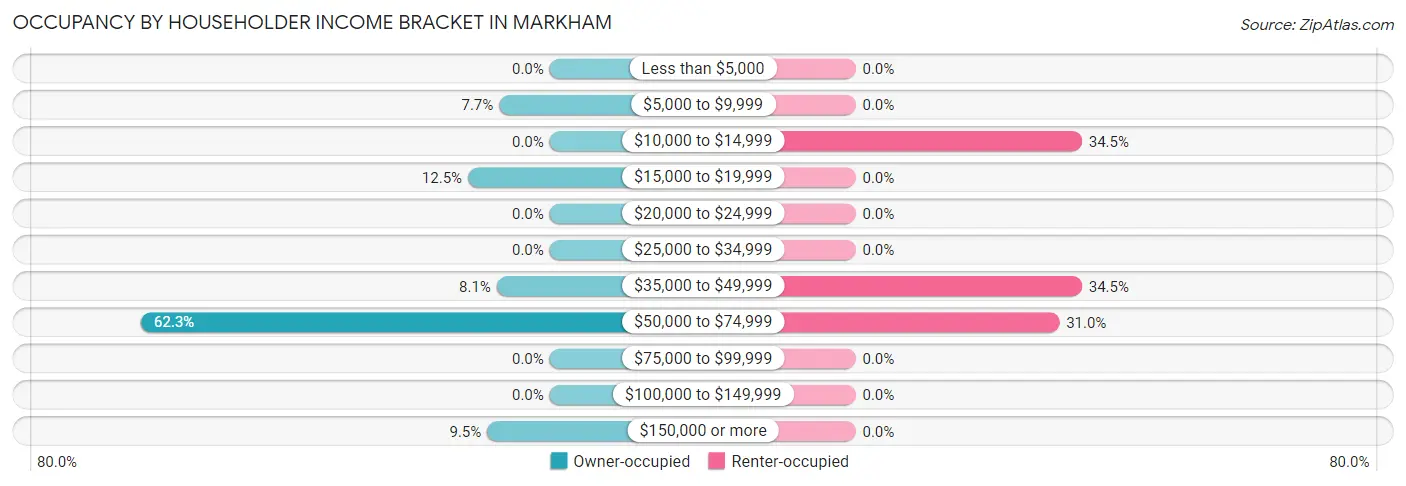
| Income Bracket | Owner-occupied | Renter-occupied |
| Less than $5,000 | 0 (0.0%) | 0 (0.0%) |
| $5,000 to $9,999 | 21 (7.7%) | 0 (0.0%) |
| $10,000 to $14,999 | 0 (0.0%) | 20 (34.5%) |
| $15,000 to $19,999 | 34 (12.4%) | 0 (0.0%) |
| $20,000 to $24,999 | 0 (0.0%) | 0 (0.0%) |
| $25,000 to $34,999 | 0 (0.0%) | 0 (0.0%) |
| $35,000 to $49,999 | 22 (8.1%) | 20 (34.5%) |
| $50,000 to $74,999 | 170 (62.3%) | 18 (31.0%) |
| $75,000 to $99,999 | 0 (0.0%) | 0 (0.0%) |
| $100,000 to $149,999 | 0 (0.0%) | 0 (0.0%) |
| $150,000 or more | 26 (9.5%) | 0 (0.0%) |
| Total | 273 (100.0%) | 58 (100.0%) |
Monthly Housing Cost Tiers in Markham
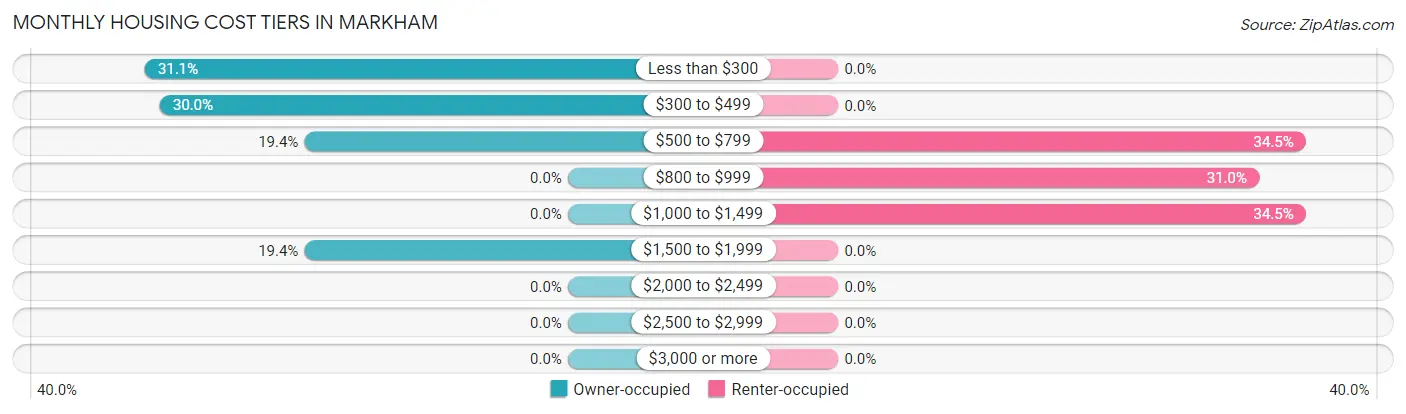
| Monthly Cost | Owner-occupied | Renter-occupied |
| Less than $300 | 85 (31.1%) | 0 (0.0%) |
| $300 to $499 | 82 (30.0%) | 0 (0.0%) |
| $500 to $799 | 53 (19.4%) | 20 (34.5%) |
| $800 to $999 | 0 (0.0%) | 18 (31.0%) |
| $1,000 to $1,499 | 0 (0.0%) | 20 (34.5%) |
| $1,500 to $1,999 | 53 (19.4%) | 0 (0.0%) |
| $2,000 to $2,499 | 0 (0.0%) | 0 (0.0%) |
| $2,500 to $2,999 | 0 (0.0%) | 0 (0.0%) |
| $3,000 or more | 0 (0.0%) | 0 (0.0%) |
| Total | 273 (100.0%) | 58 (100.0%) |
Physical Housing Characteristics in Markham
Housing Structures in Markham
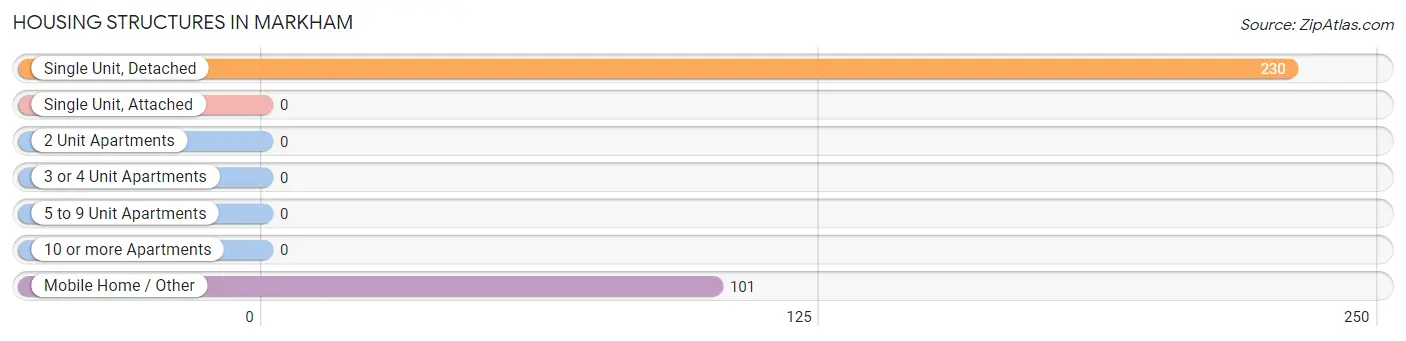
| Structure Type | # Housing Units | % Housing Units |
| Single Unit, Detached | 230 | 69.5% |
| Single Unit, Attached | 0 | 0.0% |
| 2 Unit Apartments | 0 | 0.0% |
| 3 or 4 Unit Apartments | 0 | 0.0% |
| 5 to 9 Unit Apartments | 0 | 0.0% |
| 10 or more Apartments | 0 | 0.0% |
| Mobile Home / Other | 101 | 30.5% |
| Total | 331 | 100.0% |
Housing Structures by Occupancy in Markham
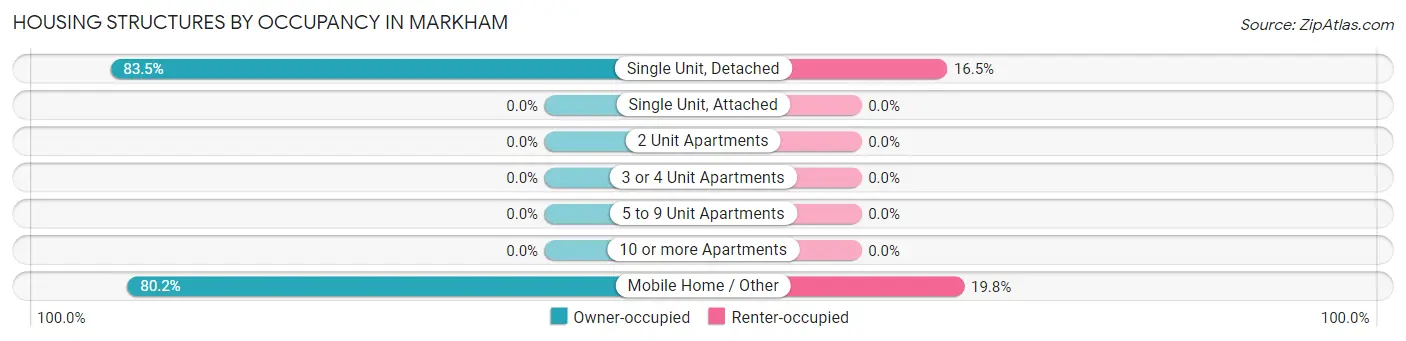
| Structure Type | Owner-occupied | Renter-occupied |
| Single Unit, Detached | 192 (83.5%) | 38 (16.5%) |
| Single Unit, Attached | 0 (0.0%) | 0 (0.0%) |
| 2 Unit Apartments | 0 (0.0%) | 0 (0.0%) |
| 3 or 4 Unit Apartments | 0 (0.0%) | 0 (0.0%) |
| 5 to 9 Unit Apartments | 0 (0.0%) | 0 (0.0%) |
| 10 or more Apartments | 0 (0.0%) | 0 (0.0%) |
| Mobile Home / Other | 81 (80.2%) | 20 (19.8%) |
| Total | 273 (82.5%) | 58 (17.5%) |
Housing Structures by Number of Rooms in Markham
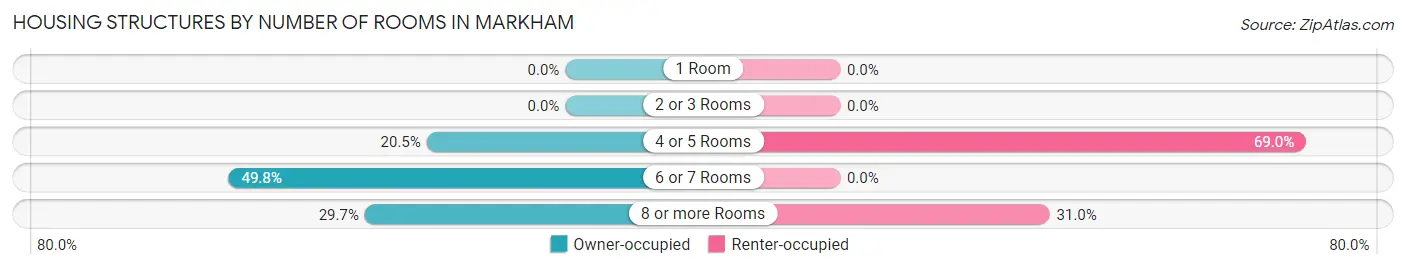
| Number of Rooms | Owner-occupied | Renter-occupied |
| 1 Room | 0 (0.0%) | 0 (0.0%) |
| 2 or 3 Rooms | 0 (0.0%) | 0 (0.0%) |
| 4 or 5 Rooms | 56 (20.5%) | 40 (69.0%) |
| 6 or 7 Rooms | 136 (49.8%) | 0 (0.0%) |
| 8 or more Rooms | 81 (29.7%) | 18 (31.0%) |
| Total | 273 (100.0%) | 58 (100.0%) |
Housing Structure by Heating Type in Markham
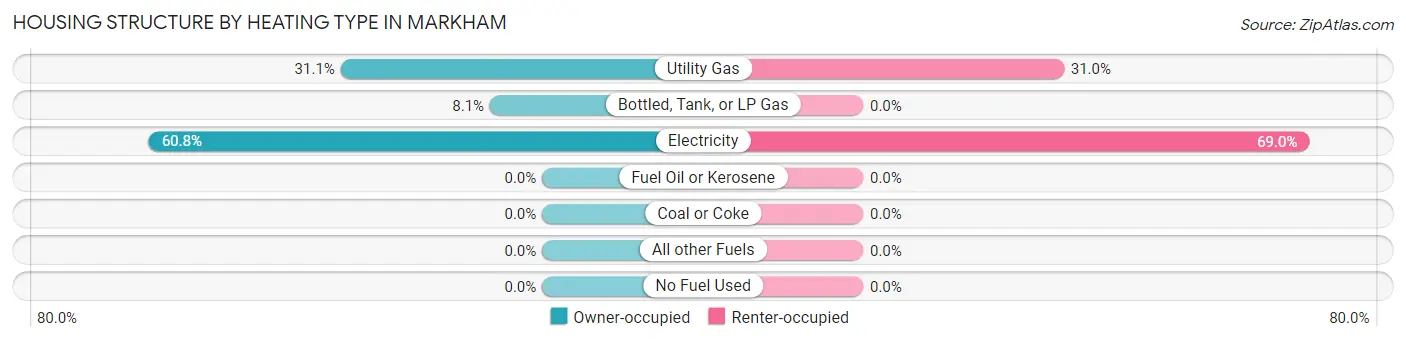
| Heating Type | Owner-occupied | Renter-occupied |
| Utility Gas | 85 (31.1%) | 18 (31.0%) |
| Bottled, Tank, or LP Gas | 22 (8.1%) | 0 (0.0%) |
| Electricity | 166 (60.8%) | 40 (69.0%) |
| Fuel Oil or Kerosene | 0 (0.0%) | 0 (0.0%) |
| Coal or Coke | 0 (0.0%) | 0 (0.0%) |
| All other Fuels | 0 (0.0%) | 0 (0.0%) |
| No Fuel Used | 0 (0.0%) | 0 (0.0%) |
| Total | 273 (100.0%) | 58 (100.0%) |
Household Vehicle Usage in Markham
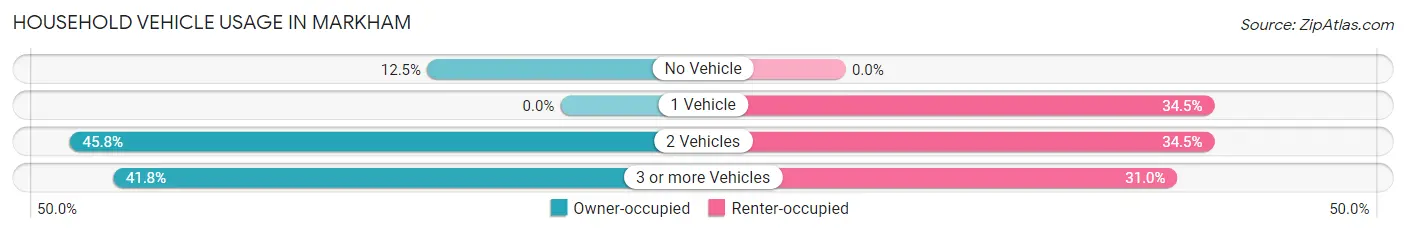
| Vehicles per Household | Owner-occupied | Renter-occupied |
| No Vehicle | 34 (12.4%) | 0 (0.0%) |
| 1 Vehicle | 0 (0.0%) | 20 (34.5%) |
| 2 Vehicles | 125 (45.8%) | 20 (34.5%) |
| 3 or more Vehicles | 114 (41.8%) | 18 (31.0%) |
| Total | 273 (100.0%) | 58 (100.0%) |
Real Estate & Mortgages in Markham
Real Estate and Mortgage Overview in Markham
| Characteristic | Without Mortgage | With Mortgage |
| Housing Units | 220 | 53 |
| Median Property Value | $143,200 | $0 |
| Median Household Income | $62,232 | $0 |
| Monthly Housing Costs | $326 | $0 |
| Real Estate Taxes | $1,182 | $0 |
Property Value by Mortgage Status in Markham
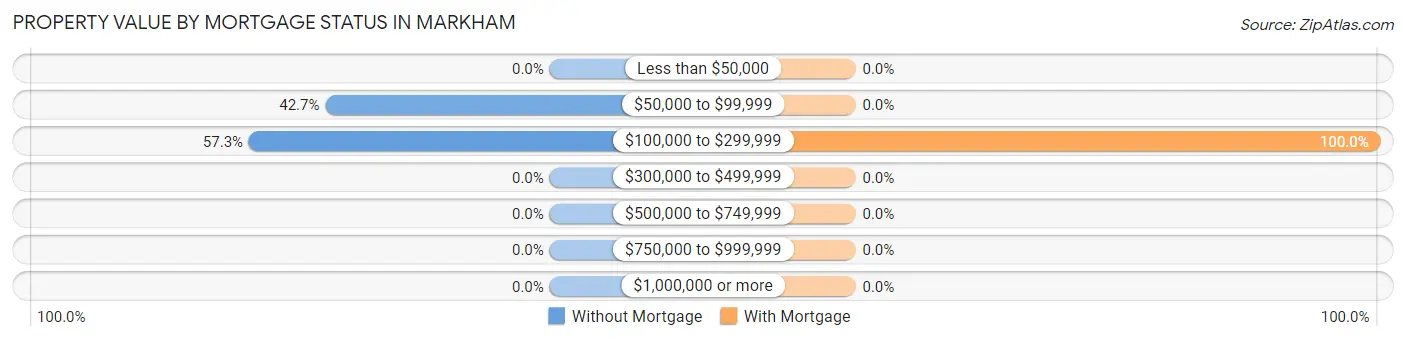
| Property Value | Without Mortgage | With Mortgage |
| Less than $50,000 | 0 (0.0%) | 0 (0.0%) |
| $50,000 to $99,999 | 94 (42.7%) | 0 (0.0%) |
| $100,000 to $299,999 | 126 (57.3%) | 53 (100.0%) |
| $300,000 to $499,999 | 0 (0.0%) | 0 (0.0%) |
| $500,000 to $749,999 | 0 (0.0%) | 0 (0.0%) |
| $750,000 to $999,999 | 0 (0.0%) | 0 (0.0%) |
| $1,000,000 or more | 0 (0.0%) | 0 (0.0%) |
| Total | 220 (100.0%) | 53 (100.0%) |
Household Income by Mortgage Status in Markham
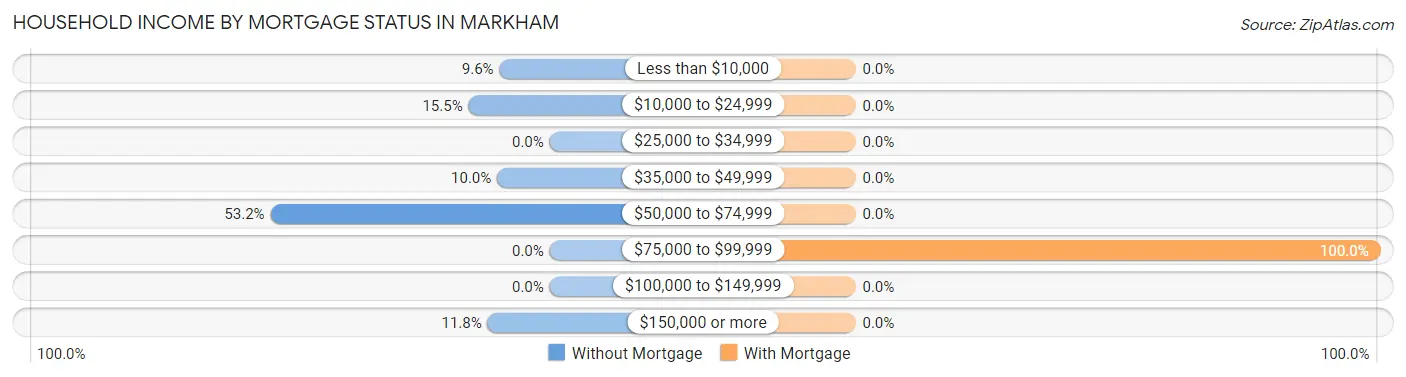
| Household Income | Without Mortgage | With Mortgage |
| Less than $10,000 | 21 (9.6%) | 0 (0.0%) |
| $10,000 to $24,999 | 34 (15.4%) | 0 (0.0%) |
| $25,000 to $34,999 | 0 (0.0%) | 0 (0.0%) |
| $35,000 to $49,999 | 22 (10.0%) | 0 (0.0%) |
| $50,000 to $74,999 | 117 (53.2%) | 0 (0.0%) |
| $75,000 to $99,999 | 0 (0.0%) | 53 (100.0%) |
| $100,000 to $149,999 | 0 (0.0%) | 0 (0.0%) |
| $150,000 or more | 26 (11.8%) | 0 (0.0%) |
| Total | 220 (100.0%) | 53 (100.0%) |
Property Value to Household Income Ratio in Markham
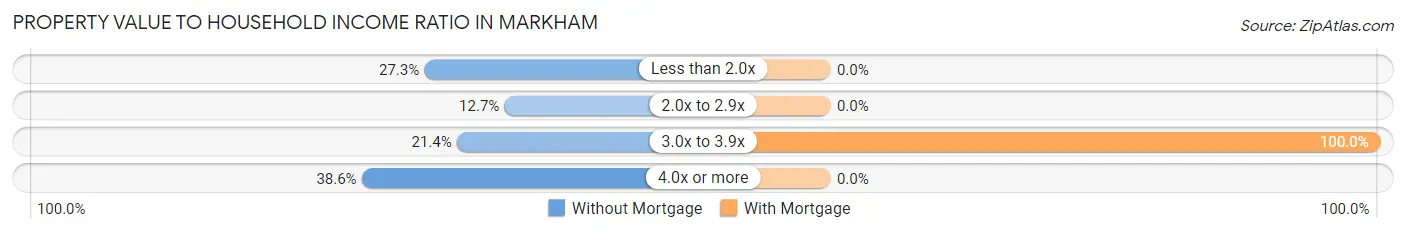
| Value-to-Income Ratio | Without Mortgage | With Mortgage |
| Less than 2.0x | 60 (27.3%) | 0 (0.0%) |
| 2.0x to 2.9x | 28 (12.7%) | 0 (0.0%) |
| 3.0x to 3.9x | 47 (21.4%) | 53 (100.0%) |
| 4.0x or more | 85 (38.6%) | 0 (0.0%) |
| Total | 220 (100.0%) | 53 (100.0%) |
Real Estate Taxes by Mortgage Status in Markham
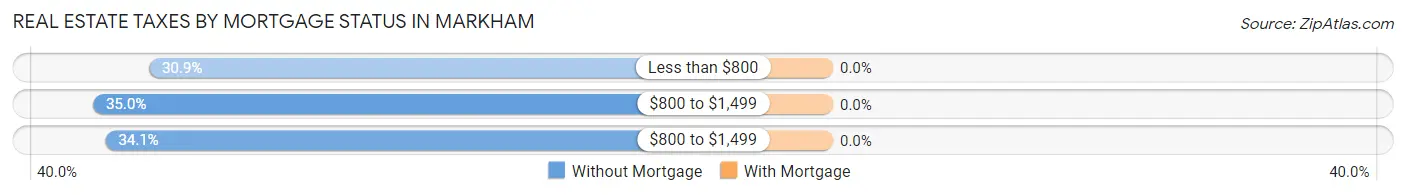
| Property Taxes | Without Mortgage | With Mortgage |
| Less than $800 | 68 (30.9%) | 0 (0.0%) |
| $800 to $1,499 | 77 (35.0%) | 0 (0.0%) |
| $800 to $1,499 | 75 (34.1%) | 0 (0.0%) |
| Total | 220 (100.0%) | 53 (100.0%) |
Health & Disability in Markham
Health Insurance Coverage by Age in Markham
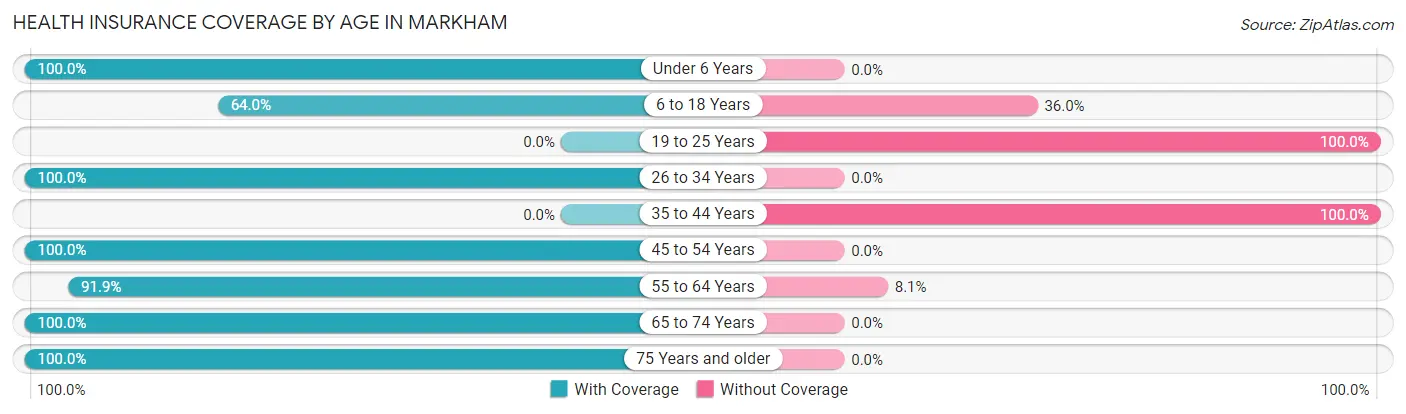
| Age Bracket | With Coverage | Without Coverage |
| Under 6 Years | 212 (100.0%) | 0 (0.0%) |
| 6 to 18 Years | 206 (64.0%) | 116 (36.0%) |
| 19 to 25 Years | 0 (0.0%) | 105 (100.0%) |
| 26 to 34 Years | 139 (100.0%) | 0 (0.0%) |
| 35 to 44 Years | 0 (0.0%) | 53 (100.0%) |
| 45 to 54 Years | 122 (100.0%) | 0 (0.0%) |
| 55 to 64 Years | 68 (91.9%) | 6 (8.1%) |
| 65 to 74 Years | 72 (100.0%) | 0 (0.0%) |
| 75 Years and older | 123 (100.0%) | 0 (0.0%) |
| Total | 942 (77.1%) | 280 (22.9%) |
Health Insurance Coverage by Citizenship Status in Markham
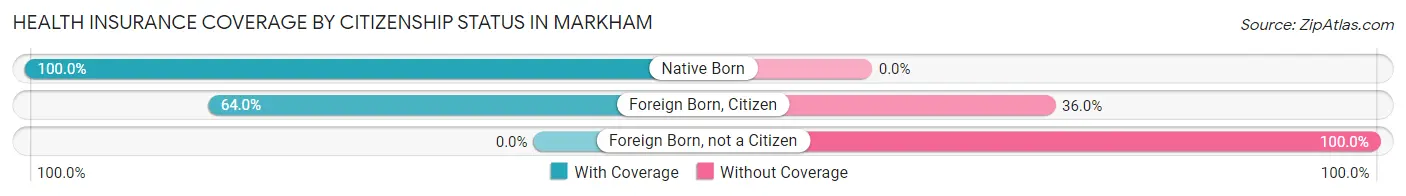
| Citizenship Status | With Coverage | Without Coverage |
| Native Born | 212 (100.0%) | 0 (0.0%) |
| Foreign Born, Citizen | 206 (64.0%) | 116 (36.0%) |
| Foreign Born, not a Citizen | 0 (0.0%) | 105 (100.0%) |
Health Insurance Coverage by Household Income in Markham
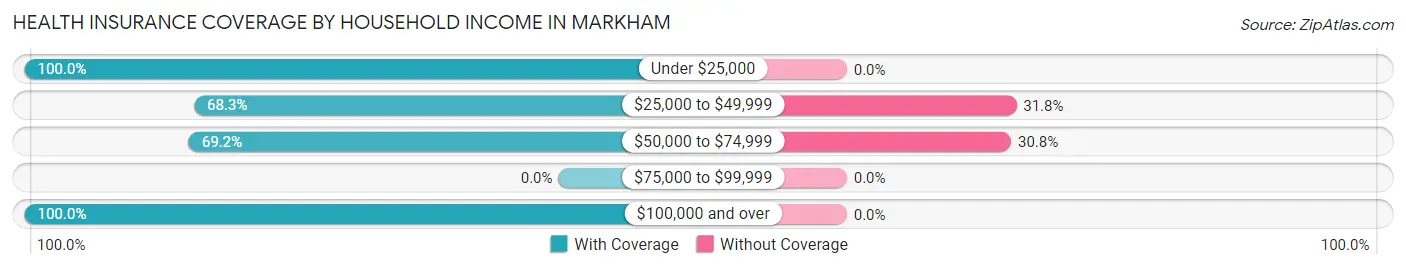
| Household Income | With Coverage | Without Coverage |
| Under $25,000 | 123 (100.0%) | 0 (0.0%) |
| $25,000 to $49,999 | 86 (68.2%) | 40 (31.8%) |
| $50,000 to $74,999 | 540 (69.2%) | 240 (30.8%) |
| $75,000 to $99,999 | 0 (0.0%) | 0 (0.0%) |
| $100,000 and over | 193 (100.0%) | 0 (0.0%) |
Public vs Private Health Insurance Coverage by Age in Markham
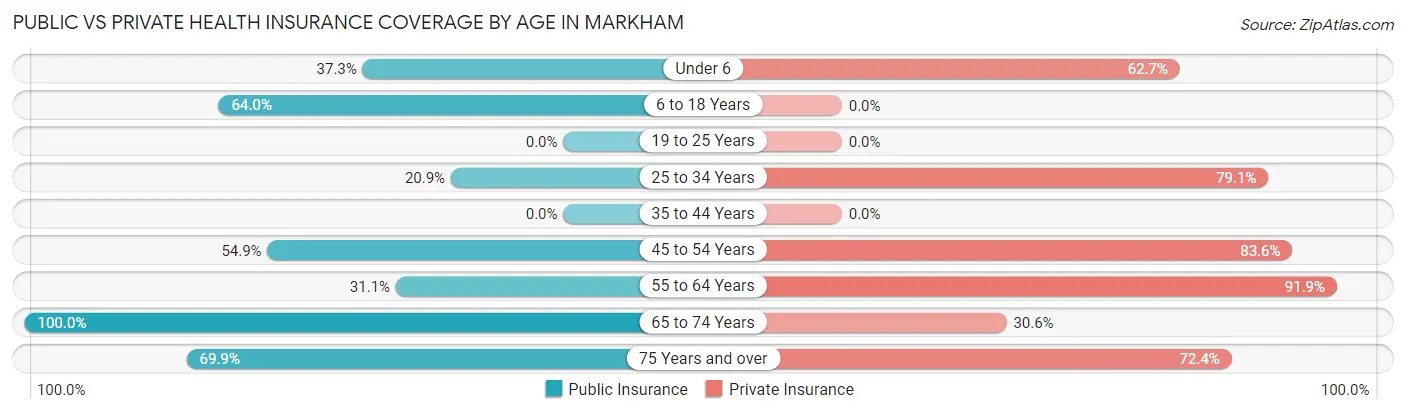
| Age Bracket | Public Insurance | Private Insurance |
| Under 6 | 79 (37.3%) | 133 (62.7%) |
| 6 to 18 Years | 206 (64.0%) | 0 (0.0%) |
| 19 to 25 Years | 0 (0.0%) | 0 (0.0%) |
| 25 to 34 Years | 29 (20.9%) | 110 (79.1%) |
| 35 to 44 Years | 0 (0.0%) | 0 (0.0%) |
| 45 to 54 Years | 67 (54.9%) | 102 (83.6%) |
| 55 to 64 Years | 23 (31.1%) | 68 (91.9%) |
| 65 to 74 Years | 72 (100.0%) | 22 (30.6%) |
| 75 Years and over | 86 (69.9%) | 89 (72.4%) |
| Total | 562 (46.0%) | 524 (42.9%) |
Disability Status by Sex by Age in Markham
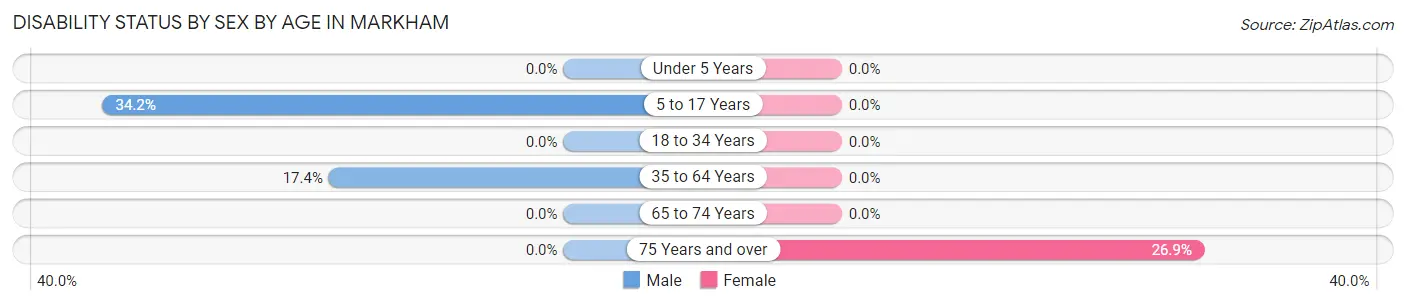
| Age Bracket | Male | Female |
| Under 5 Years | 0 (0.0%) | 0 (0.0%) |
| 5 to 17 Years | 39 (34.2%) | 0 (0.0%) |
| 18 to 34 Years | 0 (0.0%) | 0 (0.0%) |
| 35 to 64 Years | 23 (17.4%) | 0 (0.0%) |
| 65 to 74 Years | 0 (0.0%) | 0 (0.0%) |
| 75 Years and over | 0 (0.0%) | 18 (26.9%) |
Disability Class by Sex by Age in Markham
Disability Class: Hearing Difficulty
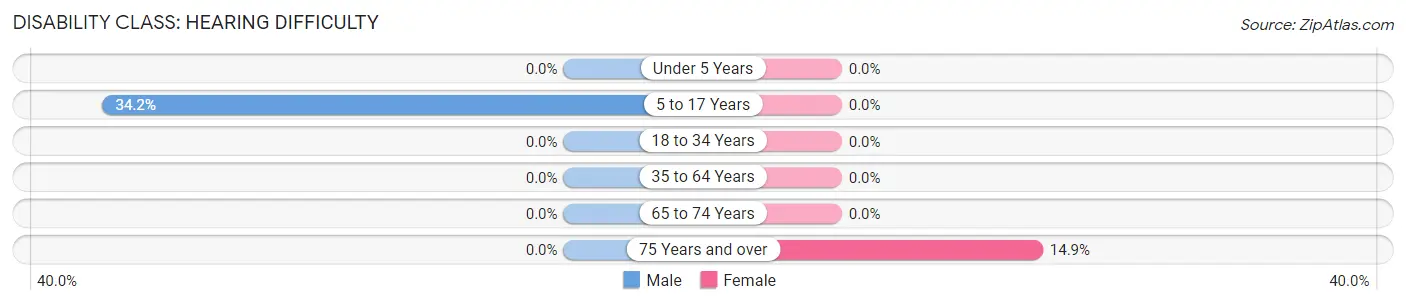
| Age Bracket | Male | Female |
| Under 5 Years | 0 (0.0%) | 0 (0.0%) |
| 5 to 17 Years | 39 (34.2%) | 0 (0.0%) |
| 18 to 34 Years | 0 (0.0%) | 0 (0.0%) |
| 35 to 64 Years | 0 (0.0%) | 0 (0.0%) |
| 65 to 74 Years | 0 (0.0%) | 0 (0.0%) |
| 75 Years and over | 0 (0.0%) | 10 (14.9%) |
Disability Class: Vision Difficulty
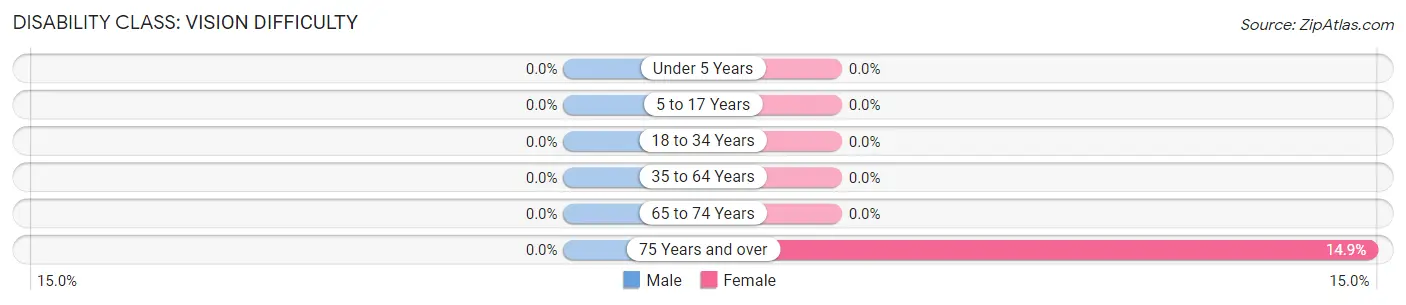
| Age Bracket | Male | Female |
| Under 5 Years | 0 (0.0%) | 0 (0.0%) |
| 5 to 17 Years | 0 (0.0%) | 0 (0.0%) |
| 18 to 34 Years | 0 (0.0%) | 0 (0.0%) |
| 35 to 64 Years | 0 (0.0%) | 0 (0.0%) |
| 65 to 74 Years | 0 (0.0%) | 0 (0.0%) |
| 75 Years and over | 0 (0.0%) | 10 (14.9%) |
Disability Class: Cognitive Difficulty
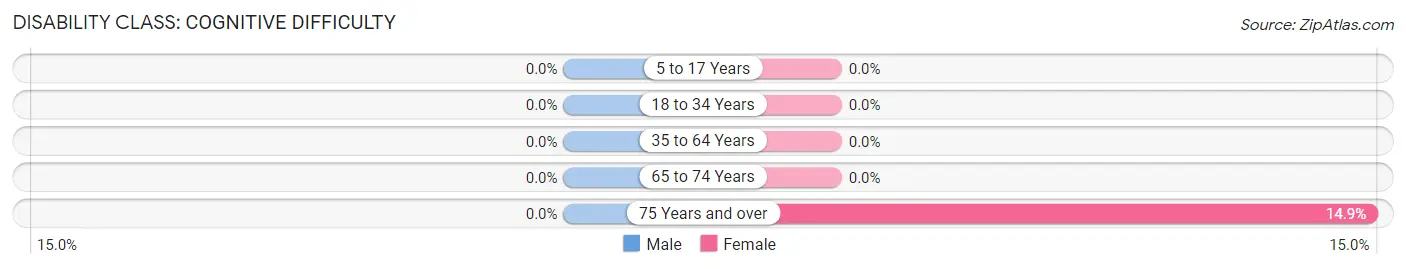
| Age Bracket | Male | Female |
| 5 to 17 Years | 0 (0.0%) | 0 (0.0%) |
| 18 to 34 Years | 0 (0.0%) | 0 (0.0%) |
| 35 to 64 Years | 0 (0.0%) | 0 (0.0%) |
| 65 to 74 Years | 0 (0.0%) | 0 (0.0%) |
| 75 Years and over | 0 (0.0%) | 10 (14.9%) |
Disability Class: Ambulatory Difficulty
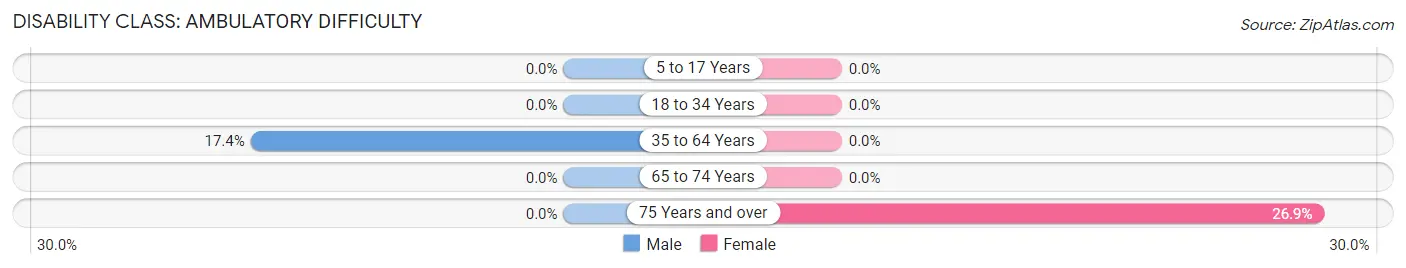
| Age Bracket | Male | Female |
| 5 to 17 Years | 0 (0.0%) | 0 (0.0%) |
| 18 to 34 Years | 0 (0.0%) | 0 (0.0%) |
| 35 to 64 Years | 23 (17.4%) | 0 (0.0%) |
| 65 to 74 Years | 0 (0.0%) | 0 (0.0%) |
| 75 Years and over | 0 (0.0%) | 18 (26.9%) |
Disability Class: Self-Care Difficulty
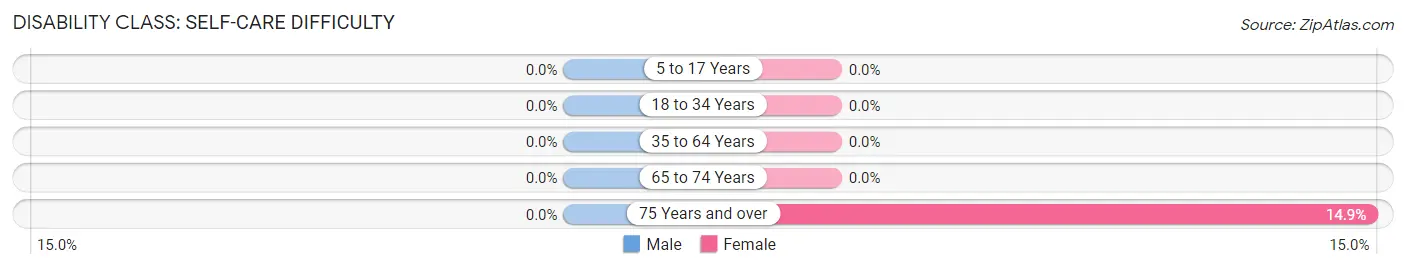
| Age Bracket | Male | Female |
| 5 to 17 Years | 0 (0.0%) | 0 (0.0%) |
| 18 to 34 Years | 0 (0.0%) | 0 (0.0%) |
| 35 to 64 Years | 0 (0.0%) | 0 (0.0%) |
| 65 to 74 Years | 0 (0.0%) | 0 (0.0%) |
| 75 Years and over | 0 (0.0%) | 10 (14.9%) |
Technology Access in Markham
Computing Device Access in Markham
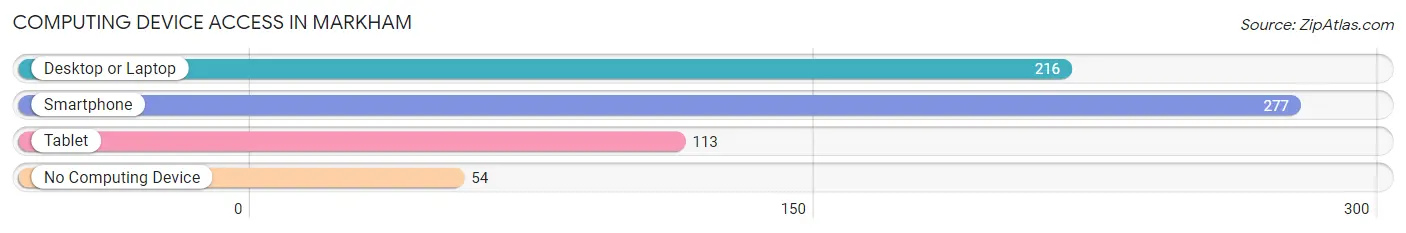
| Device Type | # Households | % Households |
| Desktop or Laptop | 216 | 65.3% |
| Smartphone | 277 | 83.7% |
| Tablet | 113 | 34.1% |
| No Computing Device | 54 | 16.3% |
| Total | 331 | 100.0% |
Internet Access in Markham
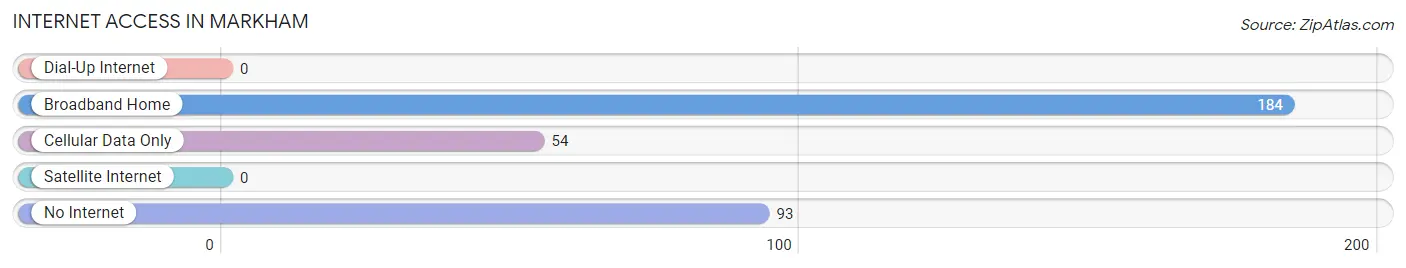
| Internet Type | # Households | % Households |
| Dial-Up Internet | 0 | 0.0% |
| Broadband Home | 184 | 55.6% |
| Cellular Data Only | 54 | 16.3% |
| Satellite Internet | 0 | 0.0% |
| No Internet | 93 | 28.1% |
| Total | 331 | 100.0% |
Markham Summary
Markham, Texas is a small town located in Wharton County, Texas. It is situated about 50 miles southwest of Houston and is part of the Houston–The Woodlands–Sugar Land metropolitan area. The town has a population of 1,845 people, according to the 2010 census.
History
Markham was founded in 1883 by the Markham family, who had moved to the area from Alabama. The town was named after the family’s patriarch, William Markham. The town was originally a farming community, and the Markham family owned a large amount of land in the area.
In the early 1900s, the town began to grow and develop. The Markham family opened a general store, and the town was incorporated in 1912. The town also had a post office, a bank, a hotel, and a cotton gin.
In the 1920s, the town began to decline due to the Great Depression. Many of the businesses in the town closed, and the population decreased.
In the 1940s, the town began to recover. The population increased, and new businesses opened. The town also had a school, a library, and a movie theater.
Geography
Markham is located in Wharton County, Texas. It is situated about 50 miles southwest of Houston and is part of the Houston–The Woodlands–Sugar Land metropolitan area. The town is located on the banks of the Colorado River.
The town has a total area of 1.2 square miles, all of which is land. The terrain is mostly flat, with some rolling hills. The climate is humid subtropical, with hot summers and mild winters.
Economy
The economy of Markham is largely based on agriculture. The town is home to several farms, which produce cotton, corn, and other crops. The town also has a few small businesses, including a grocery store, a hardware store, and a restaurant.
The town is also home to a few manufacturing companies, which produce furniture, clothing, and other products.
Demographics
According to the 2010 census, Markham has a population of 1,845 people. The racial makeup of the town is 79.3% White, 16.2% Hispanic or Latino, 1.7% African American, 0.7% Native American, 0.3% Asian, and 1.9% from other races.
The median household income in Markham is $37,917, and the median family income is $45,000. The per capita income is $17,845. The town has a poverty rate of 17.3%.
The town is served by the Markham Independent School District. The town also has a library, a post office, and a few churches.
Common Questions
What is Per Capita Income in Markham?
Per Capita income in Markham is $16,392.
What is the Median Family Income in Markham?
Median Family Income in Markham is $46,313.
What is the Median Household income in Markham?
Median Household Income in Markham is $59,410.
What is Inequality or Gini Index in Markham?
Inequality or Gini Index in Markham is 0.37.
What is the Total Population of Markham?
Total Population of Markham is 1,222.
What is the Total Male Population of Markham?
Total Male Population of Markham is 587.
What is the Total Female Population of Markham?
Total Female Population of Markham is 635.
What is the Ratio of Males per 100 Females in Markham?
There are 92.44 Males per 100 Females in Markham.
What is the Ratio of Females per 100 Males in Markham?
There are 108.18 Females per 100 Males in Markham.
What is the Median Population Age in Markham?
Median Population Age in Markham is 20.7 Years.
What is the Average Family Size in Markham
Average Family Size in Markham is 4.1 People.
What is the Average Household Size in Markham
Average Household Size in Markham is 3.7 People.
How Large is the Labor Force in Markham?
There are 330 People in the Labor Forcein in Markham.
What is the Percentage of People in the Labor Force in Markham?
39.2% of People are in the Labor Force in Markham.