Valle Vista, TX Map & Demographics
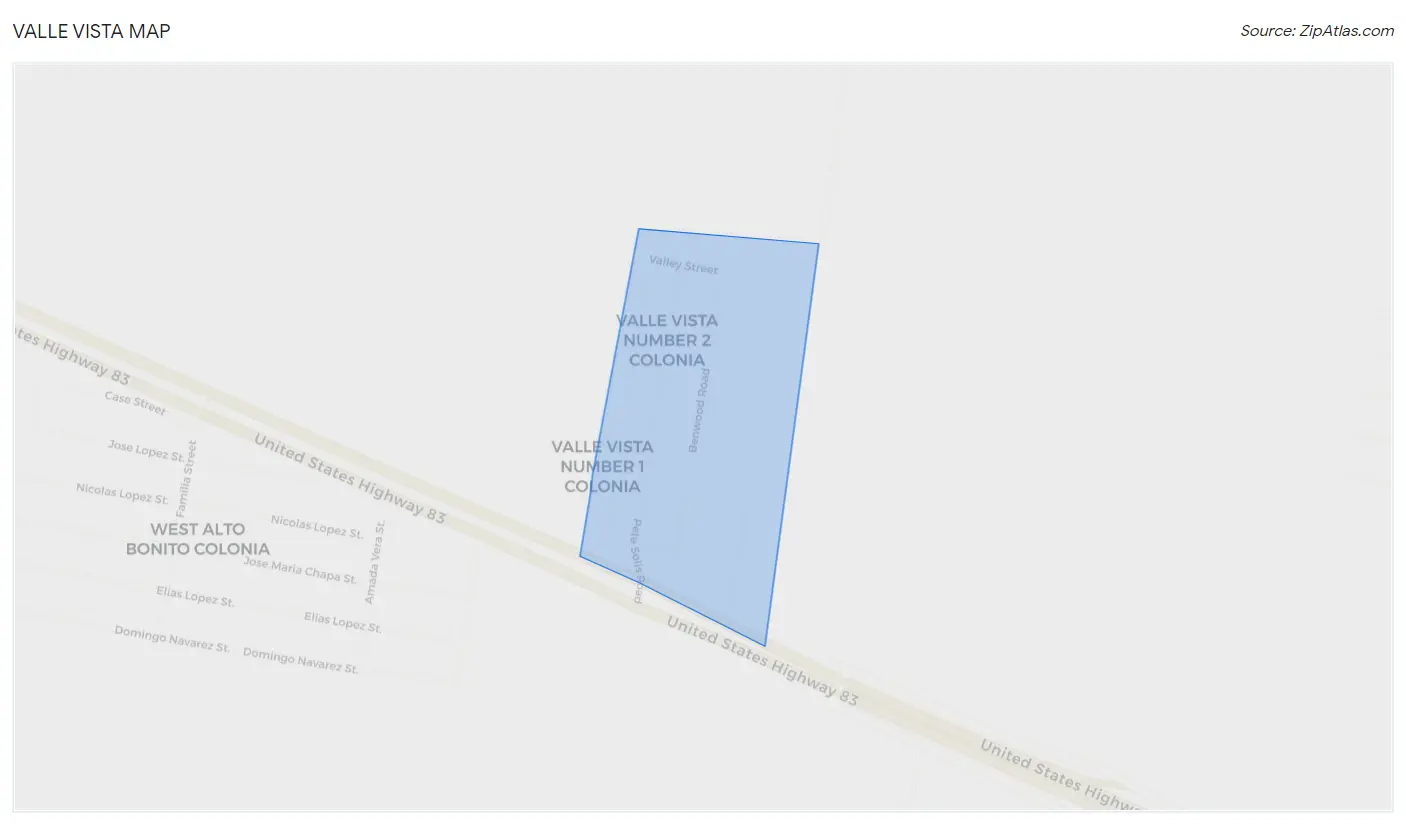
Valle Vista Map
Valle Vista Overview
$16,660
PER CAPITA INCOME
50.9%
WAGE / INCOME GAP [ % ]
49.1¢/ $1
WAGE / INCOME GAP [ $ ]
0.48
INEQUALITY / GINI INDEX
816
TOTAL POPULATION
415
MALE POPULATION
401
FEMALE POPULATION
103.49
MALES / 100 FEMALES
96.63
FEMALES / 100 MALES
24.2
MEDIAN AGE
4.0
AVG FAMILY SIZE
4.0
AVG HOUSEHOLD SIZE
475
LABOR FORCE [ PEOPLE ]
80.8%
PERCENT IN LABOR FORCE
23.2%
UNEMPLOYMENT RATE
Income in Valle Vista
Income Overview in Valle Vista
| Characteristic | Number | Measure |
| Per Capita Income | 816 | $16,660 |
| Median Family Income | 206 | $0 |
| Mean Family Income | 206 | $60,947 |
| Median Household Income | 206 | $0 |
| Mean Household Income | 206 | $60,947 |
| Income Deficit | 206 | $0 |
| Wage / Income Gap (%) | 816 | 50.92% |
| Wage / Income Gap ($) | 816 | 49.08¢ per $1 |
| Gini / Inequality Index | 816 | 0.48 |
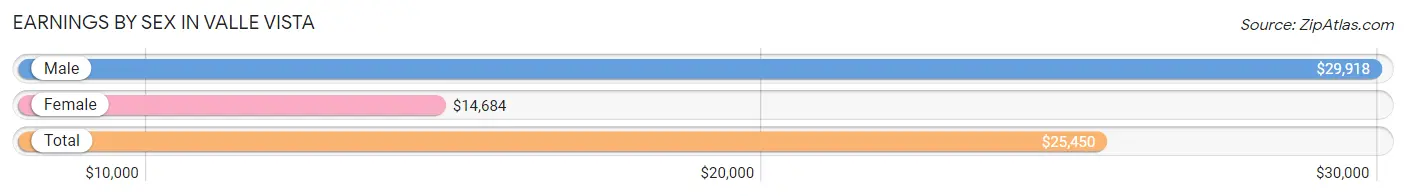
Earnings by Sex in Valle Vista
Average Earnings in Valle Vista are $25,450, $29,918 for men and $14,684 for women, a difference of 50.9%.
| Sex | Number | Average Earnings |
| Male | 173 (47.4%) | $29,918 |
| Female | 192 (52.6%) | $14,684 |
| Total | 365 (100.0%) | $25,450 |
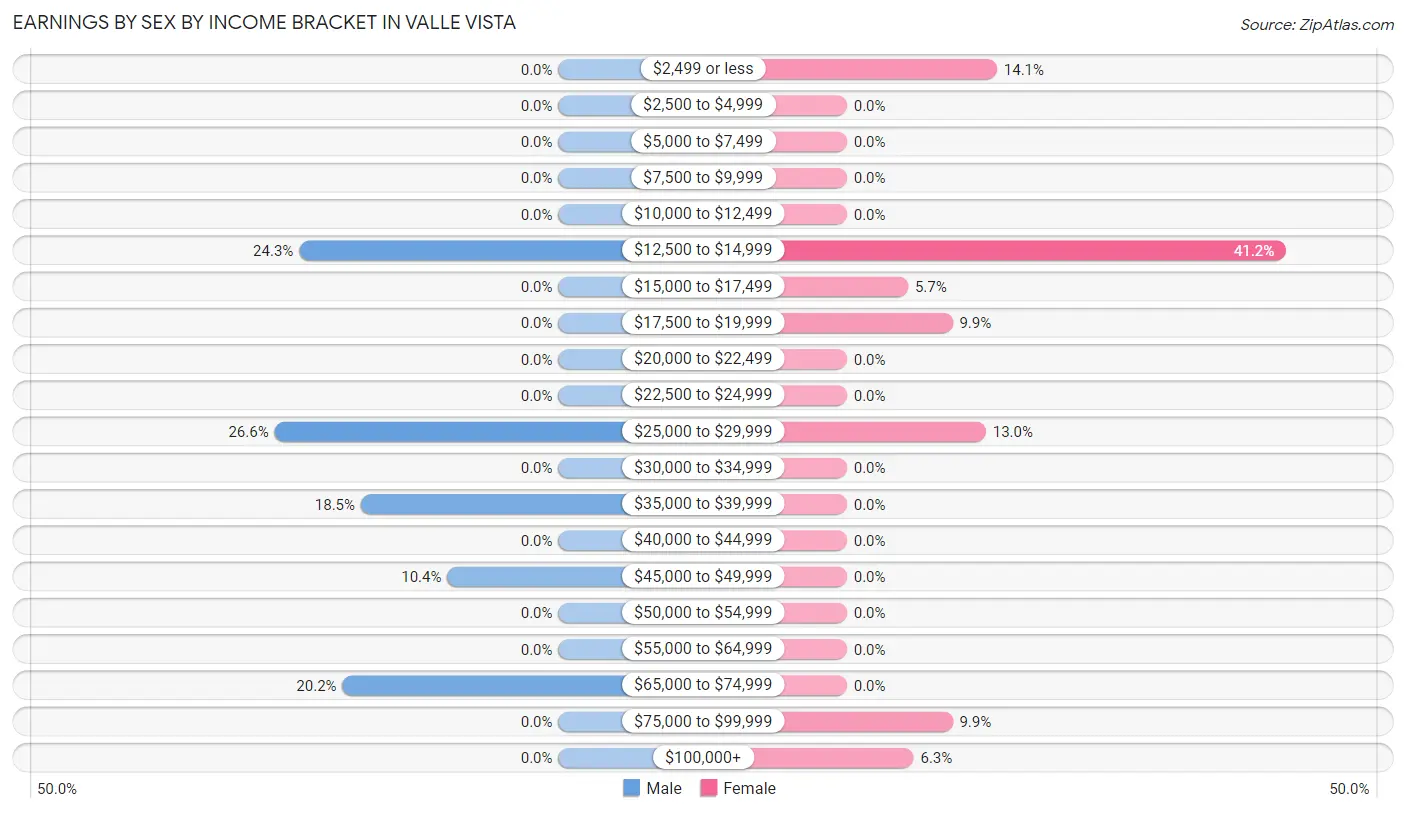
Earnings by Sex by Income Bracket in Valle Vista
The most common earnings brackets in Valle Vista are $25,000 to $29,999 for men (46 | 26.6%) and $12,500 to $14,999 for women (79 | 41.1%).
| Income | Male | Female |
| $2,499 or less | 0 (0.0%) | 27 (14.1%) |
| $2,500 to $4,999 | 0 (0.0%) | 0 (0.0%) |
| $5,000 to $7,499 | 0 (0.0%) | 0 (0.0%) |
| $7,500 to $9,999 | 0 (0.0%) | 0 (0.0%) |
| $10,000 to $12,499 | 0 (0.0%) | 0 (0.0%) |
| $12,500 to $14,999 | 42 (24.3%) | 79 (41.1%) |
| $15,000 to $17,499 | 0 (0.0%) | 11 (5.7%) |
| $17,500 to $19,999 | 0 (0.0%) | 19 (9.9%) |
| $20,000 to $22,499 | 0 (0.0%) | 0 (0.0%) |
| $22,500 to $24,999 | 0 (0.0%) | 0 (0.0%) |
| $25,000 to $29,999 | 46 (26.6%) | 25 (13.0%) |
| $30,000 to $34,999 | 0 (0.0%) | 0 (0.0%) |
| $35,000 to $39,999 | 32 (18.5%) | 0 (0.0%) |
| $40,000 to $44,999 | 0 (0.0%) | 0 (0.0%) |
| $45,000 to $49,999 | 18 (10.4%) | 0 (0.0%) |
| $50,000 to $54,999 | 0 (0.0%) | 0 (0.0%) |
| $55,000 to $64,999 | 0 (0.0%) | 0 (0.0%) |
| $65,000 to $74,999 | 35 (20.2%) | 0 (0.0%) |
| $75,000 to $99,999 | 0 (0.0%) | 19 (9.9%) |
| $100,000+ | 0 (0.0%) | 12 (6.2%) |
| Total | 173 (100.0%) | 192 (100.0%) |
Earnings by Sex by Educational Attainment in Valle Vista
| Educational Attainment | Male Income | Female Income |
| Less than High School | - | - |
| High School Diploma | - | - |
| College or Associate's Degree | - | - |
| Bachelor's Degree | - | - |
| Graduate Degree | - | - |
| Total | - | - |
Family Income in Valle Vista
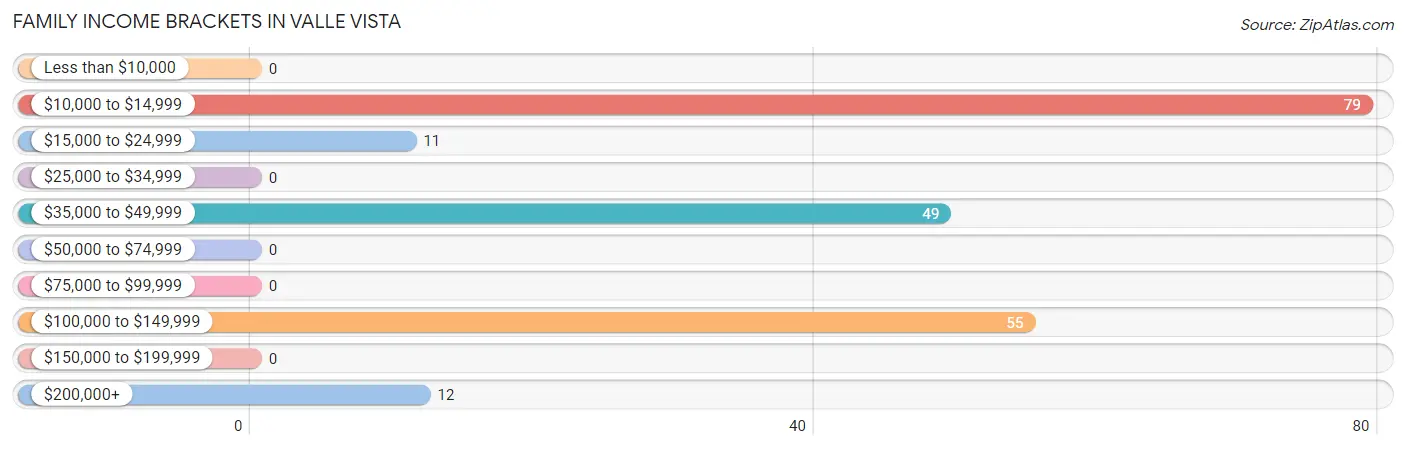
Family Income Brackets in Valle Vista
According to the Valle Vista family income data, there are 79 families falling into the $10,000 to $14,999 income range, which is the most common income bracket and makes up 38.4% of all families.
| Income Bracket | # Families | % Families |
| Less than $10,000 | 0 | 0.0% |
| $10,000 to $14,999 | 79 | 38.3% |
| $15,000 to $24,999 | 11 | 5.3% |
| $25,000 to $34,999 | 0 | 0.0% |
| $35,000 to $49,999 | 49 | 23.8% |
| $50,000 to $74,999 | 0 | 0.0% |
| $75,000 to $99,999 | 0 | 0.0% |
| $100,000 to $149,999 | 55 | 26.7% |
| $150,000 to $199,999 | 0 | 0.0% |
| $200,000+ | 12 | 5.8% |
Family Income by Famaliy Size in Valle Vista
| Income Bracket | # Families | Median Income |
| 2-Person Families | 68 (33.0%) | $0 |
| 3-Person Families | 28 (13.6%) | $0 |
| 4-Person Families | 71 (34.5%) | $0 |
| 5-Person Families | 39 (18.9%) | $0 |
| 6-Person Families | 0 (0.0%) | $0 |
| 7+ Person Families | 0 (0.0%) | $0 |
| Total | 206 (100.0%) | $0 |
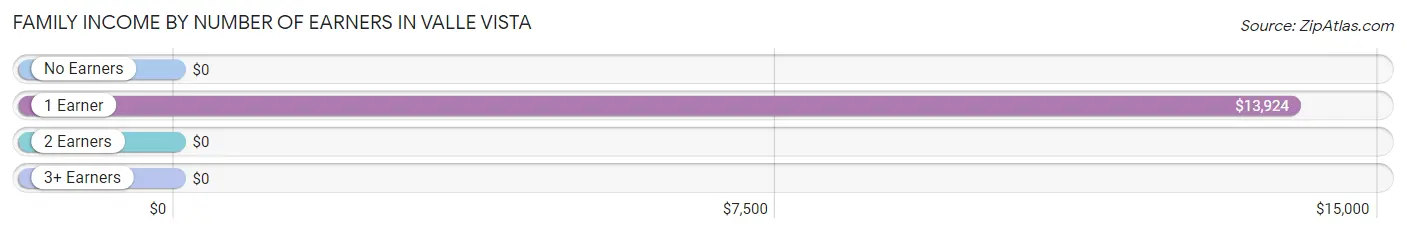
Family Income by Number of Earners in Valle Vista
| Number of Earners | # Families | Median Income |
| No Earners | 24 (11.7%) | $0 |
| 1 Earner | 90 (43.7%) | $13,924 |
| 2 Earners | 53 (25.7%) | $0 |
| 3+ Earners | 39 (18.9%) | $0 |
| Total | 206 (100.0%) | $0 |
Household Income in Valle Vista
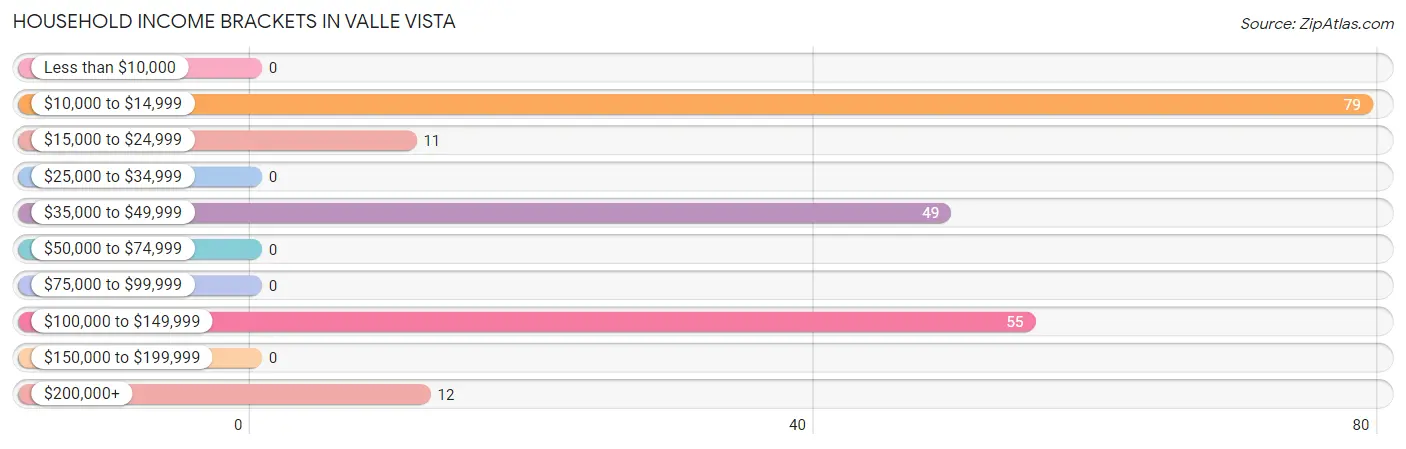
Household Income Brackets in Valle Vista
With 79 households falling in the category, the $10,000 to $14,999 income range is the most frequent in Valle Vista, accounting for 38.4% of all households.
| Income Bracket | # Households | % Households |
| Less than $10,000 | 0 | 0.0% |
| $10,000 to $14,999 | 79 | 38.3% |
| $15,000 to $24,999 | 11 | 5.3% |
| $25,000 to $34,999 | 0 | 0.0% |
| $35,000 to $49,999 | 49 | 23.8% |
| $50,000 to $74,999 | 0 | 0.0% |
| $75,000 to $99,999 | 0 | 0.0% |
| $100,000 to $149,999 | 55 | 26.7% |
| $150,000 to $199,999 | 0 | 0.0% |
| $200,000+ | 12 | 5.8% |
Household Income by Householder Age in Valle Vista
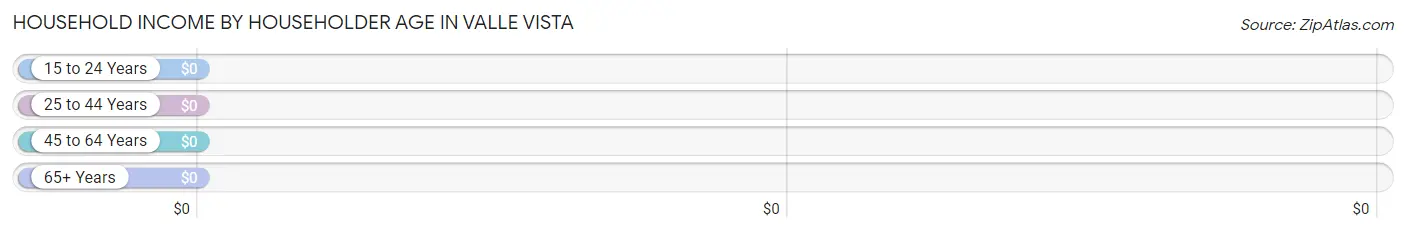
| Income Bracket | # Households | Median Income |
| 15 to 24 Years | 11 (5.3%) | $0 |
| 25 to 44 Years | 55 (26.7%) | $0 |
| 45 to 64 Years | 140 (68.0%) | $0 |
| 65+ Years | 0 (0.0%) | $0 |
| Total | 206 (100.0%) | $0 |
Poverty in Valle Vista
Income Below Poverty by Sex and Age in Valle Vista
With 9.4% poverty level for males and 60.4% for females among the residents of Valle Vista, 45 to 54 year old males and 6 to 11 year old females are the most vulnerable to poverty, with 39 males (39.4%) and 80 females (100.0%) in their respective age groups living below the poverty level.
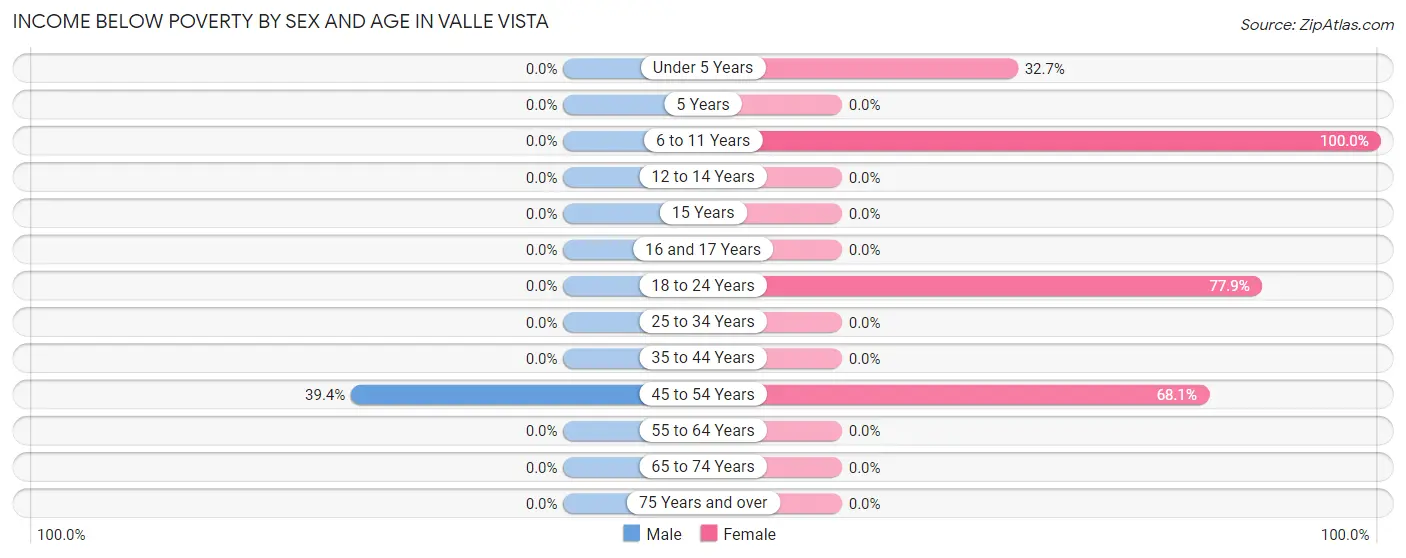
| Age Bracket | Male | Female |
| Under 5 Years | 0 (0.0%) | 16 (32.7%) |
| 5 Years | 0 (0.0%) | 0 (0.0%) |
| 6 to 11 Years | 0 (0.0%) | 80 (100.0%) |
| 12 to 14 Years | 0 (0.0%) | 0 (0.0%) |
| 15 Years | 0 (0.0%) | 0 (0.0%) |
| 16 and 17 Years | 0 (0.0%) | 0 (0.0%) |
| 18 to 24 Years | 0 (0.0%) | 67 (77.9%) |
| 25 to 34 Years | 0 (0.0%) | 0 (0.0%) |
| 35 to 44 Years | 0 (0.0%) | 0 (0.0%) |
| 45 to 54 Years | 39 (39.4%) | 79 (68.1%) |
| 55 to 64 Years | 0 (0.0%) | 0 (0.0%) |
| 65 to 74 Years | 0 (0.0%) | 0 (0.0%) |
| 75 Years and over | 0 (0.0%) | 0 (0.0%) |
| Total | 39 (9.4%) | 242 (60.4%) |
Income Above Poverty by Sex and Age in Valle Vista
According to the poverty statistics in Valle Vista, males aged under 5 years and females aged 35 to 44 years are the age groups that are most secure financially, with 100.0% of males and 100.0% of females in these age groups living above the poverty line.
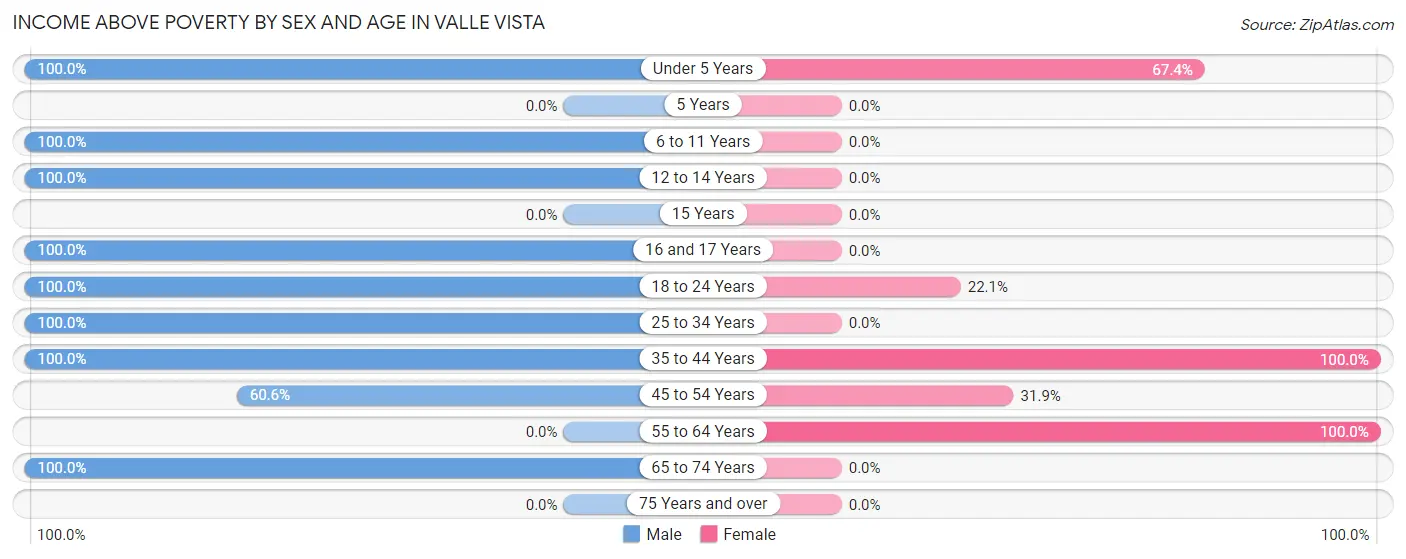
| Age Bracket | Male | Female |
| Under 5 Years | 22 (100.0%) | 33 (67.3%) |
| 5 Years | 0 (0.0%) | 0 (0.0%) |
| 6 to 11 Years | 37 (100.0%) | 0 (0.0%) |
| 12 to 14 Years | 40 (100.0%) | 0 (0.0%) |
| 15 Years | 0 (0.0%) | 0 (0.0%) |
| 16 and 17 Years | 24 (100.0%) | 0 (0.0%) |
| 18 to 24 Years | 86 (100.0%) | 19 (22.1%) |
| 25 to 34 Years | 18 (100.0%) | 0 (0.0%) |
| 35 to 44 Years | 63 (100.0%) | 46 (100.0%) |
| 45 to 54 Years | 60 (60.6%) | 37 (31.9%) |
| 55 to 64 Years | 0 (0.0%) | 24 (100.0%) |
| 65 to 74 Years | 26 (100.0%) | 0 (0.0%) |
| 75 Years and over | 0 (0.0%) | 0 (0.0%) |
| Total | 376 (90.6%) | 159 (39.7%) |
Income Below Poverty Among Married-Couple Families in Valle Vista
The poverty statistics for married-couple families in Valle Vista show that 28.4% or 46 of the total 162 families live below the poverty line. Families with 1 or 2 children have the highest poverty rate of 33.3%, comprising of 46 families. On the other hand, families with no children have the lowest poverty rate of 0.0%, which includes 0 families.
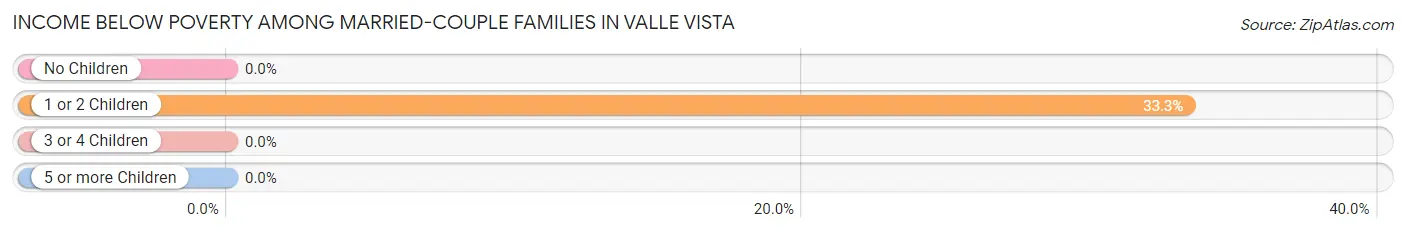
| Children | Above Poverty | Below Poverty |
| No Children | 24 (100.0%) | 0 (0.0%) |
| 1 or 2 Children | 92 (66.7%) | 46 (33.3%) |
| 3 or 4 Children | 0 (0.0%) | 0 (0.0%) |
| 5 or more Children | 0 (0.0%) | 0 (0.0%) |
| Total | 116 (71.6%) | 46 (28.4%) |
Income Below Poverty Among Single-Parent Households in Valle Vista
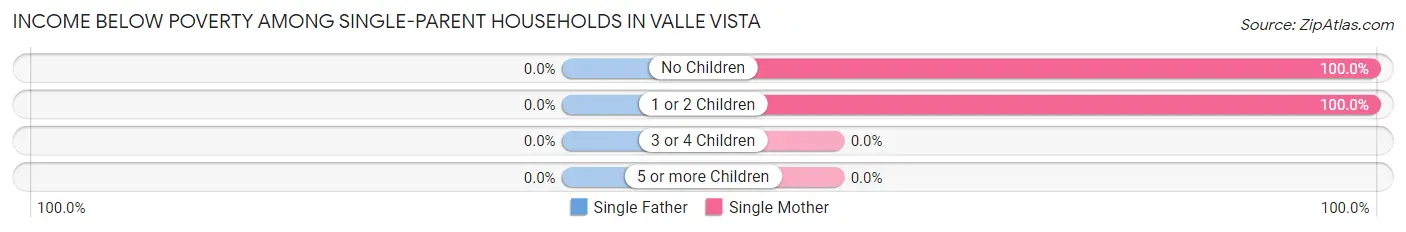
| Children | Single Father | Single Mother |
| No Children | 0 (0.0%) | 33 (100.0%) |
| 1 or 2 Children | 0 (0.0%) | 11 (100.0%) |
| 3 or 4 Children | 0 (0.0%) | 0 (0.0%) |
| 5 or more Children | 0 (0.0%) | 0 (0.0%) |
| Total | 0 (0.0%) | 44 (100.0%) |
Income Below Poverty Among Married-Couple vs Single-Parent Households in Valle Vista
The poverty data for Valle Vista shows that 46 of the married-couple family households (28.4%) and 44 of the single-parent households (100.0%) are living below the poverty level. Within the married-couple family households, those with 1 or 2 children have the highest poverty rate, with 46 households (33.3%) falling below the poverty line. Among the single-parent households, those with no children have the highest poverty rate, with 33 household (100.0%) living below poverty.
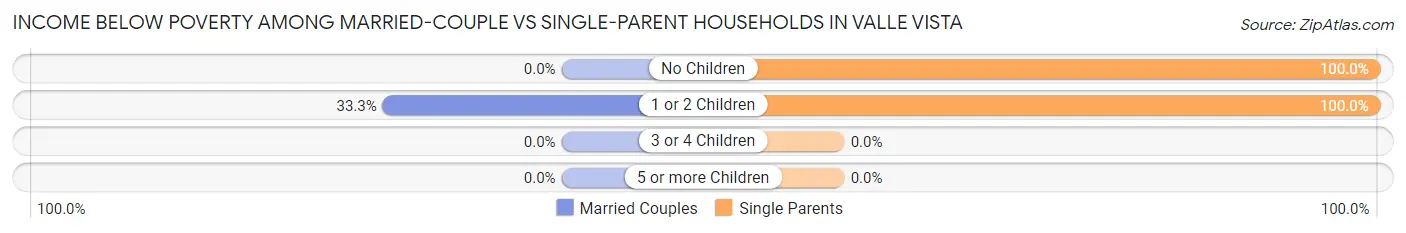
| Children | Married-Couple Families | Single-Parent Households |
| No Children | 0 (0.0%) | 33 (100.0%) |
| 1 or 2 Children | 46 (33.3%) | 11 (100.0%) |
| 3 or 4 Children | 0 (0.0%) | 0 (0.0%) |
| 5 or more Children | 0 (0.0%) | 0 (0.0%) |
| Total | 46 (28.4%) | 44 (100.0%) |
Race in Valle Vista
The most populous races in Valle Vista are Hispanic or Latino (816 | 100.0%), White / Caucasian (535 | 65.6%), and Two or more Races (192 | 23.5%).
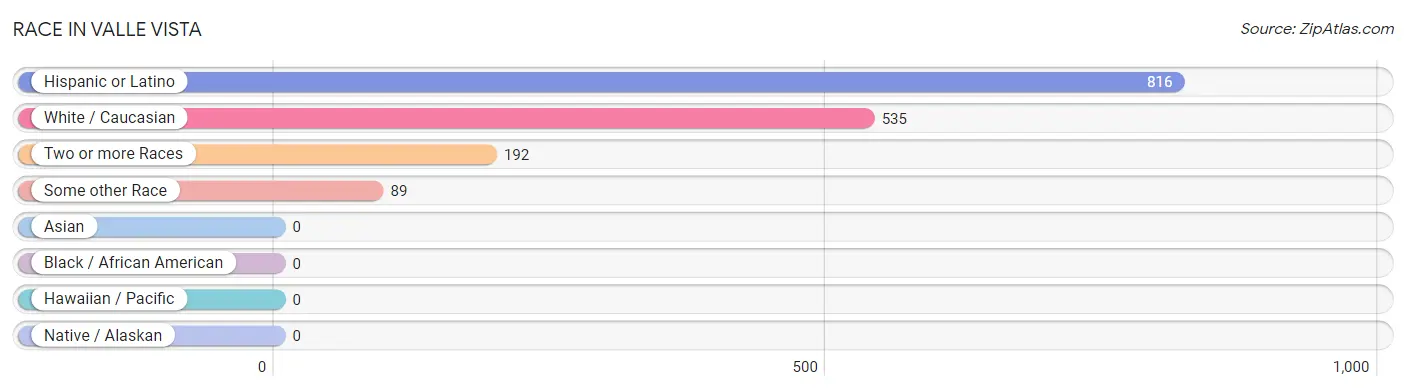
| Race | # Population | % Population |
| Asian | 0 | 0.0% |
| Black / African American | 0 | 0.0% |
| Hawaiian / Pacific | 0 | 0.0% |
| Hispanic or Latino | 816 | 100.0% |
| Native / Alaskan | 0 | 0.0% |
| White / Caucasian | 535 | 65.6% |
| Two or more Races | 192 | 23.5% |
| Some other Race | 89 | 10.9% |
| Total | 816 | 100.0% |
Ancestry in Valle Vista
The most populous ancestries reported in Valle Vista are , and Mexican (816 | 100.0%), together accounting for 100.0% of all Valle Vista residents.

| Ancestry | # Population | % Population |
| Mexican | 816 | 100.0% | View All 1 Rows |
Immigrants in Valle Vista
The most numerous immigrant groups reported in Valle Vista came from Central America (170 | 20.8%), Latin America (170 | 20.8%), and Mexico (170 | 20.8%), together accounting for 62.5% of all Valle Vista residents.
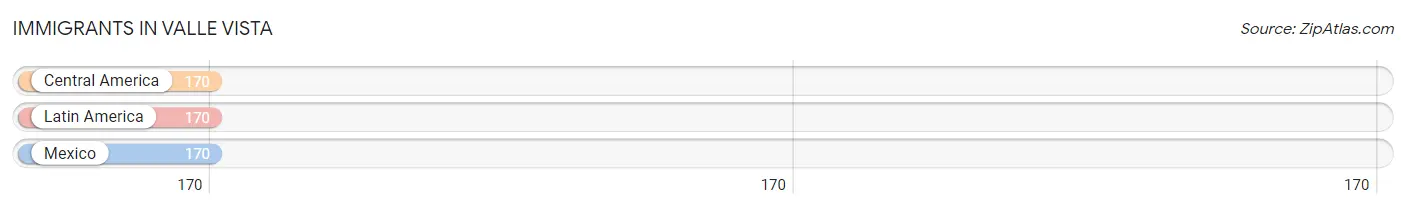
| Immigration Origin | # Population | % Population |
| Central America | 170 | 20.8% |
| Latin America | 170 | 20.8% |
| Mexico | 170 | 20.8% | View All 3 Rows |
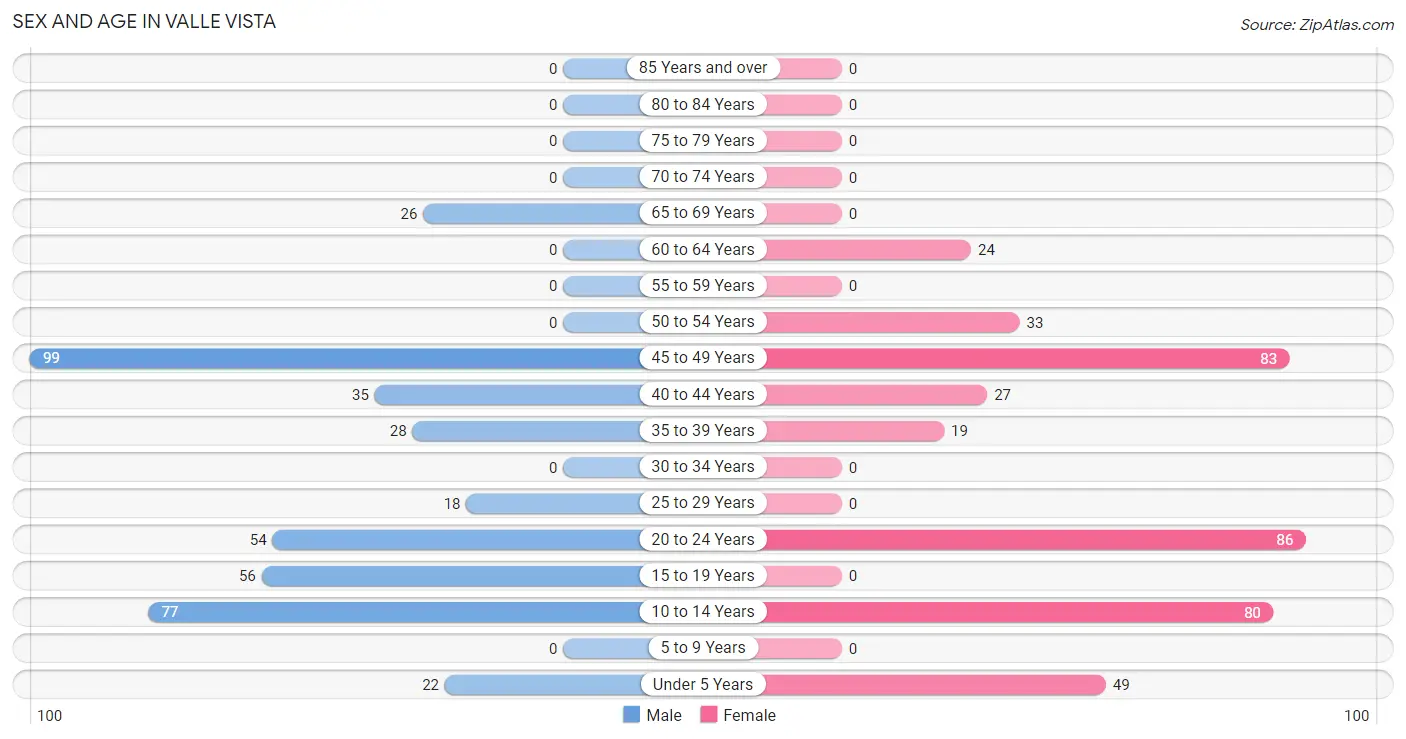
Sex and Age in Valle Vista
Sex and Age in Valle Vista
The most populous age groups in Valle Vista are 45 to 49 Years (99 | 23.9%) for men and 20 to 24 Years (86 | 21.4%) for women.
| Age Bracket | Male | Female |
| Under 5 Years | 22 (5.3%) | 49 (12.2%) |
| 5 to 9 Years | 0 (0.0%) | 0 (0.0%) |
| 10 to 14 Years | 77 (18.5%) | 80 (20.0%) |
| 15 to 19 Years | 56 (13.5%) | 0 (0.0%) |
| 20 to 24 Years | 54 (13.0%) | 86 (21.4%) |
| 25 to 29 Years | 18 (4.3%) | 0 (0.0%) |
| 30 to 34 Years | 0 (0.0%) | 0 (0.0%) |
| 35 to 39 Years | 28 (6.8%) | 19 (4.7%) |
| 40 to 44 Years | 35 (8.4%) | 27 (6.7%) |
| 45 to 49 Years | 99 (23.9%) | 83 (20.7%) |
| 50 to 54 Years | 0 (0.0%) | 33 (8.2%) |
| 55 to 59 Years | 0 (0.0%) | 0 (0.0%) |
| 60 to 64 Years | 0 (0.0%) | 24 (6.0%) |
| 65 to 69 Years | 26 (6.3%) | 0 (0.0%) |
| 70 to 74 Years | 0 (0.0%) | 0 (0.0%) |
| 75 to 79 Years | 0 (0.0%) | 0 (0.0%) |
| 80 to 84 Years | 0 (0.0%) | 0 (0.0%) |
| 85 Years and over | 0 (0.0%) | 0 (0.0%) |
| Total | 415 (100.0%) | 401 (100.0%) |
Families and Households in Valle Vista
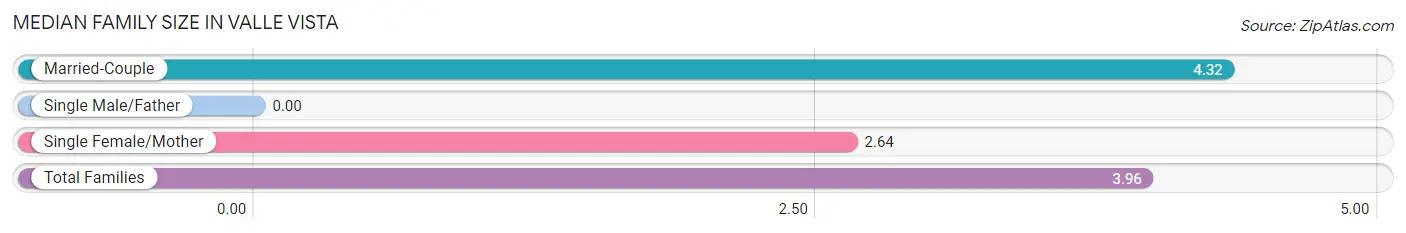
Median Family Size in Valle Vista
| Family Type | # Families | Family Size |
| Married-Couple | 162 (78.6%) | 4.32 |
| Single Male/Father | 0 (0.0%) | - |
| Single Female/Mother | 44 (21.4%) | 2.64 |
| Total Families | 206 (100.0%) | 3.96 |
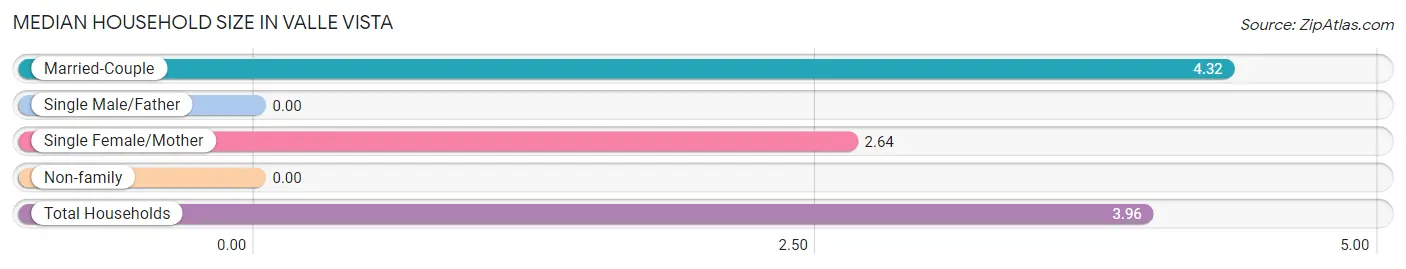
Median Household Size in Valle Vista
| Household Type | # Households | Household Size |
| Married-Couple | 162 (78.6%) | 4.32 |
| Single Male/Father | 0 (0.0%) | - |
| Single Female/Mother | 44 (21.4%) | 2.64 |
| Non-family | 0 (0.0%) | - |
| Total Households | 206 (100.0%) | 3.96 |
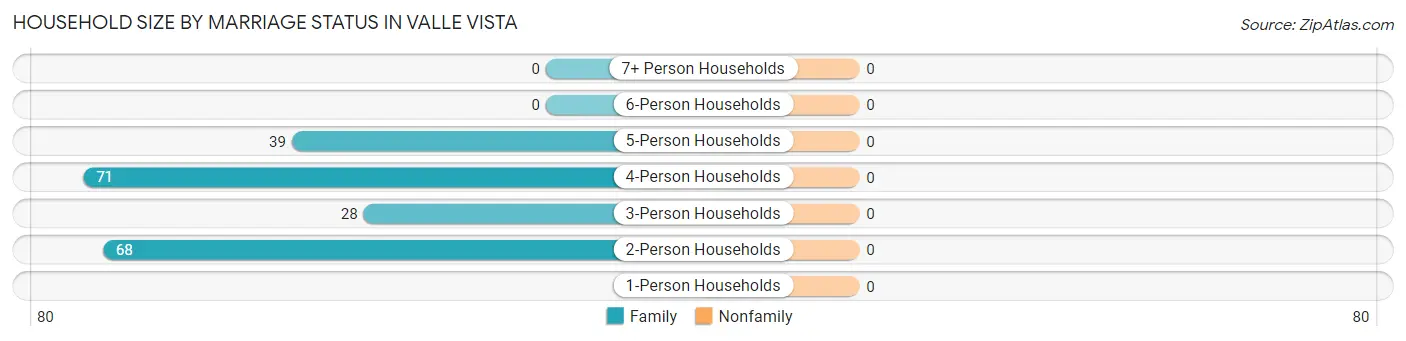
Household Size by Marriage Status in Valle Vista
| Household Size | Family Households | Nonfamily Households |
| 1-Person Households | - | 0 (0.0%) |
| 2-Person Households | 68 (33.0%) | 0 (0.0%) |
| 3-Person Households | 28 (13.6%) | 0 (0.0%) |
| 4-Person Households | 71 (34.5%) | 0 (0.0%) |
| 5-Person Households | 39 (18.9%) | 0 (0.0%) |
| 6-Person Households | 0 (0.0%) | 0 (0.0%) |
| 7+ Person Households | 0 (0.0%) | 0 (0.0%) |
| Total | 206 (100.0%) | 0 (0.0%) |
Female Fertility in Valle Vista
Fertility by Age in Valle Vista
| Age Bracket | Women with Births | Births / 1,000 Women |
| 15 to 19 years | 0 (0.0%) | 0.0 |
| 20 to 34 years | 0 (0.0%) | 0.0 |
| 35 to 50 years | 0 (0.0%) | 0.0 |
| Total | 0 (0.0%) | 0.0 |
Fertility by Age by Marriage Status in Valle Vista

| Age Bracket | Married | Unmarried |
| 15 to 19 years | 0 (0.0%) | 0 (0.0%) |
| 20 to 34 years | 0 (0.0%) | 0 (0.0%) |
| 35 to 50 years | 0 (0.0%) | 0 (0.0%) |
| Total | 0 (0.0%) | 0 (0.0%) |
Fertility by Education in Valle Vista
| Educational Attainment | Women with Births | Births / 1,000 Women |
| Less than High School | 0 (0.0%) | 0.0 |
| High School Diploma | 0 (0.0%) | 0.0 |
| College or Associate's Degree | 0 (0.0%) | 0.0 |
| Bachelor's Degree | 0 (0.0%) | 0.0 |
| Graduate Degree | 0 (0.0%) | 0.0 |
| Total | 0 (0.0%) | 0.0 |
Fertility by Education by Marriage Status in Valle Vista
| Educational Attainment | Married | Unmarried |
| Less than High School | 0 (0.0%) | 0 (0.0%) |
| High School Diploma | 0 (0.0%) | 0 (0.0%) |
| College or Associate's Degree | 0 (0.0%) | 0 (0.0%) |
| Bachelor's Degree | 0 (0.0%) | 0 (0.0%) |
| Graduate Degree | 0 (0.0%) | 0 (0.0%) |
| Total | 0 (0.0%) | 0 (0.0%) |
Employment Characteristics in Valle Vista
Employment by Class of Employer in Valle Vista
Among the 347 employed individuals in Valle Vista, private company employees (289 | 83.3%), and not-for-profit organizations (58 | 16.7%) make up the most common classes of employment.
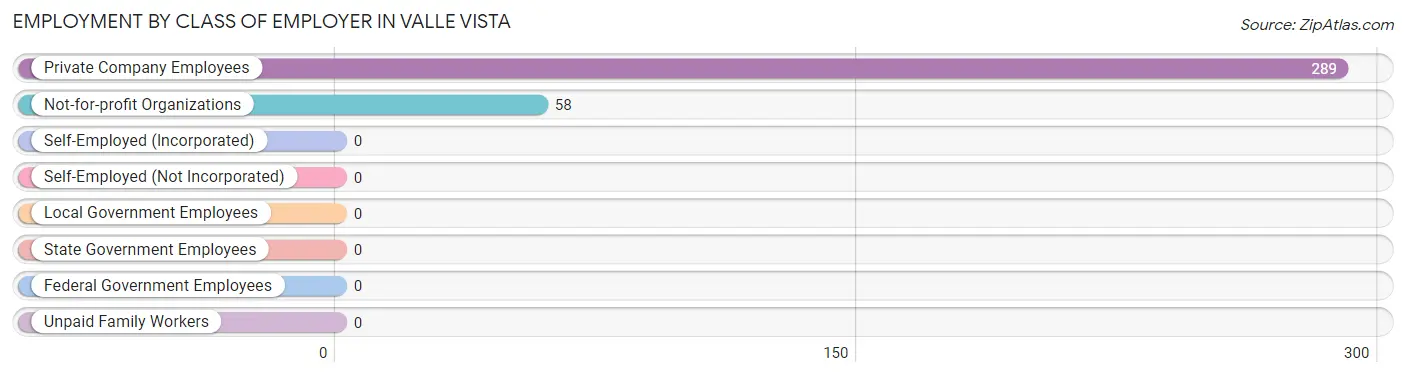
| Employer Class | # Employees | % Employees |
| Private Company Employees | 289 | 83.3% |
| Self-Employed (Incorporated) | 0 | 0.0% |
| Self-Employed (Not Incorporated) | 0 | 0.0% |
| Not-for-profit Organizations | 58 | 16.7% |
| Local Government Employees | 0 | 0.0% |
| State Government Employees | 0 | 0.0% |
| Federal Government Employees | 0 | 0.0% |
| Unpaid Family Workers | 0 | 0.0% |
| Total | 347 | 100.0% |
Employment Status by Age in Valle Vista
According to the labor force statistics for Valle Vista, out of the total population over 16 years of age (588), 80.8% or 475 individuals are in the labor force, with 23.2% or 110 of them unemployed. The age group with the highest labor force participation rate is 20 to 24 years, with 100.0% or 140 individuals in the labor force. Within the labor force, the 20 to 24 years age range has the highest percentage of unemployed individuals, with 78.6% or 110 of them being unemployed.
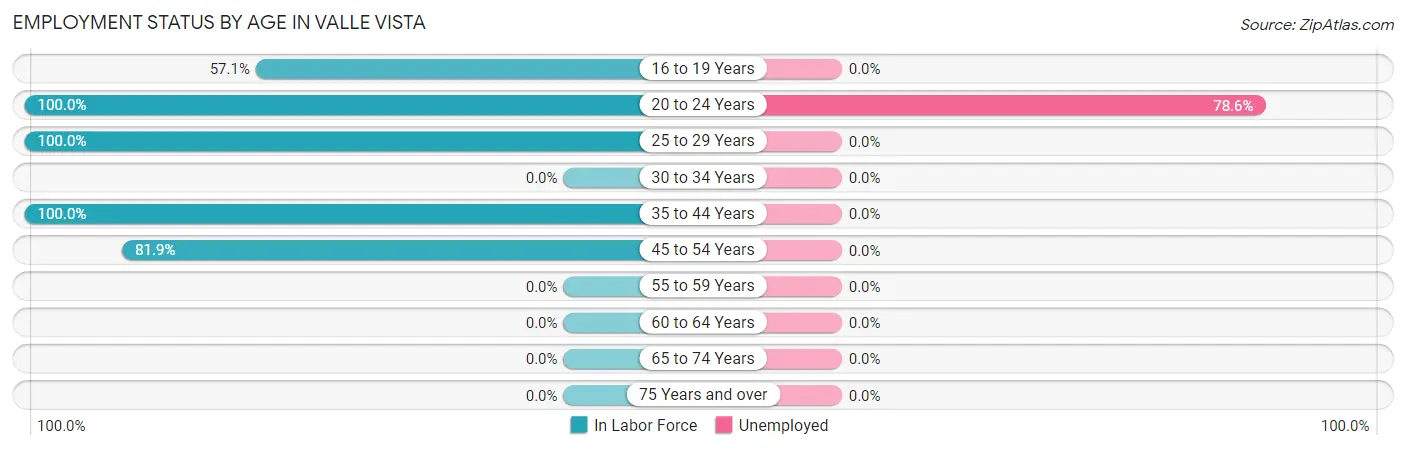
| Age Bracket | In Labor Force | Unemployed |
| 16 to 19 Years | 32 (57.1%) | 0 (0.0%) |
| 20 to 24 Years | 140 (100.0%) | 110 (78.6%) |
| 25 to 29 Years | 18 (100.0%) | 0 (0.0%) |
| 30 to 34 Years | 0 (0.0%) | 0 (0.0%) |
| 35 to 44 Years | 109 (100.0%) | 0 (0.0%) |
| 45 to 54 Years | 176 (81.9%) | 0 (0.0%) |
| 55 to 59 Years | 0 (0.0%) | 0 (0.0%) |
| 60 to 64 Years | 0 (0.0%) | 0 (0.0%) |
| 65 to 74 Years | 0 (0.0%) | 0 (0.0%) |
| 75 Years and over | 0 (0.0%) | 0 (0.0%) |
| Total | 475 (80.8%) | 110 (23.2%) |
Employment Status by Educational Attainment in Valle Vista
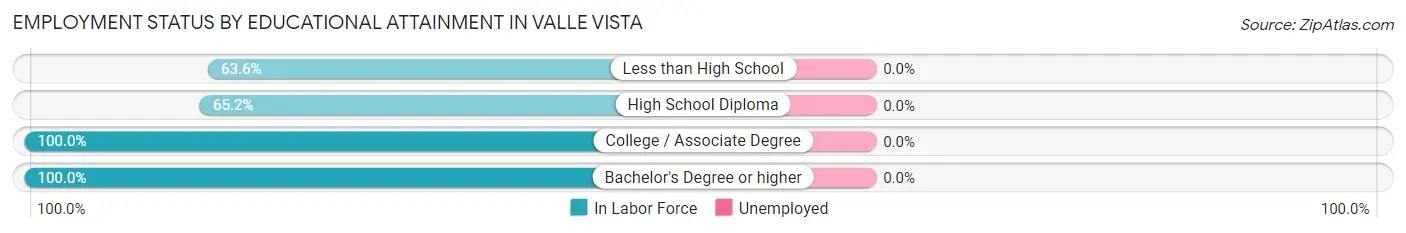
| Educational Attainment | In Labor Force | Unemployed |
| Less than High School | 68 (63.6%) | 0 (0.0%) |
| High School Diploma | 45 (65.2%) | 0 (0.0%) |
| College / Associate Degree | 144 (100.0%) | 0 (0.0%) |
| Bachelor's Degree or higher | 46 (100.0%) | 0 (0.0%) |
| Total | 303 (82.8%) | 0 (0.0%) |
Employment Occupations by Sex in Valle Vista
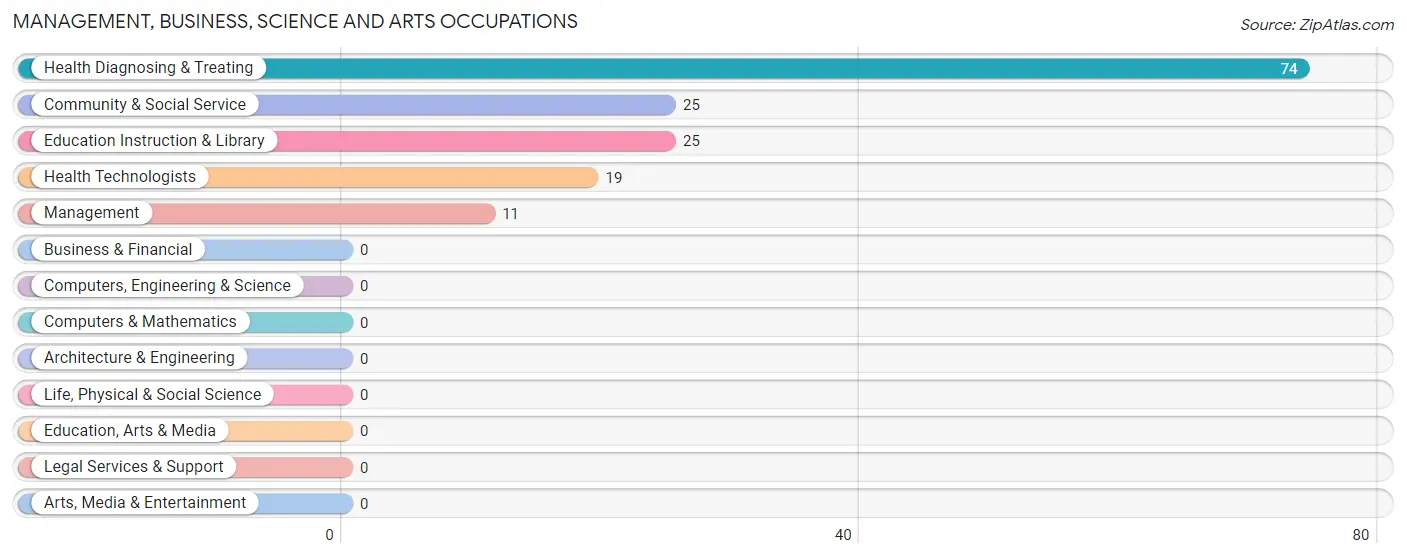
Management, Business, Science and Arts Occupations
The most common Management, Business, Science and Arts occupations in Valle Vista are Health Diagnosing & Treating (74 | 20.3%), Community & Social Service (25 | 6.9%), Education Instruction & Library (25 | 6.9%), Health Technologists (19 | 5.2%), and Management (11 | 3.0%).
Management, Business, Science and Arts Occupations by Sex
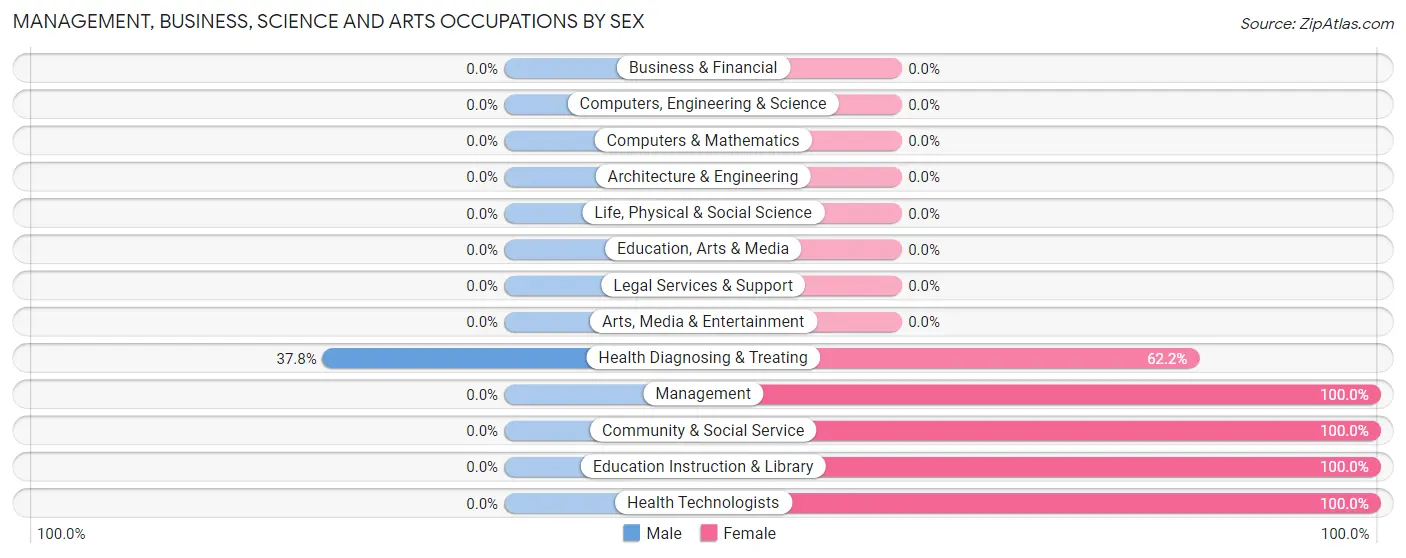
| Occupation | Male | Female |
| Management | 0 (0.0%) | 11 (100.0%) |
| Business & Financial | 0 (0.0%) | 0 (0.0%) |
| Computers, Engineering & Science | 0 (0.0%) | 0 (0.0%) |
| Computers & Mathematics | 0 (0.0%) | 0 (0.0%) |
| Architecture & Engineering | 0 (0.0%) | 0 (0.0%) |
| Life, Physical & Social Science | 0 (0.0%) | 0 (0.0%) |
| Community & Social Service | 0 (0.0%) | 25 (100.0%) |
| Education, Arts & Media | 0 (0.0%) | 0 (0.0%) |
| Legal Services & Support | 0 (0.0%) | 0 (0.0%) |
| Education Instruction & Library | 0 (0.0%) | 25 (100.0%) |
| Arts, Media & Entertainment | 0 (0.0%) | 0 (0.0%) |
| Health Diagnosing & Treating | 28 (37.8%) | 46 (62.2%) |
| Health Technologists | 0 (0.0%) | 19 (100.0%) |
| Total (Category) | 28 (25.5%) | 82 (74.6%) |
| Total (Overall) | 173 (47.4%) | 192 (52.6%) |
Services Occupations
The most common Services occupations in Valle Vista are Food Preparation & Serving (64 | 17.5%), and Healthcare Support (33 | 9.0%).
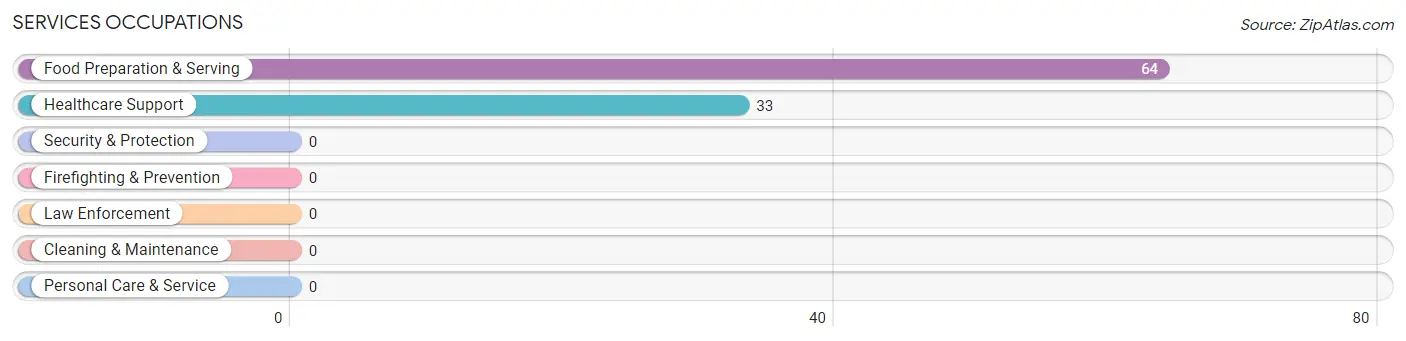
Services Occupations by Sex
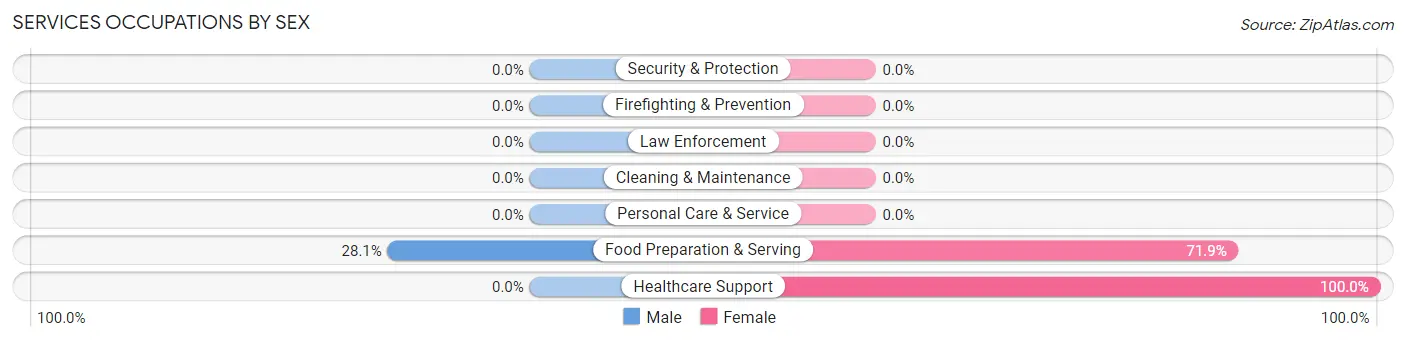
| Occupation | Male | Female |
| Healthcare Support | 0 (0.0%) | 33 (100.0%) |
| Security & Protection | 0 (0.0%) | 0 (0.0%) |
| Firefighting & Prevention | 0 (0.0%) | 0 (0.0%) |
| Law Enforcement | 0 (0.0%) | 0 (0.0%) |
| Food Preparation & Serving | 18 (28.1%) | 46 (71.9%) |
| Cleaning & Maintenance | 0 (0.0%) | 0 (0.0%) |
| Personal Care & Service | 0 (0.0%) | 0 (0.0%) |
| Total (Category) | 18 (18.6%) | 79 (81.4%) |
| Total (Overall) | 173 (47.4%) | 192 (52.6%) |
Sales and Office Occupations
The most common Sales and Office occupations in Valle Vista are Sales & Related (19 | 5.2%), and Office & Administration (18 | 4.9%).

Sales and Office Occupations by Sex

| Occupation | Male | Female |
| Sales & Related | 0 (0.0%) | 19 (100.0%) |
| Office & Administration | 18 (100.0%) | 0 (0.0%) |
| Total (Category) | 18 (48.6%) | 19 (51.3%) |
| Total (Overall) | 173 (47.4%) | 192 (52.6%) |
Natural Resources, Construction and Maintenance Occupations
The most common Natural Resources, Construction and Maintenance occupations in Valle Vista are , and Construction & Extraction (74 | 20.3%).
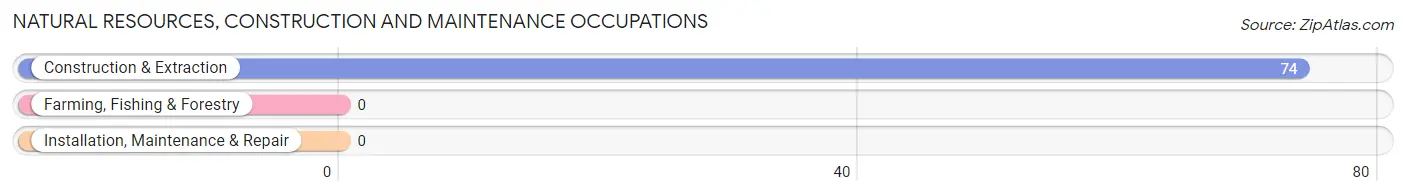
Natural Resources, Construction and Maintenance Occupations by Sex
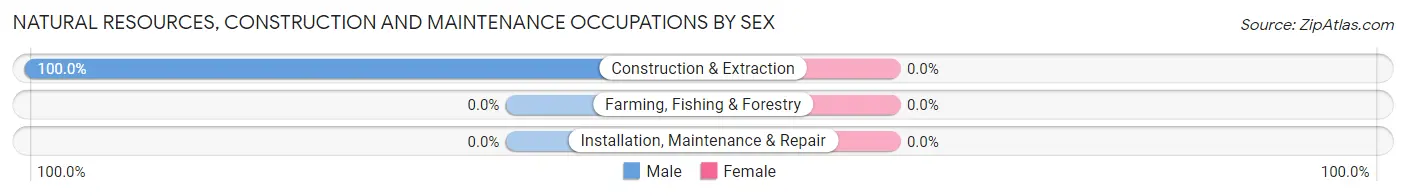
| Occupation | Male | Female |
| Farming, Fishing & Forestry | 0 (0.0%) | 0 (0.0%) |
| Construction & Extraction | 74 (100.0%) | 0 (0.0%) |
| Installation, Maintenance & Repair | 0 (0.0%) | 0 (0.0%) |
| Total (Category) | 74 (100.0%) | 0 (0.0%) |
| Total (Overall) | 173 (47.4%) | 192 (52.6%) |
Production, Transportation and Moving Occupations
The most common Production, Transportation and Moving occupations in Valle Vista are , and Production (47 | 12.9%).
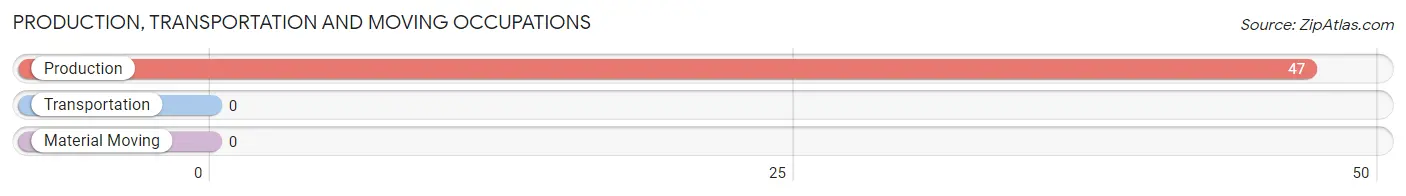
Production, Transportation and Moving Occupations by Sex
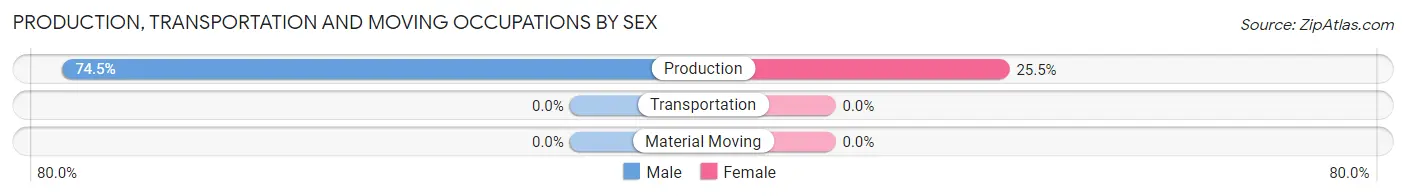
| Occupation | Male | Female |
| Production | 35 (74.5%) | 12 (25.5%) |
| Transportation | 0 (0.0%) | 0 (0.0%) |
| Material Moving | 0 (0.0%) | 0 (0.0%) |
| Total (Category) | 35 (74.5%) | 12 (25.5%) |
| Total (Overall) | 173 (47.4%) | 192 (52.6%) |
Employment Industries by Sex in Valle Vista
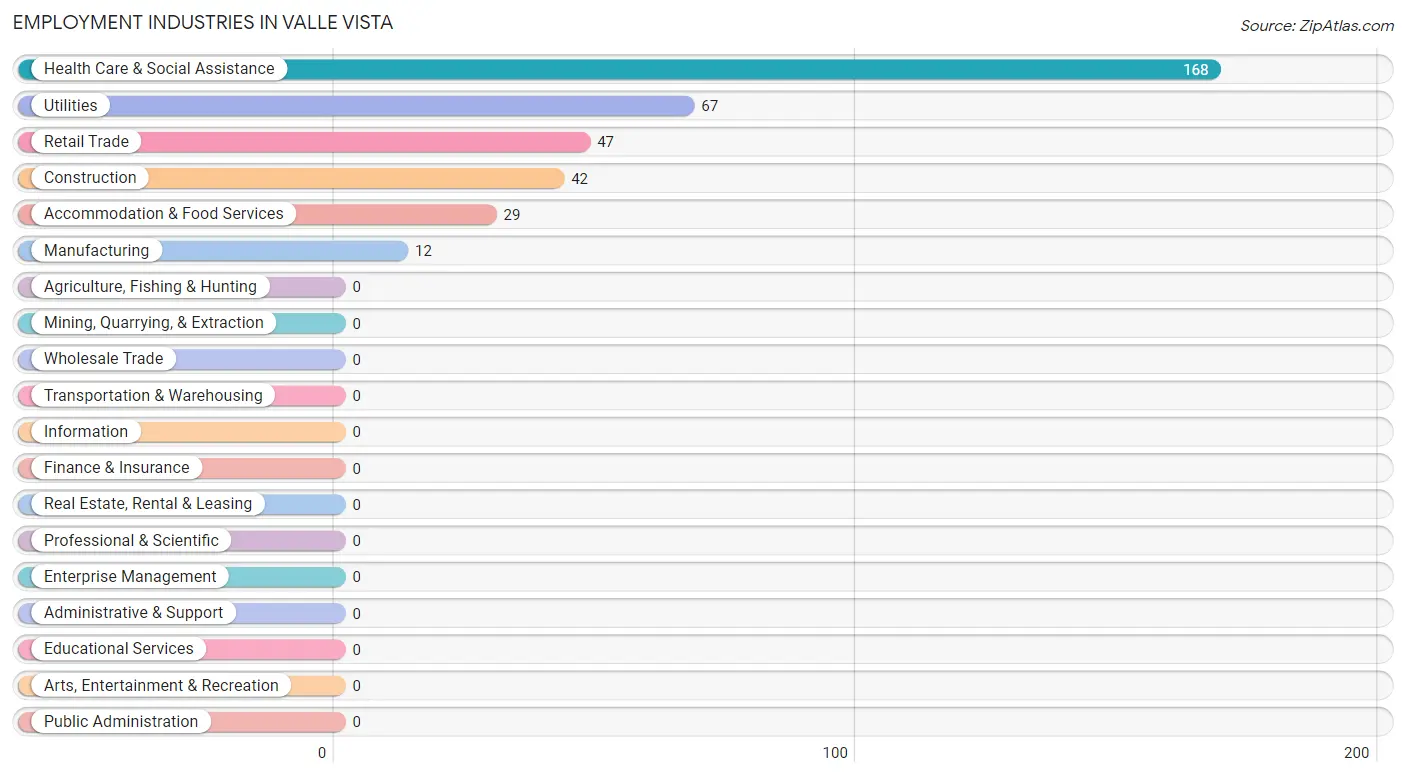
Employment Industries in Valle Vista
The major employment industries in Valle Vista include Health Care & Social Assistance (168 | 46.0%), Utilities (67 | 18.4%), Retail Trade (47 | 12.9%), Construction (42 | 11.5%), and Accommodation & Food Services (29 | 8.0%).
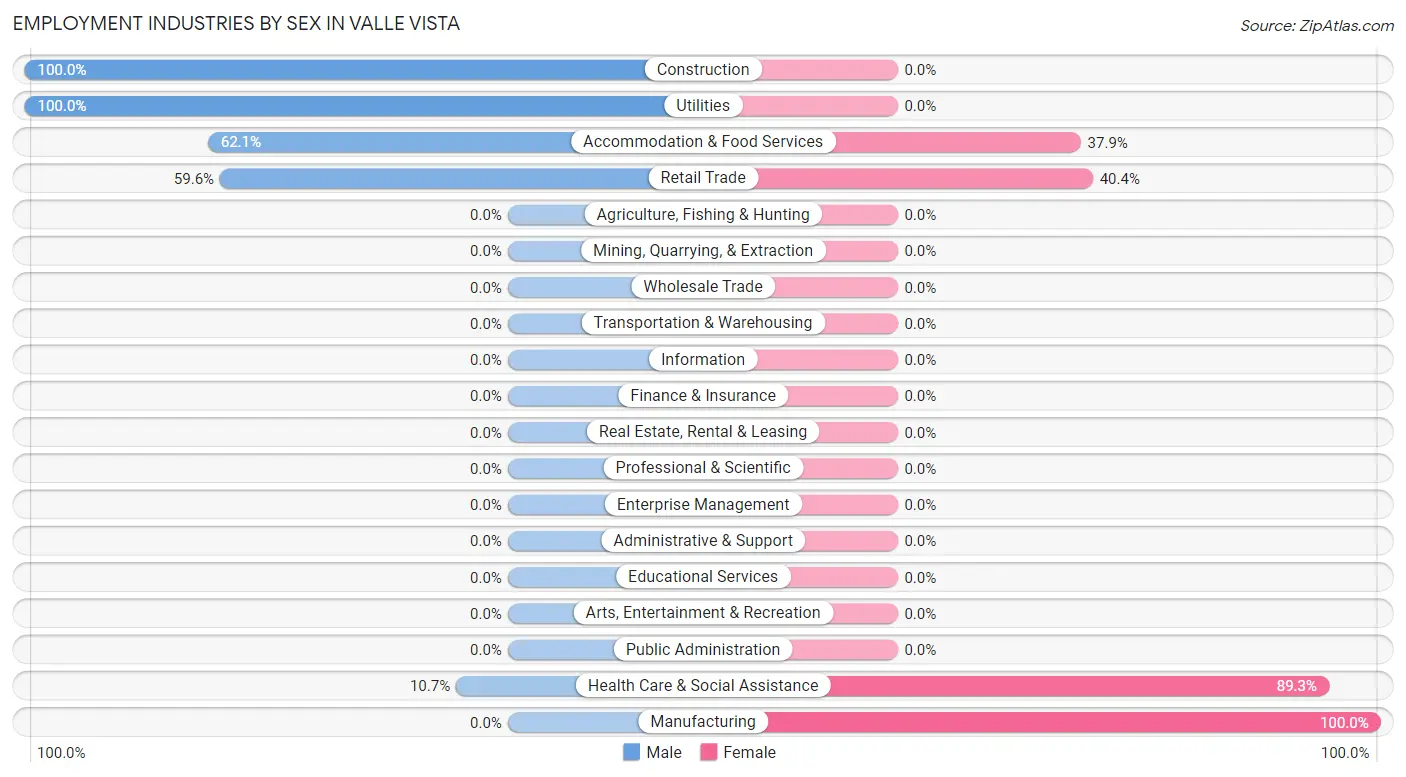
Employment Industries by Sex in Valle Vista
The Valle Vista industries that see more men than women are Construction (100.0%), Utilities (100.0%), and Accommodation & Food Services (62.1%), whereas the industries that tend to have a higher number of women are Manufacturing (100.0%), Health Care & Social Assistance (89.3%), and Retail Trade (40.4%).
| Industry | Male | Female |
| Agriculture, Fishing & Hunting | 0 (0.0%) | 0 (0.0%) |
| Mining, Quarrying, & Extraction | 0 (0.0%) | 0 (0.0%) |
| Construction | 42 (100.0%) | 0 (0.0%) |
| Manufacturing | 0 (0.0%) | 12 (100.0%) |
| Wholesale Trade | 0 (0.0%) | 0 (0.0%) |
| Retail Trade | 28 (59.6%) | 19 (40.4%) |
| Transportation & Warehousing | 0 (0.0%) | 0 (0.0%) |
| Utilities | 67 (100.0%) | 0 (0.0%) |
| Information | 0 (0.0%) | 0 (0.0%) |
| Finance & Insurance | 0 (0.0%) | 0 (0.0%) |
| Real Estate, Rental & Leasing | 0 (0.0%) | 0 (0.0%) |
| Professional & Scientific | 0 (0.0%) | 0 (0.0%) |
| Enterprise Management | 0 (0.0%) | 0 (0.0%) |
| Administrative & Support | 0 (0.0%) | 0 (0.0%) |
| Educational Services | 0 (0.0%) | 0 (0.0%) |
| Health Care & Social Assistance | 18 (10.7%) | 150 (89.3%) |
| Arts, Entertainment & Recreation | 0 (0.0%) | 0 (0.0%) |
| Accommodation & Food Services | 18 (62.1%) | 11 (37.9%) |
| Public Administration | 0 (0.0%) | 0 (0.0%) |
| Total | 173 (47.4%) | 192 (52.6%) |
Education in Valle Vista
School Enrollment in Valle Vista
The most common levels of schooling among the 270 students in Valle Vista are elementary school (80 | 29.6%), middle school (77 | 28.5%), and college / undergraduate (56 | 20.7%).
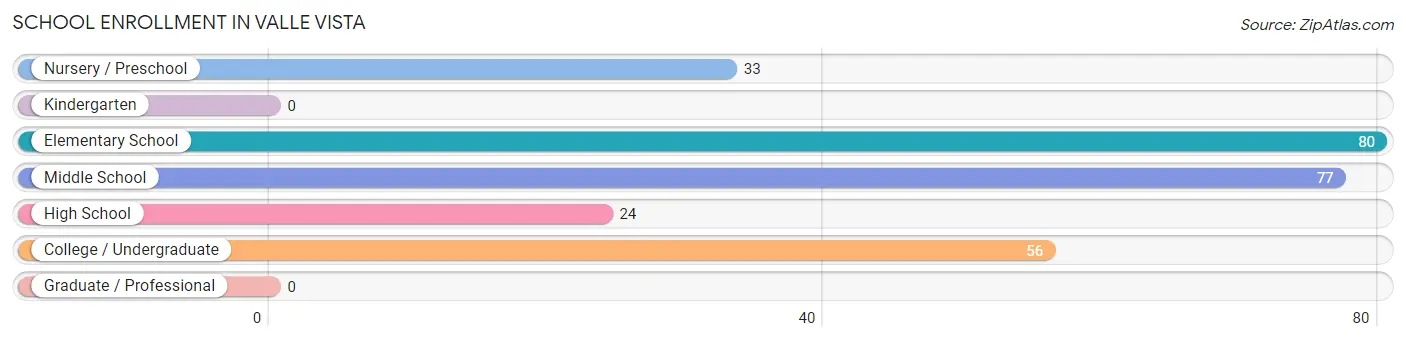
| School Level | # Students | % Students |
| Nursery / Preschool | 33 | 12.2% |
| Kindergarten | 0 | 0.0% |
| Elementary School | 80 | 29.6% |
| Middle School | 77 | 28.5% |
| High School | 24 | 8.9% |
| College / Undergraduate | 56 | 20.7% |
| Graduate / Professional | 0 | 0.0% |
| Total | 270 | 100.0% |
School Enrollment by Age by Funding Source in Valle Vista
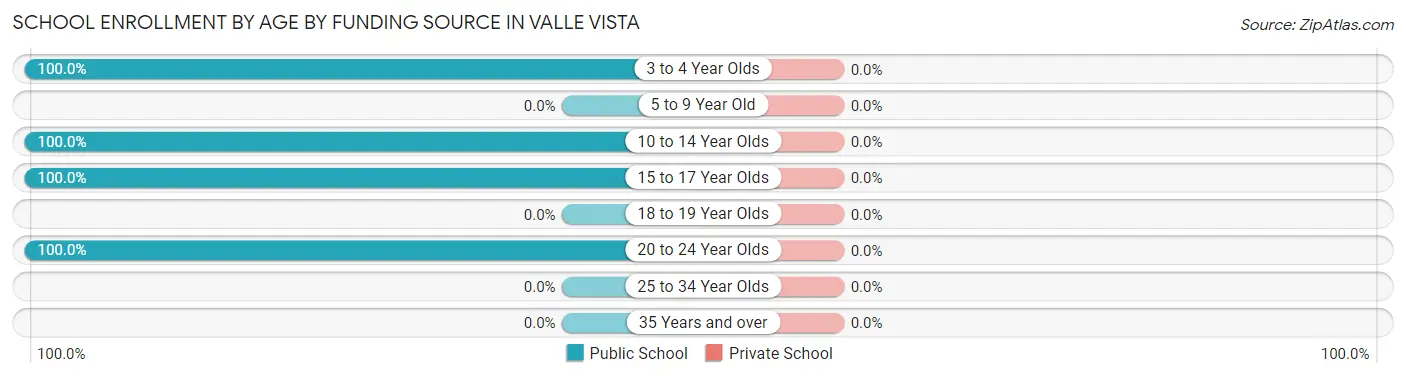
| Age Bracket | Public School | Private School |
| 3 to 4 Year Olds | 33 (100.0%) | 0 (0.0%) |
| 5 to 9 Year Old | 0 (0.0%) | 0 (0.0%) |
| 10 to 14 Year Olds | 157 (100.0%) | 0 (0.0%) |
| 15 to 17 Year Olds | 24 (100.0%) | 0 (0.0%) |
| 18 to 19 Year Olds | 0 (0.0%) | 0 (0.0%) |
| 20 to 24 Year Olds | 56 (100.0%) | 0 (0.0%) |
| 25 to 34 Year Olds | 0 (0.0%) | 0 (0.0%) |
| 35 Years and over | 0 (0.0%) | 0 (0.0%) |
| Total | 270 (100.0%) | 0 (0.0%) |
Educational Attainment by Field of Study in Valle Vista
Business (46 | 63.9%), and physical & health sciences (26 | 36.1%) are the most common fields of study among 72 individuals in Valle Vista who have obtained a bachelor's degree or higher.
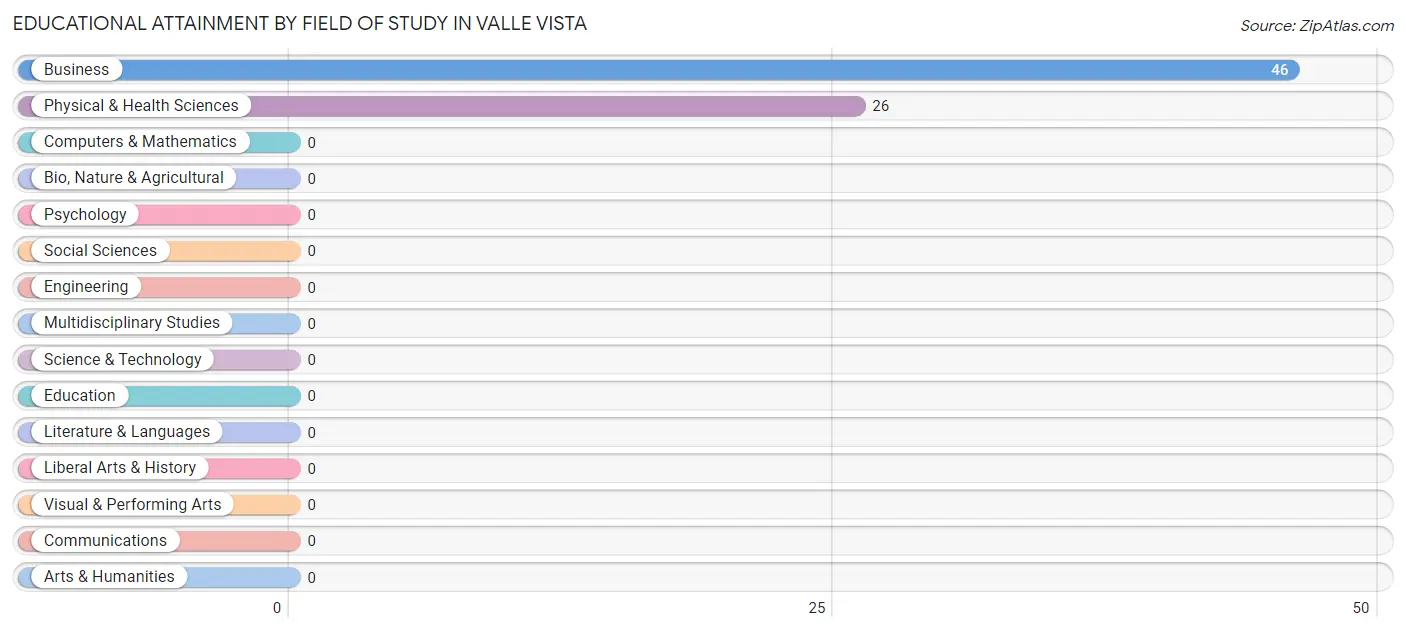
| Field of Study | # Graduates | % Graduates |
| Computers & Mathematics | 0 | 0.0% |
| Bio, Nature & Agricultural | 0 | 0.0% |
| Physical & Health Sciences | 26 | 36.1% |
| Psychology | 0 | 0.0% |
| Social Sciences | 0 | 0.0% |
| Engineering | 0 | 0.0% |
| Multidisciplinary Studies | 0 | 0.0% |
| Science & Technology | 0 | 0.0% |
| Business | 46 | 63.9% |
| Education | 0 | 0.0% |
| Literature & Languages | 0 | 0.0% |
| Liberal Arts & History | 0 | 0.0% |
| Visual & Performing Arts | 0 | 0.0% |
| Communications | 0 | 0.0% |
| Arts & Humanities | 0 | 0.0% |
| Total | 72 | 100.0% |
Transportation & Commute in Valle Vista
Vehicle Availability by Sex in Valle Vista
The most prevalent vehicle ownership categories in Valle Vista are males with 3 vehicles (95, accounting for 61.3%) and females with 3 vehicles (46, making up 49.5%).
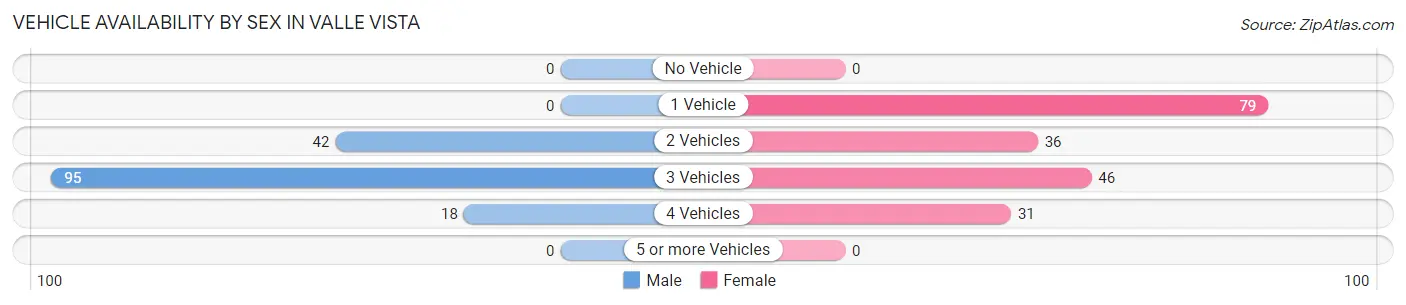
| Vehicles Available | Male | Female |
| No Vehicle | 0 (0.0%) | 0 (0.0%) |
| 1 Vehicle | 0 (0.0%) | 79 (41.1%) |
| 2 Vehicles | 42 (27.1%) | 36 (18.8%) |
| 3 Vehicles | 95 (61.3%) | 46 (24.0%) |
| 4 Vehicles | 18 (11.6%) | 31 (16.2%) |
| 5 or more Vehicles | 0 (0.0%) | 0 (0.0%) |
| Total | 155 (100.0%) | 192 (100.0%) |
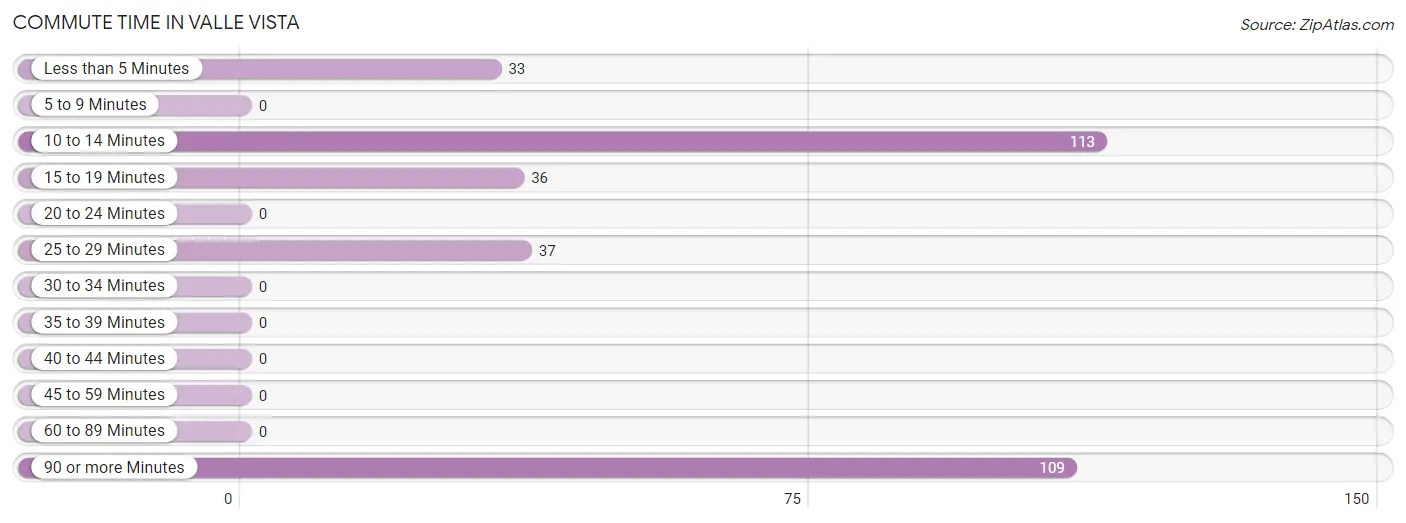
Commute Time in Valle Vista
The most frequently occuring commute durations in Valle Vista are 10 to 14 minutes (113 commuters, 34.4%), 90 or more minutes (109 commuters, 33.2%), and 25 to 29 minutes (37 commuters, 11.3%).
| Commute Time | # Commuters | % Commuters |
| Less than 5 Minutes | 33 | 10.1% |
| 5 to 9 Minutes | 0 | 0.0% |
| 10 to 14 Minutes | 113 | 34.4% |
| 15 to 19 Minutes | 36 | 11.0% |
| 20 to 24 Minutes | 0 | 0.0% |
| 25 to 29 Minutes | 37 | 11.3% |
| 30 to 34 Minutes | 0 | 0.0% |
| 35 to 39 Minutes | 0 | 0.0% |
| 40 to 44 Minutes | 0 | 0.0% |
| 45 to 59 Minutes | 0 | 0.0% |
| 60 to 89 Minutes | 0 | 0.0% |
| 90 or more Minutes | 109 | 33.2% |
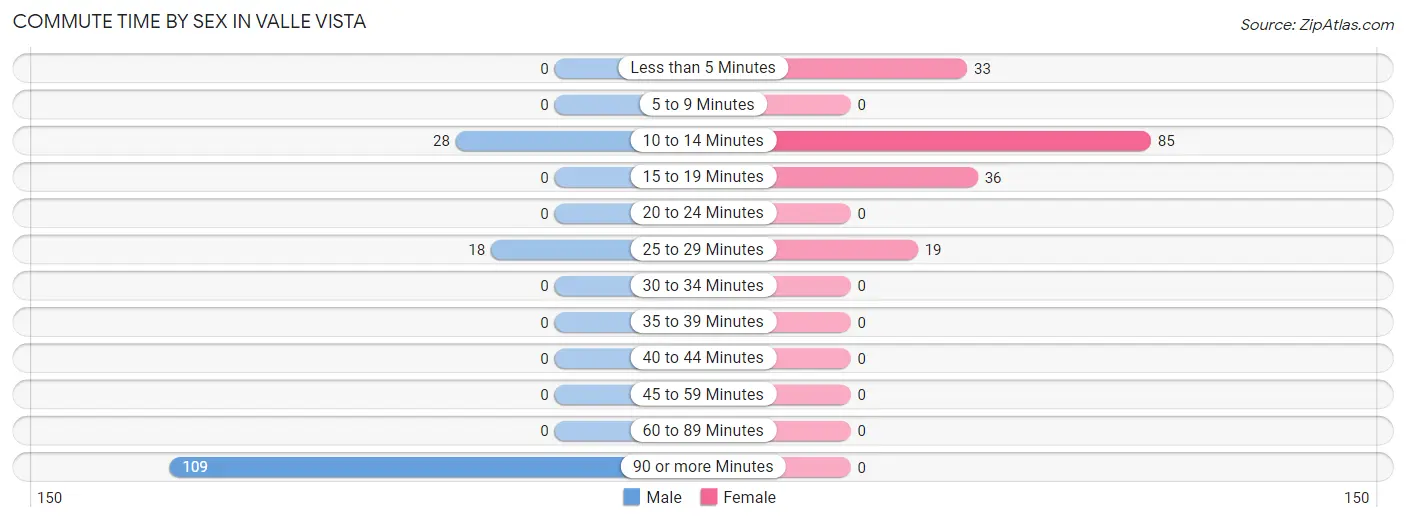
Commute Time by Sex in Valle Vista
The most common commute times in Valle Vista are 90 or more minutes (109 commuters, 70.3%) for males and 10 to 14 minutes (85 commuters, 49.1%) for females.
| Commute Time | Male | Female |
| Less than 5 Minutes | 0 (0.0%) | 33 (19.1%) |
| 5 to 9 Minutes | 0 (0.0%) | 0 (0.0%) |
| 10 to 14 Minutes | 28 (18.1%) | 85 (49.1%) |
| 15 to 19 Minutes | 0 (0.0%) | 36 (20.8%) |
| 20 to 24 Minutes | 0 (0.0%) | 0 (0.0%) |
| 25 to 29 Minutes | 18 (11.6%) | 19 (11.0%) |
| 30 to 34 Minutes | 0 (0.0%) | 0 (0.0%) |
| 35 to 39 Minutes | 0 (0.0%) | 0 (0.0%) |
| 40 to 44 Minutes | 0 (0.0%) | 0 (0.0%) |
| 45 to 59 Minutes | 0 (0.0%) | 0 (0.0%) |
| 60 to 89 Minutes | 0 (0.0%) | 0 (0.0%) |
| 90 or more Minutes | 109 (70.3%) | 0 (0.0%) |
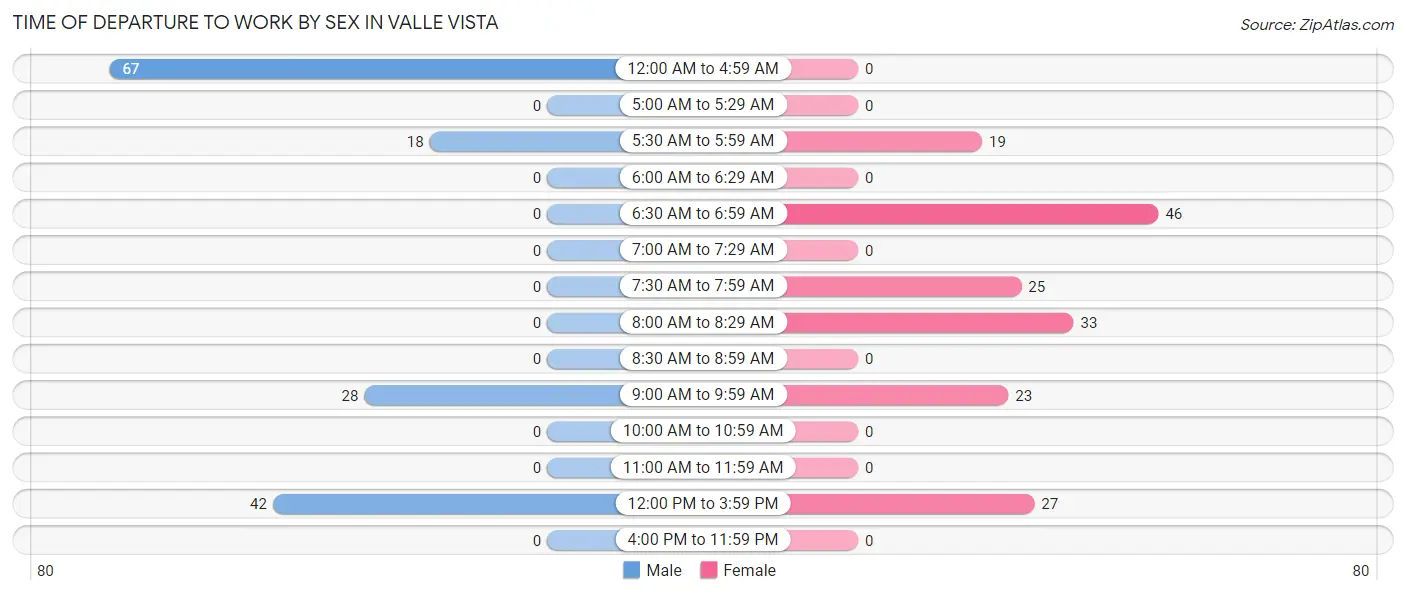
Time of Departure to Work by Sex in Valle Vista
The most frequent times of departure to work in Valle Vista are 12:00 AM to 4:59 AM (67, 43.2%) for males and 6:30 AM to 6:59 AM (46, 26.6%) for females.
| Time of Departure | Male | Female |
| 12:00 AM to 4:59 AM | 67 (43.2%) | 0 (0.0%) |
| 5:00 AM to 5:29 AM | 0 (0.0%) | 0 (0.0%) |
| 5:30 AM to 5:59 AM | 18 (11.6%) | 19 (11.0%) |
| 6:00 AM to 6:29 AM | 0 (0.0%) | 0 (0.0%) |
| 6:30 AM to 6:59 AM | 0 (0.0%) | 46 (26.6%) |
| 7:00 AM to 7:29 AM | 0 (0.0%) | 0 (0.0%) |
| 7:30 AM to 7:59 AM | 0 (0.0%) | 25 (14.4%) |
| 8:00 AM to 8:29 AM | 0 (0.0%) | 33 (19.1%) |
| 8:30 AM to 8:59 AM | 0 (0.0%) | 0 (0.0%) |
| 9:00 AM to 9:59 AM | 28 (18.1%) | 23 (13.3%) |
| 10:00 AM to 10:59 AM | 0 (0.0%) | 0 (0.0%) |
| 11:00 AM to 11:59 AM | 0 (0.0%) | 0 (0.0%) |
| 12:00 PM to 3:59 PM | 42 (27.1%) | 27 (15.6%) |
| 4:00 PM to 11:59 PM | 0 (0.0%) | 0 (0.0%) |
| Total | 155 (100.0%) | 173 (100.0%) |
Housing Occupancy in Valle Vista
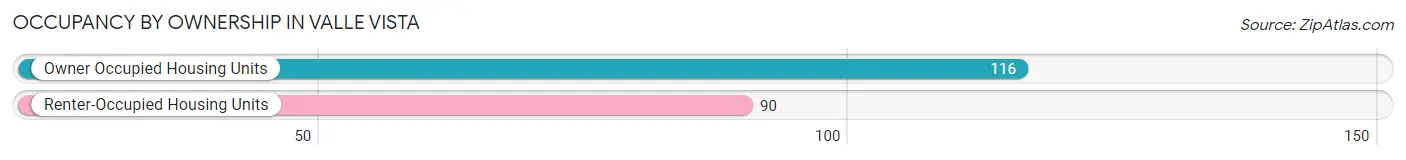
Occupancy by Ownership in Valle Vista
Of the total 206 dwellings in Valle Vista, owner-occupied units account for 116 (56.3%), while renter-occupied units make up 90 (43.7%).
| Occupancy | # Housing Units | % Housing Units |
| Owner Occupied Housing Units | 116 | 56.3% |
| Renter-Occupied Housing Units | 90 | 43.7% |
| Total Occupied Housing Units | 206 | 100.0% |
Occupancy by Household Size in Valle Vista
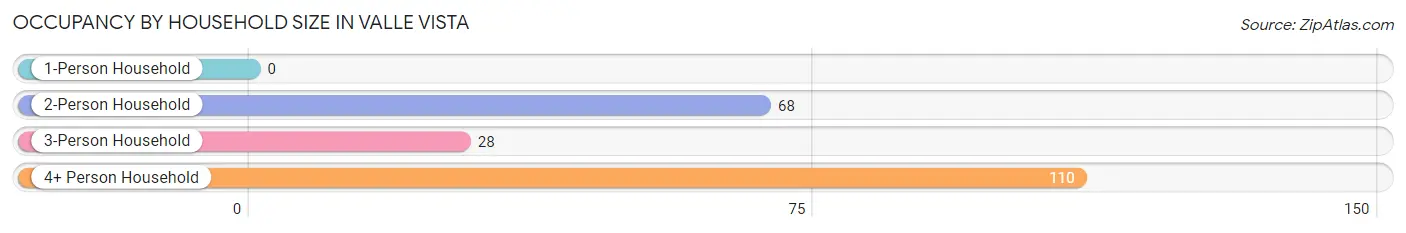
| Household Size | # Housing Units | % Housing Units |
| 1-Person Household | 0 | 0.0% |
| 2-Person Household | 68 | 33.0% |
| 3-Person Household | 28 | 13.6% |
| 4+ Person Household | 110 | 53.4% |
| Total Housing Units | 206 | 100.0% |
Occupancy by Ownership by Household Size in Valle Vista
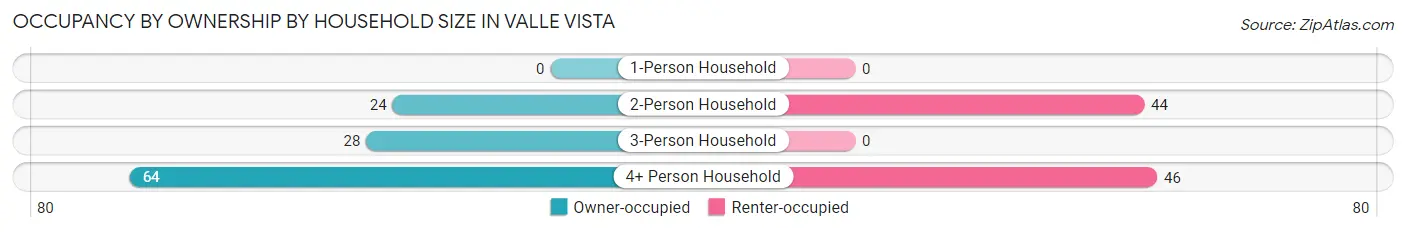
| Household Size | Owner-occupied | Renter-occupied |
| 1-Person Household | 0 (0.0%) | 0 (0.0%) |
| 2-Person Household | 24 (35.3%) | 44 (64.7%) |
| 3-Person Household | 28 (100.0%) | 0 (0.0%) |
| 4+ Person Household | 64 (58.2%) | 46 (41.8%) |
| Total Housing Units | 116 (56.3%) | 90 (43.7%) |
Occupancy by Educational Attainment in Valle Vista
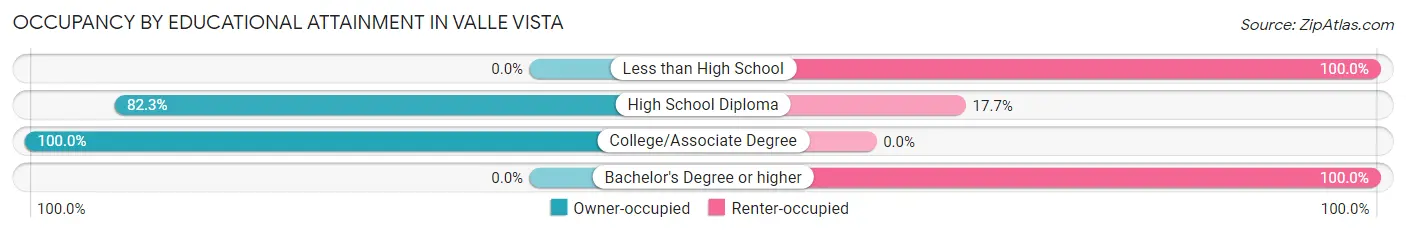
| Household Size | Owner-occupied | Renter-occupied |
| Less than High School | 0 (0.0%) | 33 (100.0%) |
| High School Diploma | 51 (82.3%) | 11 (17.7%) |
| College/Associate Degree | 65 (100.0%) | 0 (0.0%) |
| Bachelor's Degree or higher | 0 (0.0%) | 46 (100.0%) |
Occupancy by Age of Householder in Valle Vista
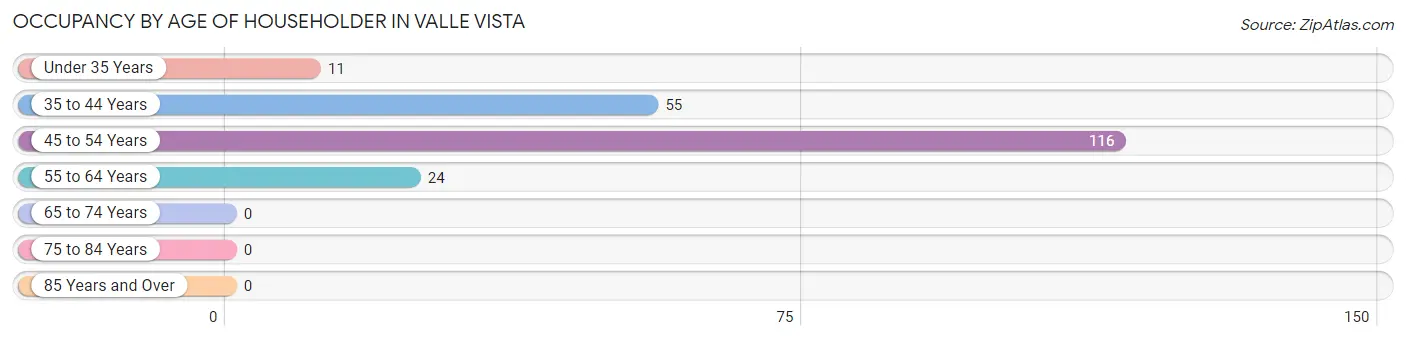
| Age Bracket | # Households | % Households |
| Under 35 Years | 11 | 5.3% |
| 35 to 44 Years | 55 | 26.7% |
| 45 to 54 Years | 116 | 56.3% |
| 55 to 64 Years | 24 | 11.7% |
| 65 to 74 Years | 0 | 0.0% |
| 75 to 84 Years | 0 | 0.0% |
| 85 Years and Over | 0 | 0.0% |
| Total | 206 | 100.0% |
Housing Finances in Valle Vista
Median Income by Occupancy in Valle Vista
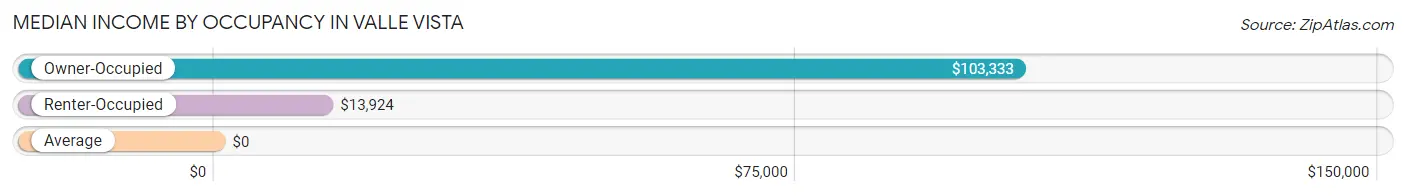
| Occupancy Type | # Households | Median Income |
| Owner-Occupied | 116 (56.3%) | $103,333 |
| Renter-Occupied | 90 (43.7%) | $13,924 |
| Average | 206 (100.0%) | $0 |
Occupancy by Householder Income Bracket in Valle Vista
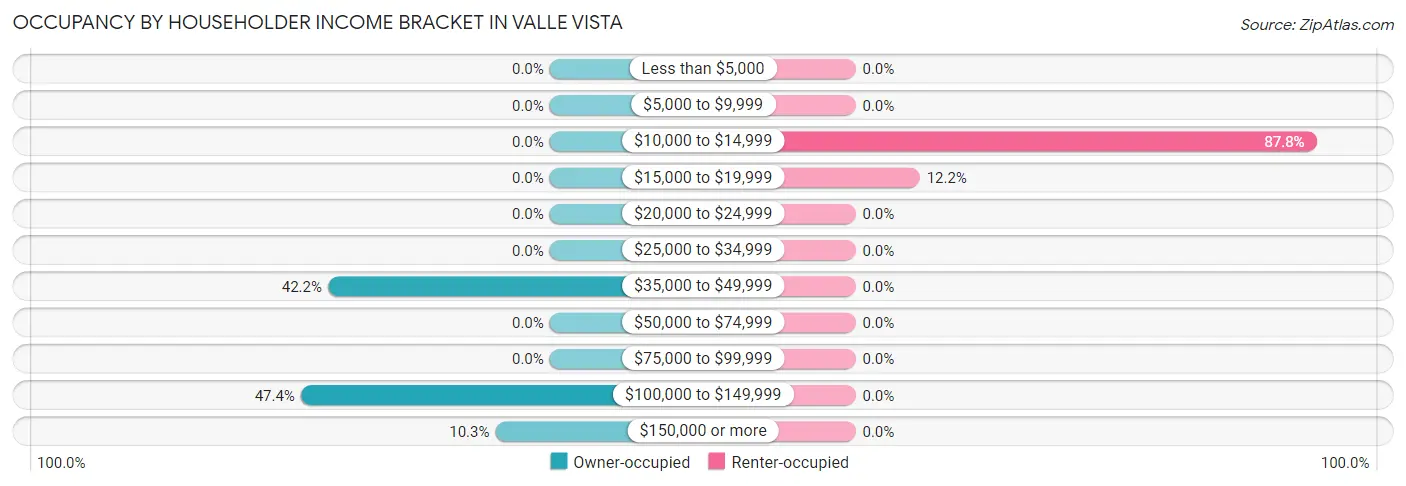
| Income Bracket | Owner-occupied | Renter-occupied |
| Less than $5,000 | 0 (0.0%) | 0 (0.0%) |
| $5,000 to $9,999 | 0 (0.0%) | 0 (0.0%) |
| $10,000 to $14,999 | 0 (0.0%) | 79 (87.8%) |
| $15,000 to $19,999 | 0 (0.0%) | 11 (12.2%) |
| $20,000 to $24,999 | 0 (0.0%) | 0 (0.0%) |
| $25,000 to $34,999 | 0 (0.0%) | 0 (0.0%) |
| $35,000 to $49,999 | 49 (42.2%) | 0 (0.0%) |
| $50,000 to $74,999 | 0 (0.0%) | 0 (0.0%) |
| $75,000 to $99,999 | 0 (0.0%) | 0 (0.0%) |
| $100,000 to $149,999 | 55 (47.4%) | 0 (0.0%) |
| $150,000 or more | 12 (10.3%) | 0 (0.0%) |
| Total | 116 (100.0%) | 90 (100.0%) |
Monthly Housing Cost Tiers in Valle Vista
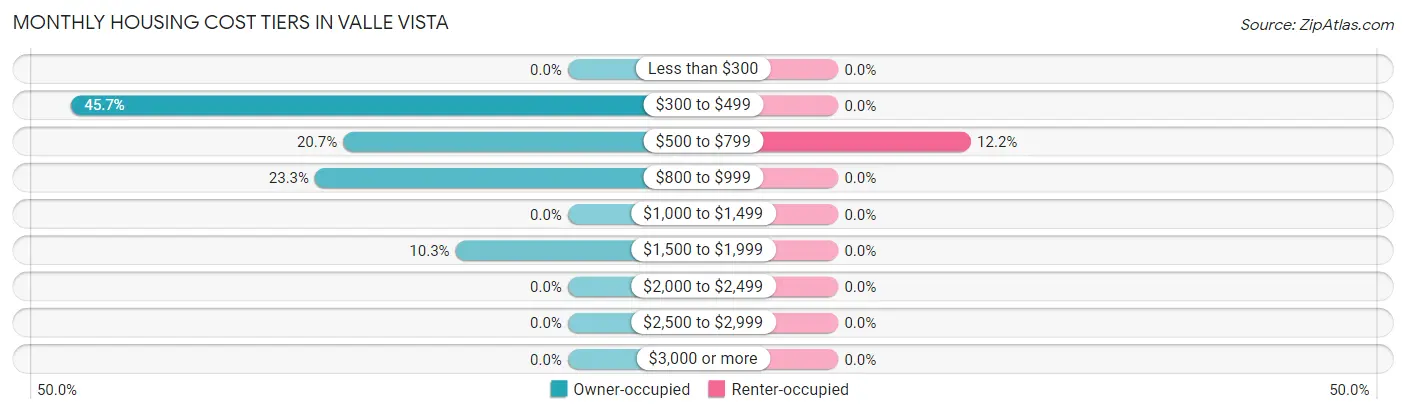
| Monthly Cost | Owner-occupied | Renter-occupied |
| Less than $300 | 0 (0.0%) | 0 (0.0%) |
| $300 to $499 | 53 (45.7%) | 0 (0.0%) |
| $500 to $799 | 24 (20.7%) | 11 (12.2%) |
| $800 to $999 | 27 (23.3%) | 0 (0.0%) |
| $1,000 to $1,499 | 0 (0.0%) | 0 (0.0%) |
| $1,500 to $1,999 | 12 (10.3%) | 0 (0.0%) |
| $2,000 to $2,499 | 0 (0.0%) | 0 (0.0%) |
| $2,500 to $2,999 | 0 (0.0%) | 0 (0.0%) |
| $3,000 or more | 0 (0.0%) | 0 (0.0%) |
| Total | 116 (100.0%) | 90 (100.0%) |
Physical Housing Characteristics in Valle Vista
Housing Structures in Valle Vista
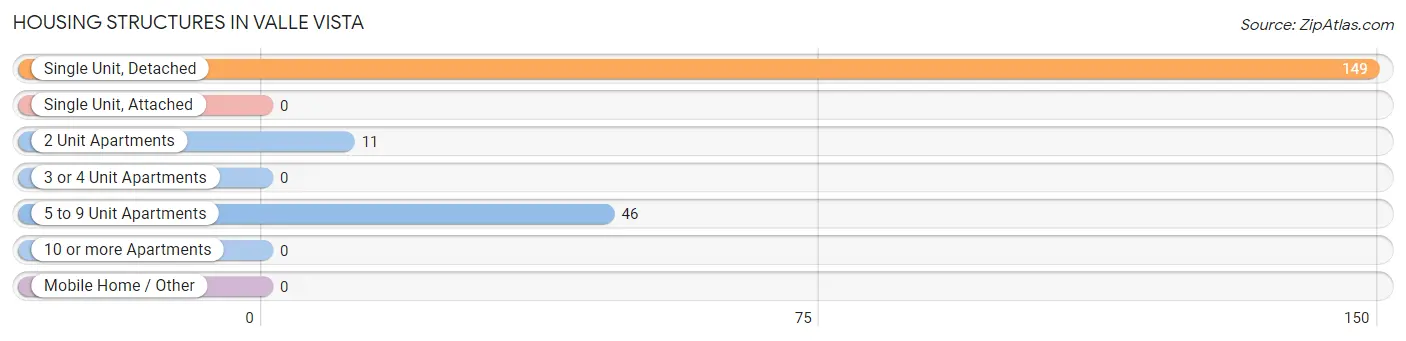
| Structure Type | # Housing Units | % Housing Units |
| Single Unit, Detached | 149 | 72.3% |
| Single Unit, Attached | 0 | 0.0% |
| 2 Unit Apartments | 11 | 5.3% |
| 3 or 4 Unit Apartments | 0 | 0.0% |
| 5 to 9 Unit Apartments | 46 | 22.3% |
| 10 or more Apartments | 0 | 0.0% |
| Mobile Home / Other | 0 | 0.0% |
| Total | 206 | 100.0% |
Housing Structures by Occupancy in Valle Vista
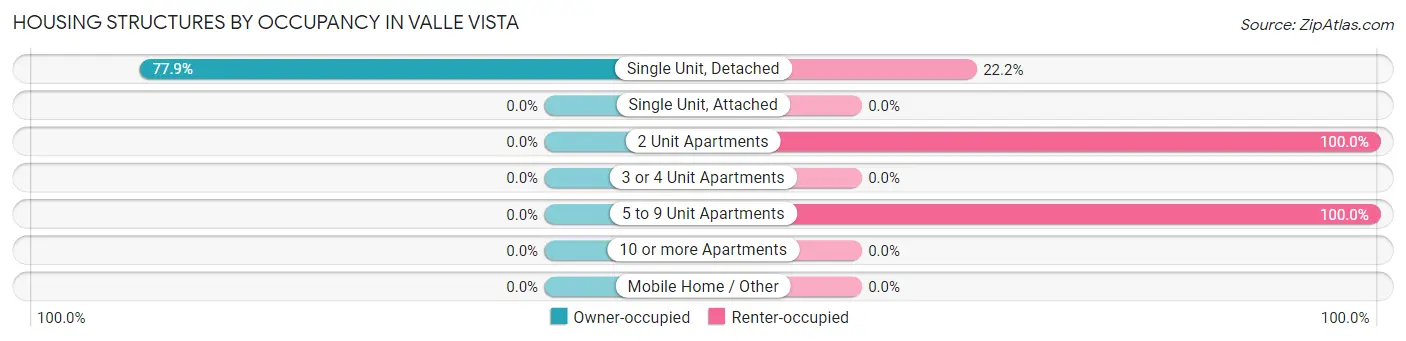
| Structure Type | Owner-occupied | Renter-occupied |
| Single Unit, Detached | 116 (77.8%) | 33 (22.2%) |
| Single Unit, Attached | 0 (0.0%) | 0 (0.0%) |
| 2 Unit Apartments | 0 (0.0%) | 11 (100.0%) |
| 3 or 4 Unit Apartments | 0 (0.0%) | 0 (0.0%) |
| 5 to 9 Unit Apartments | 0 (0.0%) | 46 (100.0%) |
| 10 or more Apartments | 0 (0.0%) | 0 (0.0%) |
| Mobile Home / Other | 0 (0.0%) | 0 (0.0%) |
| Total | 116 (56.3%) | 90 (43.7%) |
Housing Structures by Number of Rooms in Valle Vista
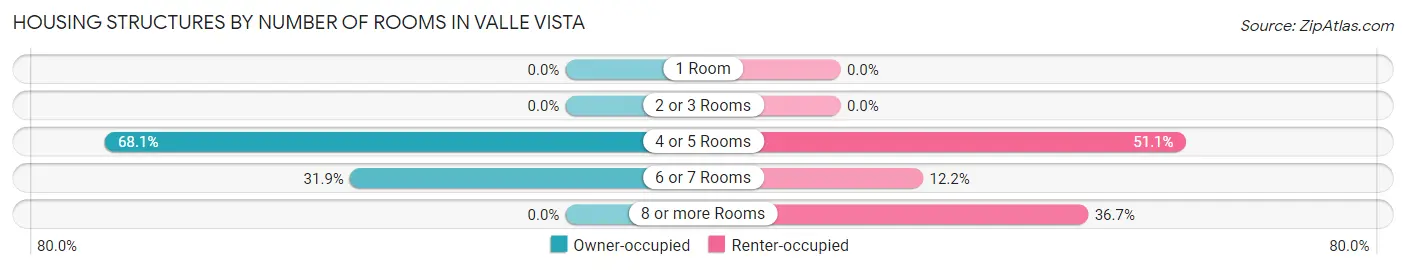
| Number of Rooms | Owner-occupied | Renter-occupied |
| 1 Room | 0 (0.0%) | 0 (0.0%) |
| 2 or 3 Rooms | 0 (0.0%) | 0 (0.0%) |
| 4 or 5 Rooms | 79 (68.1%) | 46 (51.1%) |
| 6 or 7 Rooms | 37 (31.9%) | 11 (12.2%) |
| 8 or more Rooms | 0 (0.0%) | 33 (36.7%) |
| Total | 116 (100.0%) | 90 (100.0%) |
Housing Structure by Heating Type in Valle Vista
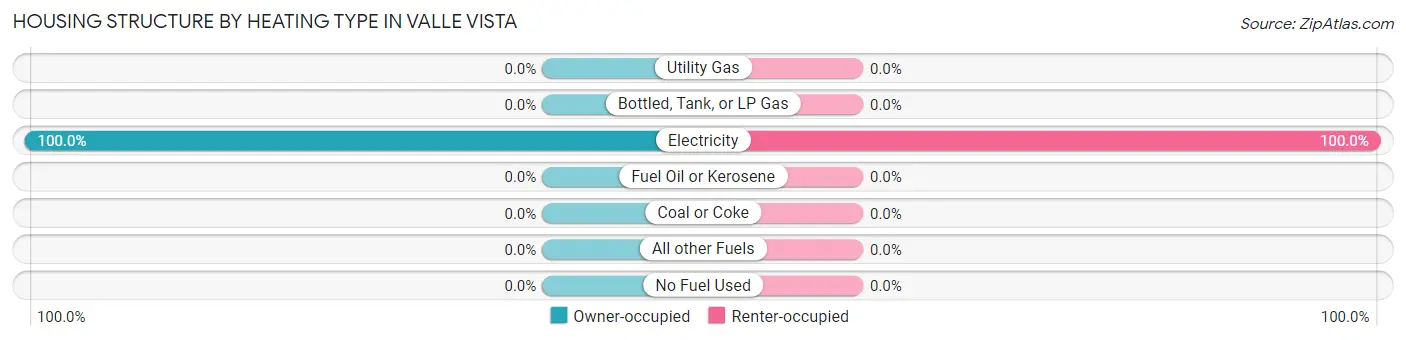
| Heating Type | Owner-occupied | Renter-occupied |
| Utility Gas | 0 (0.0%) | 0 (0.0%) |
| Bottled, Tank, or LP Gas | 0 (0.0%) | 0 (0.0%) |
| Electricity | 116 (100.0%) | 90 (100.0%) |
| Fuel Oil or Kerosene | 0 (0.0%) | 0 (0.0%) |
| Coal or Coke | 0 (0.0%) | 0 (0.0%) |
| All other Fuels | 0 (0.0%) | 0 (0.0%) |
| No Fuel Used | 0 (0.0%) | 0 (0.0%) |
| Total | 116 (100.0%) | 90 (100.0%) |
Household Vehicle Usage in Valle Vista
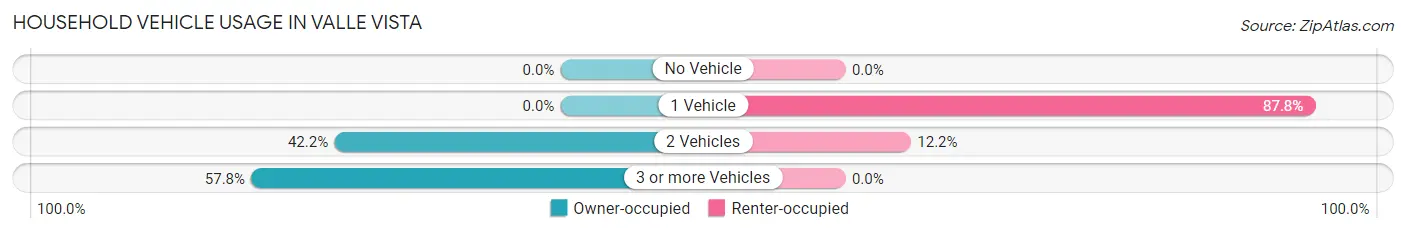
| Vehicles per Household | Owner-occupied | Renter-occupied |
| No Vehicle | 0 (0.0%) | 0 (0.0%) |
| 1 Vehicle | 0 (0.0%) | 79 (87.8%) |
| 2 Vehicles | 49 (42.2%) | 11 (12.2%) |
| 3 or more Vehicles | 67 (57.8%) | 0 (0.0%) |
| Total | 116 (100.0%) | 90 (100.0%) |
Real Estate & Mortgages in Valle Vista
Real Estate and Mortgage Overview in Valle Vista
| Characteristic | Without Mortgage | With Mortgage |
| Housing Units | 77 | 39 |
| Median Property Value | $110,500 | $0 |
| Median Household Income | - | - |
| Monthly Housing Costs | $448 | $0 |
| Real Estate Taxes | - | - |
Property Value by Mortgage Status in Valle Vista
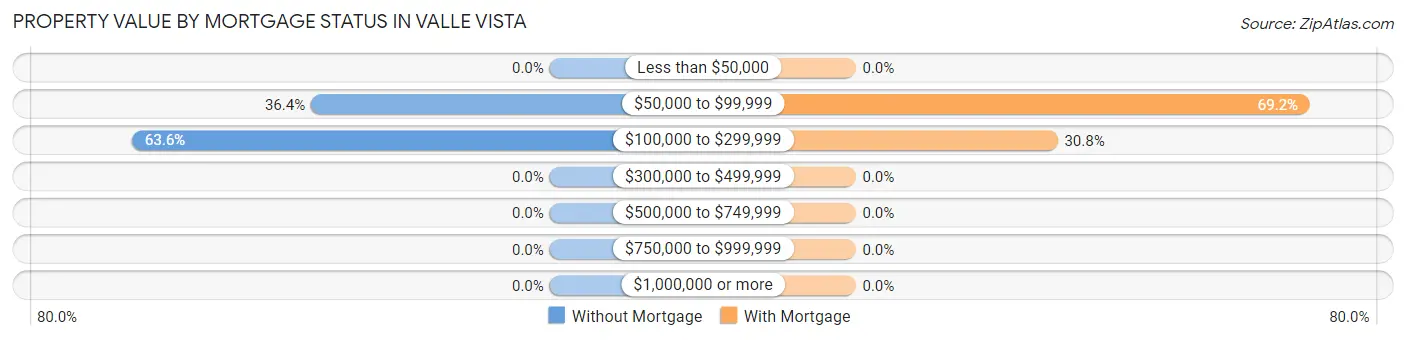
| Property Value | Without Mortgage | With Mortgage |
| Less than $50,000 | 0 (0.0%) | 0 (0.0%) |
| $50,000 to $99,999 | 28 (36.4%) | 27 (69.2%) |
| $100,000 to $299,999 | 49 (63.6%) | 12 (30.8%) |
| $300,000 to $499,999 | 0 (0.0%) | 0 (0.0%) |
| $500,000 to $749,999 | 0 (0.0%) | 0 (0.0%) |
| $750,000 to $999,999 | 0 (0.0%) | 0 (0.0%) |
| $1,000,000 or more | 0 (0.0%) | 0 (0.0%) |
| Total | 77 (100.0%) | 39 (100.0%) |
Household Income by Mortgage Status in Valle Vista
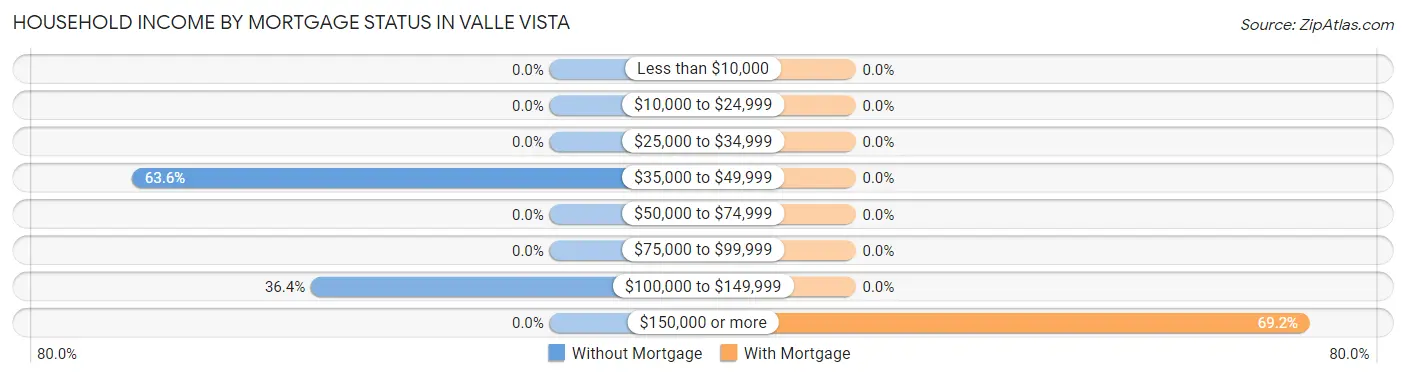
| Household Income | Without Mortgage | With Mortgage |
| Less than $10,000 | 0 (0.0%) | 0 (0.0%) |
| $10,000 to $24,999 | 0 (0.0%) | 0 (0.0%) |
| $25,000 to $34,999 | 0 (0.0%) | 0 (0.0%) |
| $35,000 to $49,999 | 49 (63.6%) | 0 (0.0%) |
| $50,000 to $74,999 | 0 (0.0%) | 0 (0.0%) |
| $75,000 to $99,999 | 0 (0.0%) | 0 (0.0%) |
| $100,000 to $149,999 | 28 (36.4%) | 0 (0.0%) |
| $150,000 or more | 0 (0.0%) | 27 (69.2%) |
| Total | 77 (100.0%) | 39 (100.0%) |
Property Value to Household Income Ratio in Valle Vista
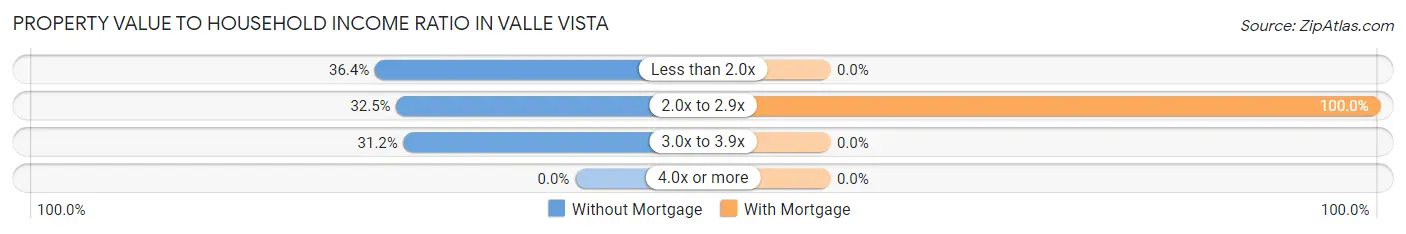
| Value-to-Income Ratio | Without Mortgage | With Mortgage |
| Less than 2.0x | 28 (36.4%) | 0 (0.0%) |
| 2.0x to 2.9x | 25 (32.5%) | 39 (100.0%) |
| 3.0x to 3.9x | 24 (31.2%) | 0 (0.0%) |
| 4.0x or more | 0 (0.0%) | 0 (0.0%) |
| Total | 77 (100.0%) | 39 (100.0%) |
Real Estate Taxes by Mortgage Status in Valle Vista
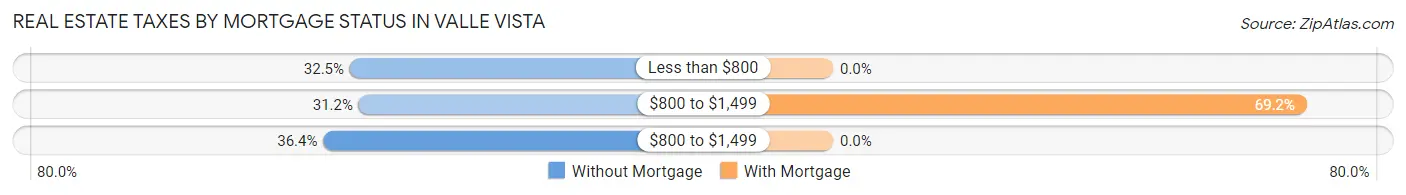
| Property Taxes | Without Mortgage | With Mortgage |
| Less than $800 | 25 (32.5%) | 0 (0.0%) |
| $800 to $1,499 | 24 (31.2%) | 27 (69.2%) |
| $800 to $1,499 | 28 (36.4%) | 0 (0.0%) |
| Total | 77 (100.0%) | 39 (100.0%) |
Health & Disability in Valle Vista
Health Insurance Coverage by Age in Valle Vista
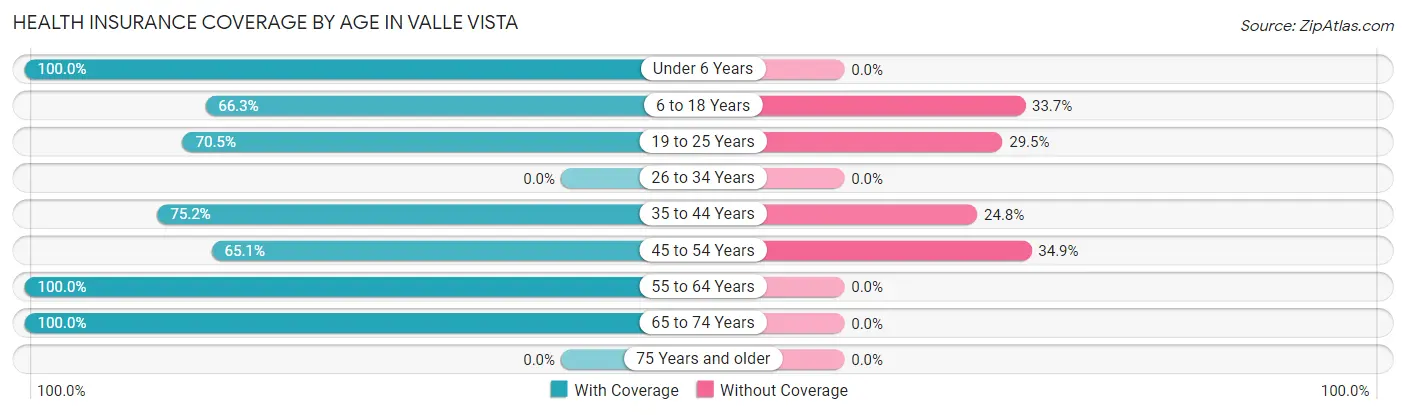
| Age Bracket | With Coverage | Without Coverage |
| Under 6 Years | 71 (100.0%) | 0 (0.0%) |
| 6 to 18 Years | 120 (66.3%) | 61 (33.7%) |
| 19 to 25 Years | 134 (70.5%) | 56 (29.5%) |
| 26 to 34 Years | 0 (0.0%) | 0 (0.0%) |
| 35 to 44 Years | 82 (75.2%) | 27 (24.8%) |
| 45 to 54 Years | 140 (65.1%) | 75 (34.9%) |
| 55 to 64 Years | 24 (100.0%) | 0 (0.0%) |
| 65 to 74 Years | 26 (100.0%) | 0 (0.0%) |
| 75 Years and older | 0 (0.0%) | 0 (0.0%) |
| Total | 597 (73.2%) | 219 (26.8%) |
Health Insurance Coverage by Citizenship Status in Valle Vista
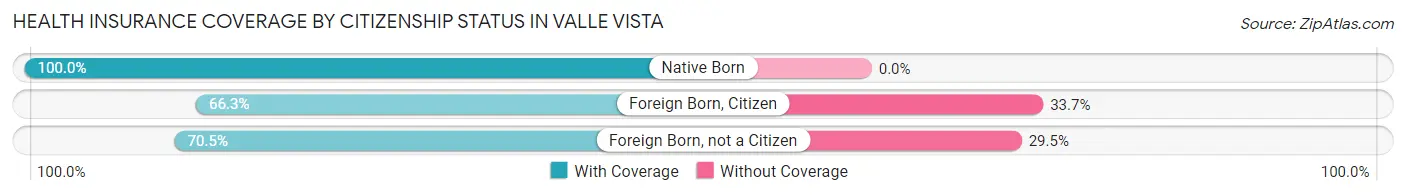
| Citizenship Status | With Coverage | Without Coverage |
| Native Born | 71 (100.0%) | 0 (0.0%) |
| Foreign Born, Citizen | 120 (66.3%) | 61 (33.7%) |
| Foreign Born, not a Citizen | 134 (70.5%) | 56 (29.5%) |
Health Insurance Coverage by Household Income in Valle Vista
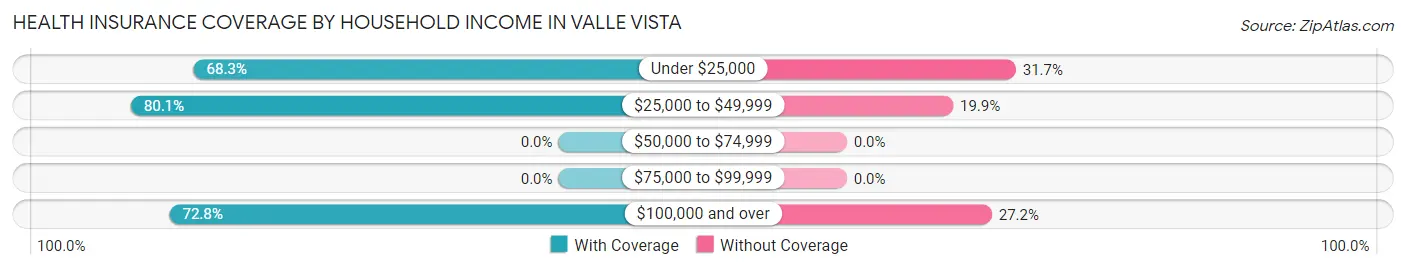
| Household Income | With Coverage | Without Coverage |
| Under $25,000 | 192 (68.3%) | 89 (31.7%) |
| $25,000 to $49,999 | 169 (80.1%) | 42 (19.9%) |
| $50,000 to $74,999 | 0 (0.0%) | 0 (0.0%) |
| $75,000 to $99,999 | 0 (0.0%) | 0 (0.0%) |
| $100,000 and over | 236 (72.8%) | 88 (27.2%) |
Public vs Private Health Insurance Coverage by Age in Valle Vista
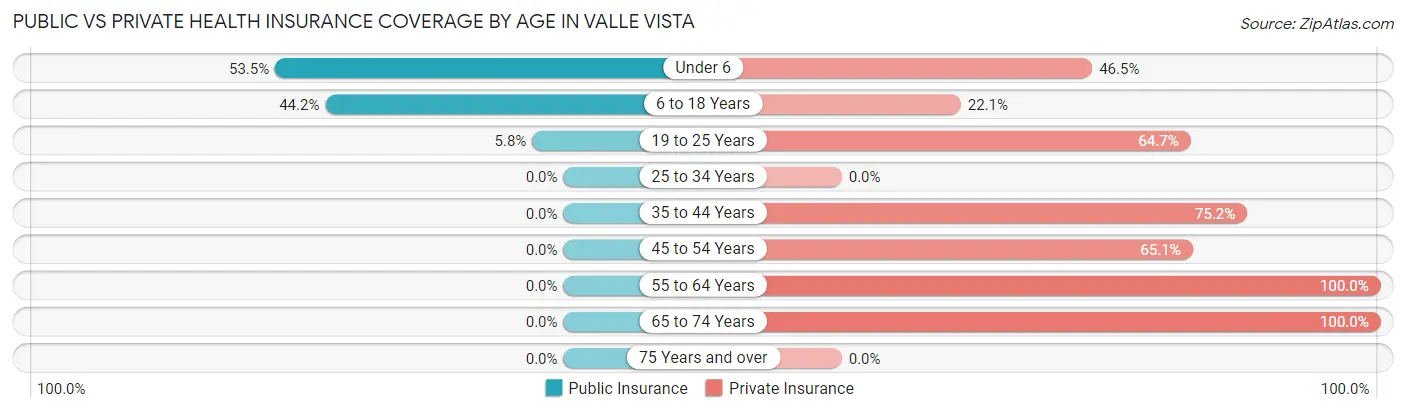
| Age Bracket | Public Insurance | Private Insurance |
| Under 6 | 38 (53.5%) | 33 (46.5%) |
| 6 to 18 Years | 80 (44.2%) | 40 (22.1%) |
| 19 to 25 Years | 11 (5.8%) | 123 (64.7%) |
| 25 to 34 Years | 0 (0.0%) | 0 (0.0%) |
| 35 to 44 Years | 0 (0.0%) | 82 (75.2%) |
| 45 to 54 Years | 0 (0.0%) | 140 (65.1%) |
| 55 to 64 Years | 0 (0.0%) | 24 (100.0%) |
| 65 to 74 Years | 0 (0.0%) | 26 (100.0%) |
| 75 Years and over | 0 (0.0%) | 0 (0.0%) |
| Total | 129 (15.8%) | 468 (57.4%) |
Disability Status by Sex by Age in Valle Vista
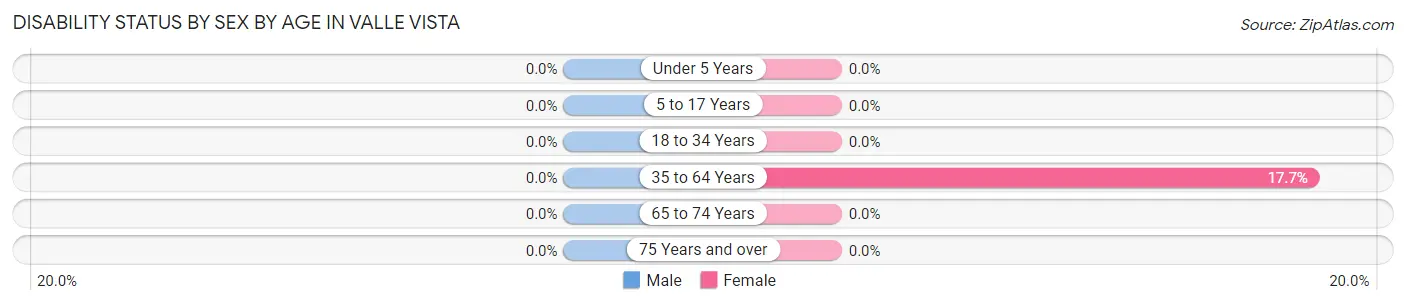
| Age Bracket | Male | Female |
| Under 5 Years | 0 (0.0%) | 0 (0.0%) |
| 5 to 17 Years | 0 (0.0%) | 0 (0.0%) |
| 18 to 34 Years | 0 (0.0%) | 0 (0.0%) |
| 35 to 64 Years | 0 (0.0%) | 33 (17.7%) |
| 65 to 74 Years | 0 (0.0%) | 0 (0.0%) |
| 75 Years and over | 0 (0.0%) | 0 (0.0%) |
Disability Class by Sex by Age in Valle Vista
Disability Class: Hearing Difficulty
| Age Bracket | Male | Female |
| Under 5 Years | 0 (0.0%) | 0 (0.0%) |
| 5 to 17 Years | 0 (0.0%) | 0 (0.0%) |
| 18 to 34 Years | 0 (0.0%) | 0 (0.0%) |
| 35 to 64 Years | 0 (0.0%) | 0 (0.0%) |
| 65 to 74 Years | 0 (0.0%) | 0 (0.0%) |
| 75 Years and over | 0 (0.0%) | 0 (0.0%) |
Disability Class: Vision Difficulty
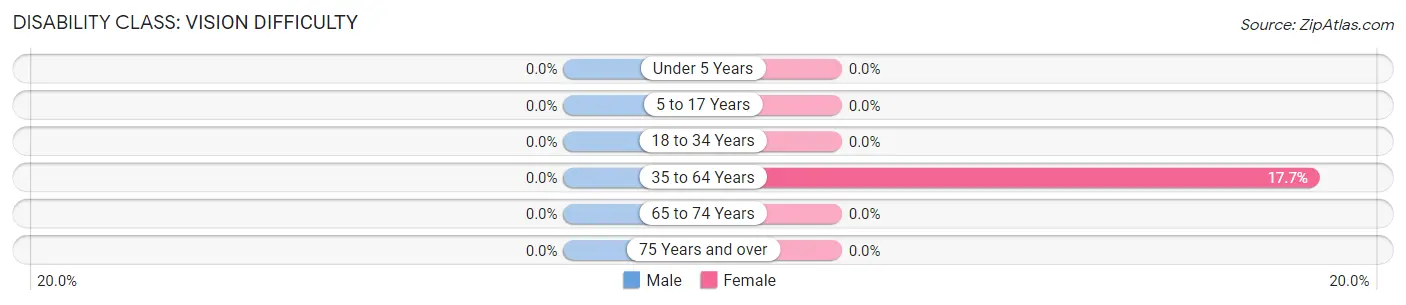
| Age Bracket | Male | Female |
| Under 5 Years | 0 (0.0%) | 0 (0.0%) |
| 5 to 17 Years | 0 (0.0%) | 0 (0.0%) |
| 18 to 34 Years | 0 (0.0%) | 0 (0.0%) |
| 35 to 64 Years | 0 (0.0%) | 33 (17.7%) |
| 65 to 74 Years | 0 (0.0%) | 0 (0.0%) |
| 75 Years and over | 0 (0.0%) | 0 (0.0%) |
Disability Class: Cognitive Difficulty
| Age Bracket | Male | Female |
| 5 to 17 Years | 0 (0.0%) | 0 (0.0%) |
| 18 to 34 Years | 0 (0.0%) | 0 (0.0%) |
| 35 to 64 Years | 0 (0.0%) | 0 (0.0%) |
| 65 to 74 Years | 0 (0.0%) | 0 (0.0%) |
| 75 Years and over | 0 (0.0%) | 0 (0.0%) |
Disability Class: Ambulatory Difficulty
| Age Bracket | Male | Female |
| 5 to 17 Years | 0 (0.0%) | 0 (0.0%) |
| 18 to 34 Years | 0 (0.0%) | 0 (0.0%) |
| 35 to 64 Years | 0 (0.0%) | 0 (0.0%) |
| 65 to 74 Years | 0 (0.0%) | 0 (0.0%) |
| 75 Years and over | 0 (0.0%) | 0 (0.0%) |
Disability Class: Self-Care Difficulty
| Age Bracket | Male | Female |
| 5 to 17 Years | 0 (0.0%) | 0 (0.0%) |
| 18 to 34 Years | 0 (0.0%) | 0 (0.0%) |
| 35 to 64 Years | 0 (0.0%) | 0 (0.0%) |
| 65 to 74 Years | 0 (0.0%) | 0 (0.0%) |
| 75 Years and over | 0 (0.0%) | 0 (0.0%) |
Technology Access in Valle Vista
Computing Device Access in Valle Vista
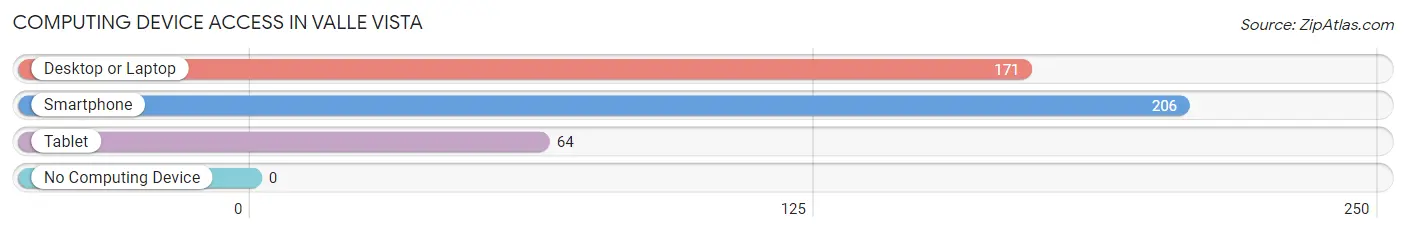
| Device Type | # Households | % Households |
| Desktop or Laptop | 171 | 83.0% |
| Smartphone | 206 | 100.0% |
| Tablet | 64 | 31.1% |
| No Computing Device | 0 | 0.0% |
| Total | 206 | 100.0% |
Internet Access in Valle Vista
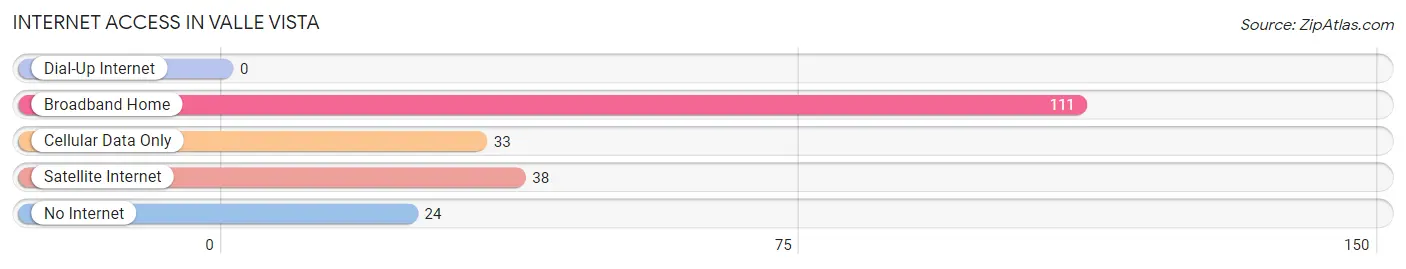
| Internet Type | # Households | % Households |
| Dial-Up Internet | 0 | 0.0% |
| Broadband Home | 111 | 53.9% |
| Cellular Data Only | 33 | 16.0% |
| Satellite Internet | 38 | 18.4% |
| No Internet | 24 | 11.7% |
| Total | 206 | 100.0% |
Valle Vista Summary
Valle Vista is a small unincorporated community located in Hidalgo County, Texas. It is situated about 10 miles south of the city of McAllen and is part of the McAllen–Edinburg–Mission metropolitan area. Valle Vista is a rural community with a population of approximately 1,000 people.
History
Valle Vista was founded in the early 1900s by a group of Mexican immigrants who were looking for a place to settle and start a new life. The area was originally known as “El Valle” or “The Valley” due to its location in a valley between two hills. The name was later changed to Valle Vista, which means “Valley View” in Spanish.
The first settlers of Valle Vista were mostly farmers and ranchers who grew crops such as cotton, corn, and beans. They also raised livestock such as cattle, horses, and sheep. The community was largely self-sufficient and relied on the land for its sustenance.
In the early 1900s, the population of Valle Vista began to grow as more people moved to the area. The community was eventually incorporated in the late 1920s and the first mayor was elected in 1930.
Geography
Valle Vista is located in the Rio Grande Valley of South Texas. It is situated in a valley between two hills, which gives the community its name. The area is mostly flat and is surrounded by farmland and ranches.
The climate in Valle Vista is subtropical and humid. The average temperature in the summer is around 90°F and in the winter it is around 70°F. The area receives an average of 30 inches of rain per year.
Economy
The economy of Valle Vista is largely based on agriculture. The area is known for its production of cotton, corn, beans, and other crops. Livestock such as cattle, horses, and sheep are also raised in the area.
In addition to agriculture, Valle Vista also has a small manufacturing sector. The community is home to several small businesses, including a furniture factory, a metal fabrication shop, and a machine shop.
Demographics
As of the 2010 census, the population of Valle Vista was 1,000. The racial makeup of the community was 94.7% Hispanic or Latino, 4.3% White, and 0.9% Other. The median household income was $25,000 and the median age was 33.
Conclusion
Valle Vista is a small unincorporated community located in Hidalgo County, Texas. It is situated about 10 miles south of the city of McAllen and is part of the McAllen–Edinburg–Mission metropolitan area. Valle Vista is a rural community with a population of approximately 1,000 people. The economy of Valle Vista is largely based on agriculture and the area is known for its production of cotton, corn, beans, and other crops. The racial makeup of the community is 94.7% Hispanic or Latino, 4.3% White, and 0.9% Other. Valle Vista is a unique community with a rich history and culture that is worth exploring.
Common Questions
What is Per Capita Income in Valle Vista?
Per Capita income in Valle Vista is $16,660.
What is Income or Wage Gap in Valle Vista?
Income or Wage Gap in Valle Vista is 50.9%.
Women in Valle Vista earn 49.1 cents for every dollar earned by a man.
What is Inequality or Gini Index in Valle Vista?
Inequality or Gini Index in Valle Vista is 0.48.
What is the Total Population of Valle Vista?
Total Population of Valle Vista is 816.
What is the Total Male Population of Valle Vista?
Total Male Population of Valle Vista is 415.
What is the Total Female Population of Valle Vista?
Total Female Population of Valle Vista is 401.
What is the Ratio of Males per 100 Females in Valle Vista?
There are 103.49 Males per 100 Females in Valle Vista.
What is the Ratio of Females per 100 Males in Valle Vista?
There are 96.63 Females per 100 Males in Valle Vista.
What is the Median Population Age in Valle Vista?
Median Population Age in Valle Vista is 24.2 Years.
What is the Average Family Size in Valle Vista
Average Family Size in Valle Vista is 4.0 People.
What is the Average Household Size in Valle Vista
Average Household Size in Valle Vista is 4.0 People.
How Large is the Labor Force in Valle Vista?
There are 475 People in the Labor Forcein in Valle Vista.
What is the Percentage of People in the Labor Force in Valle Vista?
80.8% of People are in the Labor Force in Valle Vista.
What is the Unemployment Rate in Valle Vista?
Unemployment Rate in Valle Vista is 23.2%.