Zip Codes with the Highest Percentage of Population Employed in Food Preparation & Serving in Lewisville, TX
RELATED REPORTS & OPTIONS
Food Preparation & Serving
Lewisville
Compare Zip Codes
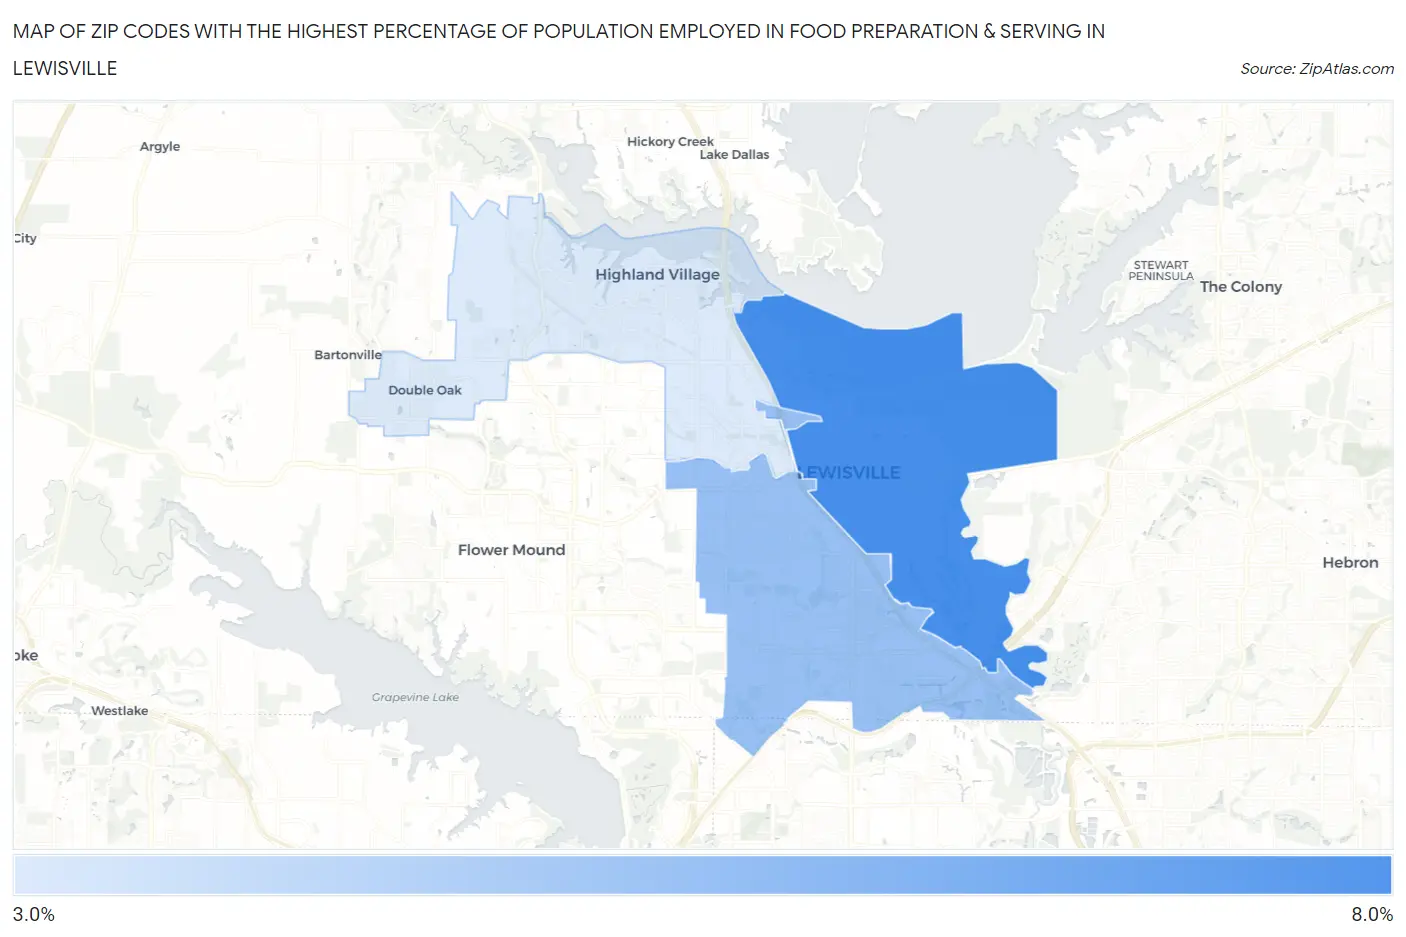
Map of Zip Codes with the Highest Percentage of Population Employed in Food Preparation & Serving in Lewisville
3.3%
7.1%
Zip Codes with the Highest Percentage of Population Employed in Food Preparation & Serving in Lewisville, TX
| Zip Code | % Employed | vs State | vs National | |
| 1. | 75057 | 7.1% | 5.4%(+1.76)#399 | 5.3%(+1.82)#6,327 |
| 2. | 75067 | 5.0% | 5.4%(-0.316)#802 | 5.3%(-0.251)#12,808 |
| 3. | 75077 | 3.3% | 5.4%(-2.03)#1,195 | 5.3%(-1.96)#19,966 |
1
Common Questions
What are the Top Zip Codes with the Highest Percentage of Population Employed in Food Preparation & Serving in Lewisville, TX?
Top Zip Codes with the Highest Percentage of Population Employed in Food Preparation & Serving in Lewisville, TX are:
What zip code has the Highest Percentage of Population Employed in Food Preparation & Serving in Lewisville, TX?
75057 has the Highest Percentage of Population Employed in Food Preparation & Serving in Lewisville, TX with 7.1%.
What is the Percentage of Population Employed in Food Preparation & Serving in Lewisville, TX?
Percentage of Population Employed in Food Preparation & Serving in Lewisville is 4.8%.
What is the Percentage of Population Employed in Food Preparation & Serving in Texas?
Percentage of Population Employed in Food Preparation & Serving in Texas is 5.4%.
What is the Percentage of Population Employed in Food Preparation & Serving in the United States?
Percentage of Population Employed in Food Preparation & Serving in the United States is 5.3%.