Zip Codes with the Highest Percentage of Population Employed in Food Preparation & Serving in Port Arthur, TX
RELATED REPORTS & OPTIONS
Food Preparation & Serving
Port Arthur
Compare Zip Codes
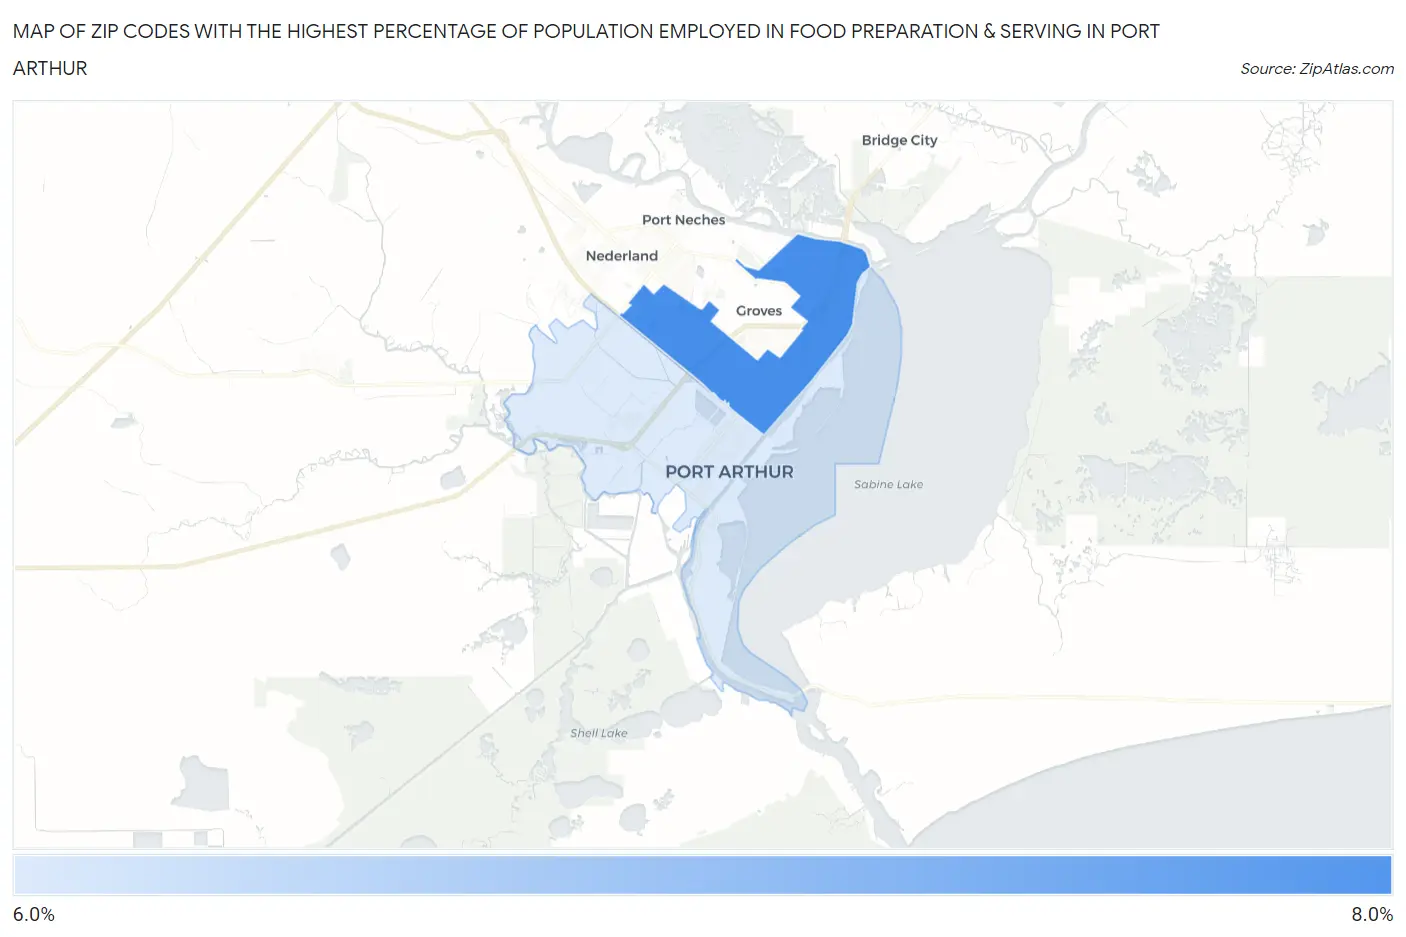
Map of Zip Codes with the Highest Percentage of Population Employed in Food Preparation & Serving in Port Arthur
6.0%
6.1%
Zip Codes with the Highest Percentage of Population Employed in Food Preparation & Serving in Port Arthur, TX
| Zip Code | % Employed | vs State | vs National | |
| 1. | 77642 | 6.1% | 5.4%(+0.746)#545 | 5.3%(+0.811)#9,036 |
| 2. | 77640 | 6.0% | 5.4%(+0.685)#561 | 5.3%(+0.750)#9,225 |
1
Common Questions
What are the Top Zip Codes with the Highest Percentage of Population Employed in Food Preparation & Serving in Port Arthur, TX?
Top Zip Codes with the Highest Percentage of Population Employed in Food Preparation & Serving in Port Arthur, TX are:
What zip code has the Highest Percentage of Population Employed in Food Preparation & Serving in Port Arthur, TX?
77642 has the Highest Percentage of Population Employed in Food Preparation & Serving in Port Arthur, TX with 6.1%.
What is the Percentage of Population Employed in Food Preparation & Serving in Port Arthur, TX?
Percentage of Population Employed in Food Preparation & Serving in Port Arthur is 6.0%.
What is the Percentage of Population Employed in Food Preparation & Serving in Texas?
Percentage of Population Employed in Food Preparation & Serving in Texas is 5.4%.
What is the Percentage of Population Employed in Food Preparation & Serving in the United States?
Percentage of Population Employed in Food Preparation & Serving in the United States is 5.3%.