Tira, TX Map & Demographics
Tira Map
Tira Overview
$23,370
PER CAPITA INCOME
$71,000
AVG FAMILY INCOME
$58,906
AVG HOUSEHOLD INCOME
5.7%
WAGE / INCOME GAP [ % ]
94.3¢/ $1
WAGE / INCOME GAP [ $ ]
0.37
INEQUALITY / GINI INDEX
440
TOTAL POPULATION
253
MALE POPULATION
187
FEMALE POPULATION
135.29
MALES / 100 FEMALES
73.91
FEMALES / 100 MALES
32.2
MEDIAN AGE
3.6
AVG FAMILY SIZE
3.2
AVG HOUSEHOLD SIZE
202
LABOR FORCE [ PEOPLE ]
64.7%
PERCENT IN LABOR FORCE
Income in Tira
Income Overview in Tira
Per Capita Income in Tira is $23,370, while median incomes of families and households are $71,000 and $58,906 respectively.
| Characteristic | Number | Measure |
| Per Capita Income | 440 | $23,370 |
| Median Family Income | 102 | $71,000 |
| Mean Family Income | 102 | $72,591 |
| Median Household Income | 137 | $58,906 |
| Mean Household Income | 137 | $69,907 |
| Income Deficit | 102 | $0 |
| Wage / Income Gap (%) | 440 | 5.69% |
| Wage / Income Gap ($) | 440 | 94.31¢ per $1 |
| Gini / Inequality Index | 440 | 0.37 |
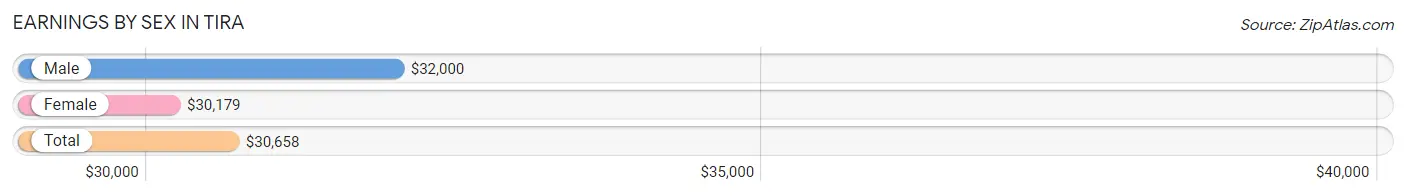
Earnings by Sex in Tira
Average Earnings in Tira are $30,658, $32,000 for men and $30,179 for women, a difference of 5.7%.
| Sex | Number | Average Earnings |
| Male | 144 (66.1%) | $32,000 |
| Female | 74 (33.9%) | $30,179 |
| Total | 218 (100.0%) | $30,658 |
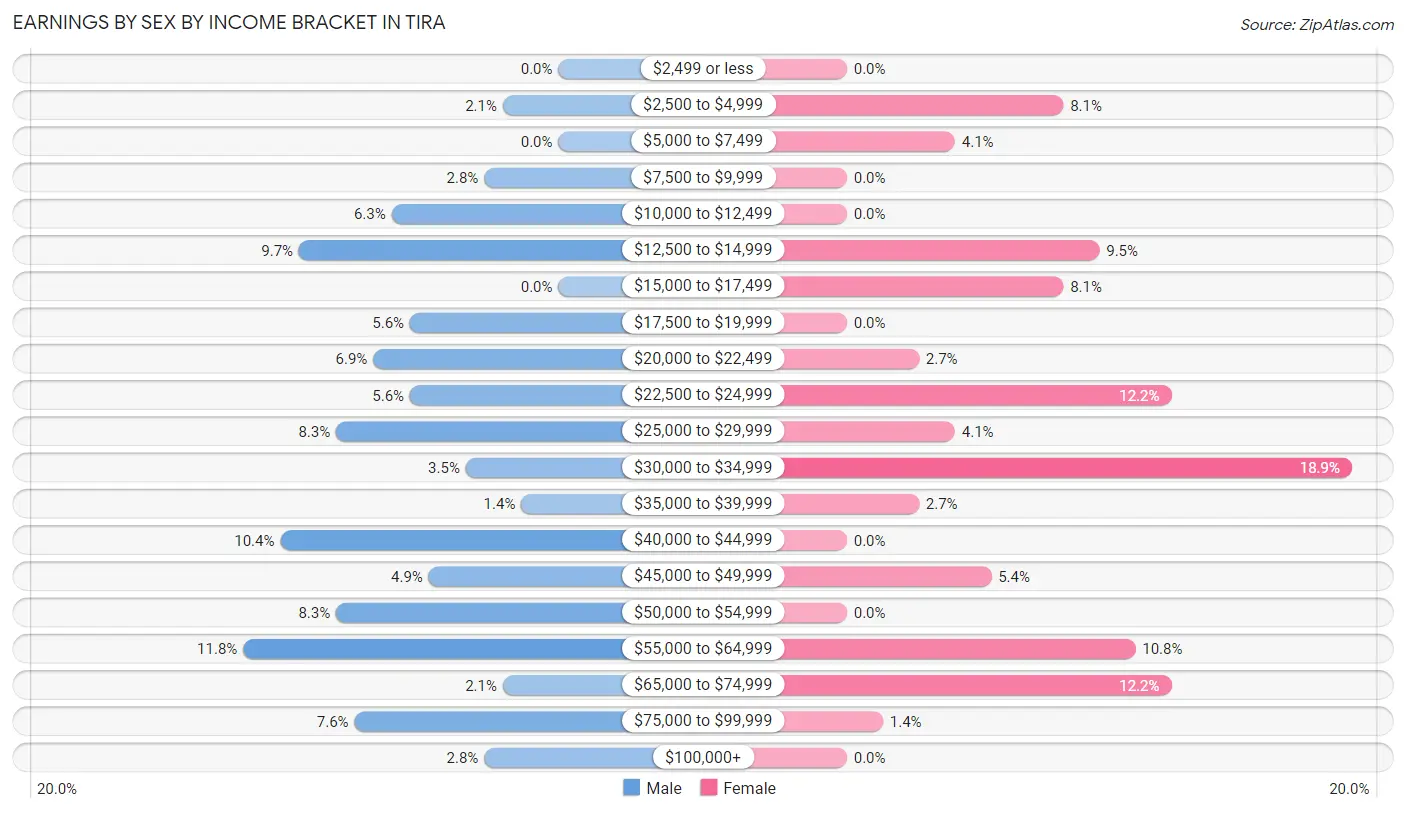
Earnings by Sex by Income Bracket in Tira
The most common earnings brackets in Tira are $55,000 to $64,999 for men (17 | 11.8%) and $30,000 to $34,999 for women (14 | 18.9%).
| Income | Male | Female |
| $2,499 or less | 0 (0.0%) | 0 (0.0%) |
| $2,500 to $4,999 | 3 (2.1%) | 6 (8.1%) |
| $5,000 to $7,499 | 0 (0.0%) | 3 (4.1%) |
| $7,500 to $9,999 | 4 (2.8%) | 0 (0.0%) |
| $10,000 to $12,499 | 9 (6.2%) | 0 (0.0%) |
| $12,500 to $14,999 | 14 (9.7%) | 7 (9.5%) |
| $15,000 to $17,499 | 0 (0.0%) | 6 (8.1%) |
| $17,500 to $19,999 | 8 (5.6%) | 0 (0.0%) |
| $20,000 to $22,499 | 10 (6.9%) | 2 (2.7%) |
| $22,500 to $24,999 | 8 (5.6%) | 9 (12.2%) |
| $25,000 to $29,999 | 12 (8.3%) | 3 (4.1%) |
| $30,000 to $34,999 | 5 (3.5%) | 14 (18.9%) |
| $35,000 to $39,999 | 2 (1.4%) | 2 (2.7%) |
| $40,000 to $44,999 | 15 (10.4%) | 0 (0.0%) |
| $45,000 to $49,999 | 7 (4.9%) | 4 (5.4%) |
| $50,000 to $54,999 | 12 (8.3%) | 0 (0.0%) |
| $55,000 to $64,999 | 17 (11.8%) | 8 (10.8%) |
| $65,000 to $74,999 | 3 (2.1%) | 9 (12.2%) |
| $75,000 to $99,999 | 11 (7.6%) | 1 (1.3%) |
| $100,000+ | 4 (2.8%) | 0 (0.0%) |
| Total | 144 (100.0%) | 74 (100.0%) |
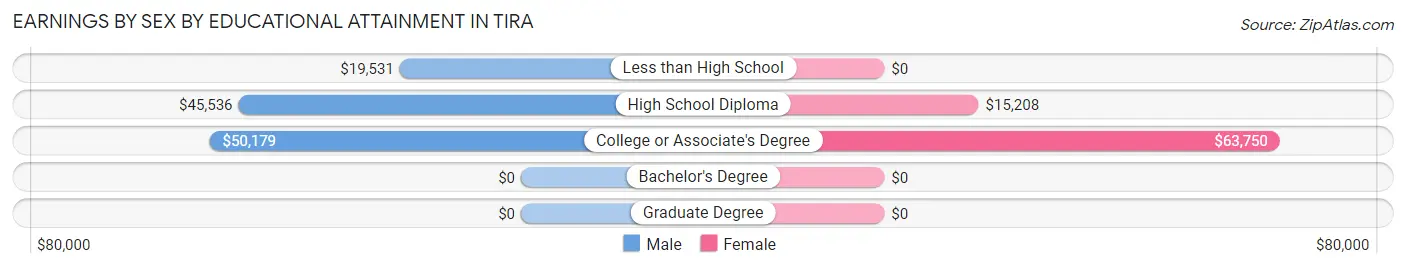
Earnings by Sex by Educational Attainment in Tira
Average earnings in Tira are $41,250 for men and $30,455 for women, a difference of 26.2%. Men with an educational attainment of college or associate's degree enjoy the highest average annual earnings of $50,179, while those with less than high school education earn the least with $19,531. Women with an educational attainment of college or associate's degree earn the most with the average annual earnings of $63,750, while those with high school diploma education have the smallest earnings of $15,208.
| Educational Attainment | Male Income | Female Income |
| Less than High School | $19,531 | $0 |
| High School Diploma | $45,536 | $15,208 |
| College or Associate's Degree | $50,179 | $63,750 |
| Bachelor's Degree | - | - |
| Graduate Degree | - | - |
| Total | $41,250 | $30,455 |
Family Income in Tira
Family Income Brackets in Tira
According to the Tira family income data, there are 21 families falling into the $35,000 to $49,999 income range, which is the most common income bracket and makes up 20.6% of all families.
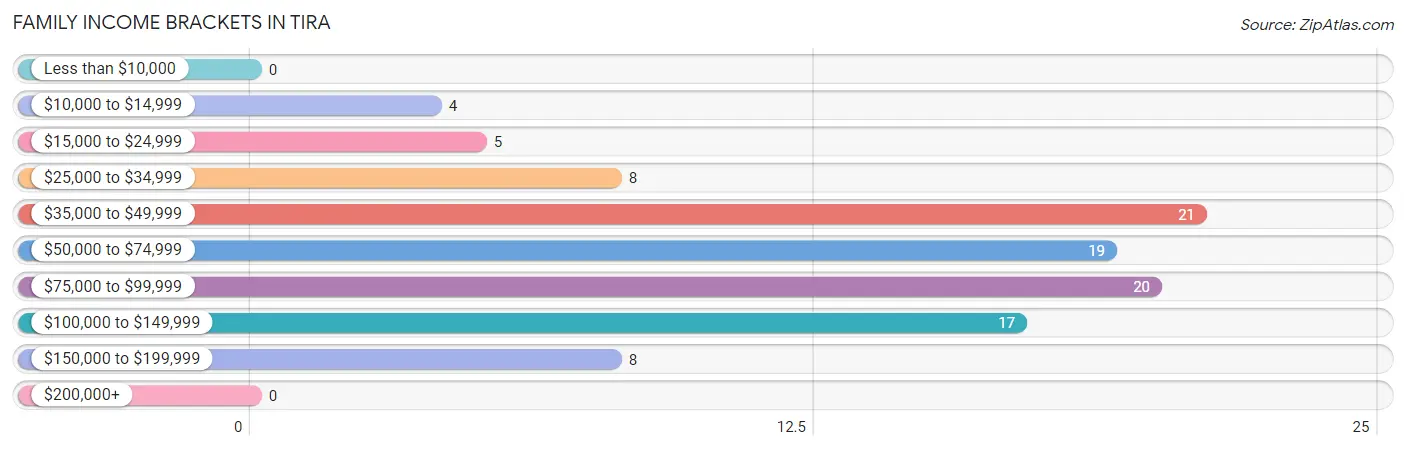
| Income Bracket | # Families | % Families |
| Less than $10,000 | 0 | 0.0% |
| $10,000 to $14,999 | 4 | 3.9% |
| $15,000 to $24,999 | 5 | 4.9% |
| $25,000 to $34,999 | 8 | 7.8% |
| $35,000 to $49,999 | 21 | 20.6% |
| $50,000 to $74,999 | 19 | 18.6% |
| $75,000 to $99,999 | 20 | 19.6% |
| $100,000 to $149,999 | 17 | 16.7% |
| $150,000 to $199,999 | 8 | 7.8% |
| $200,000+ | 0 | 0.0% |
Family Income by Famaliy Size in Tira
3-person families (14 | 13.7%) account for the highest median family income in Tira with $91,250 per family, while 2-person families (34 | 33.3%) have the highest median income of $41,875 per family member.
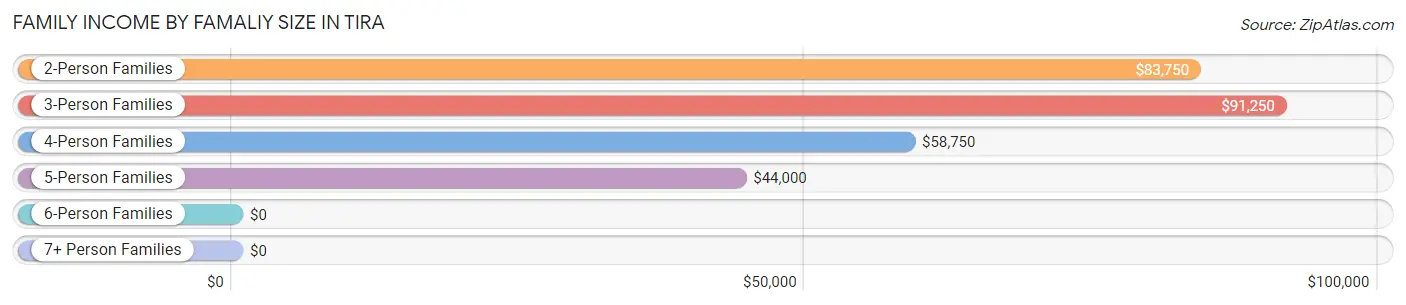
| Income Bracket | # Families | Median Income |
| 2-Person Families | 34 (33.3%) | $83,750 |
| 3-Person Families | 14 (13.7%) | $91,250 |
| 4-Person Families | 28 (27.5%) | $58,750 |
| 5-Person Families | 14 (13.7%) | $44,000 |
| 6-Person Families | 7 (6.9%) | $0 |
| 7+ Person Families | 5 (4.9%) | $0 |
| Total | 102 (100.0%) | $71,000 |
Family Income by Number of Earners in Tira
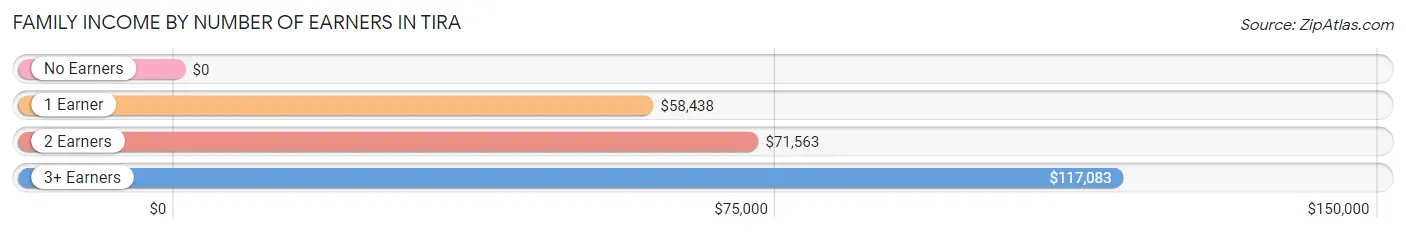
| Number of Earners | # Families | Median Income |
| No Earners | 7 (6.9%) | $0 |
| 1 Earner | 43 (42.2%) | $58,438 |
| 2 Earners | 35 (34.3%) | $71,563 |
| 3+ Earners | 17 (16.7%) | $117,083 |
| Total | 102 (100.0%) | $71,000 |
Household Income in Tira
Household Income Brackets in Tira
With 26 households falling in the category, the $35,000 to $49,999 income range is the most frequent in Tira, accounting for 19.0% of all households. In contrast, only 2 households (1.5%) fall into the less than $10,000 income bracket, making it the least populous group.
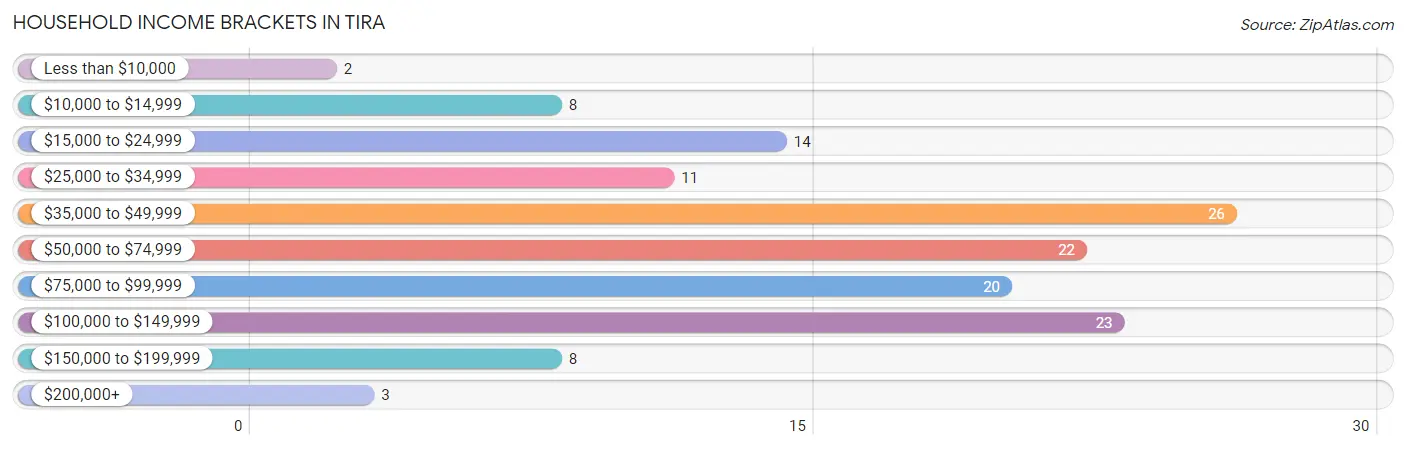
| Income Bracket | # Households | % Households |
| Less than $10,000 | 2 | 1.5% |
| $10,000 to $14,999 | 8 | 5.8% |
| $15,000 to $24,999 | 14 | 10.2% |
| $25,000 to $34,999 | 11 | 8.0% |
| $35,000 to $49,999 | 26 | 19.0% |
| $50,000 to $74,999 | 22 | 16.1% |
| $75,000 to $99,999 | 20 | 14.6% |
| $100,000 to $149,999 | 23 | 16.8% |
| $150,000 to $199,999 | 8 | 5.8% |
| $200,000+ | 3 | 2.2% |
Household Income by Householder Age in Tira
The median household income in Tira is $58,906, with the highest median household income of $90,000 found in the 45 to 64 years age bracket for the primary householder. A total of 30 households (21.9%) fall into this category. Meanwhile, the 15 to 24 years age bracket for the primary householder has the lowest median household income of $0, with 4 households (2.9%) in this group.
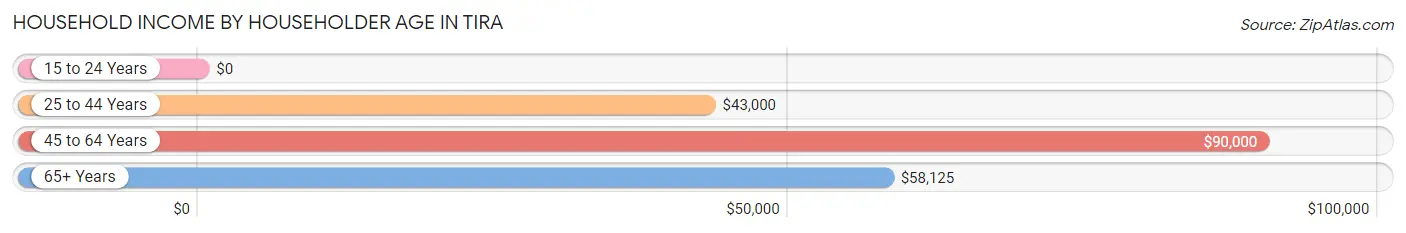
| Income Bracket | # Households | Median Income |
| 15 to 24 Years | 4 (2.9%) | $0 |
| 25 to 44 Years | 56 (40.9%) | $43,000 |
| 45 to 64 Years | 30 (21.9%) | $90,000 |
| 65+ Years | 47 (34.3%) | $58,125 |
| Total | 137 (100.0%) | $58,906 |
Poverty in Tira
Income Below Poverty by Sex and Age in Tira
With 9.9% poverty level for males and 21.9% for females among the residents of Tira, under 5 year old males and 12 to 14 year old females are the most vulnerable to poverty, with 6 males (100.0%) and 12 females (66.7%) in their respective age groups living below the poverty level.
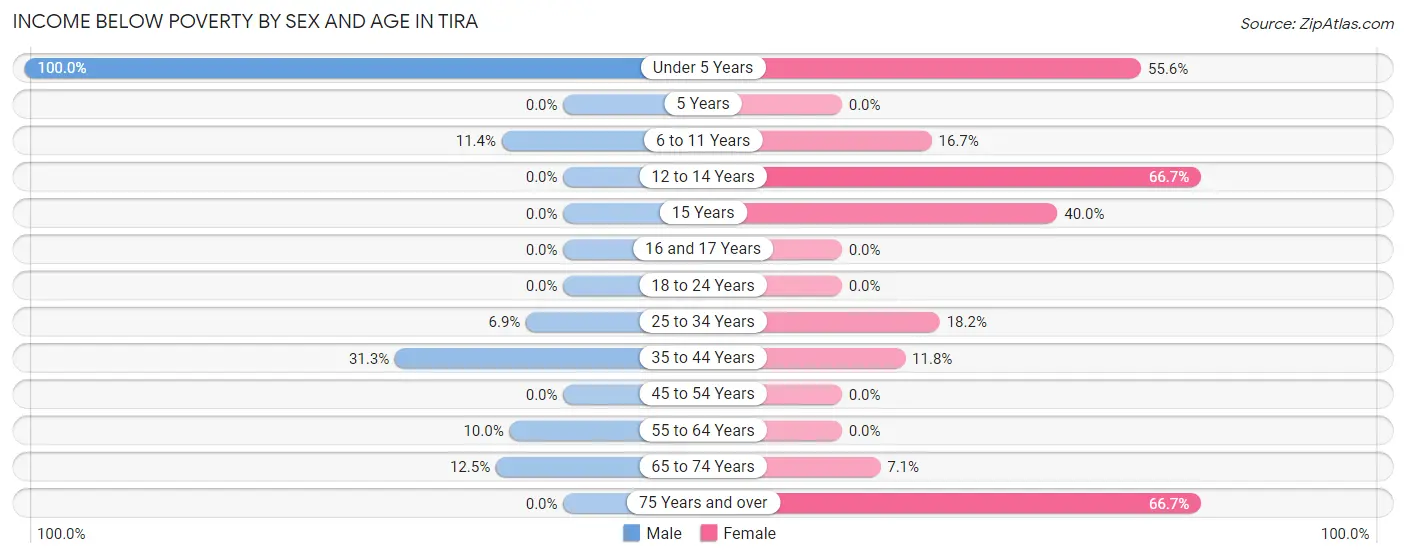
| Age Bracket | Male | Female |
| Under 5 Years | 6 (100.0%) | 5 (55.6%) |
| 5 Years | 0 (0.0%) | 0 (0.0%) |
| 6 to 11 Years | 4 (11.4%) | 4 (16.7%) |
| 12 to 14 Years | 0 (0.0%) | 12 (66.7%) |
| 15 Years | 0 (0.0%) | 4 (40.0%) |
| 16 and 17 Years | 0 (0.0%) | 0 (0.0%) |
| 18 to 24 Years | 0 (0.0%) | 0 (0.0%) |
| 25 to 34 Years | 4 (6.9%) | 4 (18.2%) |
| 35 to 44 Years | 5 (31.2%) | 4 (11.8%) |
| 45 to 54 Years | 0 (0.0%) | 0 (0.0%) |
| 55 to 64 Years | 2 (10.0%) | 0 (0.0%) |
| 65 to 74 Years | 4 (12.5%) | 2 (7.1%) |
| 75 Years and over | 0 (0.0%) | 6 (66.7%) |
| Total | 25 (9.9%) | 41 (21.9%) |
Income Above Poverty by Sex and Age in Tira
According to the poverty statistics in Tira, males aged 5 years and females aged 16 and 17 years are the age groups that are most secure financially, with 100.0% of males and 100.0% of females in these age groups living above the poverty line.
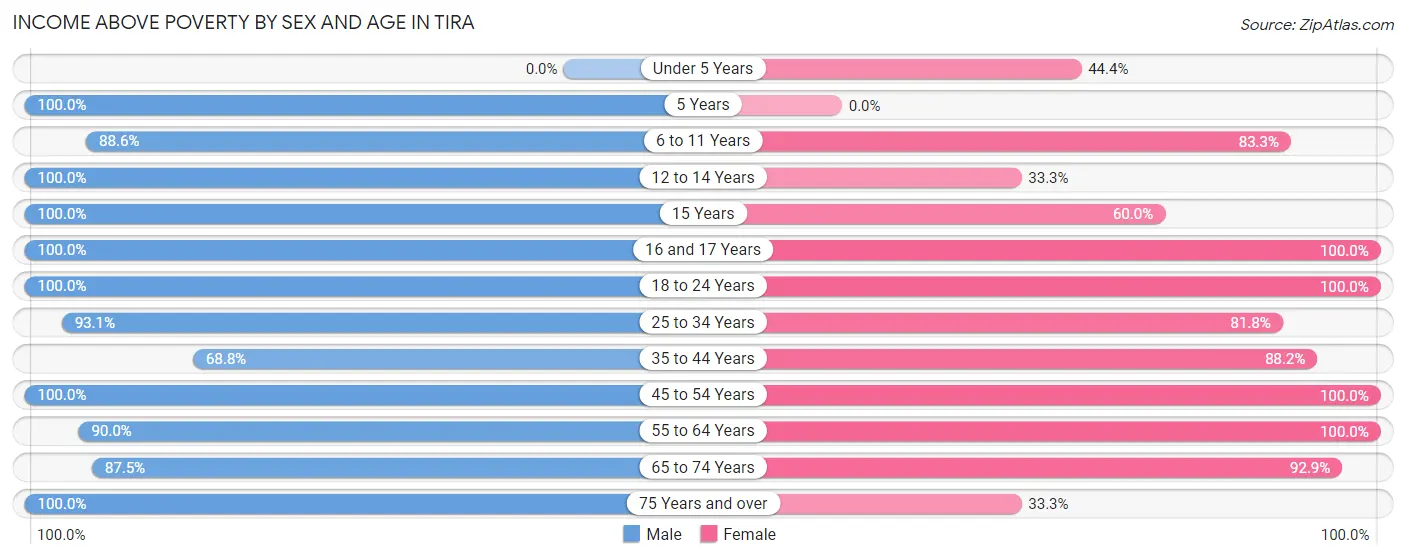
| Age Bracket | Male | Female |
| Under 5 Years | 0 (0.0%) | 4 (44.4%) |
| 5 Years | 5 (100.0%) | 0 (0.0%) |
| 6 to 11 Years | 31 (88.6%) | 20 (83.3%) |
| 12 to 14 Years | 9 (100.0%) | 6 (33.3%) |
| 15 Years | 12 (100.0%) | 6 (60.0%) |
| 16 and 17 Years | 4 (100.0%) | 8 (100.0%) |
| 18 to 24 Years | 18 (100.0%) | 7 (100.0%) |
| 25 to 34 Years | 54 (93.1%) | 18 (81.8%) |
| 35 to 44 Years | 11 (68.8%) | 30 (88.2%) |
| 45 to 54 Years | 31 (100.0%) | 12 (100.0%) |
| 55 to 64 Years | 18 (90.0%) | 6 (100.0%) |
| 65 to 74 Years | 28 (87.5%) | 26 (92.9%) |
| 75 Years and over | 7 (100.0%) | 3 (33.3%) |
| Total | 228 (90.1%) | 146 (78.1%) |
Income Below Poverty Among Married-Couple Families in Tira
The poverty statistics for married-couple families in Tira show that 6.0% or 4 of the total 67 families live below the poverty line. Families with 3 or 4 children have the highest poverty rate of 25.0%, comprising of 4 families. On the other hand, families with no children have the lowest poverty rate of 0.0%, which includes 0 families.
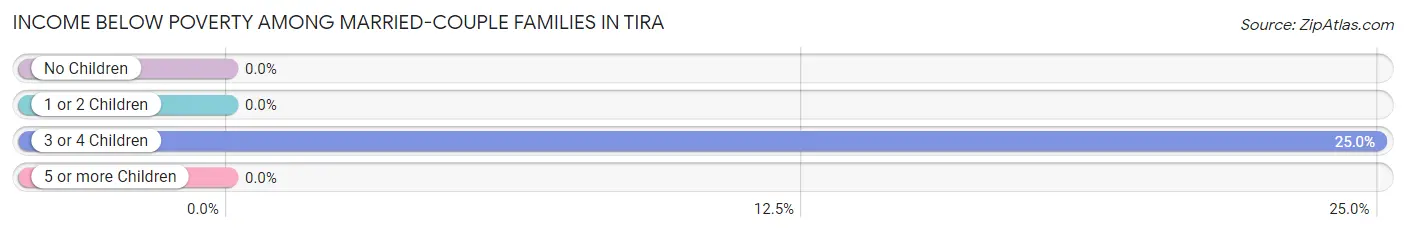
| Children | Above Poverty | Below Poverty |
| No Children | 26 (100.0%) | 0 (0.0%) |
| 1 or 2 Children | 25 (100.0%) | 0 (0.0%) |
| 3 or 4 Children | 12 (75.0%) | 4 (25.0%) |
| 5 or more Children | 0 (0.0%) | 0 (0.0%) |
| Total | 63 (94.0%) | 4 (6.0%) |
Income Below Poverty Among Single-Parent Households in Tira
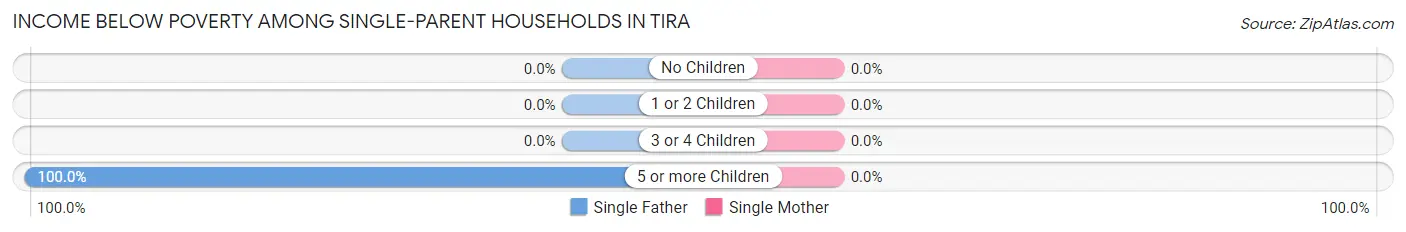
| Children | Single Father | Single Mother |
| No Children | 0 (0.0%) | 0 (0.0%) |
| 1 or 2 Children | 0 (0.0%) | 0 (0.0%) |
| 3 or 4 Children | 0 (0.0%) | 0 (0.0%) |
| 5 or more Children | 5 (100.0%) | 0 (0.0%) |
| Total | 5 (38.5%) | 0 (0.0%) |
Income Below Poverty Among Married-Couple vs Single-Parent Households in Tira
The poverty data for Tira shows that 4 of the married-couple family households (6.0%) and 5 of the single-parent households (14.3%) are living below the poverty level. Within the married-couple family households, those with 3 or 4 children have the highest poverty rate, with 4 households (25.0%) falling below the poverty line. Among the single-parent households, those with 5 or more children have the highest poverty rate, with 5 household (100.0%) living below poverty.
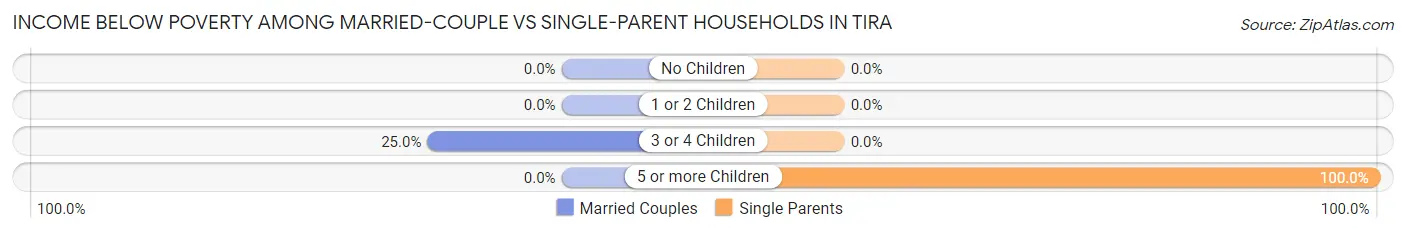
| Children | Married-Couple Families | Single-Parent Households |
| No Children | 0 (0.0%) | 0 (0.0%) |
| 1 or 2 Children | 0 (0.0%) | 0 (0.0%) |
| 3 or 4 Children | 4 (25.0%) | 0 (0.0%) |
| 5 or more Children | 0 (0.0%) | 5 (100.0%) |
| Total | 4 (6.0%) | 5 (14.3%) |
Race in Tira
The most populous races in Tira are White / Caucasian (382 | 86.8%), Hispanic or Latino (47 | 10.7%), and Black / African American (38 | 8.6%).
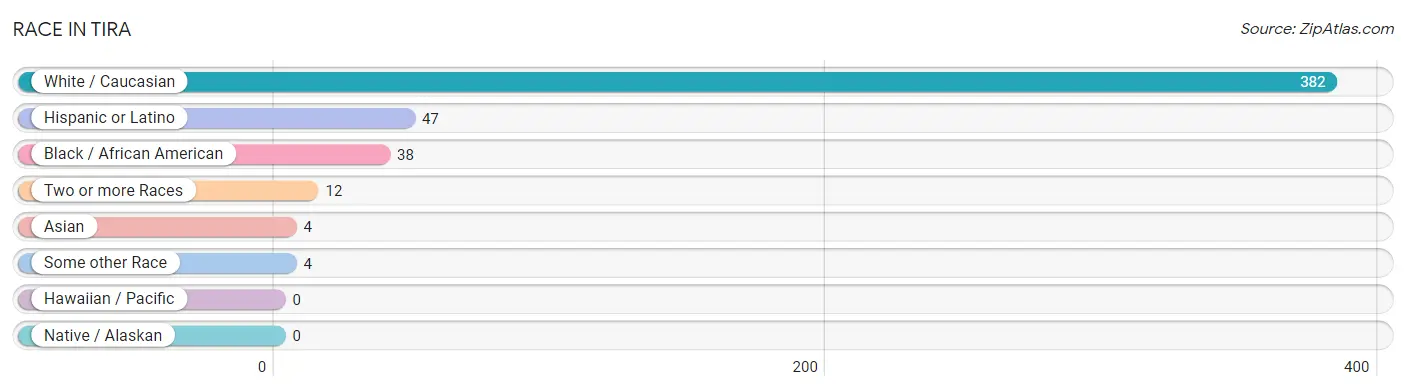
| Race | # Population | % Population |
| Asian | 4 | 0.9% |
| Black / African American | 38 | 8.6% |
| Hawaiian / Pacific | 0 | 0.0% |
| Hispanic or Latino | 47 | 10.7% |
| Native / Alaskan | 0 | 0.0% |
| White / Caucasian | 382 | 86.8% |
| Two or more Races | 12 | 2.7% |
| Some other Race | 4 | 0.9% |
| Total | 440 | 100.0% |
Ancestry in Tira
The most populous ancestries reported in Tira are Mexican (41 | 9.3%), American (21 | 4.8%), Irish (16 | 3.6%), English (14 | 3.2%), and German (12 | 2.7%), together accounting for 23.6% of all Tira residents.
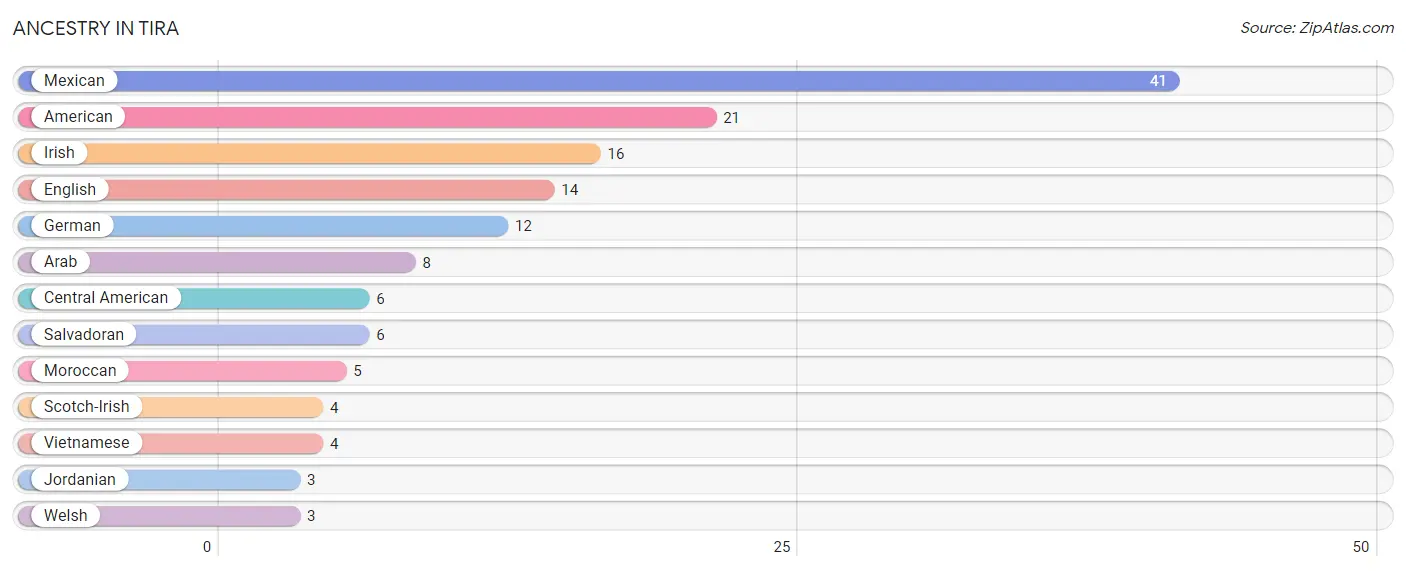
| Ancestry | # Population | % Population |
| American | 21 | 4.8% |
| Arab | 8 | 1.8% |
| Central American | 6 | 1.4% |
| English | 14 | 3.2% |
| German | 12 | 2.7% |
| Irish | 16 | 3.6% |
| Jordanian | 3 | 0.7% |
| Mexican | 41 | 9.3% |
| Moroccan | 5 | 1.1% |
| Salvadoran | 6 | 1.4% |
| Scotch-Irish | 4 | 0.9% |
| Vietnamese | 4 | 0.9% |
| Welsh | 3 | 0.7% | View All 13 Rows |
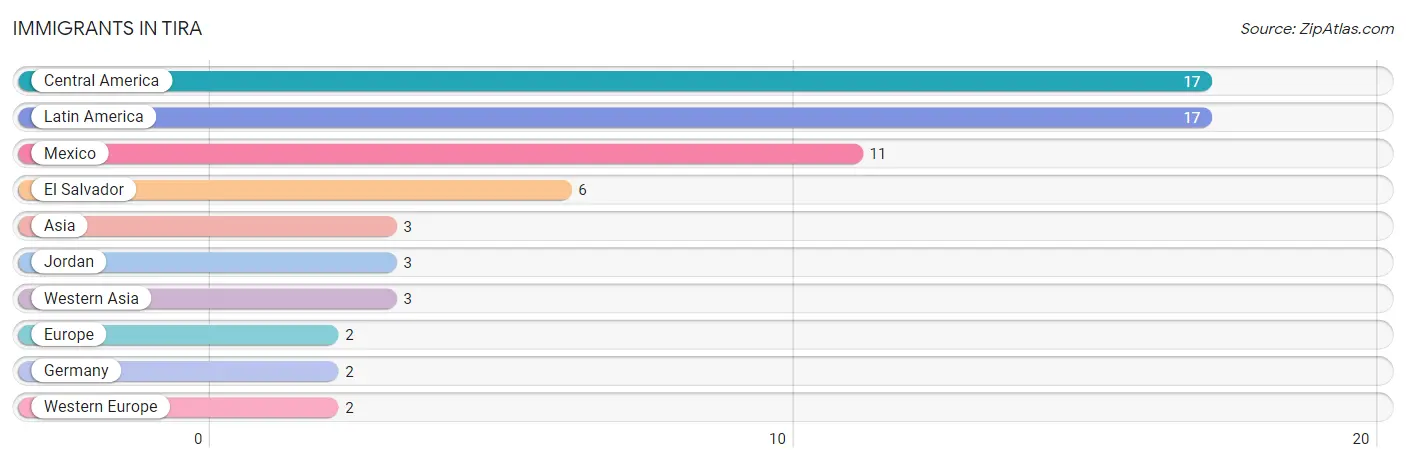
Immigrants in Tira
The most numerous immigrant groups reported in Tira came from Central America (17 | 3.9%), Latin America (17 | 3.9%), Mexico (11 | 2.5%), El Salvador (6 | 1.4%), and Asia (3 | 0.7%), together accounting for 12.3% of all Tira residents.
| Immigration Origin | # Population | % Population |
| Asia | 3 | 0.7% |
| Central America | 17 | 3.9% |
| El Salvador | 6 | 1.4% |
| Europe | 2 | 0.4% |
| Germany | 2 | 0.4% |
| Jordan | 3 | 0.7% |
| Latin America | 17 | 3.9% |
| Mexico | 11 | 2.5% |
| Western Asia | 3 | 0.7% |
| Western Europe | 2 | 0.4% | View All 10 Rows |
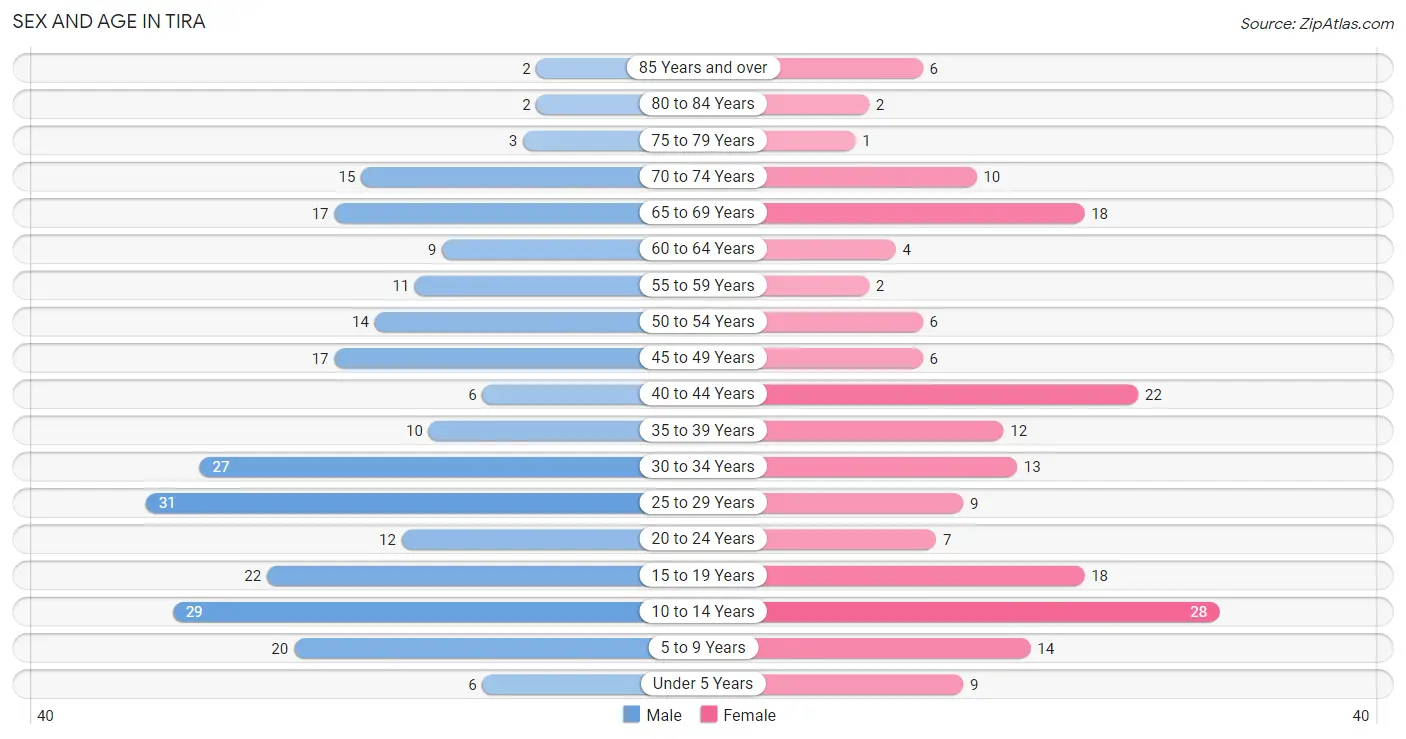
Sex and Age in Tira
Sex and Age in Tira
The most populous age groups in Tira are 25 to 29 Years (31 | 12.2%) for men and 10 to 14 Years (28 | 15.0%) for women.
| Age Bracket | Male | Female |
| Under 5 Years | 6 (2.4%) | 9 (4.8%) |
| 5 to 9 Years | 20 (7.9%) | 14 (7.5%) |
| 10 to 14 Years | 29 (11.5%) | 28 (15.0%) |
| 15 to 19 Years | 22 (8.7%) | 18 (9.6%) |
| 20 to 24 Years | 12 (4.7%) | 7 (3.7%) |
| 25 to 29 Years | 31 (12.2%) | 9 (4.8%) |
| 30 to 34 Years | 27 (10.7%) | 13 (7.0%) |
| 35 to 39 Years | 10 (4.0%) | 12 (6.4%) |
| 40 to 44 Years | 6 (2.4%) | 22 (11.8%) |
| 45 to 49 Years | 17 (6.7%) | 6 (3.2%) |
| 50 to 54 Years | 14 (5.5%) | 6 (3.2%) |
| 55 to 59 Years | 11 (4.3%) | 2 (1.1%) |
| 60 to 64 Years | 9 (3.6%) | 4 (2.1%) |
| 65 to 69 Years | 17 (6.7%) | 18 (9.6%) |
| 70 to 74 Years | 15 (5.9%) | 10 (5.3%) |
| 75 to 79 Years | 3 (1.2%) | 1 (0.5%) |
| 80 to 84 Years | 2 (0.8%) | 2 (1.1%) |
| 85 Years and over | 2 (0.8%) | 6 (3.2%) |
| Total | 253 (100.0%) | 187 (100.0%) |
Families and Households in Tira
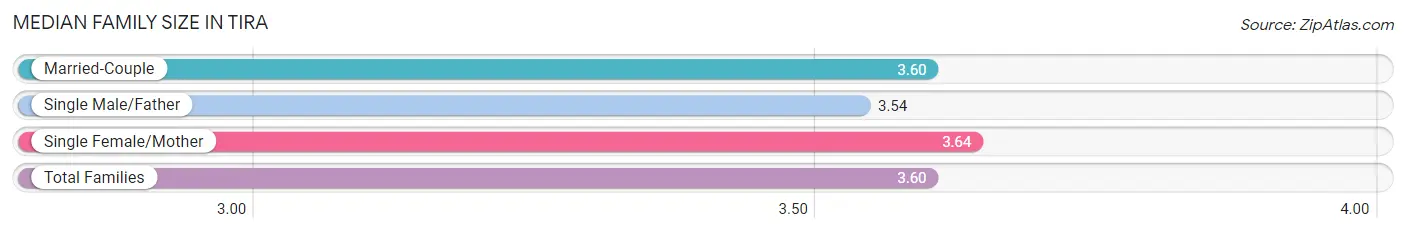
Median Family Size in Tira
The median family size in Tira is 3.60 persons per family, with single female/mother families (22 | 21.6%) accounting for the largest median family size of 3.64 persons per family. On the other hand, single male/father families (13 | 12.8%) represent the smallest median family size with 3.54 persons per family.
| Family Type | # Families | Family Size |
| Married-Couple | 67 (65.7%) | 3.60 |
| Single Male/Father | 13 (12.8%) | 3.54 |
| Single Female/Mother | 22 (21.6%) | 3.64 |
| Total Families | 102 (100.0%) | 3.60 |
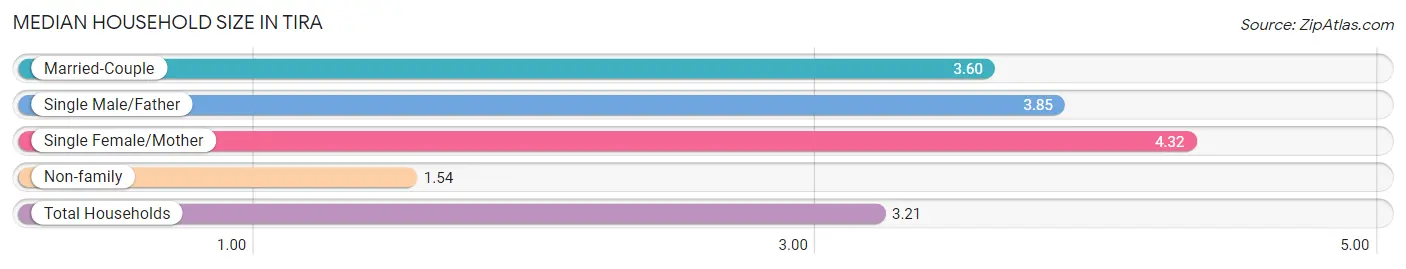
Median Household Size in Tira
The median household size in Tira is 3.21 persons per household, with single female/mother households (22 | 16.1%) accounting for the largest median household size of 4.32 persons per household. non-family households (35 | 25.6%) represent the smallest median household size with 1.54 persons per household.
| Household Type | # Households | Household Size |
| Married-Couple | 67 (48.9%) | 3.60 |
| Single Male/Father | 13 (9.5%) | 3.85 |
| Single Female/Mother | 22 (16.1%) | 4.32 |
| Non-family | 35 (25.6%) | 1.54 |
| Total Households | 137 (100.0%) | 3.21 |
Household Size by Marriage Status in Tira
Out of a total of 137 households in Tira, 102 (74.5%) are family households, while 35 (25.6%) are nonfamily households. The most numerous type of family households are 2-person households, comprising 32, and the most common type of nonfamily households are 1-person households, comprising 32.
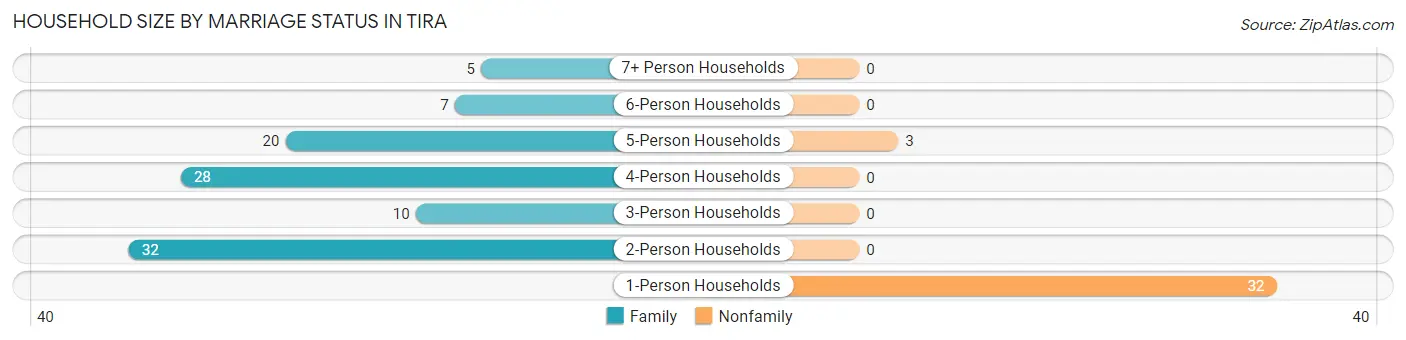
| Household Size | Family Households | Nonfamily Households |
| 1-Person Households | - | 32 (23.4%) |
| 2-Person Households | 32 (23.4%) | 0 (0.0%) |
| 3-Person Households | 10 (7.3%) | 0 (0.0%) |
| 4-Person Households | 28 (20.4%) | 0 (0.0%) |
| 5-Person Households | 20 (14.6%) | 3 (2.2%) |
| 6-Person Households | 7 (5.1%) | 0 (0.0%) |
| 7+ Person Households | 5 (3.6%) | 0 (0.0%) |
| Total | 102 (74.5%) | 35 (25.6%) |
Female Fertility in Tira
Fertility by Age in Tira
Average fertility rate in Tira is 44.0 births per 1,000 women. Women in the age bracket of 35 to 50 years have the highest fertility rate with 91.0 births per 1,000 women. Women in the age bracket of 35 to 50 years acount for 100.0% of all women with births.
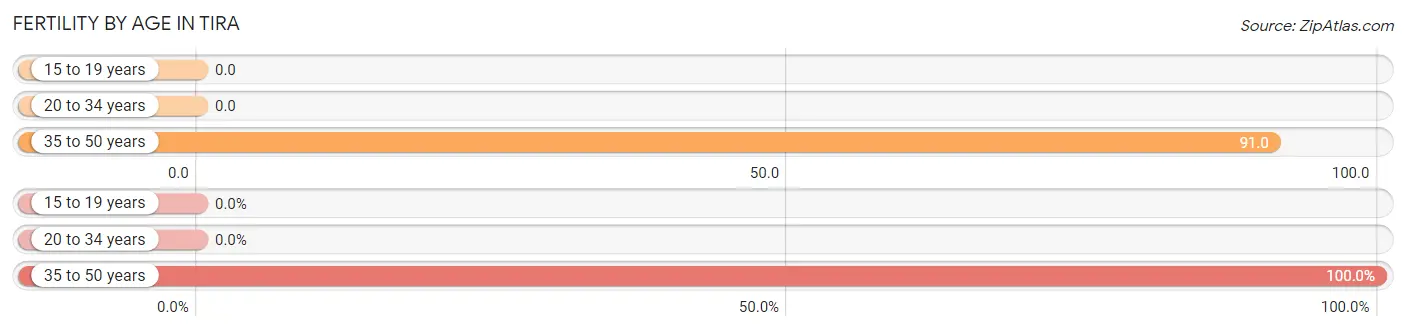
| Age Bracket | Women with Births | Births / 1,000 Women |
| 15 to 19 years | 0 (0.0%) | 0.0 |
| 20 to 34 years | 0 (0.0%) | 0.0 |
| 35 to 50 years | 4 (100.0%) | 91.0 |
| Total | 4 (100.0%) | 44.0 |
Fertility by Age by Marriage Status in Tira
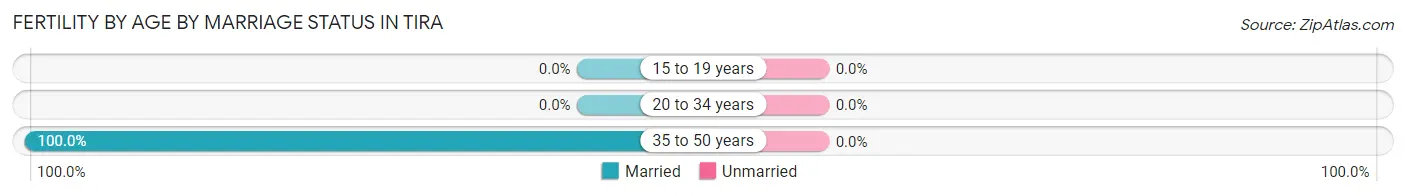
| Age Bracket | Married | Unmarried |
| 15 to 19 years | 0 (0.0%) | 0 (0.0%) |
| 20 to 34 years | 0 (0.0%) | 0 (0.0%) |
| 35 to 50 years | 4 (100.0%) | 0 (0.0%) |
| Total | 4 (100.0%) | 0 (0.0%) |
Fertility by Education in Tira
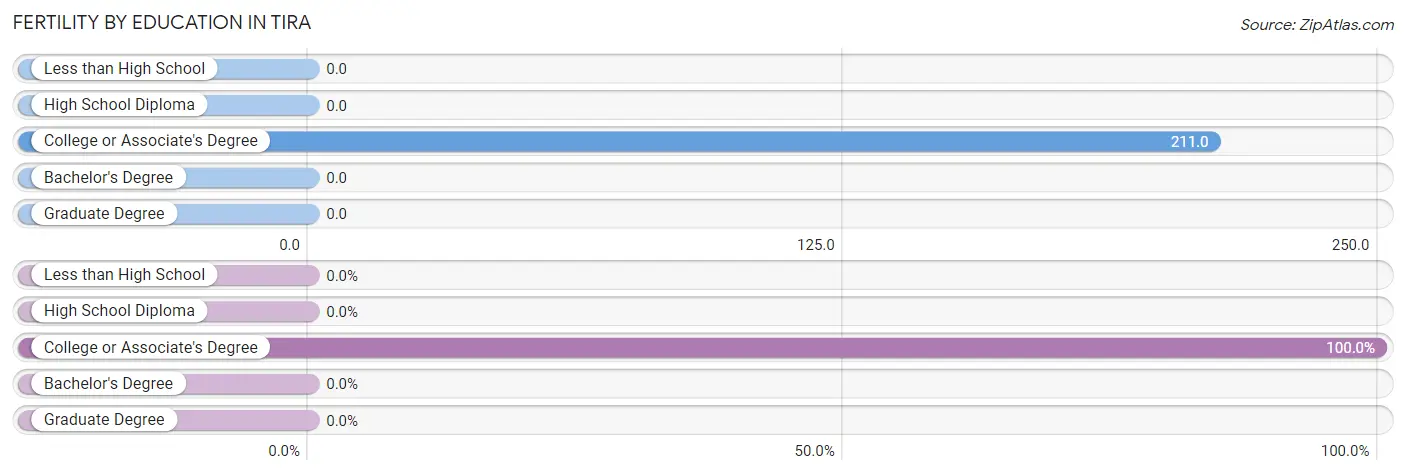
| Educational Attainment | Women with Births | Births / 1,000 Women |
| Less than High School | 0 (0.0%) | 0.0 |
| High School Diploma | 0 (0.0%) | 0.0 |
| College or Associate's Degree | 4 (100.0%) | 211.0 |
| Bachelor's Degree | 0 (0.0%) | 0.0 |
| Graduate Degree | 0 (0.0%) | 0.0 |
| Total | 4 (100.0%) | 44.0 |
Fertility by Education by Marriage Status in Tira
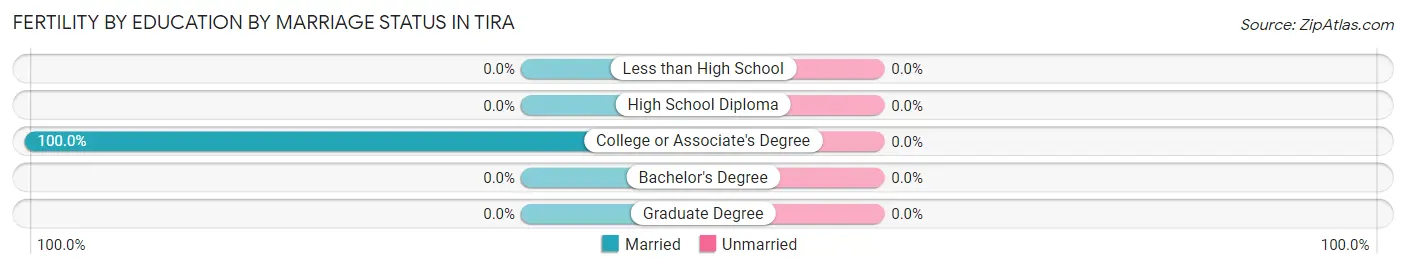
| Educational Attainment | Married | Unmarried |
| Less than High School | 0 (0.0%) | 0 (0.0%) |
| High School Diploma | 0 (0.0%) | 0 (0.0%) |
| College or Associate's Degree | 4 (100.0%) | 0 (0.0%) |
| Bachelor's Degree | 0 (0.0%) | 0 (0.0%) |
| Graduate Degree | 0 (0.0%) | 0 (0.0%) |
| Total | 4 (100.0%) | 0 (0.0%) |
Employment Characteristics in Tira
Employment by Class of Employer in Tira
Among the 195 employed individuals in Tira, private company employees (134 | 68.7%), self-employed (not incorporated) (21 | 10.8%), and local government employees (16 | 8.2%) make up the most common classes of employment.
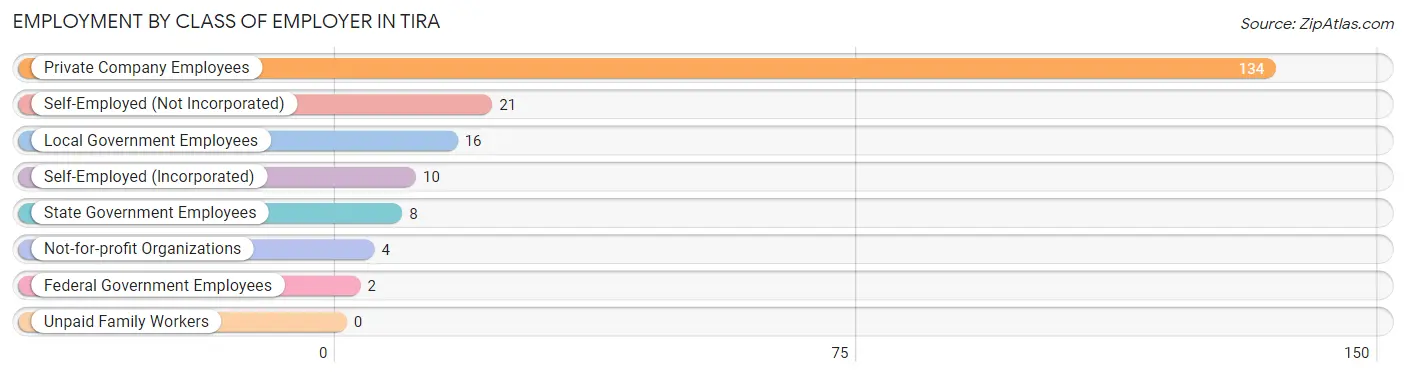
| Employer Class | # Employees | % Employees |
| Private Company Employees | 134 | 68.7% |
| Self-Employed (Incorporated) | 10 | 5.1% |
| Self-Employed (Not Incorporated) | 21 | 10.8% |
| Not-for-profit Organizations | 4 | 2.1% |
| Local Government Employees | 16 | 8.2% |
| State Government Employees | 8 | 4.1% |
| Federal Government Employees | 2 | 1.0% |
| Unpaid Family Workers | 0 | 0.0% |
| Total | 195 | 100.0% |
Employment Status by Age in Tira
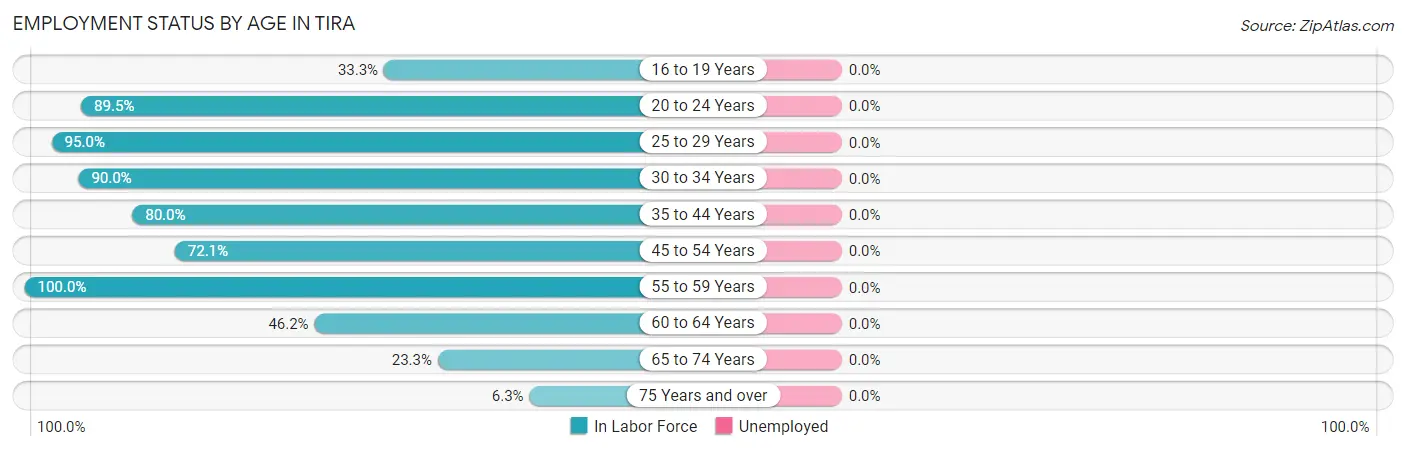
| Age Bracket | In Labor Force | Unemployed |
| 16 to 19 Years | 6 (33.3%) | 0 (0.0%) |
| 20 to 24 Years | 17 (89.5%) | 0 (0.0%) |
| 25 to 29 Years | 38 (95.0%) | 0 (0.0%) |
| 30 to 34 Years | 36 (90.0%) | 0 (0.0%) |
| 35 to 44 Years | 40 (80.0%) | 0 (0.0%) |
| 45 to 54 Years | 31 (72.1%) | 0 (0.0%) |
| 55 to 59 Years | 13 (100.0%) | 0 (0.0%) |
| 60 to 64 Years | 6 (46.2%) | 0 (0.0%) |
| 65 to 74 Years | 14 (23.3%) | 0 (0.0%) |
| 75 Years and over | 1 (6.3%) | 0 (0.0%) |
| Total | 202 (64.7%) | 0 (0.0%) |
Employment Status by Educational Attainment in Tira
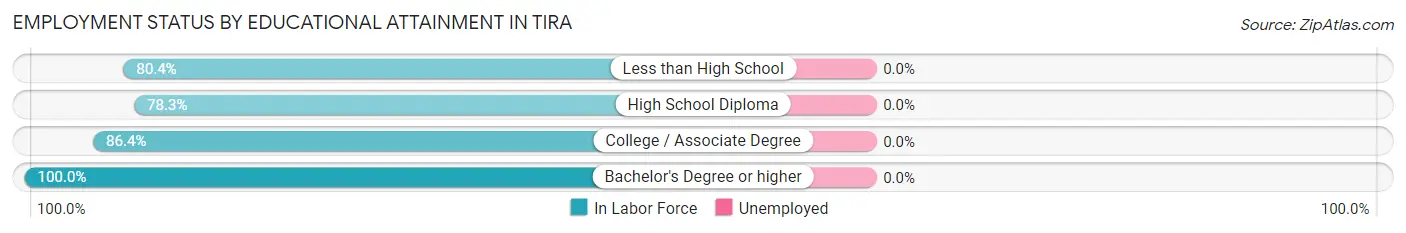
| Educational Attainment | In Labor Force | Unemployed |
| Less than High School | 37 (80.4%) | 0 (0.0%) |
| High School Diploma | 72 (78.3%) | 0 (0.0%) |
| College / Associate Degree | 38 (86.4%) | 0 (0.0%) |
| Bachelor's Degree or higher | 17 (100.0%) | 0 (0.0%) |
| Total | 164 (82.4%) | 0 (0.0%) |
Employment Occupations by Sex in Tira
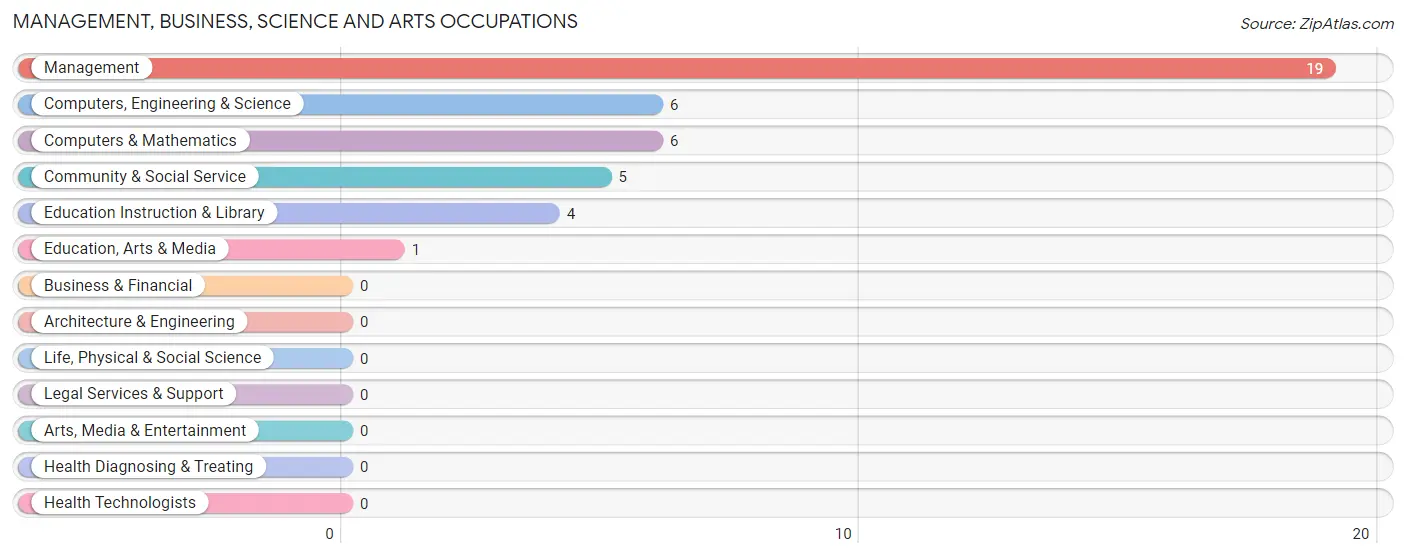
Management, Business, Science and Arts Occupations
The most common Management, Business, Science and Arts occupations in Tira are Management (19 | 9.4%), Computers, Engineering & Science (6 | 3.0%), Computers & Mathematics (6 | 3.0%), Community & Social Service (5 | 2.5%), and Education Instruction & Library (4 | 2.0%).
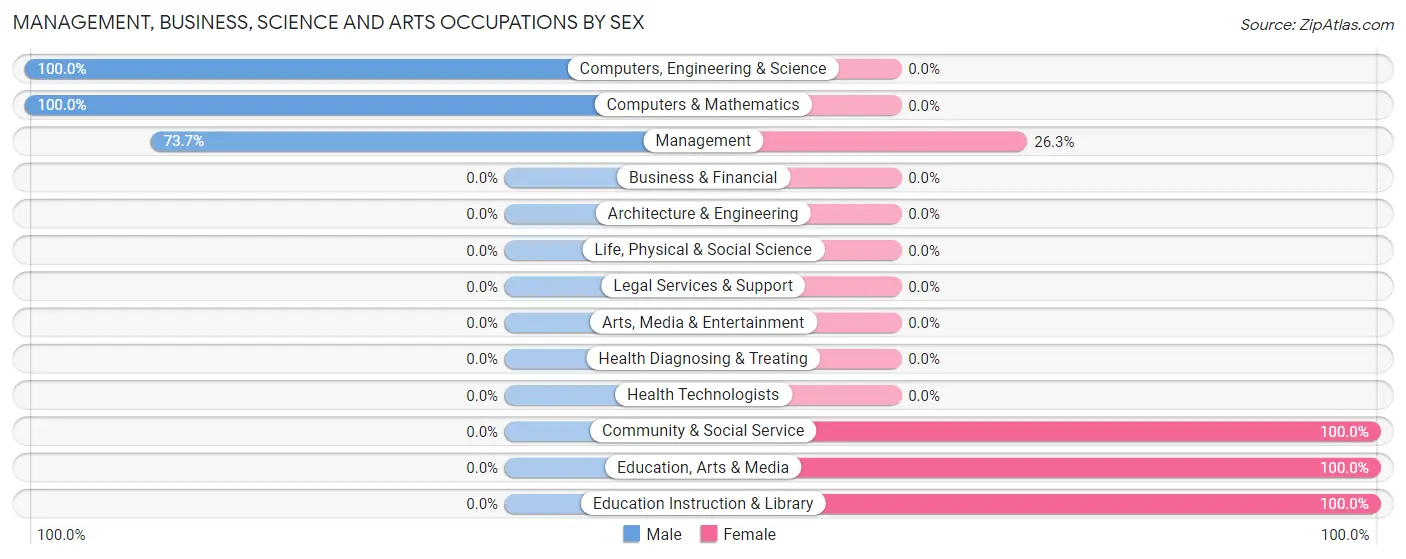
Management, Business, Science and Arts Occupations by Sex
Within the Management, Business, Science and Arts occupations in Tira, the most male-oriented occupations are Computers, Engineering & Science (100.0%), Computers & Mathematics (100.0%), and Management (73.7%), while the most female-oriented occupations are Community & Social Service (100.0%), Education, Arts & Media (100.0%), and Education Instruction & Library (100.0%).
| Occupation | Male | Female |
| Management | 14 (73.7%) | 5 (26.3%) |
| Business & Financial | 0 (0.0%) | 0 (0.0%) |
| Computers, Engineering & Science | 6 (100.0%) | 0 (0.0%) |
| Computers & Mathematics | 6 (100.0%) | 0 (0.0%) |
| Architecture & Engineering | 0 (0.0%) | 0 (0.0%) |
| Life, Physical & Social Science | 0 (0.0%) | 0 (0.0%) |
| Community & Social Service | 0 (0.0%) | 5 (100.0%) |
| Education, Arts & Media | 0 (0.0%) | 1 (100.0%) |
| Legal Services & Support | 0 (0.0%) | 0 (0.0%) |
| Education Instruction & Library | 0 (0.0%) | 4 (100.0%) |
| Arts, Media & Entertainment | 0 (0.0%) | 0 (0.0%) |
| Health Diagnosing & Treating | 0 (0.0%) | 0 (0.0%) |
| Health Technologists | 0 (0.0%) | 0 (0.0%) |
| Total (Category) | 20 (66.7%) | 10 (33.3%) |
| Total (Overall) | 134 (66.3%) | 68 (33.7%) |
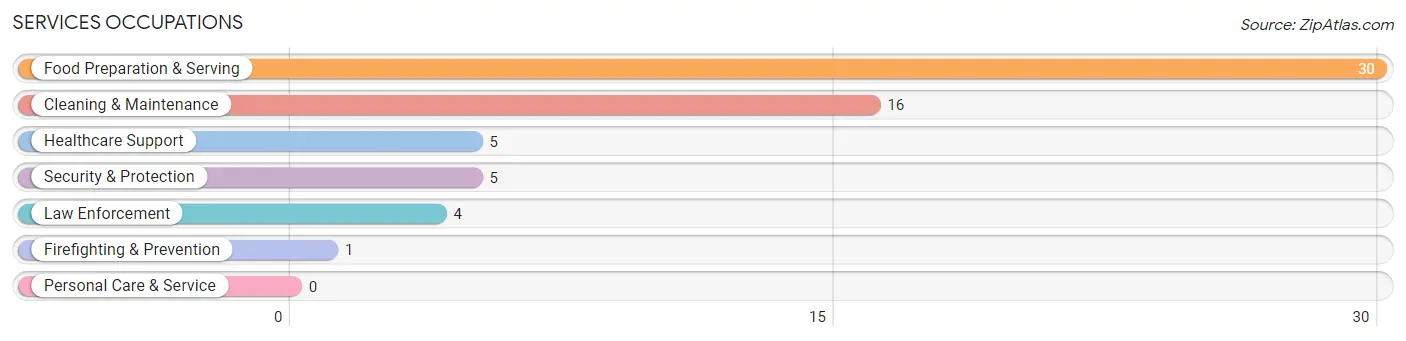
Services Occupations
The most common Services occupations in Tira are Food Preparation & Serving (30 | 14.8%), Cleaning & Maintenance (16 | 7.9%), Healthcare Support (5 | 2.5%), Security & Protection (5 | 2.5%), and Law Enforcement (4 | 2.0%).
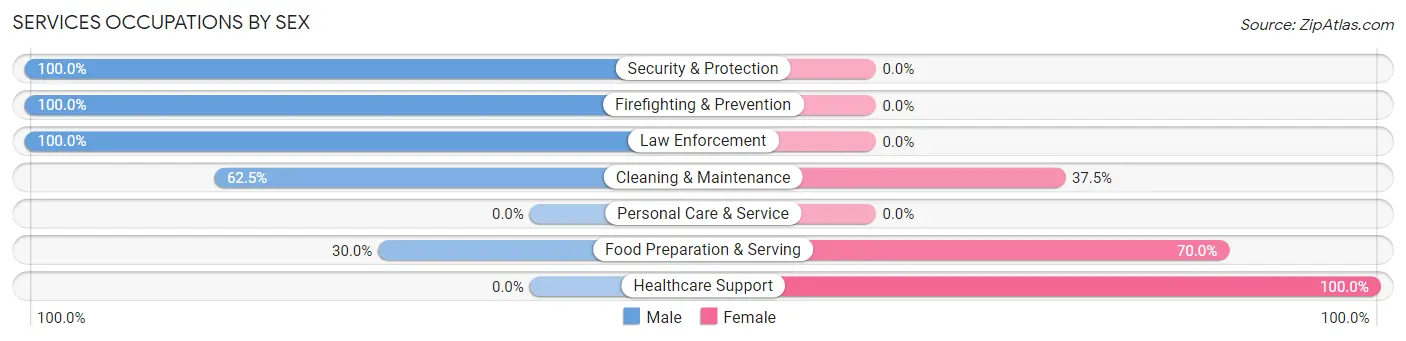
Services Occupations by Sex
Within the Services occupations in Tira, the most male-oriented occupations are Security & Protection (100.0%), Firefighting & Prevention (100.0%), and Law Enforcement (100.0%), while the most female-oriented occupations are Healthcare Support (100.0%), Food Preparation & Serving (70.0%), and Cleaning & Maintenance (37.5%).
| Occupation | Male | Female |
| Healthcare Support | 0 (0.0%) | 5 (100.0%) |
| Security & Protection | 5 (100.0%) | 0 (0.0%) |
| Firefighting & Prevention | 1 (100.0%) | 0 (0.0%) |
| Law Enforcement | 4 (100.0%) | 0 (0.0%) |
| Food Preparation & Serving | 9 (30.0%) | 21 (70.0%) |
| Cleaning & Maintenance | 10 (62.5%) | 6 (37.5%) |
| Personal Care & Service | 0 (0.0%) | 0 (0.0%) |
| Total (Category) | 24 (42.9%) | 32 (57.1%) |
| Total (Overall) | 134 (66.3%) | 68 (33.7%) |
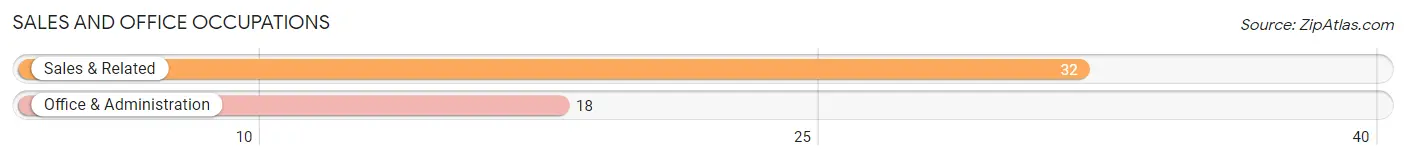
Sales and Office Occupations
The most common Sales and Office occupations in Tira are Sales & Related (32 | 15.8%), and Office & Administration (18 | 8.9%).
Sales and Office Occupations by Sex
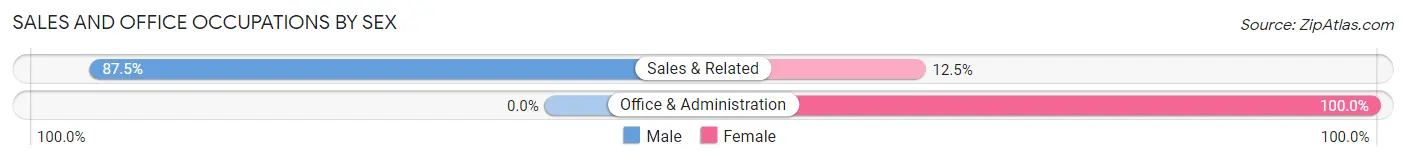
| Occupation | Male | Female |
| Sales & Related | 28 (87.5%) | 4 (12.5%) |
| Office & Administration | 0 (0.0%) | 18 (100.0%) |
| Total (Category) | 28 (56.0%) | 22 (44.0%) |
| Total (Overall) | 134 (66.3%) | 68 (33.7%) |
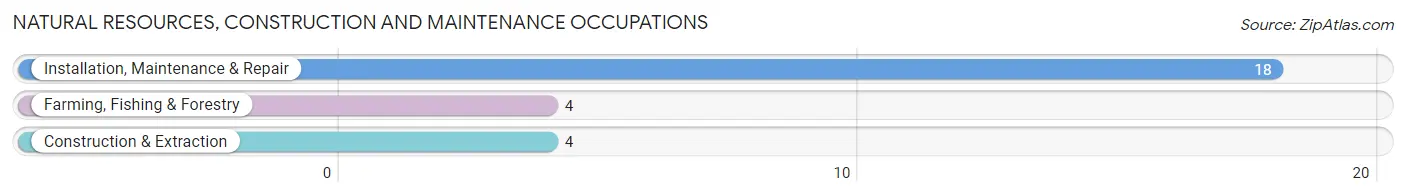
Natural Resources, Construction and Maintenance Occupations
The most common Natural Resources, Construction and Maintenance occupations in Tira are Installation, Maintenance & Repair (18 | 8.9%), Farming, Fishing & Forestry (4 | 2.0%), and Construction & Extraction (4 | 2.0%).
Natural Resources, Construction and Maintenance Occupations by Sex
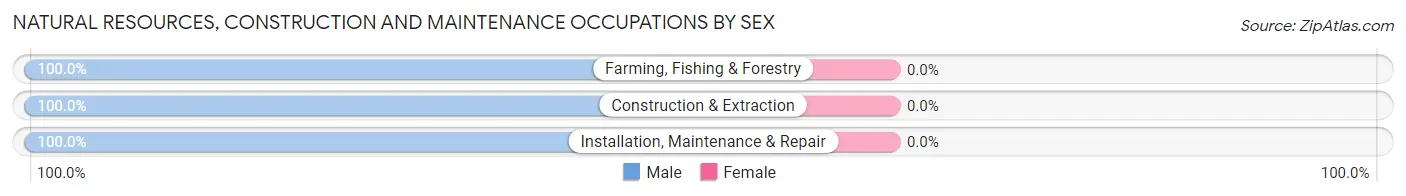
| Occupation | Male | Female |
| Farming, Fishing & Forestry | 4 (100.0%) | 0 (0.0%) |
| Construction & Extraction | 4 (100.0%) | 0 (0.0%) |
| Installation, Maintenance & Repair | 18 (100.0%) | 0 (0.0%) |
| Total (Category) | 26 (100.0%) | 0 (0.0%) |
| Total (Overall) | 134 (66.3%) | 68 (33.7%) |
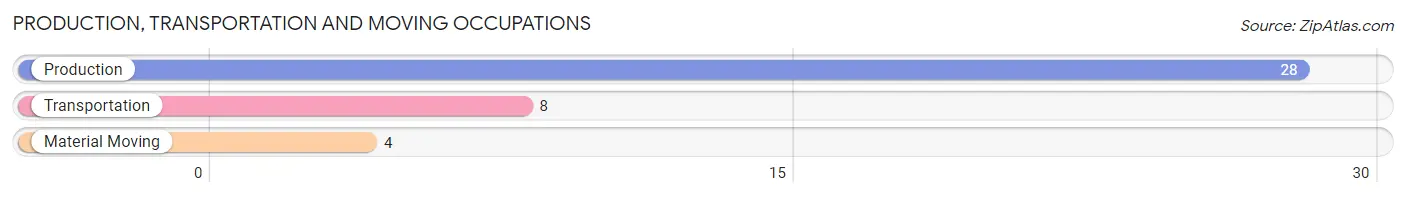
Production, Transportation and Moving Occupations
The most common Production, Transportation and Moving occupations in Tira are Production (28 | 13.9%), Transportation (8 | 4.0%), and Material Moving (4 | 2.0%).
Production, Transportation and Moving Occupations by Sex
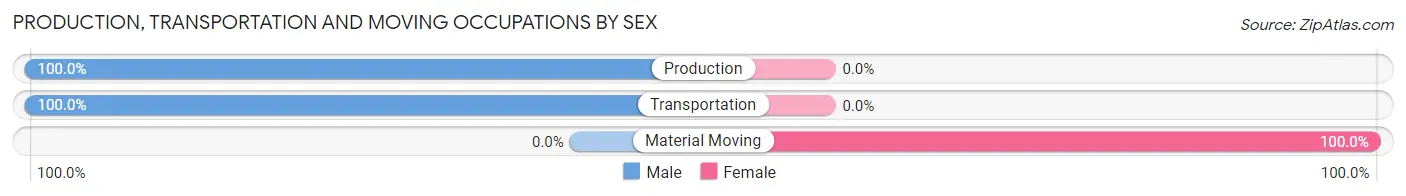
| Occupation | Male | Female |
| Production | 28 (100.0%) | 0 (0.0%) |
| Transportation | 8 (100.0%) | 0 (0.0%) |
| Material Moving | 0 (0.0%) | 4 (100.0%) |
| Total (Category) | 36 (90.0%) | 4 (10.0%) |
| Total (Overall) | 134 (66.3%) | 68 (33.7%) |
Employment Industries by Sex in Tira
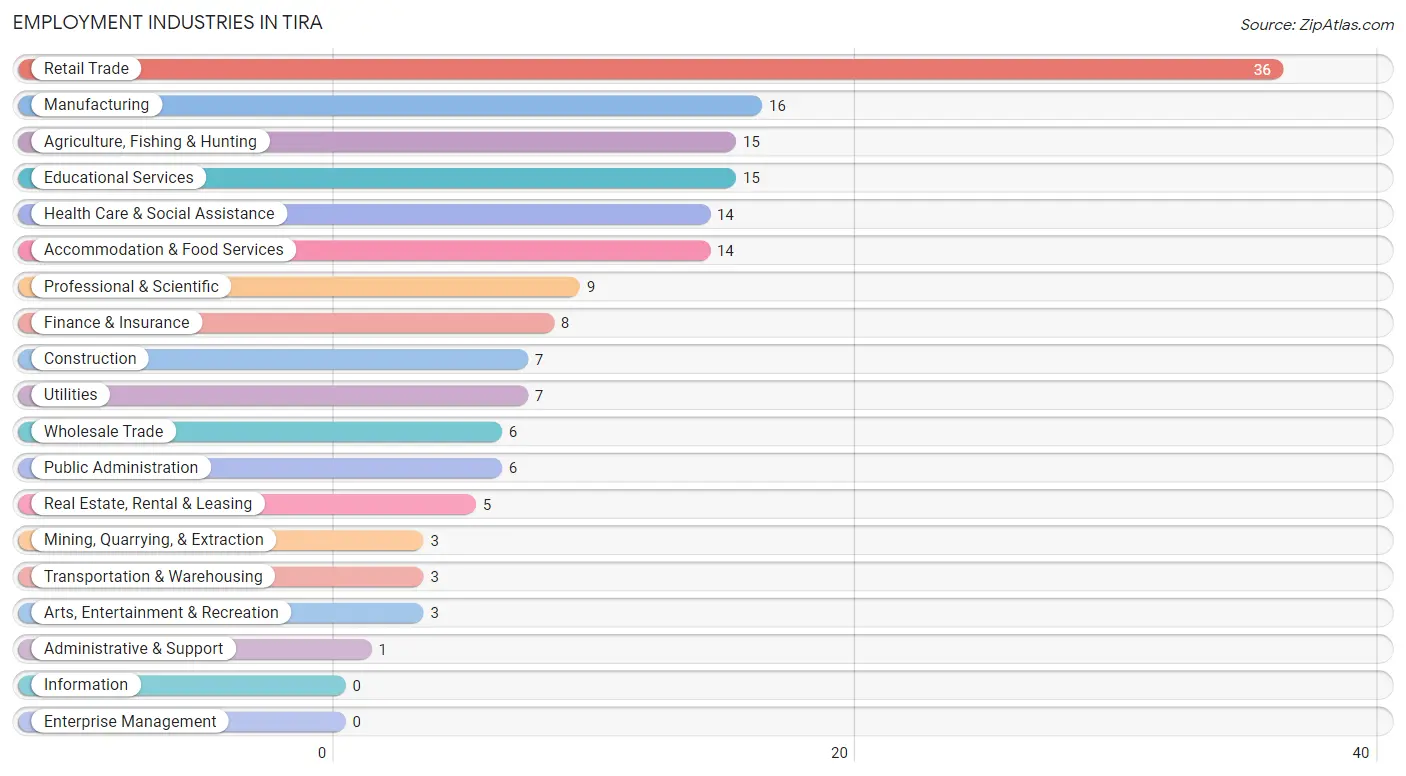
Employment Industries in Tira
The major employment industries in Tira include Retail Trade (36 | 17.8%), Manufacturing (16 | 7.9%), Agriculture, Fishing & Hunting (15 | 7.4%), Educational Services (15 | 7.4%), and Health Care & Social Assistance (14 | 6.9%).
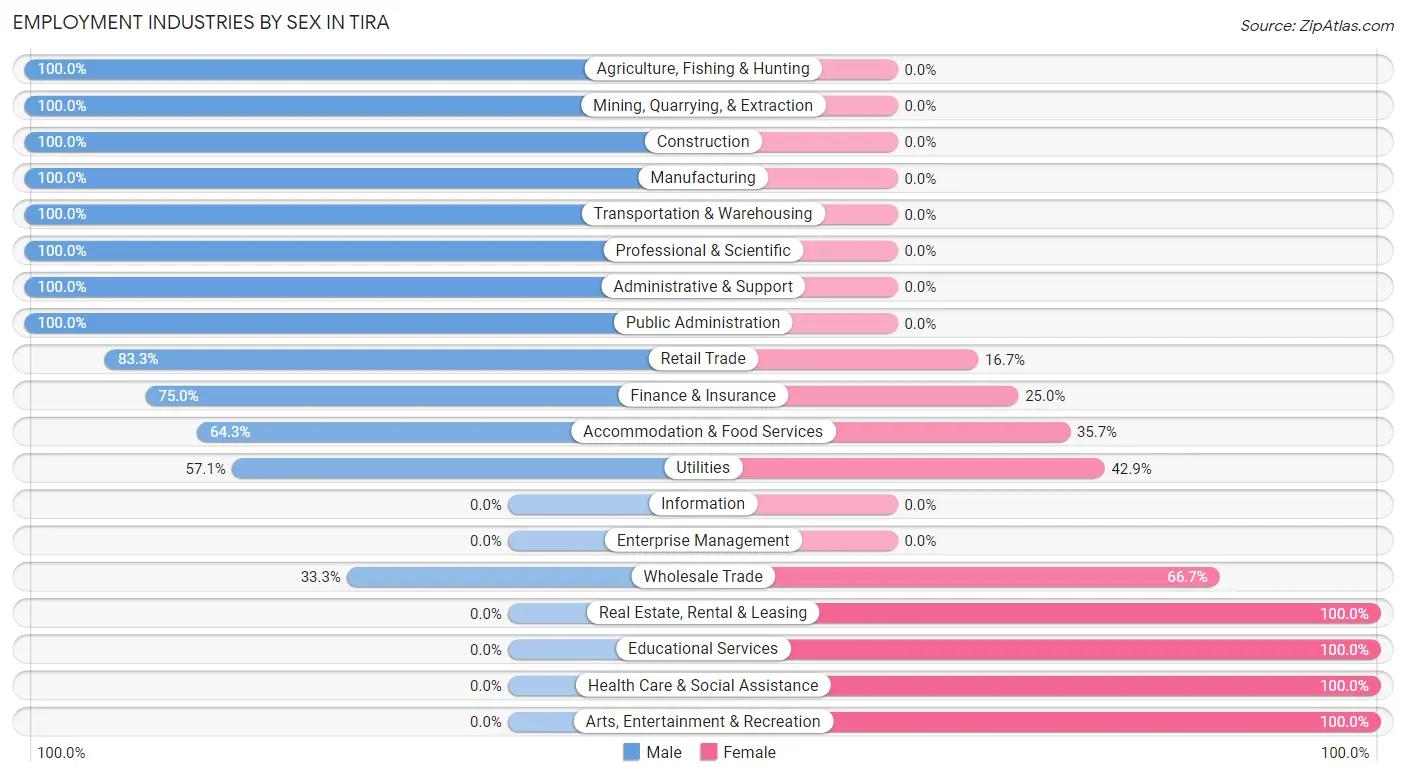
Employment Industries by Sex in Tira
The Tira industries that see more men than women are Agriculture, Fishing & Hunting (100.0%), Mining, Quarrying, & Extraction (100.0%), and Construction (100.0%), whereas the industries that tend to have a higher number of women are Real Estate, Rental & Leasing (100.0%), Educational Services (100.0%), and Health Care & Social Assistance (100.0%).
| Industry | Male | Female |
| Agriculture, Fishing & Hunting | 15 (100.0%) | 0 (0.0%) |
| Mining, Quarrying, & Extraction | 3 (100.0%) | 0 (0.0%) |
| Construction | 7 (100.0%) | 0 (0.0%) |
| Manufacturing | 16 (100.0%) | 0 (0.0%) |
| Wholesale Trade | 2 (33.3%) | 4 (66.7%) |
| Retail Trade | 30 (83.3%) | 6 (16.7%) |
| Transportation & Warehousing | 3 (100.0%) | 0 (0.0%) |
| Utilities | 4 (57.1%) | 3 (42.9%) |
| Information | 0 (0.0%) | 0 (0.0%) |
| Finance & Insurance | 6 (75.0%) | 2 (25.0%) |
| Real Estate, Rental & Leasing | 0 (0.0%) | 5 (100.0%) |
| Professional & Scientific | 9 (100.0%) | 0 (0.0%) |
| Enterprise Management | 0 (0.0%) | 0 (0.0%) |
| Administrative & Support | 1 (100.0%) | 0 (0.0%) |
| Educational Services | 0 (0.0%) | 15 (100.0%) |
| Health Care & Social Assistance | 0 (0.0%) | 14 (100.0%) |
| Arts, Entertainment & Recreation | 0 (0.0%) | 3 (100.0%) |
| Accommodation & Food Services | 9 (64.3%) | 5 (35.7%) |
| Public Administration | 6 (100.0%) | 0 (0.0%) |
| Total | 134 (66.3%) | 68 (33.7%) |
Education in Tira
School Enrollment in Tira
The most common levels of schooling among the 139 students in Tira are middle school (45 | 32.4%), high school (44 | 31.7%), and elementary school (37 | 26.6%).
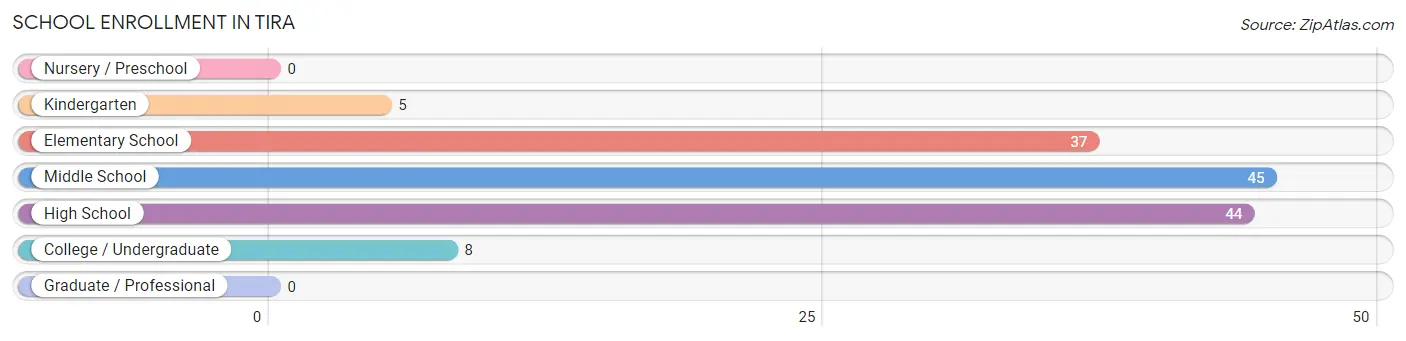
| School Level | # Students | % Students |
| Nursery / Preschool | 0 | 0.0% |
| Kindergarten | 5 | 3.6% |
| Elementary School | 37 | 26.6% |
| Middle School | 45 | 32.4% |
| High School | 44 | 31.7% |
| College / Undergraduate | 8 | 5.8% |
| Graduate / Professional | 0 | 0.0% |
| Total | 139 | 100.0% |
School Enrollment by Age by Funding Source in Tira
Out of a total of 139 students who are enrolled in schools in Tira, 26 (18.7%) attend a private institution, while the remaining 113 (81.3%) are enrolled in public schools. The age group of 5 to 9 year old has the highest likelihood of being enrolled in private schools, with 9 (26.5% in the age bracket) enrolled. Conversely, the age group of 18 to 19 year olds has the lowest likelihood of being enrolled in a private school, with 6 (100.0% in the age bracket) attending a public institution.
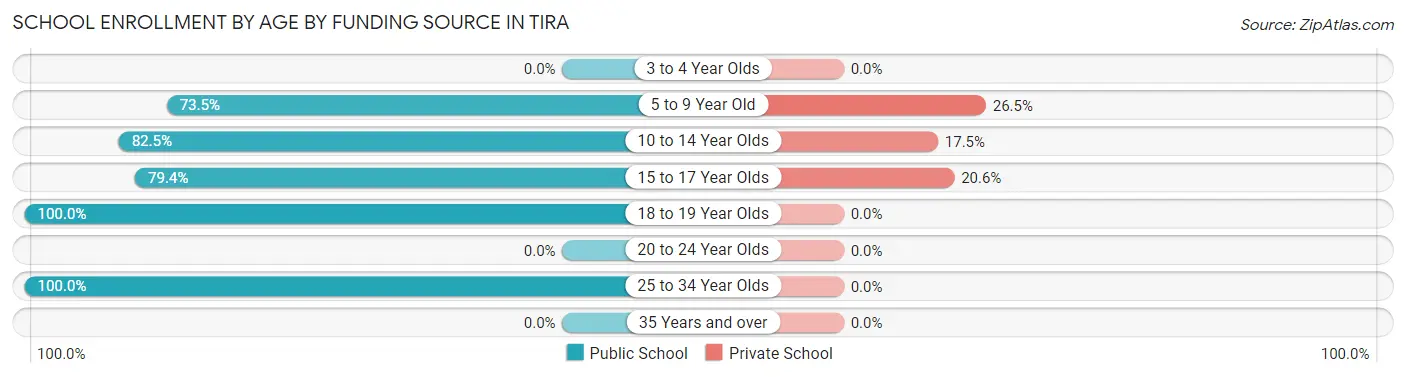
| Age Bracket | Public School | Private School |
| 3 to 4 Year Olds | 0 (0.0%) | 0 (0.0%) |
| 5 to 9 Year Old | 25 (73.5%) | 9 (26.5%) |
| 10 to 14 Year Olds | 47 (82.5%) | 10 (17.5%) |
| 15 to 17 Year Olds | 27 (79.4%) | 7 (20.6%) |
| 18 to 19 Year Olds | 6 (100.0%) | 0 (0.0%) |
| 20 to 24 Year Olds | 0 (0.0%) | 0 (0.0%) |
| 25 to 34 Year Olds | 8 (100.0%) | 0 (0.0%) |
| 35 Years and over | 0 (0.0%) | 0 (0.0%) |
| Total | 113 (81.3%) | 26 (18.7%) |
Educational Attainment by Field of Study in Tira
Science & technology (8 | 19.5%), computers & mathematics (6 | 14.6%), education (6 | 14.6%), communications (6 | 14.6%), and bio, nature & agricultural (4 | 9.8%) are the most common fields of study among 41 individuals in Tira who have obtained a bachelor's degree or higher.
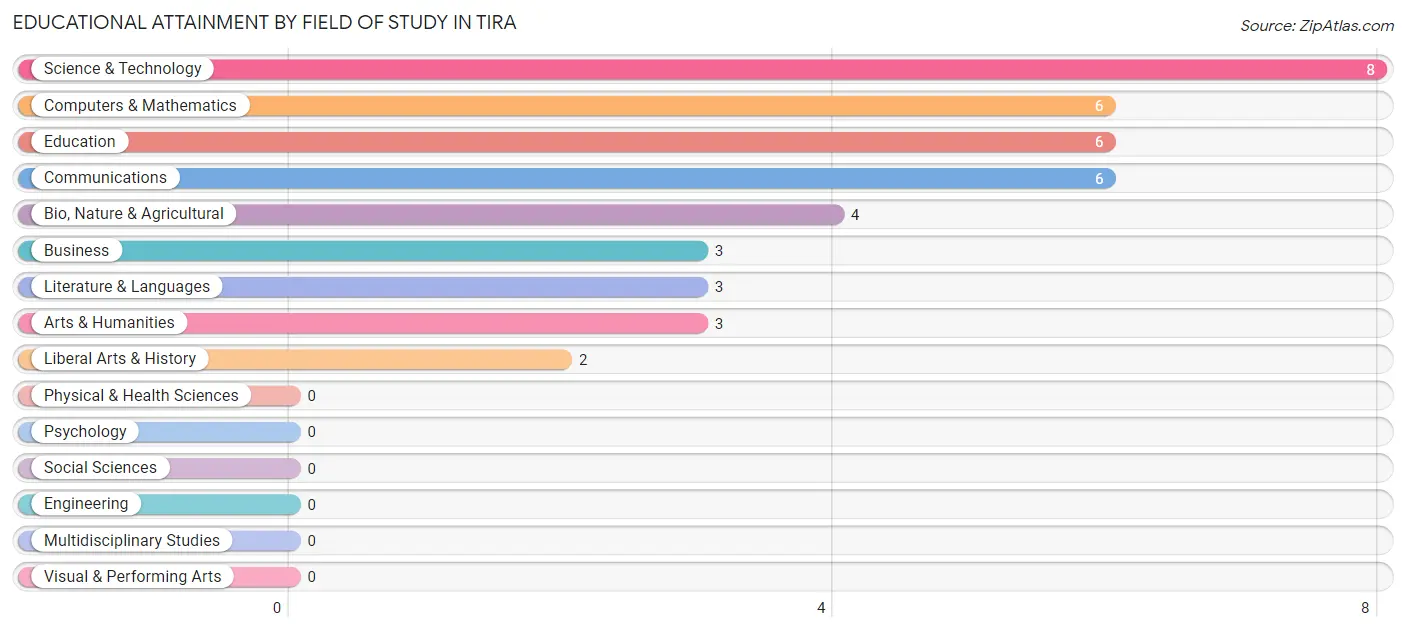
| Field of Study | # Graduates | % Graduates |
| Computers & Mathematics | 6 | 14.6% |
| Bio, Nature & Agricultural | 4 | 9.8% |
| Physical & Health Sciences | 0 | 0.0% |
| Psychology | 0 | 0.0% |
| Social Sciences | 0 | 0.0% |
| Engineering | 0 | 0.0% |
| Multidisciplinary Studies | 0 | 0.0% |
| Science & Technology | 8 | 19.5% |
| Business | 3 | 7.3% |
| Education | 6 | 14.6% |
| Literature & Languages | 3 | 7.3% |
| Liberal Arts & History | 2 | 4.9% |
| Visual & Performing Arts | 0 | 0.0% |
| Communications | 6 | 14.6% |
| Arts & Humanities | 3 | 7.3% |
| Total | 41 | 100.0% |
Transportation & Commute in Tira
Vehicle Availability by Sex in Tira
The most prevalent vehicle ownership categories in Tira are males with 2 vehicles (36, accounting for 26.9%) and females with 2 vehicles (28, making up 59.0%).
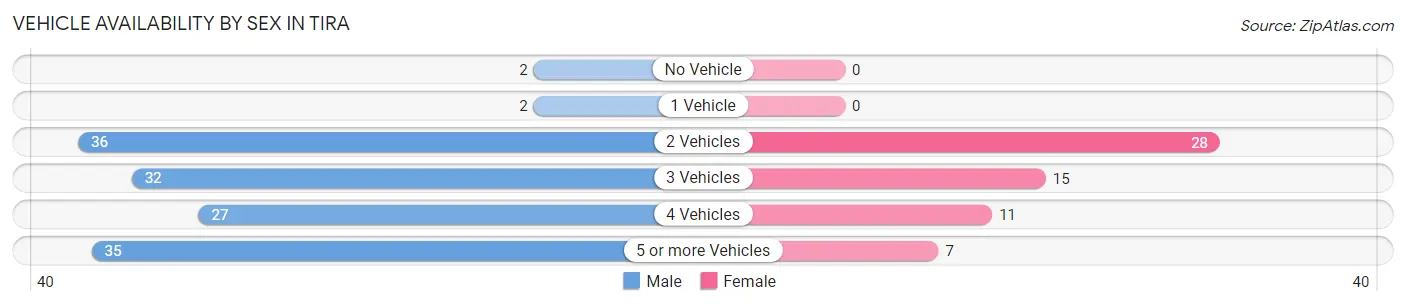
| Vehicles Available | Male | Female |
| No Vehicle | 2 (1.5%) | 0 (0.0%) |
| 1 Vehicle | 2 (1.5%) | 0 (0.0%) |
| 2 Vehicles | 36 (26.9%) | 28 (45.9%) |
| 3 Vehicles | 32 (23.9%) | 15 (24.6%) |
| 4 Vehicles | 27 (20.2%) | 11 (18.0%) |
| 5 or more Vehicles | 35 (26.1%) | 7 (11.5%) |
| Total | 134 (100.0%) | 61 (100.0%) |
Commute Time in Tira
The most frequently occuring commute durations in Tira are 15 to 19 minutes (73 commuters, 37.4%), 20 to 24 minutes (29 commuters, 14.9%), and 10 to 14 minutes (23 commuters, 11.8%).
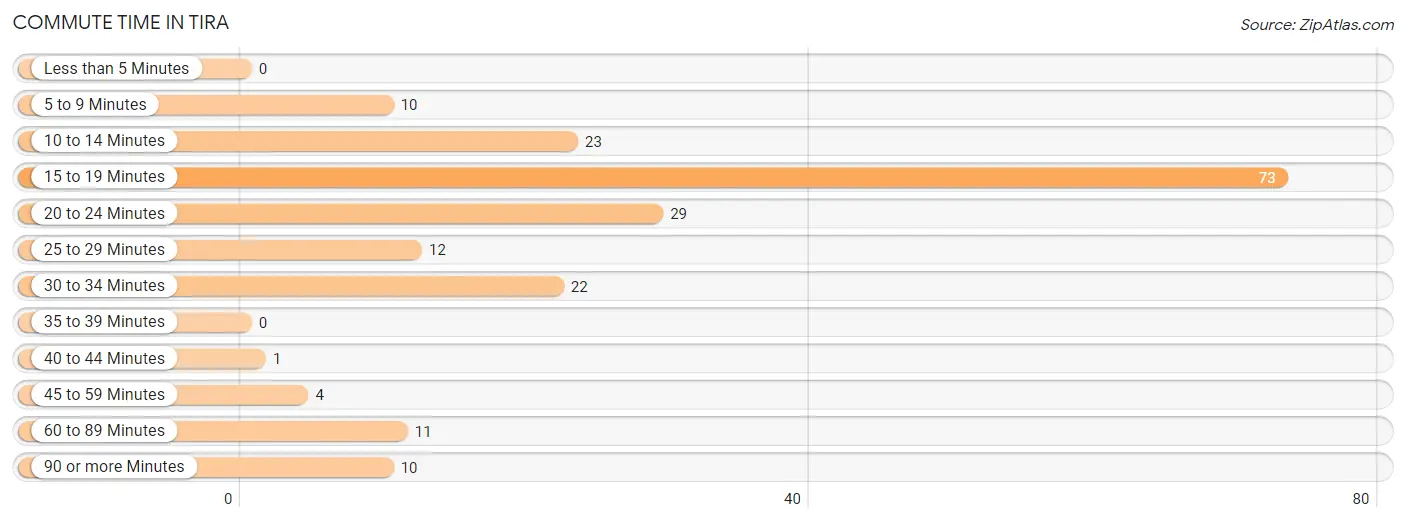
| Commute Time | # Commuters | % Commuters |
| Less than 5 Minutes | 0 | 0.0% |
| 5 to 9 Minutes | 10 | 5.1% |
| 10 to 14 Minutes | 23 | 11.8% |
| 15 to 19 Minutes | 73 | 37.4% |
| 20 to 24 Minutes | 29 | 14.9% |
| 25 to 29 Minutes | 12 | 6.1% |
| 30 to 34 Minutes | 22 | 11.3% |
| 35 to 39 Minutes | 0 | 0.0% |
| 40 to 44 Minutes | 1 | 0.5% |
| 45 to 59 Minutes | 4 | 2.1% |
| 60 to 89 Minutes | 11 | 5.6% |
| 90 or more Minutes | 10 | 5.1% |
Commute Time by Sex in Tira
The most common commute times in Tira are 15 to 19 minutes (50 commuters, 37.3%) for males and 15 to 19 minutes (23 commuters, 37.7%) for females.
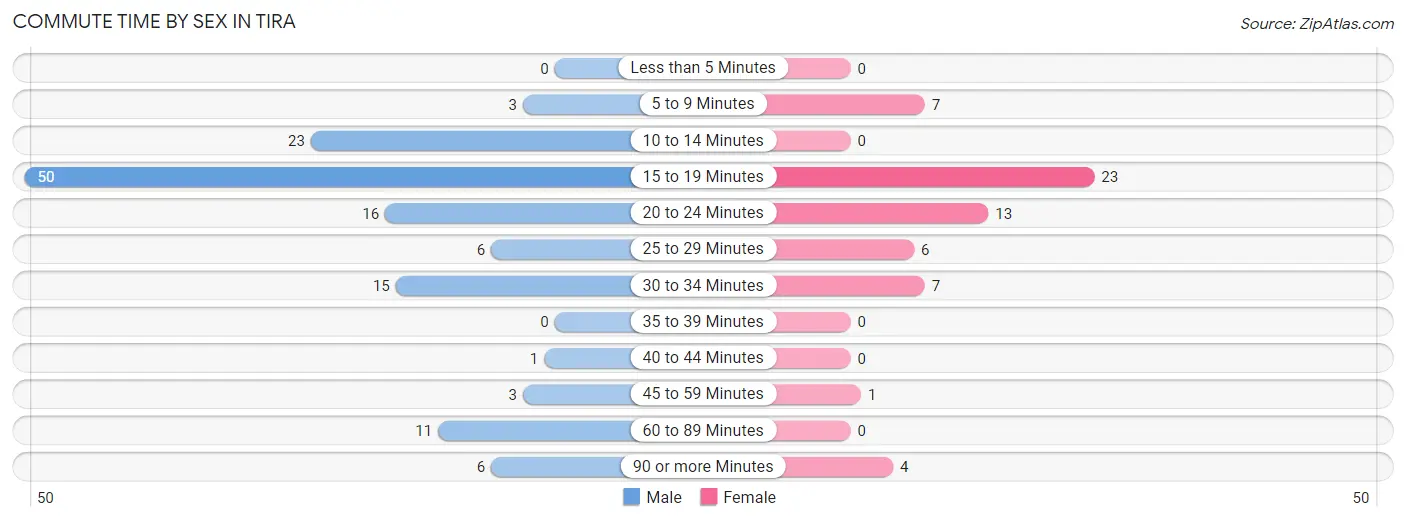
| Commute Time | Male | Female |
| Less than 5 Minutes | 0 (0.0%) | 0 (0.0%) |
| 5 to 9 Minutes | 3 (2.2%) | 7 (11.5%) |
| 10 to 14 Minutes | 23 (17.2%) | 0 (0.0%) |
| 15 to 19 Minutes | 50 (37.3%) | 23 (37.7%) |
| 20 to 24 Minutes | 16 (11.9%) | 13 (21.3%) |
| 25 to 29 Minutes | 6 (4.5%) | 6 (9.8%) |
| 30 to 34 Minutes | 15 (11.2%) | 7 (11.5%) |
| 35 to 39 Minutes | 0 (0.0%) | 0 (0.0%) |
| 40 to 44 Minutes | 1 (0.7%) | 0 (0.0%) |
| 45 to 59 Minutes | 3 (2.2%) | 1 (1.6%) |
| 60 to 89 Minutes | 11 (8.2%) | 0 (0.0%) |
| 90 or more Minutes | 6 (4.5%) | 4 (6.6%) |
Time of Departure to Work by Sex in Tira
The most frequent times of departure to work in Tira are 7:00 AM to 7:29 AM (24, 17.9%) for males and 12:00 AM to 4:59 AM (13, 21.3%) for females.
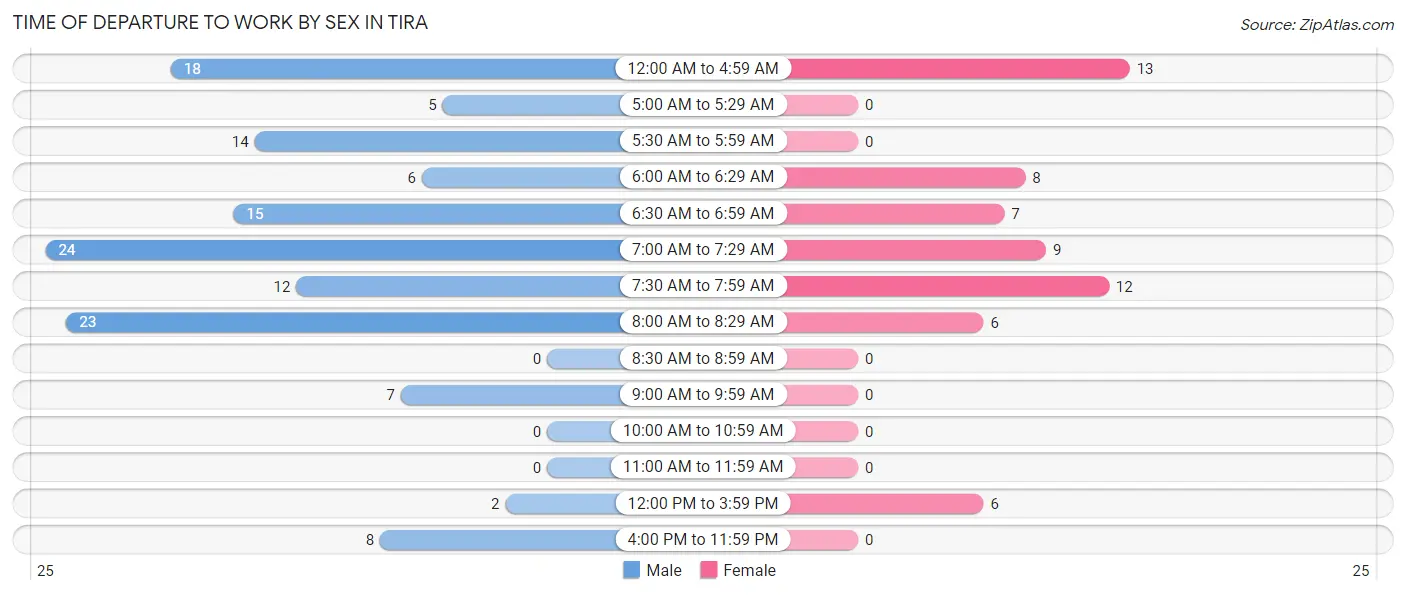
| Time of Departure | Male | Female |
| 12:00 AM to 4:59 AM | 18 (13.4%) | 13 (21.3%) |
| 5:00 AM to 5:29 AM | 5 (3.7%) | 0 (0.0%) |
| 5:30 AM to 5:59 AM | 14 (10.4%) | 0 (0.0%) |
| 6:00 AM to 6:29 AM | 6 (4.5%) | 8 (13.1%) |
| 6:30 AM to 6:59 AM | 15 (11.2%) | 7 (11.5%) |
| 7:00 AM to 7:29 AM | 24 (17.9%) | 9 (14.7%) |
| 7:30 AM to 7:59 AM | 12 (9.0%) | 12 (19.7%) |
| 8:00 AM to 8:29 AM | 23 (17.2%) | 6 (9.8%) |
| 8:30 AM to 8:59 AM | 0 (0.0%) | 0 (0.0%) |
| 9:00 AM to 9:59 AM | 7 (5.2%) | 0 (0.0%) |
| 10:00 AM to 10:59 AM | 0 (0.0%) | 0 (0.0%) |
| 11:00 AM to 11:59 AM | 0 (0.0%) | 0 (0.0%) |
| 12:00 PM to 3:59 PM | 2 (1.5%) | 6 (9.8%) |
| 4:00 PM to 11:59 PM | 8 (6.0%) | 0 (0.0%) |
| Total | 134 (100.0%) | 61 (100.0%) |
Housing Occupancy in Tira
Occupancy by Ownership in Tira
Of the total 137 dwellings in Tira, owner-occupied units account for 114 (83.2%), while renter-occupied units make up 23 (16.8%).
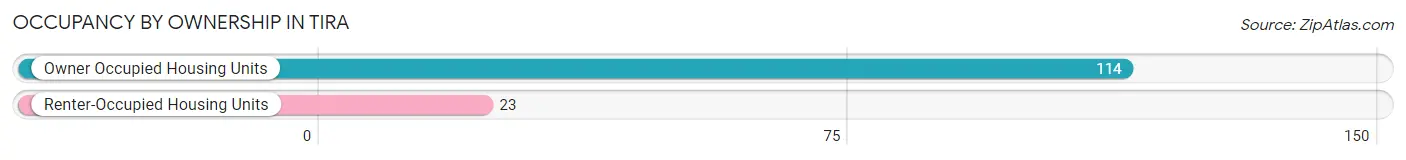
| Occupancy | # Housing Units | % Housing Units |
| Owner Occupied Housing Units | 114 | 83.2% |
| Renter-Occupied Housing Units | 23 | 16.8% |
| Total Occupied Housing Units | 137 | 100.0% |
Occupancy by Household Size in Tira
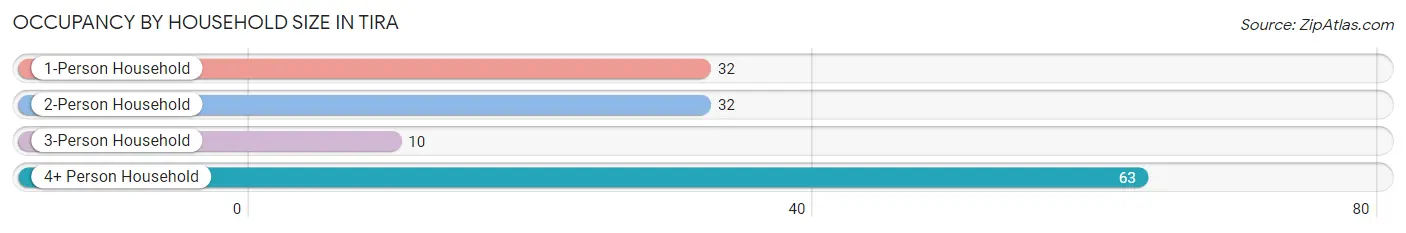
| Household Size | # Housing Units | % Housing Units |
| 1-Person Household | 32 | 23.4% |
| 2-Person Household | 32 | 23.4% |
| 3-Person Household | 10 | 7.3% |
| 4+ Person Household | 63 | 46.0% |
| Total Housing Units | 137 | 100.0% |
Occupancy by Ownership by Household Size in Tira
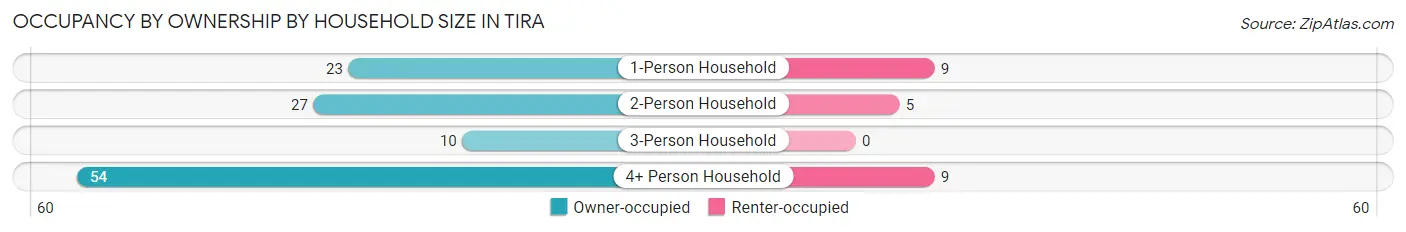
| Household Size | Owner-occupied | Renter-occupied |
| 1-Person Household | 23 (71.9%) | 9 (28.1%) |
| 2-Person Household | 27 (84.4%) | 5 (15.6%) |
| 3-Person Household | 10 (100.0%) | 0 (0.0%) |
| 4+ Person Household | 54 (85.7%) | 9 (14.3%) |
| Total Housing Units | 114 (83.2%) | 23 (16.8%) |
Occupancy by Educational Attainment in Tira
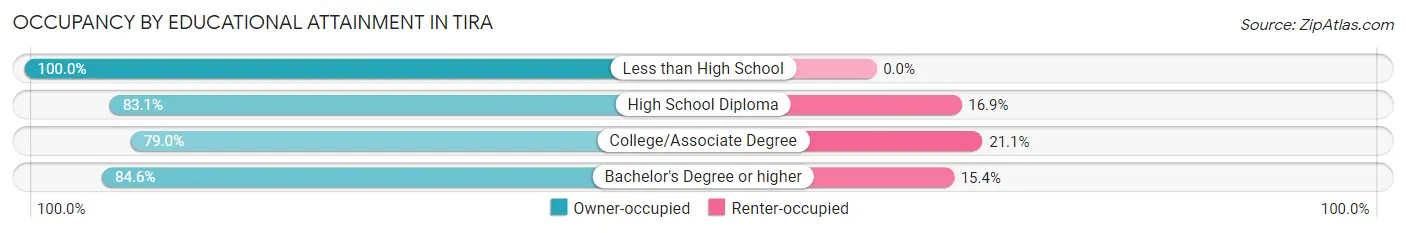
| Household Size | Owner-occupied | Renter-occupied |
| Less than High School | 9 (100.0%) | 0 (0.0%) |
| High School Diploma | 64 (83.1%) | 13 (16.9%) |
| College/Associate Degree | 30 (78.9%) | 8 (21.0%) |
| Bachelor's Degree or higher | 11 (84.6%) | 2 (15.4%) |
Occupancy by Age of Householder in Tira
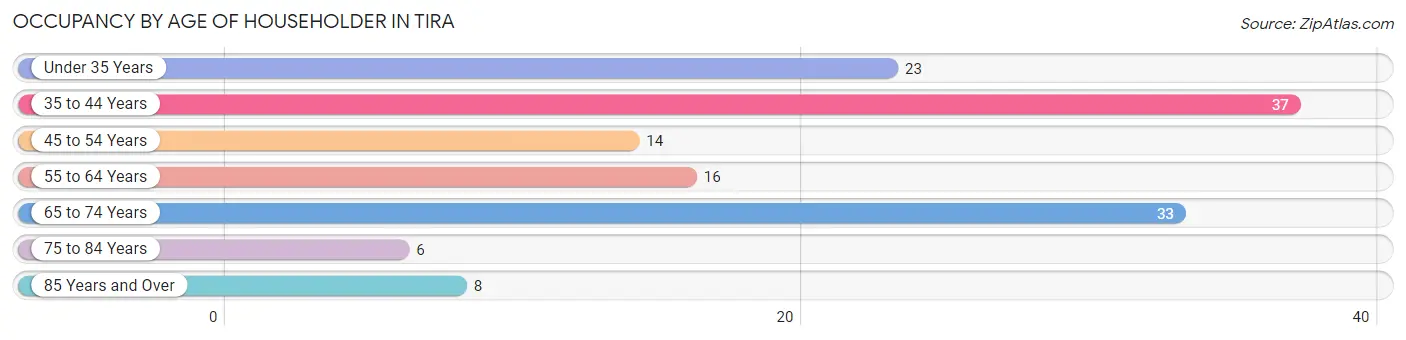
| Age Bracket | # Households | % Households |
| Under 35 Years | 23 | 16.8% |
| 35 to 44 Years | 37 | 27.0% |
| 45 to 54 Years | 14 | 10.2% |
| 55 to 64 Years | 16 | 11.7% |
| 65 to 74 Years | 33 | 24.1% |
| 75 to 84 Years | 6 | 4.4% |
| 85 Years and Over | 8 | 5.8% |
| Total | 137 | 100.0% |
Housing Finances in Tira
Median Income by Occupancy in Tira
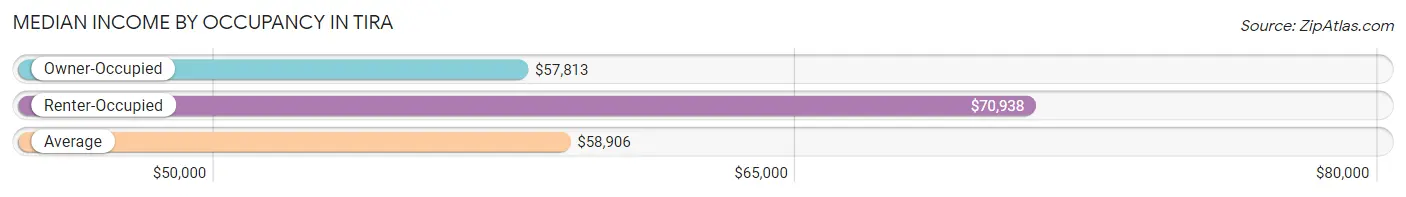
| Occupancy Type | # Households | Median Income |
| Owner-Occupied | 114 (83.2%) | $57,813 |
| Renter-Occupied | 23 (16.8%) | $70,938 |
| Average | 137 (100.0%) | $58,906 |
Occupancy by Householder Income Bracket in Tira
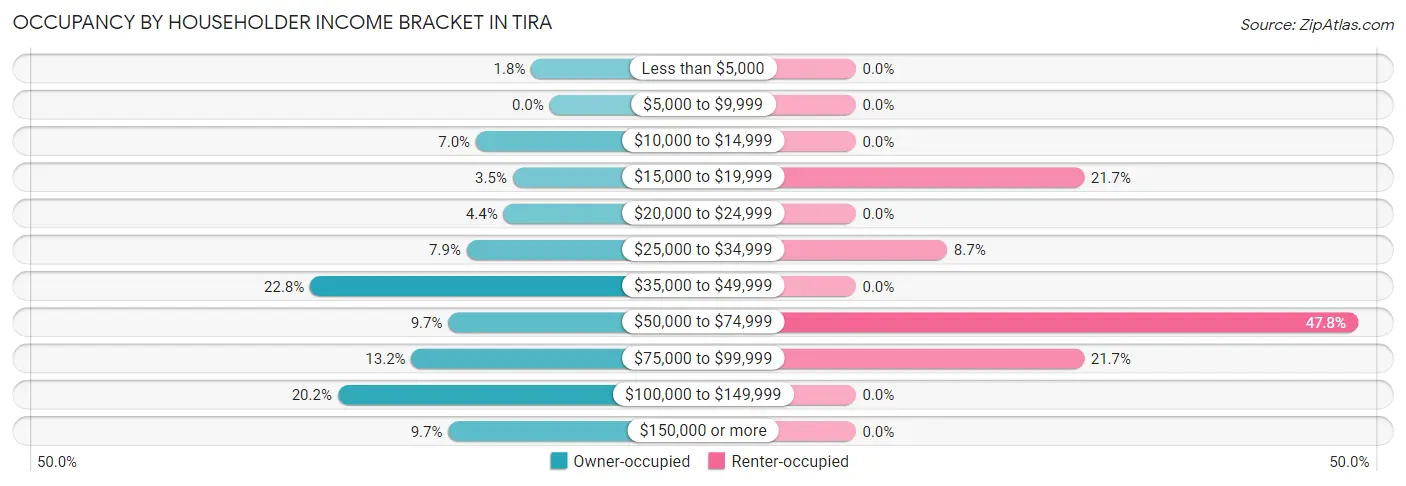
| Income Bracket | Owner-occupied | Renter-occupied |
| Less than $5,000 | 2 (1.8%) | 0 (0.0%) |
| $5,000 to $9,999 | 0 (0.0%) | 0 (0.0%) |
| $10,000 to $14,999 | 8 (7.0%) | 0 (0.0%) |
| $15,000 to $19,999 | 4 (3.5%) | 5 (21.7%) |
| $20,000 to $24,999 | 5 (4.4%) | 0 (0.0%) |
| $25,000 to $34,999 | 9 (7.9%) | 2 (8.7%) |
| $35,000 to $49,999 | 26 (22.8%) | 0 (0.0%) |
| $50,000 to $74,999 | 11 (9.7%) | 11 (47.8%) |
| $75,000 to $99,999 | 15 (13.2%) | 5 (21.7%) |
| $100,000 to $149,999 | 23 (20.2%) | 0 (0.0%) |
| $150,000 or more | 11 (9.7%) | 0 (0.0%) |
| Total | 114 (100.0%) | 23 (100.0%) |
Monthly Housing Cost Tiers in Tira
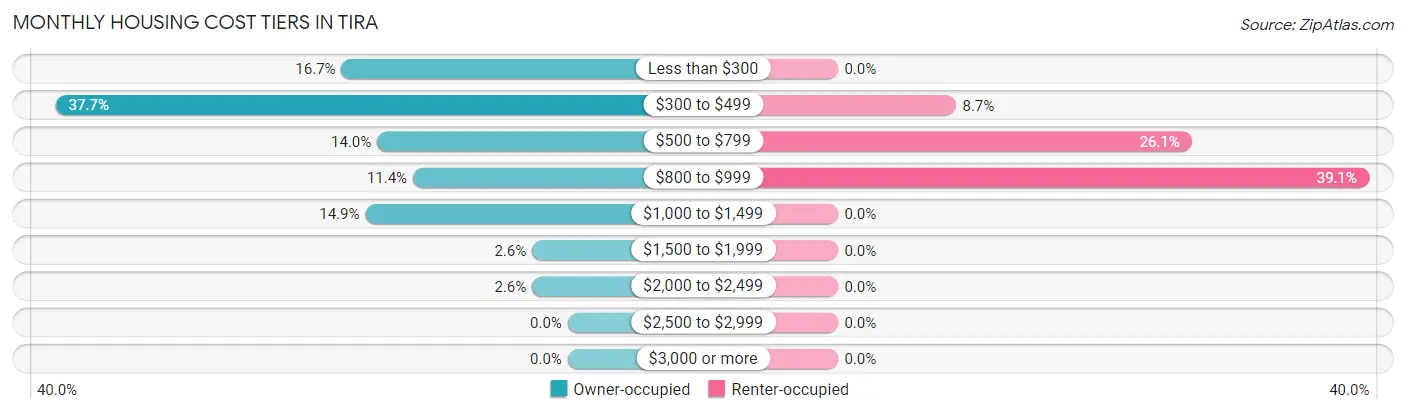
| Monthly Cost | Owner-occupied | Renter-occupied |
| Less than $300 | 19 (16.7%) | 0 (0.0%) |
| $300 to $499 | 43 (37.7%) | 2 (8.7%) |
| $500 to $799 | 16 (14.0%) | 6 (26.1%) |
| $800 to $999 | 13 (11.4%) | 9 (39.1%) |
| $1,000 to $1,499 | 17 (14.9%) | 0 (0.0%) |
| $1,500 to $1,999 | 3 (2.6%) | 0 (0.0%) |
| $2,000 to $2,499 | 3 (2.6%) | 0 (0.0%) |
| $2,500 to $2,999 | 0 (0.0%) | 0 (0.0%) |
| $3,000 or more | 0 (0.0%) | 0 (0.0%) |
| Total | 114 (100.0%) | 23 (100.0%) |
Physical Housing Characteristics in Tira
Housing Structures in Tira
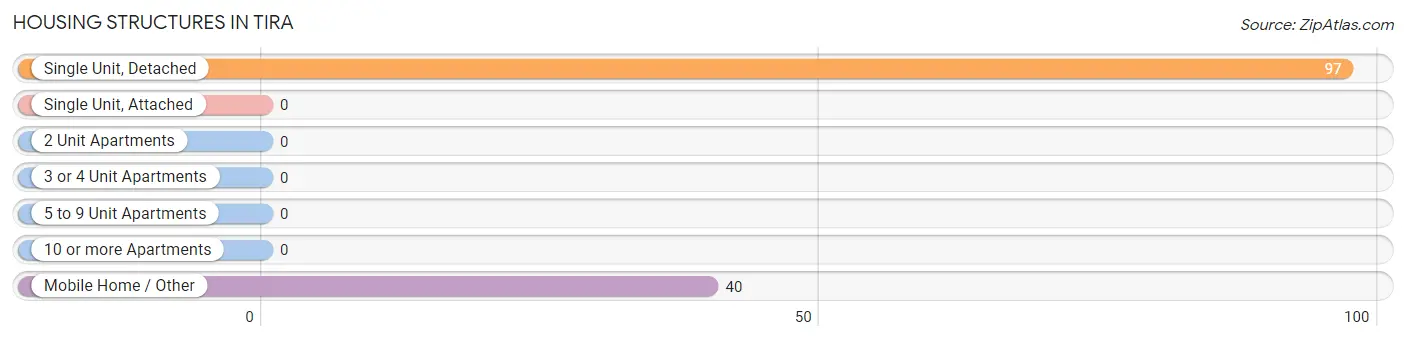
| Structure Type | # Housing Units | % Housing Units |
| Single Unit, Detached | 97 | 70.8% |
| Single Unit, Attached | 0 | 0.0% |
| 2 Unit Apartments | 0 | 0.0% |
| 3 or 4 Unit Apartments | 0 | 0.0% |
| 5 to 9 Unit Apartments | 0 | 0.0% |
| 10 or more Apartments | 0 | 0.0% |
| Mobile Home / Other | 40 | 29.2% |
| Total | 137 | 100.0% |
Housing Structures by Occupancy in Tira
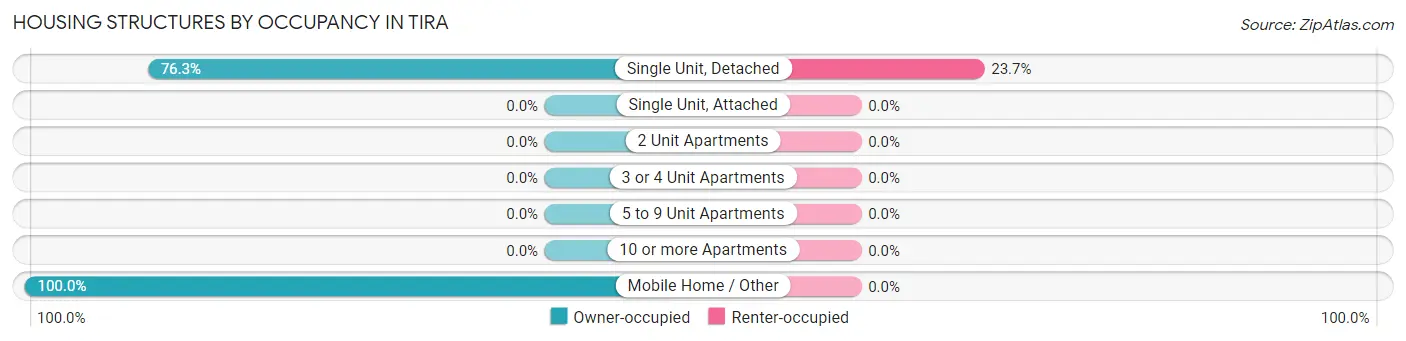
| Structure Type | Owner-occupied | Renter-occupied |
| Single Unit, Detached | 74 (76.3%) | 23 (23.7%) |
| Single Unit, Attached | 0 (0.0%) | 0 (0.0%) |
| 2 Unit Apartments | 0 (0.0%) | 0 (0.0%) |
| 3 or 4 Unit Apartments | 0 (0.0%) | 0 (0.0%) |
| 5 to 9 Unit Apartments | 0 (0.0%) | 0 (0.0%) |
| 10 or more Apartments | 0 (0.0%) | 0 (0.0%) |
| Mobile Home / Other | 40 (100.0%) | 0 (0.0%) |
| Total | 114 (83.2%) | 23 (16.8%) |
Housing Structures by Number of Rooms in Tira
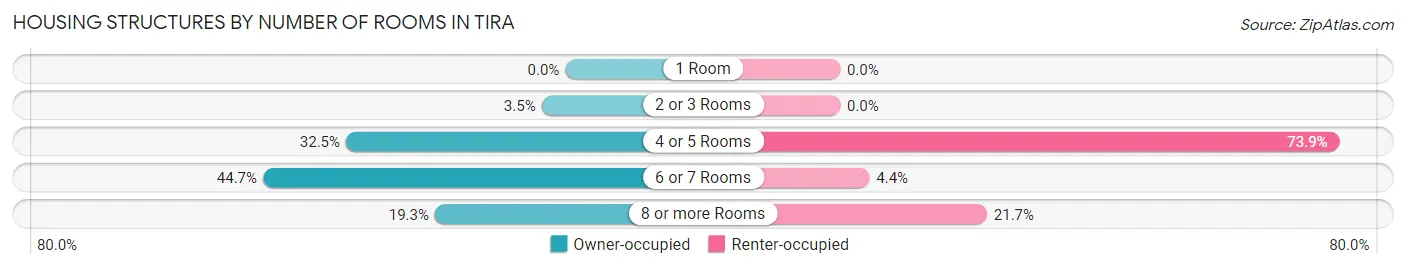
| Number of Rooms | Owner-occupied | Renter-occupied |
| 1 Room | 0 (0.0%) | 0 (0.0%) |
| 2 or 3 Rooms | 4 (3.5%) | 0 (0.0%) |
| 4 or 5 Rooms | 37 (32.5%) | 17 (73.9%) |
| 6 or 7 Rooms | 51 (44.7%) | 1 (4.3%) |
| 8 or more Rooms | 22 (19.3%) | 5 (21.7%) |
| Total | 114 (100.0%) | 23 (100.0%) |
Housing Structure by Heating Type in Tira
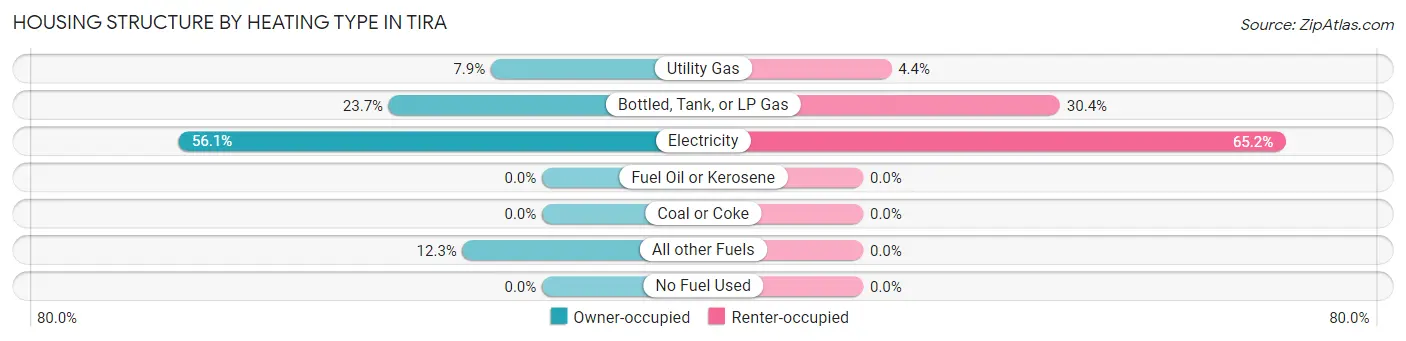
| Heating Type | Owner-occupied | Renter-occupied |
| Utility Gas | 9 (7.9%) | 1 (4.3%) |
| Bottled, Tank, or LP Gas | 27 (23.7%) | 7 (30.4%) |
| Electricity | 64 (56.1%) | 15 (65.2%) |
| Fuel Oil or Kerosene | 0 (0.0%) | 0 (0.0%) |
| Coal or Coke | 0 (0.0%) | 0 (0.0%) |
| All other Fuels | 14 (12.3%) | 0 (0.0%) |
| No Fuel Used | 0 (0.0%) | 0 (0.0%) |
| Total | 114 (100.0%) | 23 (100.0%) |
Household Vehicle Usage in Tira
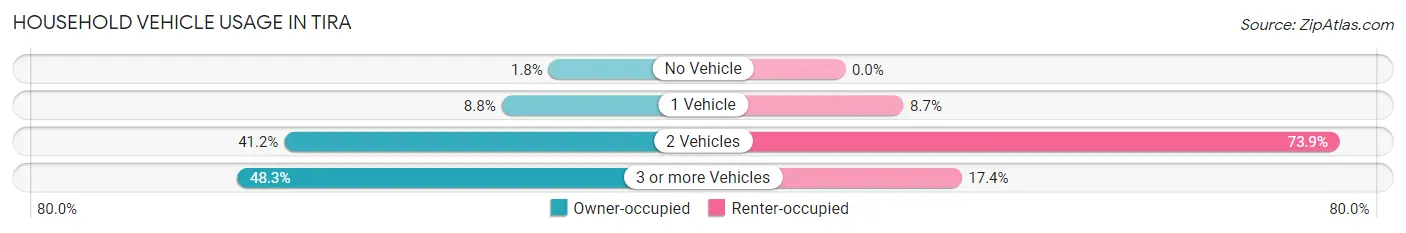
| Vehicles per Household | Owner-occupied | Renter-occupied |
| No Vehicle | 2 (1.8%) | 0 (0.0%) |
| 1 Vehicle | 10 (8.8%) | 2 (8.7%) |
| 2 Vehicles | 47 (41.2%) | 17 (73.9%) |
| 3 or more Vehicles | 55 (48.2%) | 4 (17.4%) |
| Total | 114 (100.0%) | 23 (100.0%) |
Real Estate & Mortgages in Tira
Real Estate and Mortgage Overview in Tira
| Characteristic | Without Mortgage | With Mortgage |
| Housing Units | 79 | 35 |
| Median Property Value | $78,800 | $104,200 |
| Median Household Income | $44,375 | $11 |
| Monthly Housing Costs | $427 | $0 |
| Real Estate Taxes | $587 | $2 |
Property Value by Mortgage Status in Tira
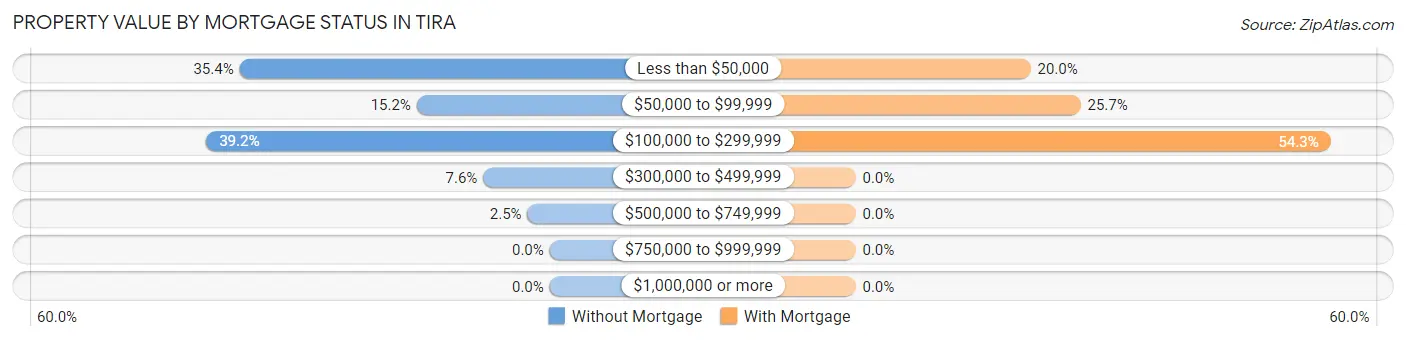
| Property Value | Without Mortgage | With Mortgage |
| Less than $50,000 | 28 (35.4%) | 7 (20.0%) |
| $50,000 to $99,999 | 12 (15.2%) | 9 (25.7%) |
| $100,000 to $299,999 | 31 (39.2%) | 19 (54.3%) |
| $300,000 to $499,999 | 6 (7.6%) | 0 (0.0%) |
| $500,000 to $749,999 | 2 (2.5%) | 0 (0.0%) |
| $750,000 to $999,999 | 0 (0.0%) | 0 (0.0%) |
| $1,000,000 or more | 0 (0.0%) | 0 (0.0%) |
| Total | 79 (100.0%) | 35 (100.0%) |
Household Income by Mortgage Status in Tira
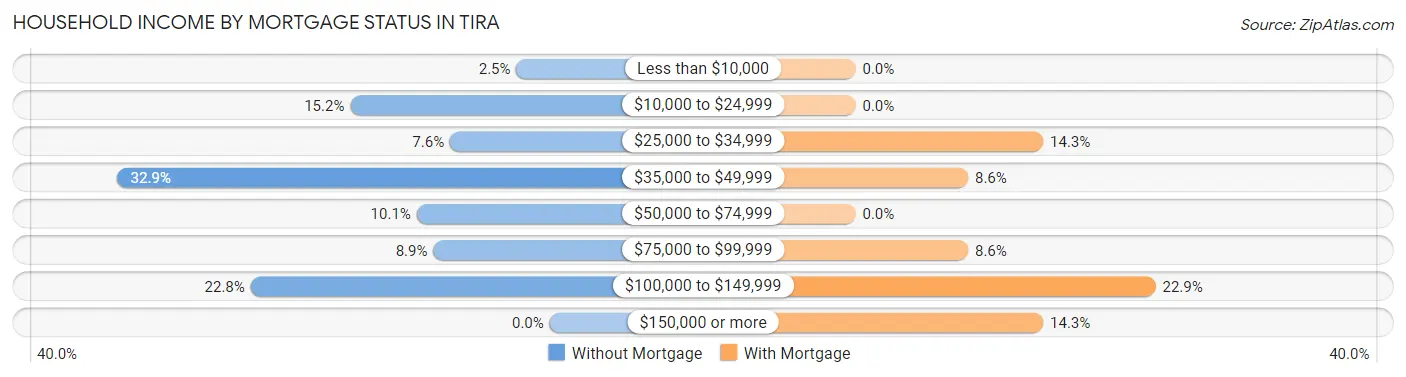
| Household Income | Without Mortgage | With Mortgage |
| Less than $10,000 | 2 (2.5%) | 0 (0.0%) |
| $10,000 to $24,999 | 12 (15.2%) | 0 (0.0%) |
| $25,000 to $34,999 | 6 (7.6%) | 5 (14.3%) |
| $35,000 to $49,999 | 26 (32.9%) | 3 (8.6%) |
| $50,000 to $74,999 | 8 (10.1%) | 0 (0.0%) |
| $75,000 to $99,999 | 7 (8.9%) | 3 (8.6%) |
| $100,000 to $149,999 | 18 (22.8%) | 8 (22.9%) |
| $150,000 or more | 0 (0.0%) | 5 (14.3%) |
| Total | 79 (100.0%) | 35 (100.0%) |
Property Value to Household Income Ratio in Tira
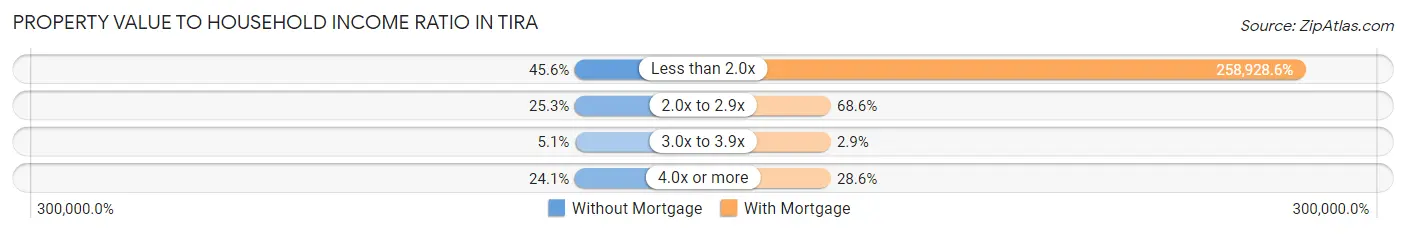
| Value-to-Income Ratio | Without Mortgage | With Mortgage |
| Less than 2.0x | 36 (45.6%) | 90,625 (258,928.6%) |
| 2.0x to 2.9x | 20 (25.3%) | 24 (68.6%) |
| 3.0x to 3.9x | 4 (5.1%) | 1 (2.9%) |
| 4.0x or more | 19 (24.0%) | 10 (28.6%) |
| Total | 79 (100.0%) | 35 (100.0%) |
Real Estate Taxes by Mortgage Status in Tira
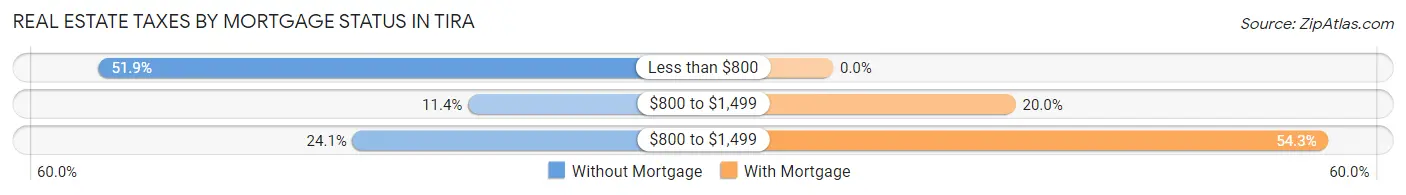
| Property Taxes | Without Mortgage | With Mortgage |
| Less than $800 | 41 (51.9%) | 0 (0.0%) |
| $800 to $1,499 | 9 (11.4%) | 7 (20.0%) |
| $800 to $1,499 | 19 (24.0%) | 19 (54.3%) |
| Total | 79 (100.0%) | 35 (100.0%) |
Health & Disability in Tira
Health Insurance Coverage by Age in Tira
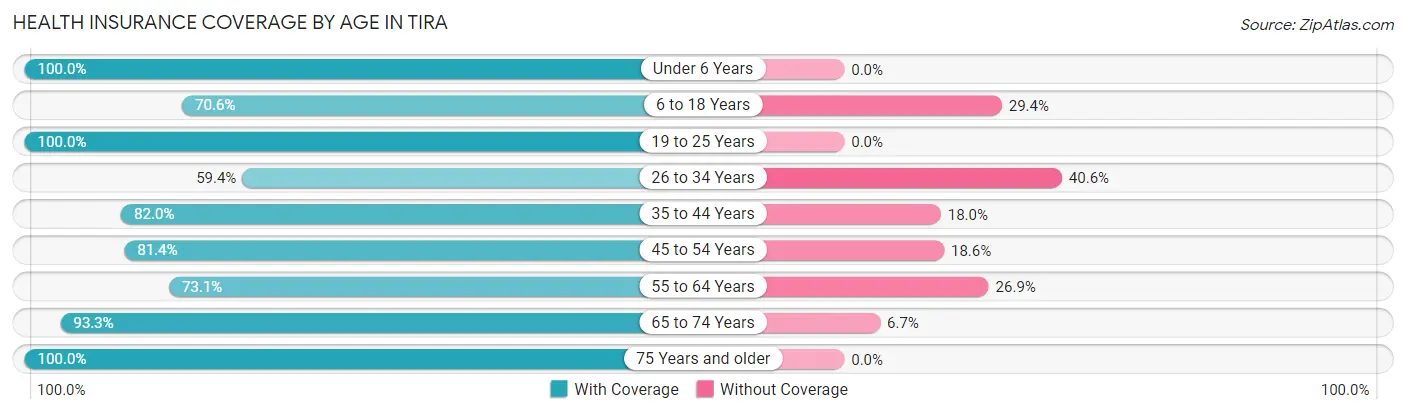
| Age Bracket | With Coverage | Without Coverage |
| Under 6 Years | 20 (100.0%) | 0 (0.0%) |
| 6 to 18 Years | 89 (70.6%) | 37 (29.4%) |
| 19 to 25 Years | 30 (100.0%) | 0 (0.0%) |
| 26 to 34 Years | 41 (59.4%) | 28 (40.6%) |
| 35 to 44 Years | 41 (82.0%) | 9 (18.0%) |
| 45 to 54 Years | 35 (81.4%) | 8 (18.6%) |
| 55 to 64 Years | 19 (73.1%) | 7 (26.9%) |
| 65 to 74 Years | 56 (93.3%) | 4 (6.7%) |
| 75 Years and older | 16 (100.0%) | 0 (0.0%) |
| Total | 347 (78.9%) | 93 (21.1%) |
Health Insurance Coverage by Citizenship Status in Tira
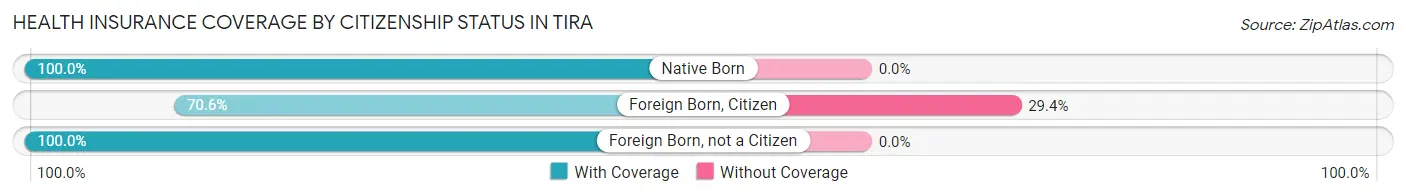
| Citizenship Status | With Coverage | Without Coverage |
| Native Born | 20 (100.0%) | 0 (0.0%) |
| Foreign Born, Citizen | 89 (70.6%) | 37 (29.4%) |
| Foreign Born, not a Citizen | 30 (100.0%) | 0 (0.0%) |
Health Insurance Coverage by Household Income in Tira
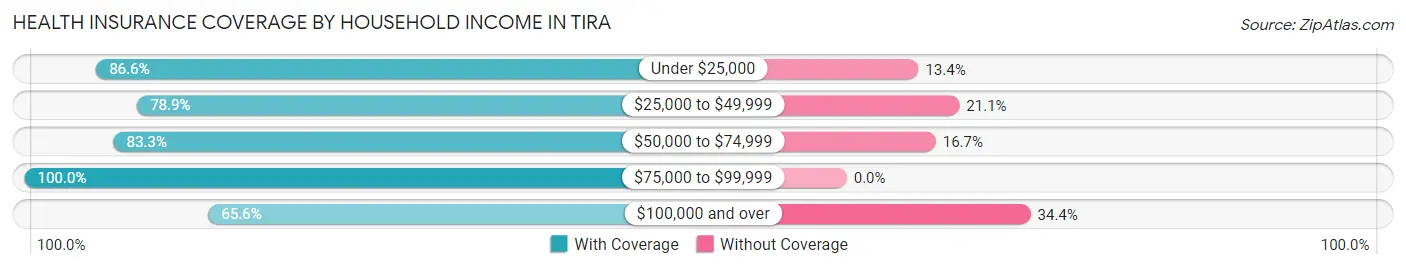
| Household Income | With Coverage | Without Coverage |
| Under $25,000 | 58 (86.6%) | 9 (13.4%) |
| $25,000 to $49,999 | 86 (78.9%) | 23 (21.1%) |
| $50,000 to $74,999 | 45 (83.3%) | 9 (16.7%) |
| $75,000 to $99,999 | 59 (100.0%) | 0 (0.0%) |
| $100,000 and over | 99 (65.6%) | 52 (34.4%) |
Public vs Private Health Insurance Coverage by Age in Tira
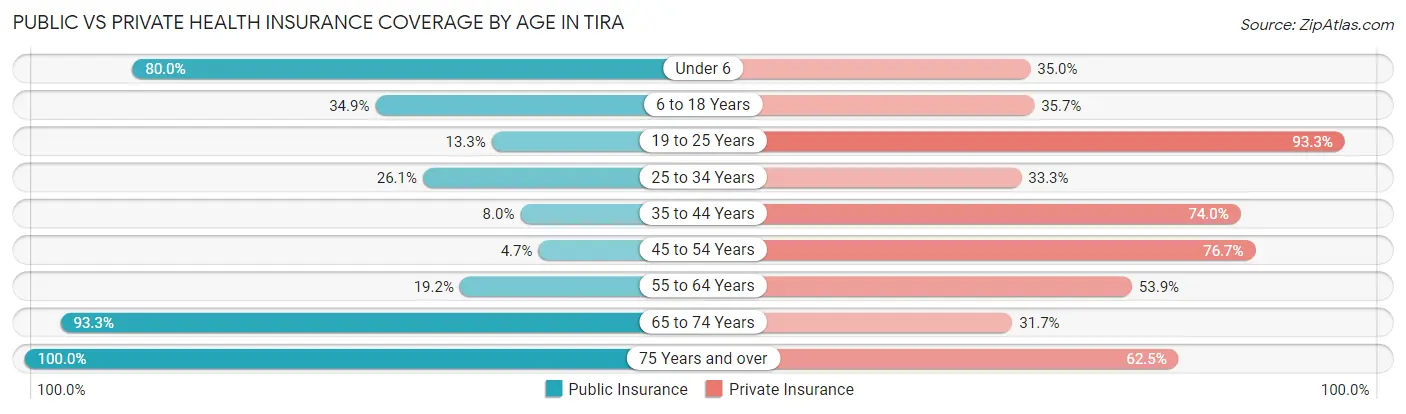
| Age Bracket | Public Insurance | Private Insurance |
| Under 6 | 16 (80.0%) | 7 (35.0%) |
| 6 to 18 Years | 44 (34.9%) | 45 (35.7%) |
| 19 to 25 Years | 4 (13.3%) | 28 (93.3%) |
| 25 to 34 Years | 18 (26.1%) | 23 (33.3%) |
| 35 to 44 Years | 4 (8.0%) | 37 (74.0%) |
| 45 to 54 Years | 2 (4.6%) | 33 (76.7%) |
| 55 to 64 Years | 5 (19.2%) | 14 (53.8%) |
| 65 to 74 Years | 56 (93.3%) | 19 (31.7%) |
| 75 Years and over | 16 (100.0%) | 10 (62.5%) |
| Total | 165 (37.5%) | 216 (49.1%) |
Disability Status by Sex by Age in Tira
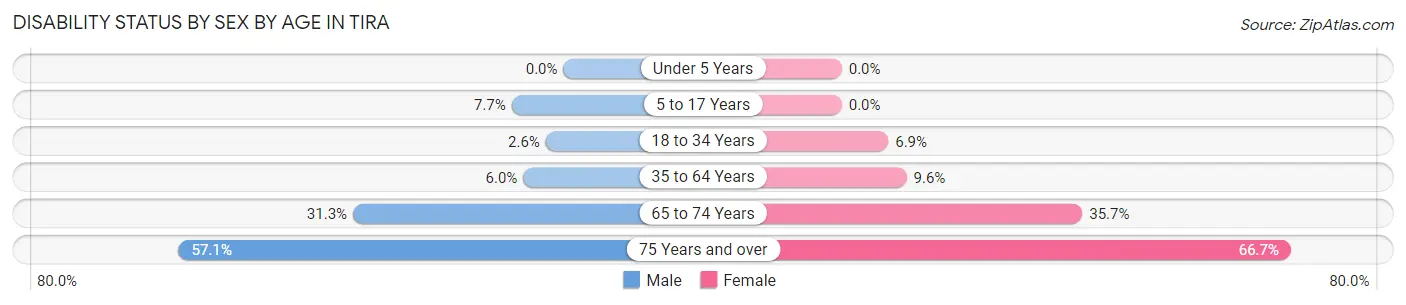
| Age Bracket | Male | Female |
| Under 5 Years | 0 (0.0%) | 0 (0.0%) |
| 5 to 17 Years | 5 (7.7%) | 0 (0.0%) |
| 18 to 34 Years | 2 (2.6%) | 2 (6.9%) |
| 35 to 64 Years | 4 (6.0%) | 5 (9.6%) |
| 65 to 74 Years | 10 (31.2%) | 10 (35.7%) |
| 75 Years and over | 4 (57.1%) | 6 (66.7%) |
Disability Class by Sex by Age in Tira
Disability Class: Hearing Difficulty
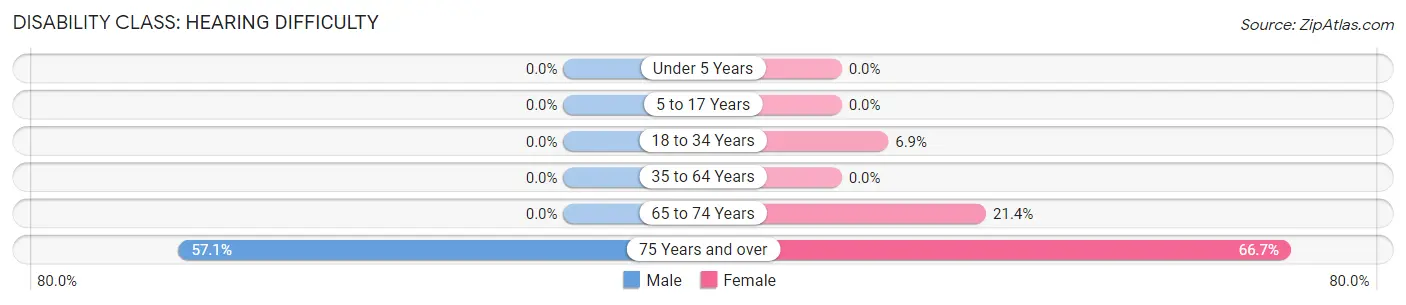
| Age Bracket | Male | Female |
| Under 5 Years | 0 (0.0%) | 0 (0.0%) |
| 5 to 17 Years | 0 (0.0%) | 0 (0.0%) |
| 18 to 34 Years | 0 (0.0%) | 2 (6.9%) |
| 35 to 64 Years | 0 (0.0%) | 0 (0.0%) |
| 65 to 74 Years | 0 (0.0%) | 6 (21.4%) |
| 75 Years and over | 4 (57.1%) | 6 (66.7%) |
Disability Class: Vision Difficulty
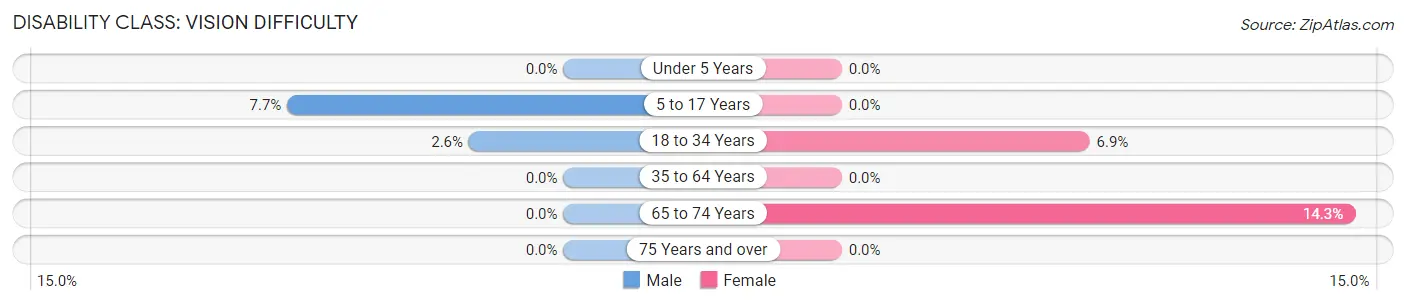
| Age Bracket | Male | Female |
| Under 5 Years | 0 (0.0%) | 0 (0.0%) |
| 5 to 17 Years | 5 (7.7%) | 0 (0.0%) |
| 18 to 34 Years | 2 (2.6%) | 2 (6.9%) |
| 35 to 64 Years | 0 (0.0%) | 0 (0.0%) |
| 65 to 74 Years | 0 (0.0%) | 4 (14.3%) |
| 75 Years and over | 0 (0.0%) | 0 (0.0%) |
Disability Class: Cognitive Difficulty
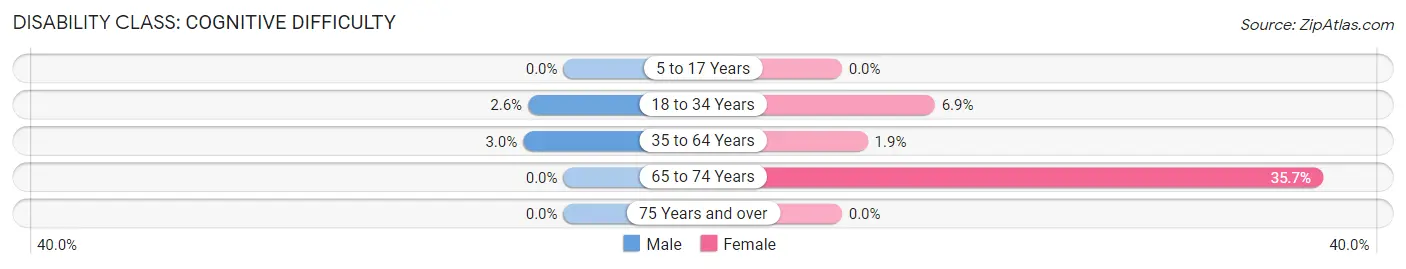
| Age Bracket | Male | Female |
| 5 to 17 Years | 0 (0.0%) | 0 (0.0%) |
| 18 to 34 Years | 2 (2.6%) | 2 (6.9%) |
| 35 to 64 Years | 2 (3.0%) | 1 (1.9%) |
| 65 to 74 Years | 0 (0.0%) | 10 (35.7%) |
| 75 Years and over | 0 (0.0%) | 0 (0.0%) |
Disability Class: Ambulatory Difficulty
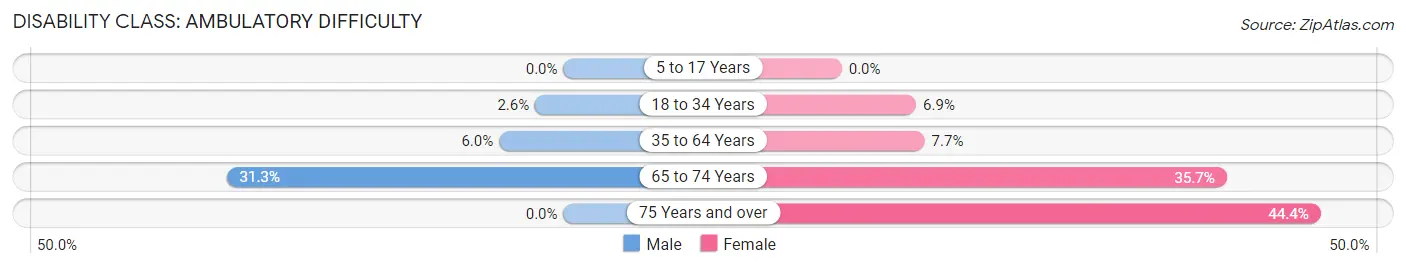
| Age Bracket | Male | Female |
| 5 to 17 Years | 0 (0.0%) | 0 (0.0%) |
| 18 to 34 Years | 2 (2.6%) | 2 (6.9%) |
| 35 to 64 Years | 4 (6.0%) | 4 (7.7%) |
| 65 to 74 Years | 10 (31.2%) | 10 (35.7%) |
| 75 Years and over | 0 (0.0%) | 4 (44.4%) |
Disability Class: Self-Care Difficulty
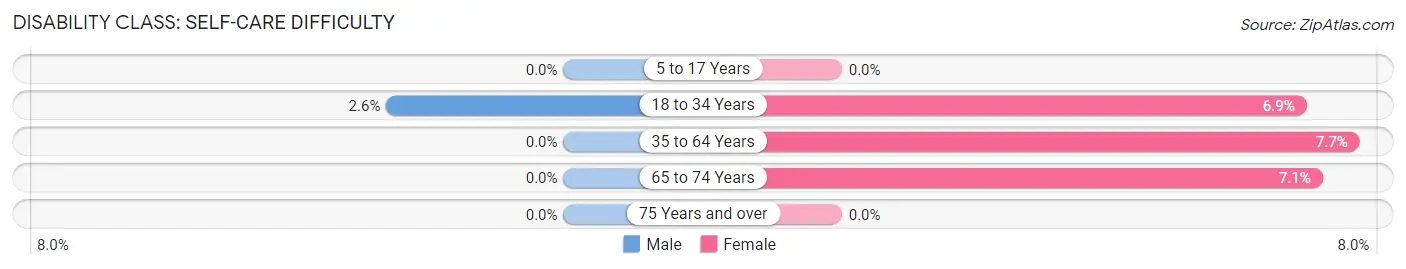
| Age Bracket | Male | Female |
| 5 to 17 Years | 0 (0.0%) | 0 (0.0%) |
| 18 to 34 Years | 2 (2.6%) | 2 (6.9%) |
| 35 to 64 Years | 0 (0.0%) | 4 (7.7%) |
| 65 to 74 Years | 0 (0.0%) | 2 (7.1%) |
| 75 Years and over | 0 (0.0%) | 0 (0.0%) |
Technology Access in Tira
Computing Device Access in Tira
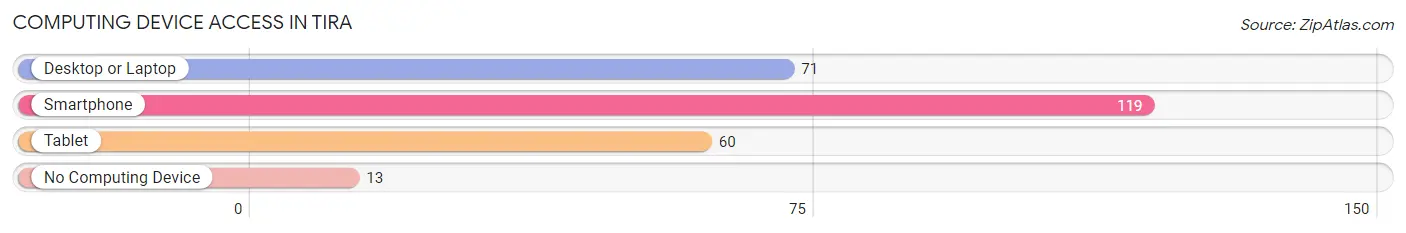
| Device Type | # Households | % Households |
| Desktop or Laptop | 71 | 51.8% |
| Smartphone | 119 | 86.9% |
| Tablet | 60 | 43.8% |
| No Computing Device | 13 | 9.5% |
| Total | 137 | 100.0% |
Internet Access in Tira
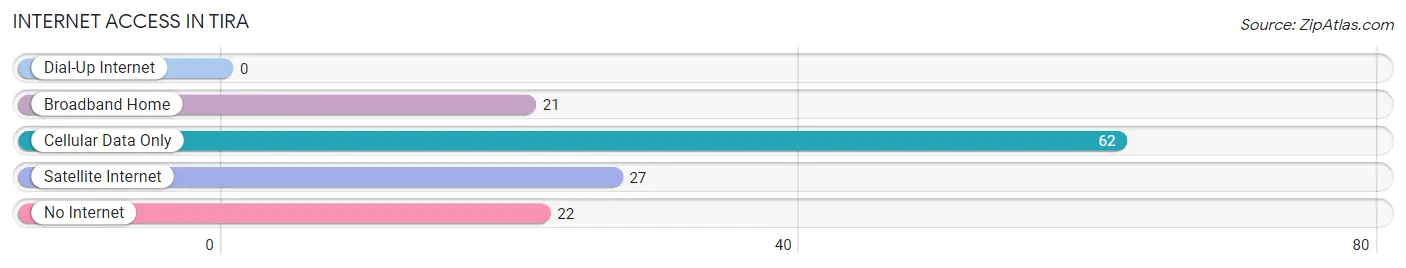
| Internet Type | # Households | % Households |
| Dial-Up Internet | 0 | 0.0% |
| Broadband Home | 21 | 15.3% |
| Cellular Data Only | 62 | 45.3% |
| Satellite Internet | 27 | 19.7% |
| No Internet | 22 | 16.1% |
| Total | 137 | 100.0% |
Tira Summary
Tira is a small unincorporated community located in northeastern Hunt County, Texas, United States. It is situated along State Highway 11, approximately 8 miles east of the county seat of Greenville. The population of Tira was estimated to be around 200 in 2020.
History
Tira was first settled in the late 1800s by a group of settlers from Tennessee. The town was originally known as “Tirzah”, after the biblical city of the same name. The name was later changed to “Tira”, which is the Hebrew word for “arrow”. The town was officially incorporated in 1891.
Tira was a thriving agricultural community in the early 1900s, with cotton, corn, and wheat being the main crops. The town also had a cotton gin, a grist mill, and a blacksmith shop. In the 1920s, the town began to decline as the Great Depression hit the area. The population decreased and many of the businesses closed.
In the 1940s, Tira began to experience a resurgence as the economy improved. The town was home to a number of businesses, including a grocery store, a cafe, a barber shop, and a post office. The town also had a school, which served students from grades 1-12.
Geography
Tira is located in northeastern Hunt County, Texas, approximately 8 miles east of the county seat of Greenville. The town is situated along State Highway 11, which runs east-west through the town. The terrain around Tira is mostly flat, with some rolling hills in the area. The climate is generally mild, with hot summers and cool winters.
Economy
Tira’s economy is largely based on agriculture. The town is home to several farms, which produce cotton, corn, wheat, and other crops. The town also has a few small businesses, including a grocery store, a cafe, and a barber shop.
Demographics
As of 2020, the population of Tira was estimated to be around 200. The town is predominantly white, with a small Hispanic population. The median household income is around $35,000, and the median home value is around $90,000. The town has a low unemployment rate, and the poverty rate is below the national average.
Common Questions
What is Per Capita Income in Tira?
Per Capita income in Tira is $23,370.
What is the Median Family Income in Tira?
Median Family Income in Tira is $71,000.
What is the Median Household income in Tira?
Median Household Income in Tira is $58,906.
What is Income or Wage Gap in Tira?
Income or Wage Gap in Tira is 5.7%.
Women in Tira earn 94.3 cents for every dollar earned by a man.
What is Inequality or Gini Index in Tira?
Inequality or Gini Index in Tira is 0.37.
What is the Total Population of Tira?
Total Population of Tira is 440.
What is the Total Male Population of Tira?
Total Male Population of Tira is 253.
What is the Total Female Population of Tira?
Total Female Population of Tira is 187.
What is the Ratio of Males per 100 Females in Tira?
There are 135.29 Males per 100 Females in Tira.
What is the Ratio of Females per 100 Males in Tira?
There are 73.91 Females per 100 Males in Tira.
What is the Median Population Age in Tira?
Median Population Age in Tira is 32.2 Years.
What is the Average Family Size in Tira
Average Family Size in Tira is 3.6 People.
What is the Average Household Size in Tira
Average Household Size in Tira is 3.2 People.
How Large is the Labor Force in Tira?
There are 202 People in the Labor Forcein in Tira.
What is the Percentage of People in the Labor Force in Tira?
64.7% of People are in the Labor Force in Tira.