Zip Codes with the Highest Percentage of Population Employed in Food Preparation & Serving in New Braunfels, TX
RELATED REPORTS & OPTIONS
Food Preparation & Serving
New Braunfels
Compare Zip Codes
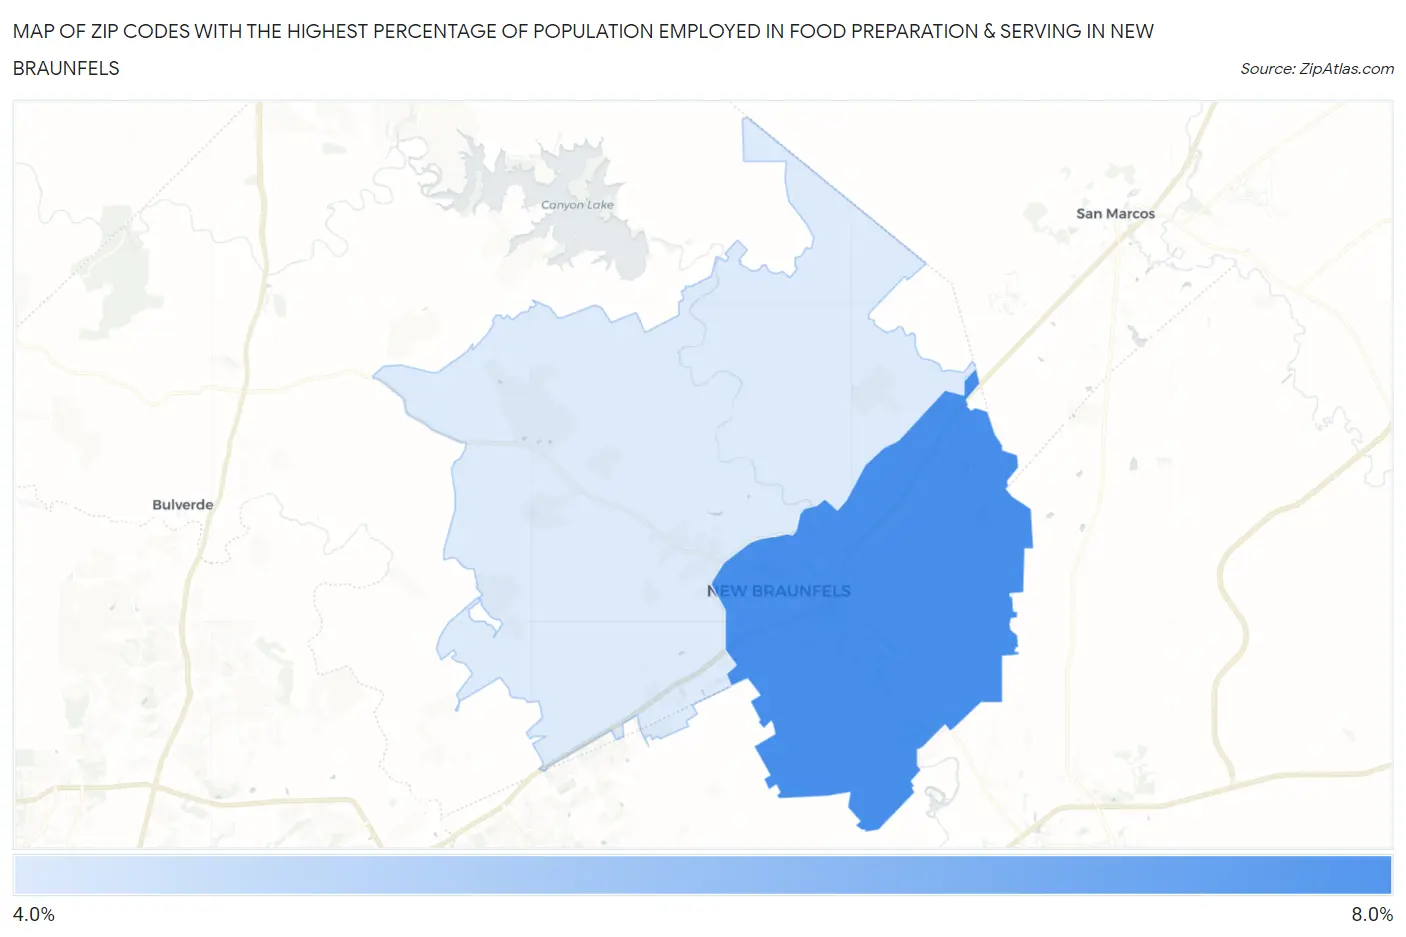
Map of Zip Codes with the Highest Percentage of Population Employed in Food Preparation & Serving in New Braunfels
4.3%
6.9%
Zip Codes with the Highest Percentage of Population Employed in Food Preparation & Serving in New Braunfels, TX
| Zip Code | % Employed | vs State | vs National | |
| 1. | 78130 | 6.9% | 5.4%(+1.54)#427 | 5.3%(+1.61)#6,839 |
| 2. | 78132 | 4.3% | 5.4%(-1.01)#956 | 5.3%(-0.947)#15,704 |
1
Common Questions
What are the Top Zip Codes with the Highest Percentage of Population Employed in Food Preparation & Serving in New Braunfels, TX?
Top Zip Codes with the Highest Percentage of Population Employed in Food Preparation & Serving in New Braunfels, TX are:
What zip code has the Highest Percentage of Population Employed in Food Preparation & Serving in New Braunfels, TX?
78130 has the Highest Percentage of Population Employed in Food Preparation & Serving in New Braunfels, TX with 6.9%.
What is the Percentage of Population Employed in Food Preparation & Serving in New Braunfels, TX?
Percentage of Population Employed in Food Preparation & Serving in New Braunfels is 6.7%.
What is the Percentage of Population Employed in Food Preparation & Serving in Texas?
Percentage of Population Employed in Food Preparation & Serving in Texas is 5.4%.
What is the Percentage of Population Employed in Food Preparation & Serving in the United States?
Percentage of Population Employed in Food Preparation & Serving in the United States is 5.3%.