Zip Codes with the Highest Percentage of Population Employed in Food Preparation & Serving in Lubbock, TX
RELATED REPORTS & OPTIONS
Food Preparation & Serving
Lubbock
Compare Zip Codes
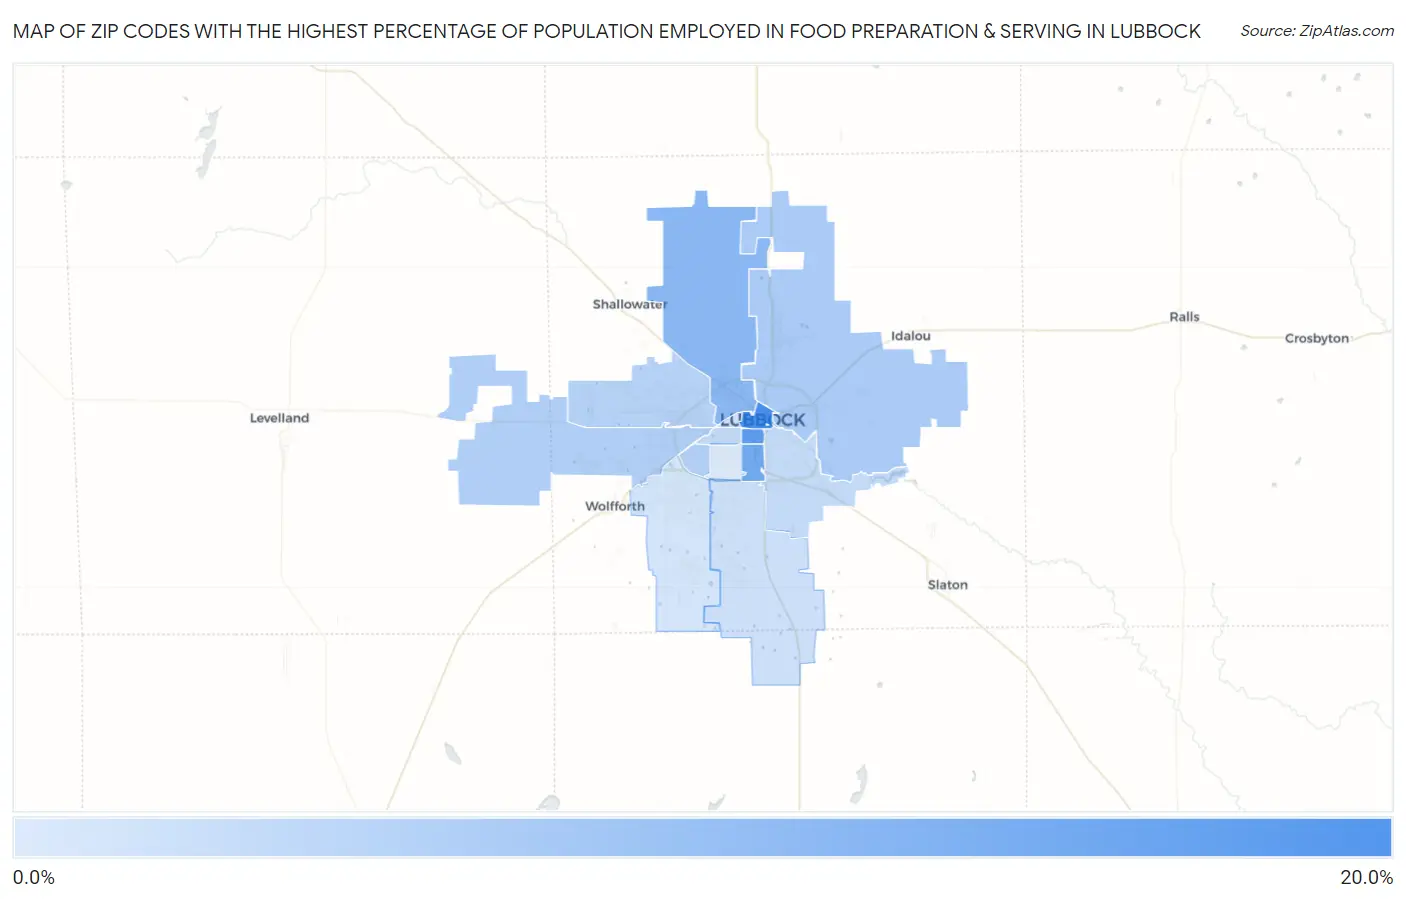
Map of Zip Codes with the Highest Percentage of Population Employed in Food Preparation & Serving in Lubbock
2.8%
18.0%
Zip Codes with the Highest Percentage of Population Employed in Food Preparation & Serving in Lubbock, TX
| Zip Code | % Employed | vs State | vs National | |
| 1. | 79401 | 18.0% | 5.4%(+12.7)#38 | 5.3%(+12.7)#658 |
| 2. | 79411 | 15.5% | 5.4%(+10.1)#51 | 5.3%(+10.2)#922 |
| 3. | 79412 | 13.4% | 5.4%(+8.01)#74 | 5.3%(+8.08)#1,298 |
| 4. | 79415 | 10.9% | 5.4%(+5.52)#117 | 5.3%(+5.59)#2,120 |
| 5. | 79403 | 7.7% | 5.4%(+2.38)#322 | 5.3%(+2.44)#5,171 |
| 6. | 79407 | 6.9% | 5.4%(+1.56)#425 | 5.3%(+1.62)#6,796 |
| 7. | 79414 | 6.9% | 5.4%(+1.55)#426 | 5.3%(+1.62)#6,806 |
| 8. | 79416 | 6.5% | 5.4%(+1.13)#489 | 5.3%(+1.19)#7,939 |
| 9. | 79404 | 5.3% | 5.4%(-0.028)#724 | 5.3%(+0.037)#11,676 |
| 10. | 79410 | 5.2% | 5.4%(-0.112)#742 | 5.3%(-0.047)#11,990 |
| 11. | 79423 | 4.4% | 5.4%(-0.933)#938 | 5.3%(-0.868)#15,337 |
| 12. | 79406 | 4.3% | 5.4%(-1.02)#958 | 5.3%(-0.957)#15,745 |
| 13. | 79424 | 3.6% | 5.4%(-1.79)#1,141 | 5.3%(-1.73)#18,965 |
| 14. | 79413 | 2.8% | 5.4%(-2.57)#1,310 | 5.3%(-2.50)#22,115 |
1
Common Questions
What are the Top 10 Zip Codes with the Highest Percentage of Population Employed in Food Preparation & Serving in Lubbock, TX?
Top 10 Zip Codes with the Highest Percentage of Population Employed in Food Preparation & Serving in Lubbock, TX are:
What zip code has the Highest Percentage of Population Employed in Food Preparation & Serving in Lubbock, TX?
79401 has the Highest Percentage of Population Employed in Food Preparation & Serving in Lubbock, TX with 18.0%.
What is the Percentage of Population Employed in Food Preparation & Serving in Lubbock, TX?
Percentage of Population Employed in Food Preparation & Serving in Lubbock is 6.9%.
What is the Percentage of Population Employed in Food Preparation & Serving in Texas?
Percentage of Population Employed in Food Preparation & Serving in Texas is 5.4%.
What is the Percentage of Population Employed in Food Preparation & Serving in the United States?
Percentage of Population Employed in Food Preparation & Serving in the United States is 5.3%.