Zip Codes with the Highest Percentage of Population Employed in Food Preparation & Serving in Midland, TX
RELATED REPORTS & OPTIONS
Food Preparation & Serving
Midland
Compare Zip Codes
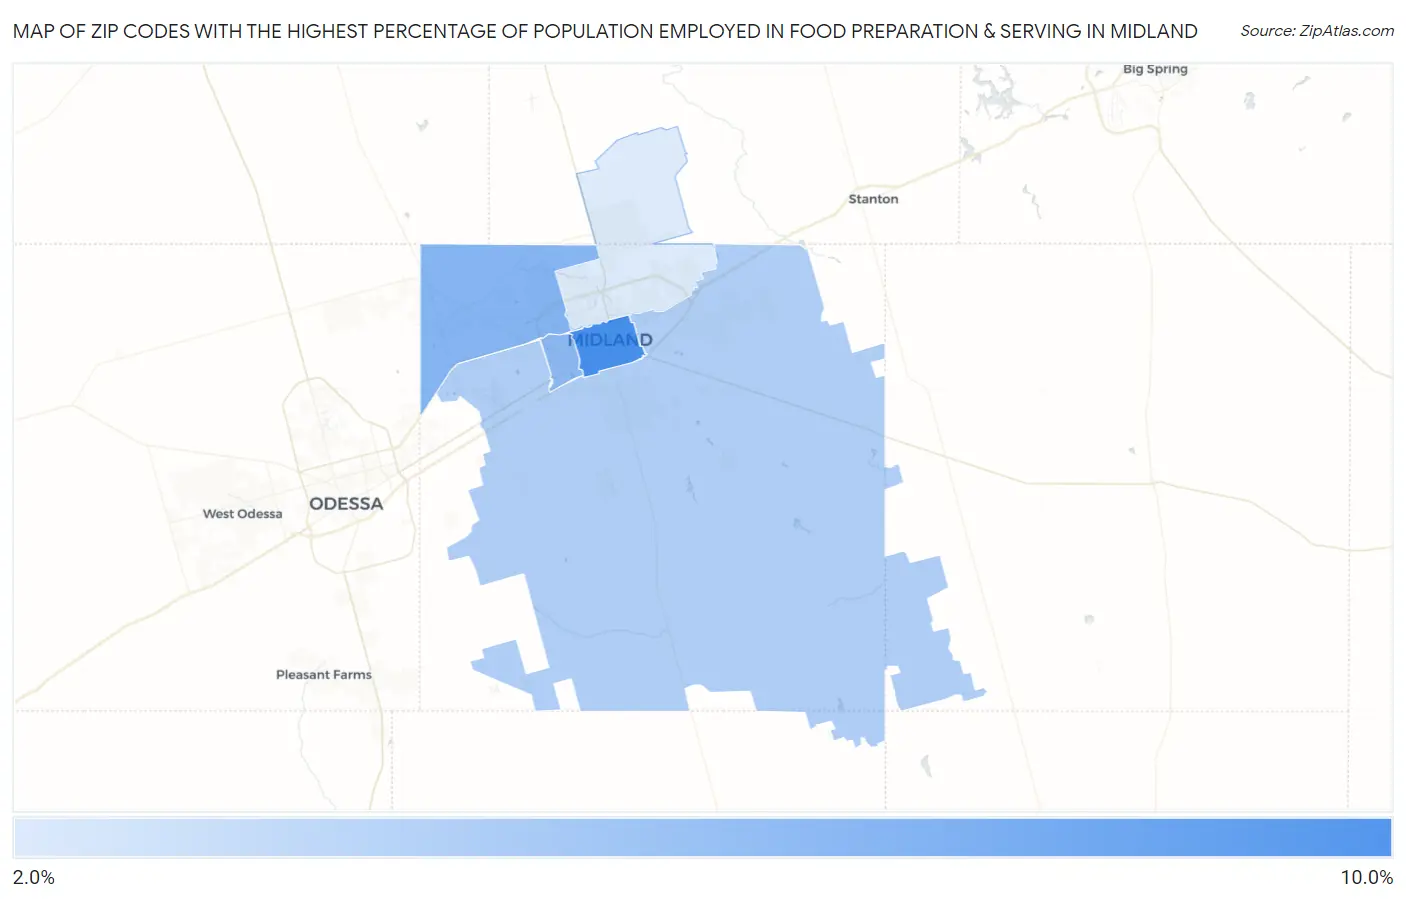
Map of Zip Codes with the Highest Percentage of Population Employed in Food Preparation & Serving in Midland
2.2%
8.1%
Zip Codes with the Highest Percentage of Population Employed in Food Preparation & Serving in Midland, TX
| Zip Code | % Employed | vs State | vs National | |
| 1. | 79701 | 8.1% | 5.4%(+2.78)#276 | 5.3%(+2.85)#4,535 |
| 2. | 79707 | 5.6% | 5.4%(+0.290)#637 | 5.3%(+0.355)#10,552 |
| 3. | 79703 | 5.4% | 5.4%(+0.048)#694 | 5.3%(+0.114)#11,405 |
| 4. | 79706 | 4.0% | 5.4%(-1.32)#1,034 | 5.3%(-1.25)#16,997 |
| 5. | 79705 | 2.2% | 5.4%(-3.13)#1,401 | 5.3%(-3.07)#24,048 |
1
Common Questions
What are the Top 3 Zip Codes with the Highest Percentage of Population Employed in Food Preparation & Serving in Midland, TX?
Top 3 Zip Codes with the Highest Percentage of Population Employed in Food Preparation & Serving in Midland, TX are:
What zip code has the Highest Percentage of Population Employed in Food Preparation & Serving in Midland, TX?
79701 has the Highest Percentage of Population Employed in Food Preparation & Serving in Midland, TX with 8.1%.
What is the Percentage of Population Employed in Food Preparation & Serving in Midland, TX?
Percentage of Population Employed in Food Preparation & Serving in Midland is 4.8%.
What is the Percentage of Population Employed in Food Preparation & Serving in Texas?
Percentage of Population Employed in Food Preparation & Serving in Texas is 5.4%.
What is the Percentage of Population Employed in Food Preparation & Serving in the United States?
Percentage of Population Employed in Food Preparation & Serving in the United States is 5.3%.