Zip Codes with the Highest Percentage of Population Employed in Food Preparation & Serving in Abilene, TX
RELATED REPORTS & OPTIONS
Food Preparation & Serving
Abilene
Compare Zip Codes
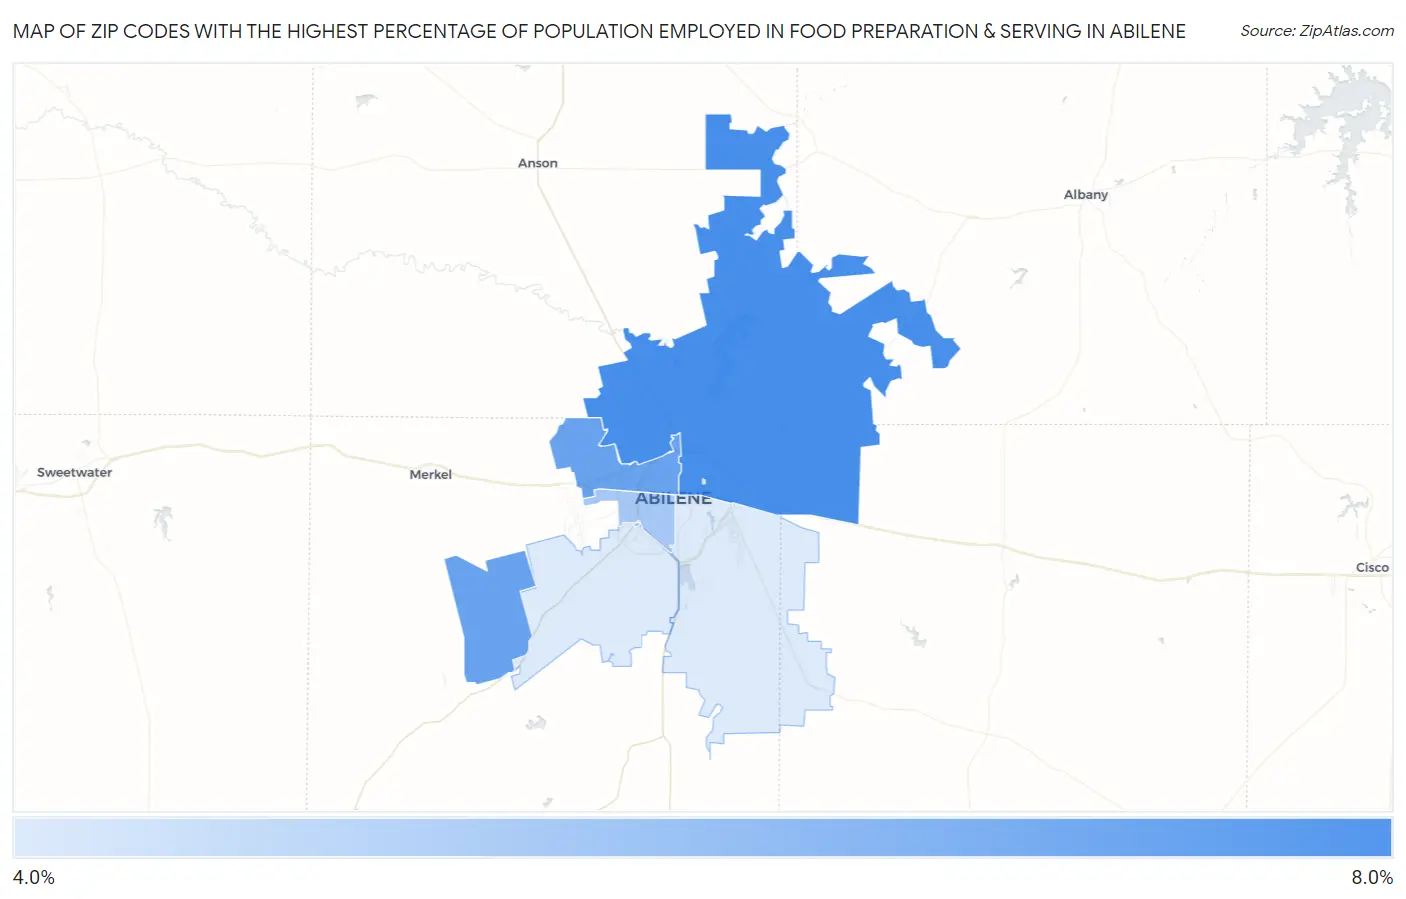
Map of Zip Codes with the Highest Percentage of Population Employed in Food Preparation & Serving in Abilene
4.2%
7.8%
Zip Codes with the Highest Percentage of Population Employed in Food Preparation & Serving in Abilene, TX
| Zip Code | % Employed | vs State | vs National | |
| 1. | 79601 | 7.8% | 5.4%(+2.48)#307 | 5.3%(+2.55)#4,990 |
| 2. | 79603 | 7.1% | 5.4%(+1.71)#404 | 5.3%(+1.77)#6,427 |
| 3. | 79605 | 5.6% | 5.4%(+0.207)#658 | 5.3%(+0.273)#10,845 |
| 4. | 79606 | 4.2% | 5.4%(-1.11)#984 | 5.3%(-1.05)#16,161 |
| 5. | 79602 | 4.2% | 5.4%(-1.13)#986 | 5.3%(-1.06)#16,209 |
1
Common Questions
What are the Top 5 Zip Codes with the Highest Percentage of Population Employed in Food Preparation & Serving in Abilene, TX?
Top 5 Zip Codes with the Highest Percentage of Population Employed in Food Preparation & Serving in Abilene, TX are:
What zip code has the Highest Percentage of Population Employed in Food Preparation & Serving in Abilene, TX?
79601 has the Highest Percentage of Population Employed in Food Preparation & Serving in Abilene, TX with 7.8%.
What is the Percentage of Population Employed in Food Preparation & Serving in Abilene, TX?
Percentage of Population Employed in Food Preparation & Serving in Abilene is 6.0%.
What is the Percentage of Population Employed in Food Preparation & Serving in Texas?
Percentage of Population Employed in Food Preparation & Serving in Texas is 5.4%.
What is the Percentage of Population Employed in Food Preparation & Serving in the United States?
Percentage of Population Employed in Food Preparation & Serving in the United States is 5.3%.