Zip Codes with the Highest Percentage of Population Employed in Food Preparation & Serving in Galveston, TX
RELATED REPORTS & OPTIONS
Food Preparation & Serving
Galveston
Compare Zip Codes
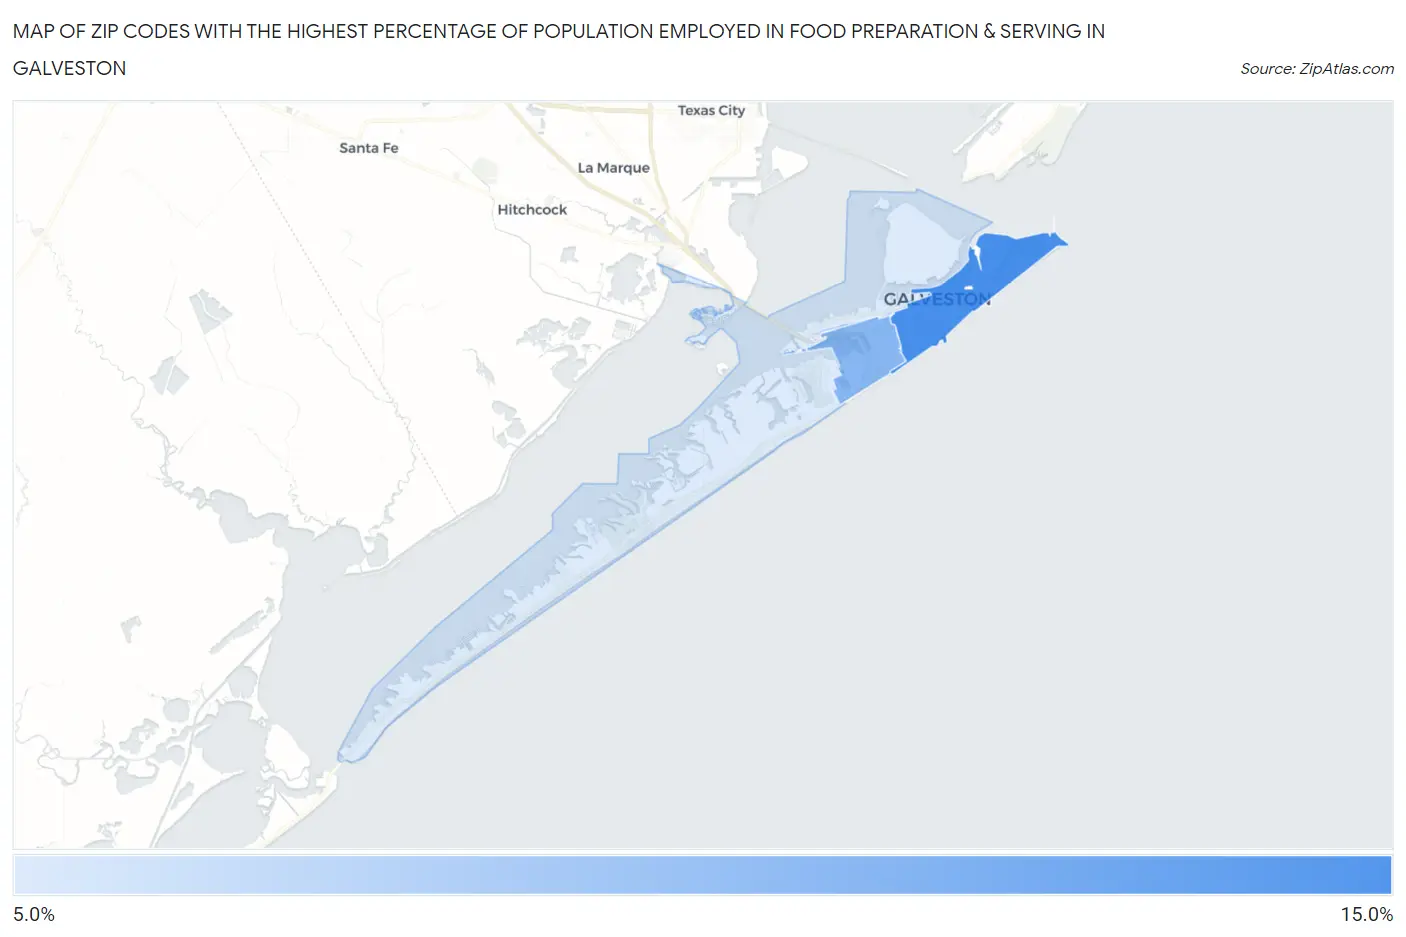
Map of Zip Codes with the Highest Percentage of Population Employed in Food Preparation & Serving in Galveston
5.2%
11.3%
Zip Codes with the Highest Percentage of Population Employed in Food Preparation & Serving in Galveston, TX
| Zip Code | % Employed | vs State | vs National | |
| 1. | 77550 | 11.3% | 5.4%(+5.93)#103 | 5.3%(+6.00)#1,923 |
| 2. | 77551 | 8.6% | 5.4%(+3.26)#233 | 5.3%(+3.32)#3,958 |
| 3. | 77554 | 5.2% | 5.4%(-0.126)#744 | 5.3%(-0.061)#12,044 |
1
Common Questions
What are the Top Zip Codes with the Highest Percentage of Population Employed in Food Preparation & Serving in Galveston, TX?
Top Zip Codes with the Highest Percentage of Population Employed in Food Preparation & Serving in Galveston, TX are:
What zip code has the Highest Percentage of Population Employed in Food Preparation & Serving in Galveston, TX?
77550 has the Highest Percentage of Population Employed in Food Preparation & Serving in Galveston, TX with 11.3%.
What is the Percentage of Population Employed in Food Preparation & Serving in Galveston, TX?
Percentage of Population Employed in Food Preparation & Serving in Galveston is 9.5%.
What is the Percentage of Population Employed in Food Preparation & Serving in Texas?
Percentage of Population Employed in Food Preparation & Serving in Texas is 5.4%.
What is the Percentage of Population Employed in Food Preparation & Serving in the United States?
Percentage of Population Employed in Food Preparation & Serving in the United States is 5.3%.