Zip Codes with the Highest Percentage of Population Employed in Food Preparation & Serving in College Station, TX
RELATED REPORTS & OPTIONS
Food Preparation & Serving
College Station
Compare Zip Codes
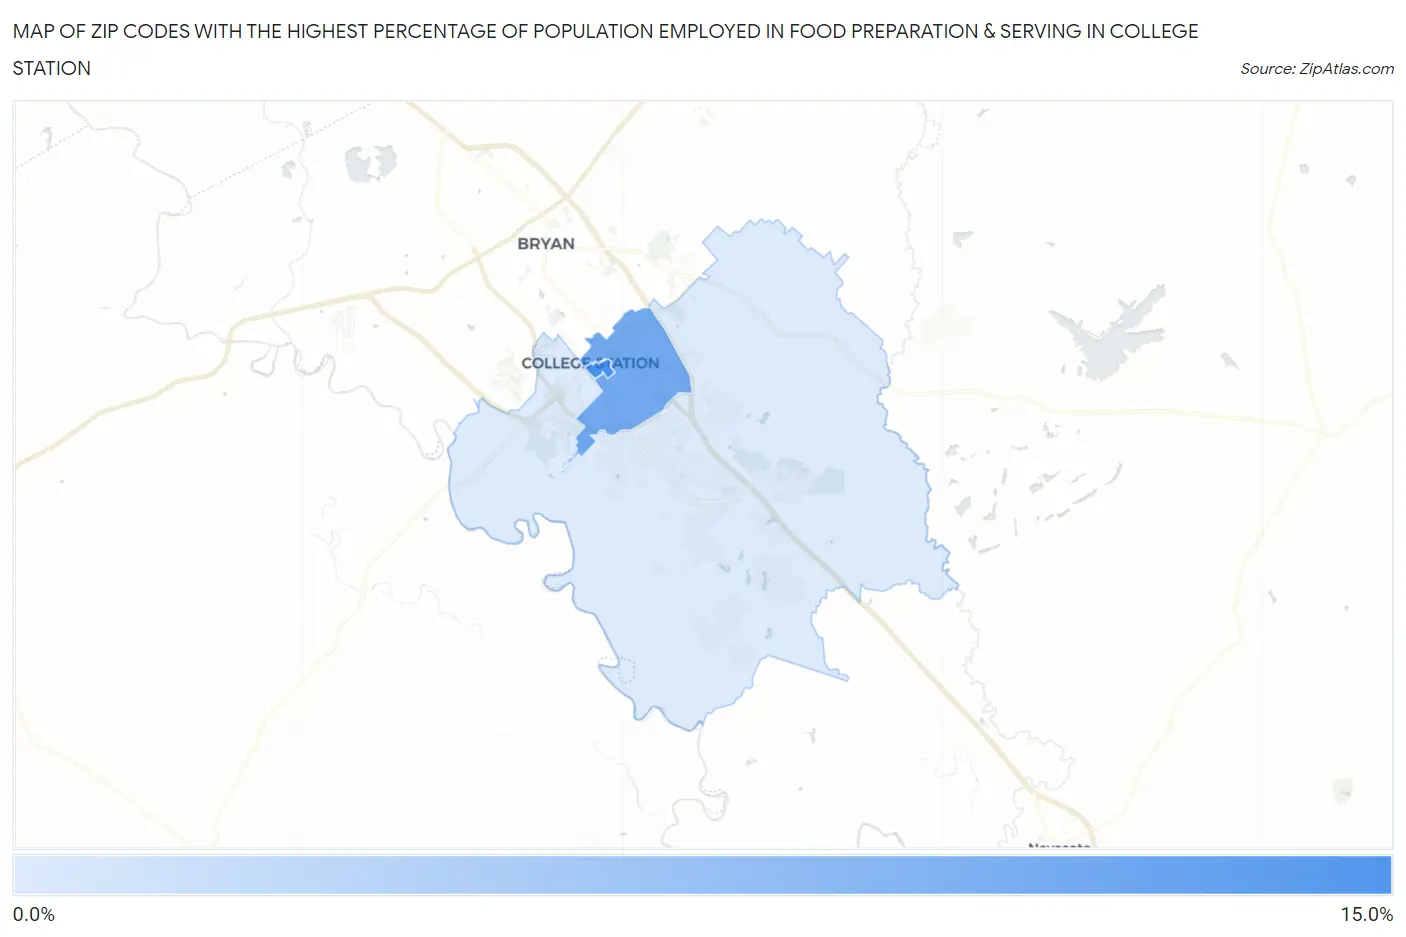
Map of Zip Codes with the Highest Percentage of Population Employed in Food Preparation & Serving in College Station
4.5%
11.6%
Zip Codes with the Highest Percentage of Population Employed in Food Preparation & Serving in College Station, TX
| Zip Code | % Employed | vs State | vs National | |
| 1. | 77843 | 11.6% | 5.4%(+6.22)#98 | 5.3%(+6.28)#1,823 |
| 2. | 77840 | 9.5% | 5.4%(+4.11)#166 | 5.3%(+4.17)#3,088 |
| 3. | 77845 | 4.5% | 5.4%(-0.878)#930 | 5.3%(-0.813)#15,131 |
1
Common Questions
What are the Top Zip Codes with the Highest Percentage of Population Employed in Food Preparation & Serving in College Station, TX?
Top Zip Codes with the Highest Percentage of Population Employed in Food Preparation & Serving in College Station, TX are:
What zip code has the Highest Percentage of Population Employed in Food Preparation & Serving in College Station, TX?
77843 has the Highest Percentage of Population Employed in Food Preparation & Serving in College Station, TX with 11.6%.
What is the Percentage of Population Employed in Food Preparation & Serving in College Station, TX?
Percentage of Population Employed in Food Preparation & Serving in College Station is 7.2%.
What is the Percentage of Population Employed in Food Preparation & Serving in Texas?
Percentage of Population Employed in Food Preparation & Serving in Texas is 5.4%.
What is the Percentage of Population Employed in Food Preparation & Serving in the United States?
Percentage of Population Employed in Food Preparation & Serving in the United States is 5.3%.