La Tina Ranch, TX Map & Demographics
La Tina Ranch Map
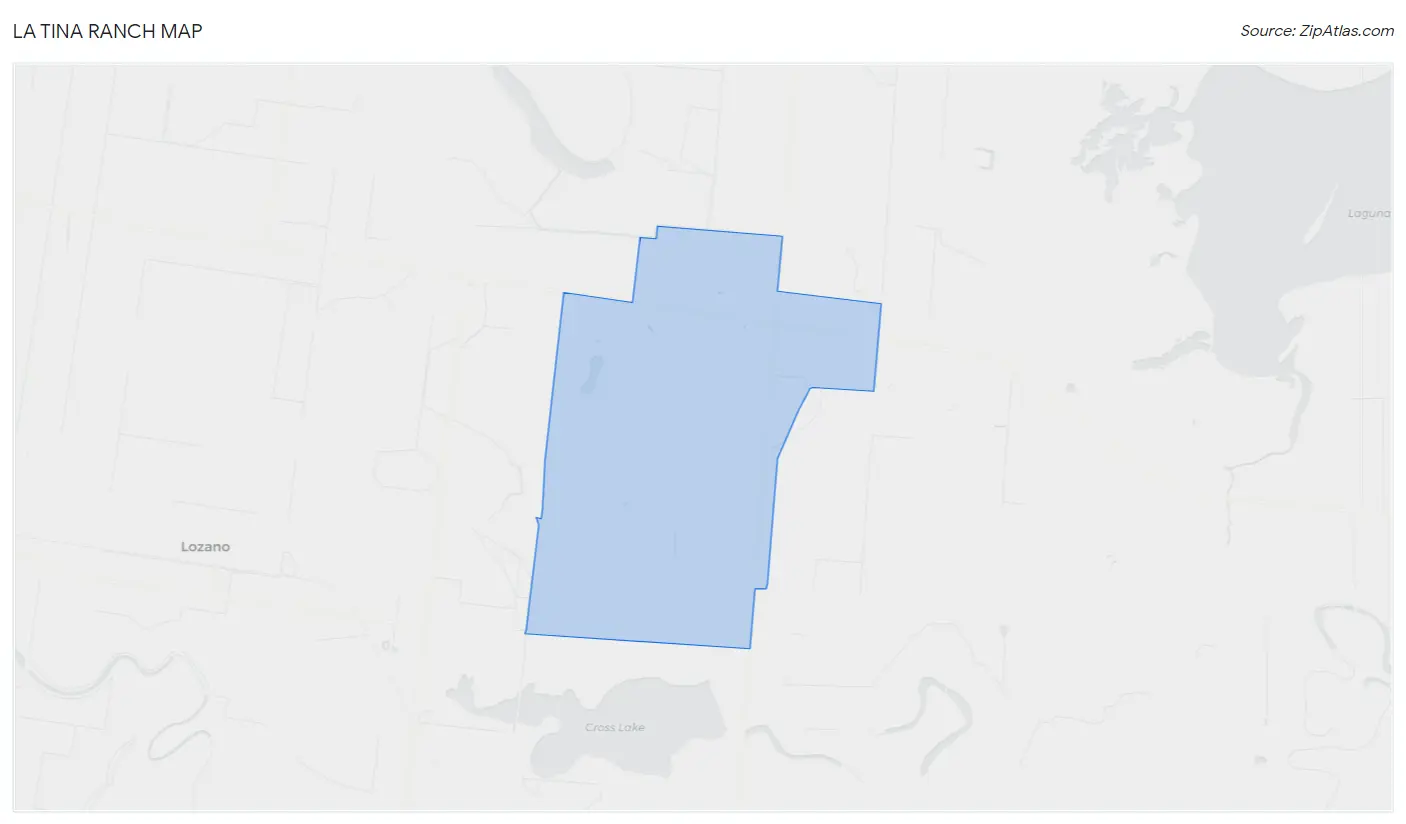
La Tina Ranch Overview
$13,703
PER CAPITA INCOME
$22,000
AVG FAMILY INCOME
$22,000
AVG HOUSEHOLD INCOME
0.45
INEQUALITY / GINI INDEX
725
TOTAL POPULATION
370
MALE POPULATION
355
FEMALE POPULATION
104.23
MALES / 100 FEMALES
95.95
FEMALES / 100 MALES
26.4
MEDIAN AGE
3.5
AVG FAMILY SIZE
3.5
AVG HOUSEHOLD SIZE
329
LABOR FORCE [ PEOPLE ]
66.9%
PERCENT IN LABOR FORCE
Income in La Tina Ranch
Income Overview in La Tina Ranch
Per Capita Income in La Tina Ranch is $13,703, while median incomes of families and households are $22,000 and $22,000 respectively.
| Characteristic | Number | Measure |
| Per Capita Income | 725 | $13,703 |
| Median Family Income | 204 | $22,000 |
| Mean Family Income | 204 | $48,833 |
| Median Household Income | 204 | $22,000 |
| Mean Household Income | 204 | $48,833 |
| Income Deficit | 204 | $0 |
| Wage / Income Gap (%) | 725 | 0.00% |
| Wage / Income Gap ($) | 725 | 100.00¢ per $1 |
| Gini / Inequality Index | 725 | 0.45 |
Earnings by Sex in La Tina Ranch
| Sex | Number | Average Earnings |
| Male | 171 (52.0%) | $0 |
| Female | 158 (48.0%) | $0 |
| Total | 329 (100.0%) | $0 |
Earnings by Sex by Income Bracket in La Tina Ranch
The most common earnings brackets in La Tina Ranch are $75,000 to $99,999 for men (62 | 36.3%) and $10,000 to $12,499 for women (50 | 31.7%).
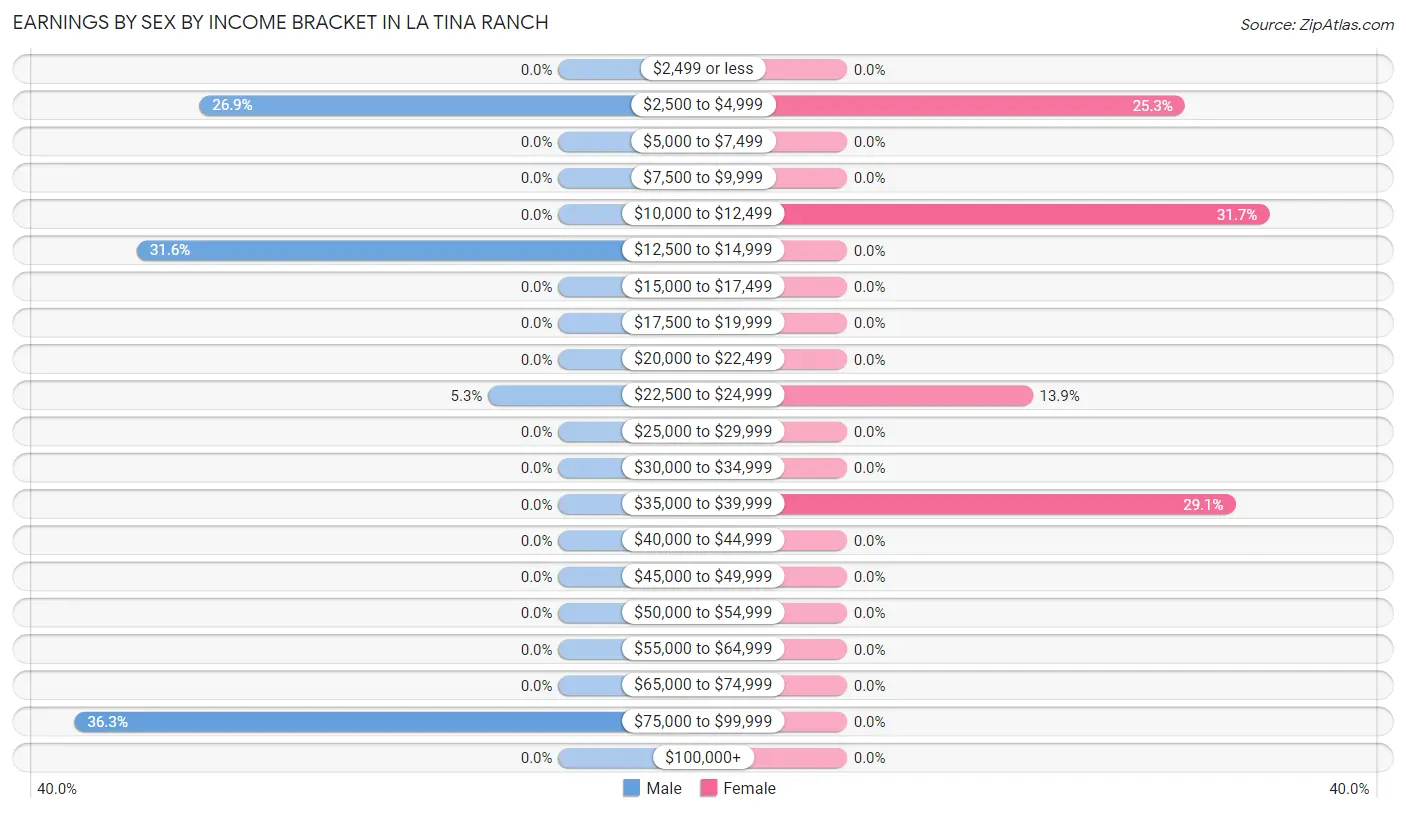
| Income | Male | Female |
| $2,499 or less | 0 (0.0%) | 0 (0.0%) |
| $2,500 to $4,999 | 46 (26.9%) | 40 (25.3%) |
| $5,000 to $7,499 | 0 (0.0%) | 0 (0.0%) |
| $7,500 to $9,999 | 0 (0.0%) | 0 (0.0%) |
| $10,000 to $12,499 | 0 (0.0%) | 50 (31.7%) |
| $12,500 to $14,999 | 54 (31.6%) | 0 (0.0%) |
| $15,000 to $17,499 | 0 (0.0%) | 0 (0.0%) |
| $17,500 to $19,999 | 0 (0.0%) | 0 (0.0%) |
| $20,000 to $22,499 | 0 (0.0%) | 0 (0.0%) |
| $22,500 to $24,999 | 9 (5.3%) | 22 (13.9%) |
| $25,000 to $29,999 | 0 (0.0%) | 0 (0.0%) |
| $30,000 to $34,999 | 0 (0.0%) | 0 (0.0%) |
| $35,000 to $39,999 | 0 (0.0%) | 46 (29.1%) |
| $40,000 to $44,999 | 0 (0.0%) | 0 (0.0%) |
| $45,000 to $49,999 | 0 (0.0%) | 0 (0.0%) |
| $50,000 to $54,999 | 0 (0.0%) | 0 (0.0%) |
| $55,000 to $64,999 | 0 (0.0%) | 0 (0.0%) |
| $65,000 to $74,999 | 0 (0.0%) | 0 (0.0%) |
| $75,000 to $99,999 | 62 (36.3%) | 0 (0.0%) |
| $100,000+ | 0 (0.0%) | 0 (0.0%) |
| Total | 171 (100.0%) | 158 (100.0%) |
Earnings by Sex by Educational Attainment in La Tina Ranch
| Educational Attainment | Male Income | Female Income |
| Less than High School | - | - |
| High School Diploma | - | - |
| College or Associate's Degree | - | - |
| Bachelor's Degree | - | - |
| Graduate Degree | - | - |
| Total | - | - |
Family Income in La Tina Ranch
Family Income Brackets in La Tina Ranch
According to the La Tina Ranch family income data, there are 56 families falling into the $15,000 to $24,999 income range, which is the most common income bracket and makes up 27.5% of all families.
| Income Bracket | # Families | % Families |
| Less than $10,000 | 0 | 0.0% |
| $10,000 to $14,999 | 54 | 26.5% |
| $15,000 to $24,999 | 56 | 27.5% |
| $25,000 to $34,999 | 22 | 10.8% |
| $35,000 to $49,999 | 10 | 4.9% |
| $50,000 to $74,999 | 0 | 0.0% |
| $75,000 to $99,999 | 12 | 5.9% |
| $100,000 to $149,999 | 50 | 24.5% |
| $150,000 to $199,999 | 0 | 0.0% |
| $200,000+ | 0 | 0.0% |
Family Income by Famaliy Size in La Tina Ranch
3-person families (84 | 41.2%) account for the highest median family income in La Tina Ranch with $117,900 per family, while 3-person families (84 | 41.2%) have the highest median income of $39,300 per family member.
| Income Bracket | # Families | Median Income |
| 2-Person Families | 26 (12.8%) | $0 |
| 3-Person Families | 84 (41.2%) | $117,900 |
| 4-Person Families | 94 (46.1%) | $0 |
| 5-Person Families | 0 (0.0%) | $0 |
| 6-Person Families | 0 (0.0%) | $0 |
| 7+ Person Families | 0 (0.0%) | $0 |
| Total | 204 (100.0%) | $22,000 |
Family Income by Number of Earners in La Tina Ranch
| Number of Earners | # Families | Median Income |
| No Earners | 16 (7.8%) | $0 |
| 1 Earner | 98 (48.0%) | $0 |
| 2 Earners | 50 (24.5%) | $0 |
| 3+ Earners | 40 (19.6%) | $0 |
| Total | 204 (100.0%) | $22,000 |
Household Income in La Tina Ranch
Household Income Brackets in La Tina Ranch
With 56 households falling in the category, the $15,000 to $24,999 income range is the most frequent in La Tina Ranch, accounting for 27.5% of all households.
| Income Bracket | # Households | % Households |
| Less than $10,000 | 0 | 0.0% |
| $10,000 to $14,999 | 54 | 26.5% |
| $15,000 to $24,999 | 56 | 27.5% |
| $25,000 to $34,999 | 22 | 10.8% |
| $35,000 to $49,999 | 10 | 4.9% |
| $50,000 to $74,999 | 0 | 0.0% |
| $75,000 to $99,999 | 12 | 5.9% |
| $100,000 to $149,999 | 50 | 24.5% |
| $150,000 to $199,999 | 0 | 0.0% |
| $200,000+ | 0 | 0.0% |
Household Income by Householder Age in La Tina Ranch
| Income Bracket | # Households | Median Income |
| 15 to 24 Years | 0 (0.0%) | $0 |
| 25 to 44 Years | 22 (10.8%) | $0 |
| 45 to 64 Years | 156 (76.5%) | $0 |
| 65+ Years | 26 (12.8%) | $0 |
| Total | 204 (100.0%) | $22,000 |
Poverty in La Tina Ranch
Income Below Poverty by Sex and Age in La Tina Ranch
With 49.2% poverty level for males and 75.2% for females among the residents of La Tina Ranch, under 5 year old males and under 5 year old females are the most vulnerable to poverty, with 66 males (100.0%) and 46 females (100.0%) in their respective age groups living below the poverty level.
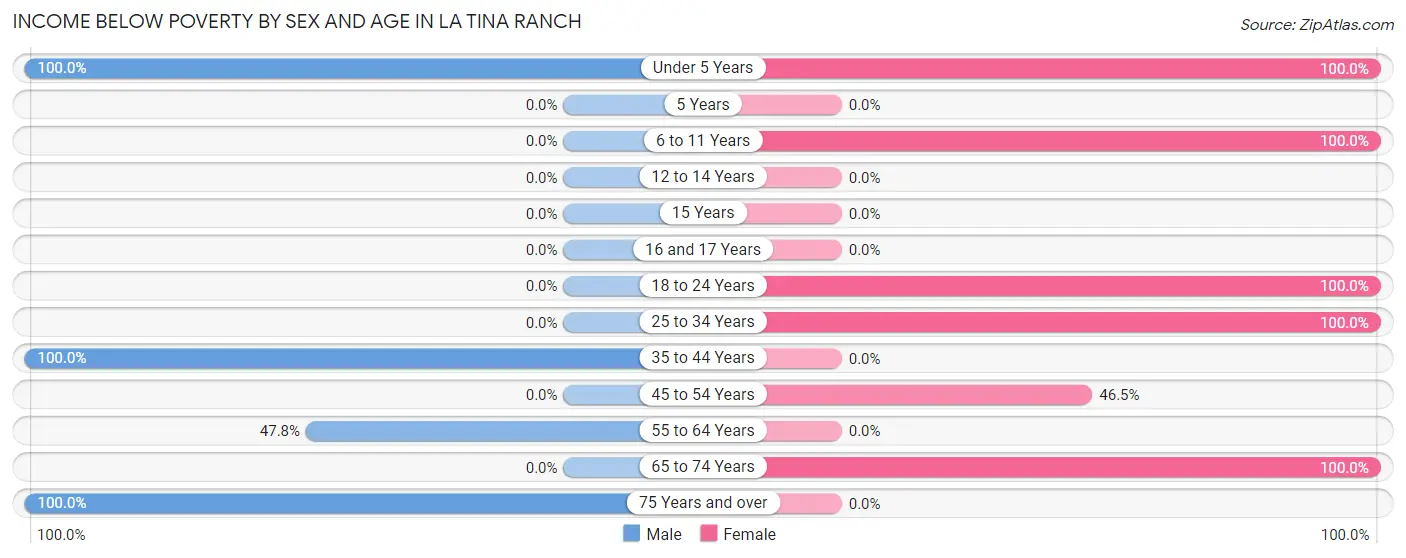
| Age Bracket | Male | Female |
| Under 5 Years | 66 (100.0%) | 46 (100.0%) |
| 5 Years | 0 (0.0%) | 0 (0.0%) |
| 6 to 11 Years | 0 (0.0%) | 60 (100.0%) |
| 12 to 14 Years | 0 (0.0%) | 0 (0.0%) |
| 15 Years | 0 (0.0%) | 0 (0.0%) |
| 16 and 17 Years | 0 (0.0%) | 0 (0.0%) |
| 18 to 24 Years | 0 (0.0%) | 50 (100.0%) |
| 25 to 34 Years | 0 (0.0%) | 55 (100.0%) |
| 35 to 44 Years | 46 (100.0%) | 0 (0.0%) |
| 45 to 54 Years | 0 (0.0%) | 40 (46.5%) |
| 55 to 64 Years | 54 (47.8%) | 0 (0.0%) |
| 65 to 74 Years | 0 (0.0%) | 16 (100.0%) |
| 75 Years and over | 16 (100.0%) | 0 (0.0%) |
| Total | 182 (49.2%) | 267 (75.2%) |
Income Above Poverty by Sex and Age in La Tina Ranch
According to the poverty statistics in La Tina Ranch, males aged 6 to 11 years and females aged 35 to 44 years are the age groups that are most secure financially, with 100.0% of males and 100.0% of females in these age groups living above the poverty line.
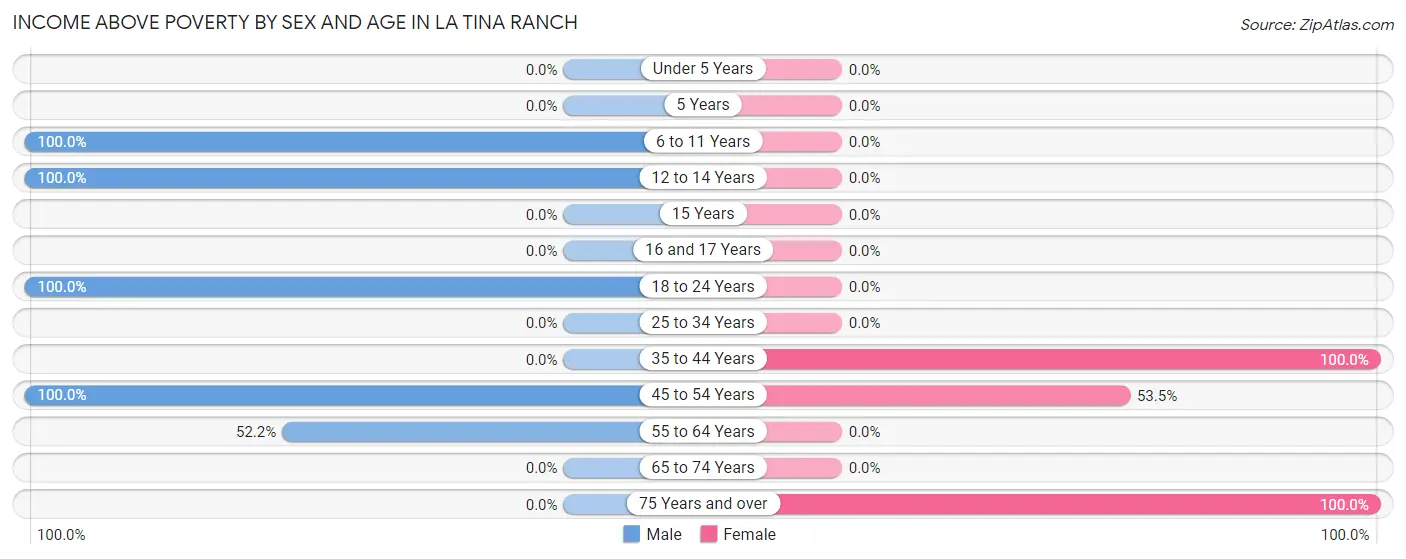
| Age Bracket | Male | Female |
| Under 5 Years | 0 (0.0%) | 0 (0.0%) |
| 5 Years | 0 (0.0%) | 0 (0.0%) |
| 6 to 11 Years | 47 (100.0%) | 0 (0.0%) |
| 12 to 14 Years | 14 (100.0%) | 0 (0.0%) |
| 15 Years | 0 (0.0%) | 0 (0.0%) |
| 16 and 17 Years | 0 (0.0%) | 0 (0.0%) |
| 18 to 24 Years | 56 (100.0%) | 0 (0.0%) |
| 25 to 34 Years | 0 (0.0%) | 0 (0.0%) |
| 35 to 44 Years | 0 (0.0%) | 32 (100.0%) |
| 45 to 54 Years | 12 (100.0%) | 46 (53.5%) |
| 55 to 64 Years | 59 (52.2%) | 0 (0.0%) |
| 65 to 74 Years | 0 (0.0%) | 0 (0.0%) |
| 75 Years and over | 0 (0.0%) | 10 (100.0%) |
| Total | 188 (50.8%) | 88 (24.8%) |
Income Below Poverty Among Married-Couple Families in La Tina Ranch
The poverty statistics for married-couple families in La Tina Ranch show that 47.5% or 56 of the total 118 families live below the poverty line. Families with 1 or 2 children have the highest poverty rate of 76.9%, comprising of 40 families. On the other hand, families with no children have the lowest poverty rate of 24.2%, which includes 16 families.
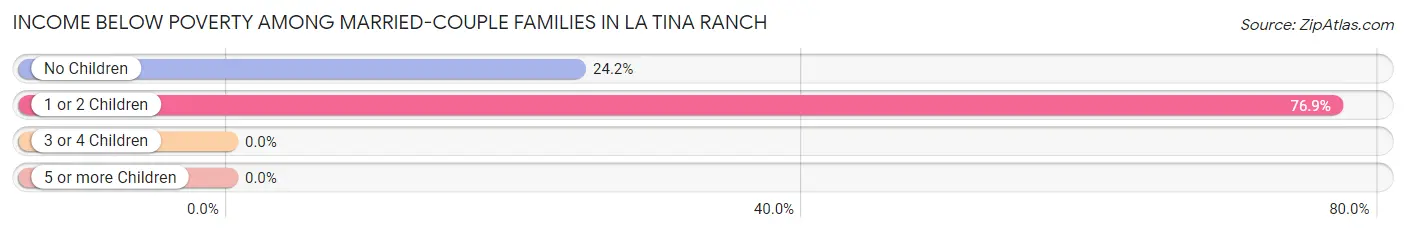
| Children | Above Poverty | Below Poverty |
| No Children | 50 (75.8%) | 16 (24.2%) |
| 1 or 2 Children | 12 (23.1%) | 40 (76.9%) |
| 3 or 4 Children | 0 (0.0%) | 0 (0.0%) |
| 5 or more Children | 0 (0.0%) | 0 (0.0%) |
| Total | 62 (52.5%) | 56 (47.5%) |
Income Below Poverty Among Single-Parent Households in La Tina Ranch
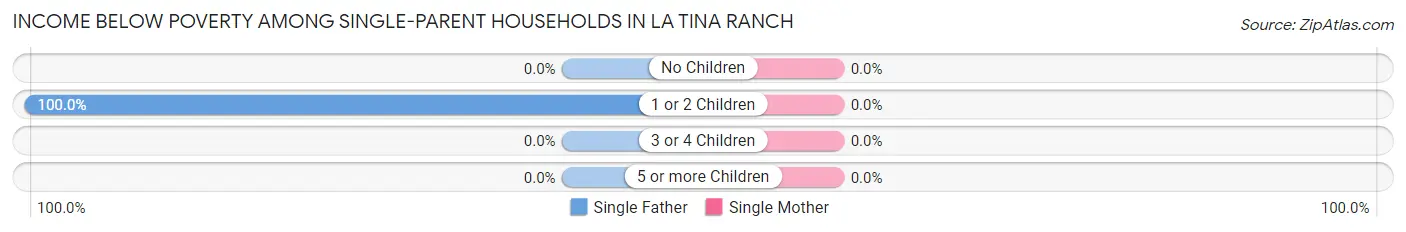
| Children | Single Father | Single Mother |
| No Children | 0 (0.0%) | 0 (0.0%) |
| 1 or 2 Children | 54 (100.0%) | 0 (0.0%) |
| 3 or 4 Children | 0 (0.0%) | 0 (0.0%) |
| 5 or more Children | 0 (0.0%) | 0 (0.0%) |
| Total | 54 (100.0%) | 0 (0.0%) |
Income Below Poverty Among Married-Couple vs Single-Parent Households in La Tina Ranch
The poverty data for La Tina Ranch shows that 56 of the married-couple family households (47.5%) and 54 of the single-parent households (62.8%) are living below the poverty level. Within the married-couple family households, those with 1 or 2 children have the highest poverty rate, with 40 households (76.9%) falling below the poverty line. Among the single-parent households, those with 1 or 2 children have the highest poverty rate, with 54 household (71.1%) living below poverty.
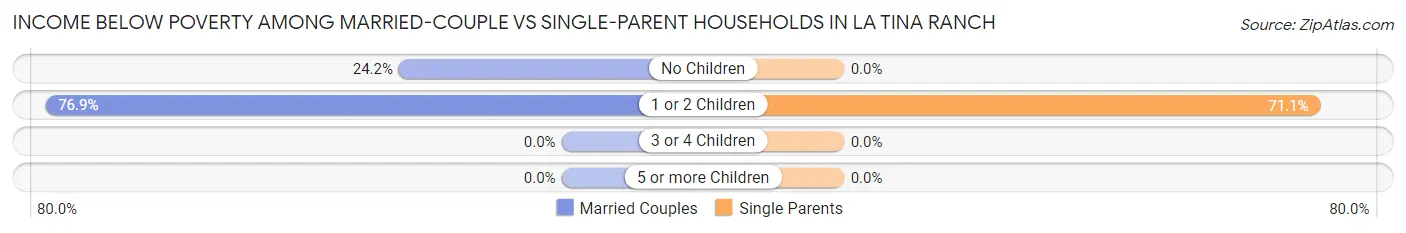
| Children | Married-Couple Families | Single-Parent Households |
| No Children | 16 (24.2%) | 0 (0.0%) |
| 1 or 2 Children | 40 (76.9%) | 54 (71.1%) |
| 3 or 4 Children | 0 (0.0%) | 0 (0.0%) |
| 5 or more Children | 0 (0.0%) | 0 (0.0%) |
| Total | 56 (47.5%) | 54 (62.8%) |
Race in La Tina Ranch
The most populous races in La Tina Ranch are Hispanic or Latino (711 | 98.1%), Some other Race (254 | 35.0%), and Two or more Races (236 | 32.6%).
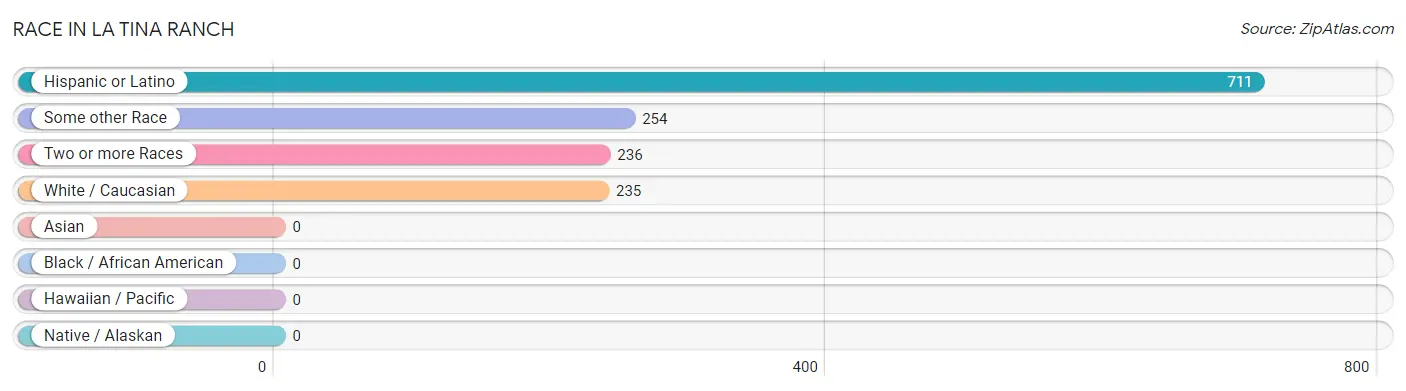
| Race | # Population | % Population |
| Asian | 0 | 0.0% |
| Black / African American | 0 | 0.0% |
| Hawaiian / Pacific | 0 | 0.0% |
| Hispanic or Latino | 711 | 98.1% |
| Native / Alaskan | 0 | 0.0% |
| White / Caucasian | 235 | 32.4% |
| Two or more Races | 236 | 32.6% |
| Some other Race | 254 | 35.0% |
| Total | 725 | 100.0% |
Ancestry in La Tina Ranch
The most populous ancestries reported in La Tina Ranch are , and Mexican (711 | 98.1%), together accounting for 98.1% of all La Tina Ranch residents.

| Ancestry | # Population | % Population |
| Mexican | 711 | 98.1% | View All 1 Rows |
Immigrants in La Tina Ranch
The most numerous immigrant groups reported in La Tina Ranch came from Central America (274 | 37.8%), Latin America (274 | 37.8%), and Mexico (274 | 37.8%), together accounting for 113.4% of all La Tina Ranch residents.
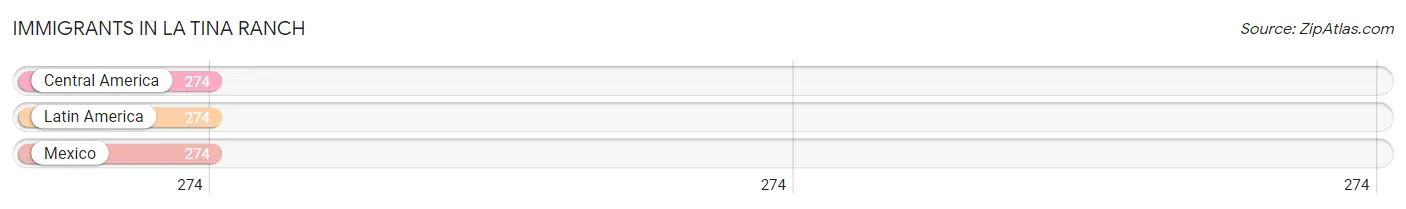
| Immigration Origin | # Population | % Population |
| Central America | 274 | 37.8% |
| Latin America | 274 | 37.8% |
| Mexico | 274 | 37.8% | View All 3 Rows |
Sex and Age in La Tina Ranch
Sex and Age in La Tina Ranch
The most populous age groups in La Tina Ranch are 55 to 59 Years (113 | 30.5%) for men and 5 to 9 Years (60 | 16.9%) for women.
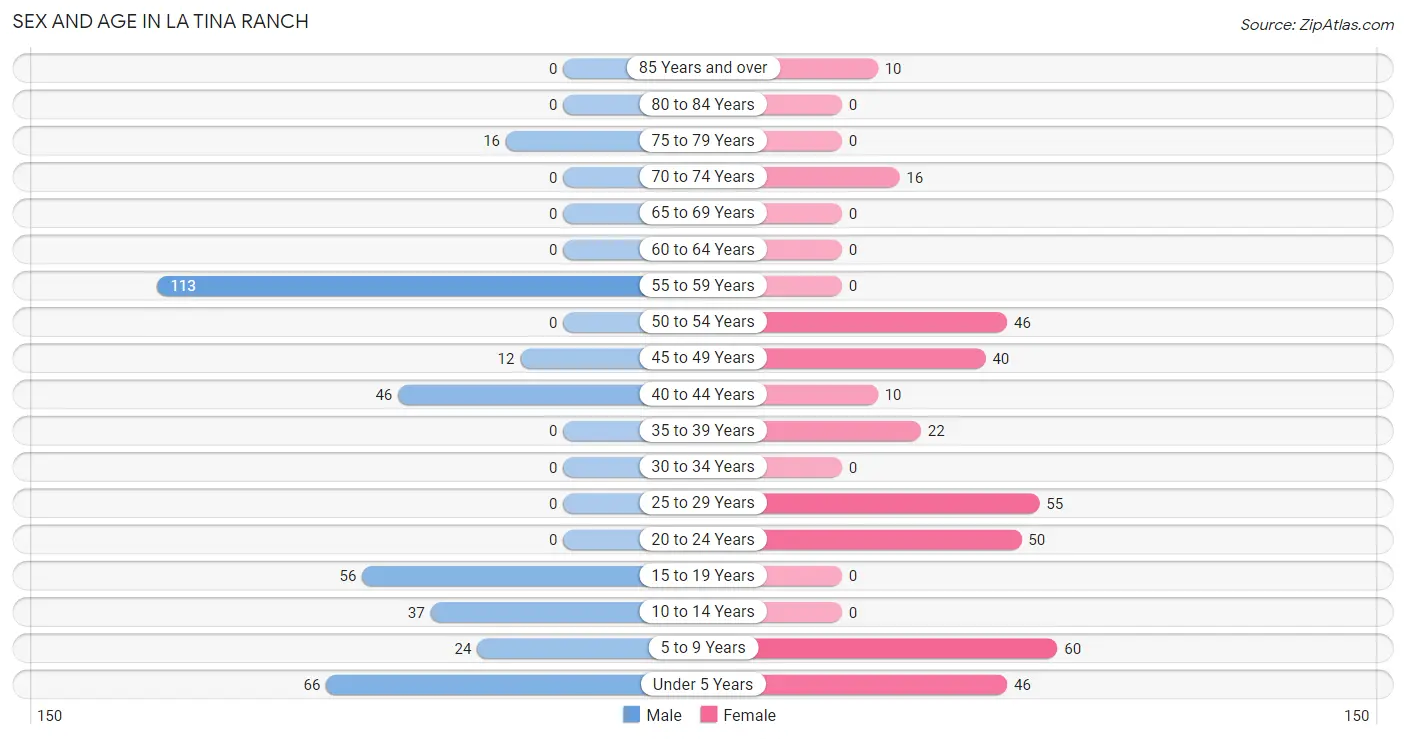
| Age Bracket | Male | Female |
| Under 5 Years | 66 (17.8%) | 46 (13.0%) |
| 5 to 9 Years | 24 (6.5%) | 60 (16.9%) |
| 10 to 14 Years | 37 (10.0%) | 0 (0.0%) |
| 15 to 19 Years | 56 (15.1%) | 0 (0.0%) |
| 20 to 24 Years | 0 (0.0%) | 50 (14.1%) |
| 25 to 29 Years | 0 (0.0%) | 55 (15.5%) |
| 30 to 34 Years | 0 (0.0%) | 0 (0.0%) |
| 35 to 39 Years | 0 (0.0%) | 22 (6.2%) |
| 40 to 44 Years | 46 (12.4%) | 10 (2.8%) |
| 45 to 49 Years | 12 (3.2%) | 40 (11.3%) |
| 50 to 54 Years | 0 (0.0%) | 46 (13.0%) |
| 55 to 59 Years | 113 (30.5%) | 0 (0.0%) |
| 60 to 64 Years | 0 (0.0%) | 0 (0.0%) |
| 65 to 69 Years | 0 (0.0%) | 0 (0.0%) |
| 70 to 74 Years | 0 (0.0%) | 16 (4.5%) |
| 75 to 79 Years | 16 (4.3%) | 0 (0.0%) |
| 80 to 84 Years | 0 (0.0%) | 0 (0.0%) |
| 85 Years and over | 0 (0.0%) | 10 (2.8%) |
| Total | 370 (100.0%) | 355 (100.0%) |
Families and Households in La Tina Ranch
Median Family Size in La Tina Ranch
The median family size in La Tina Ranch is 3.55 persons per family, with single male/father families (54 | 26.5%) accounting for the largest median family size of 4.35 persons per family. On the other hand, single female/mother families (32 | 15.7%) represent the smallest median family size with 2.75 persons per family.
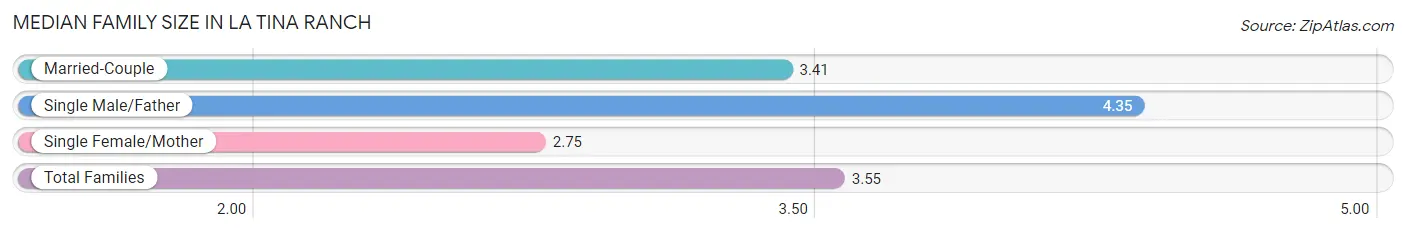
| Family Type | # Families | Family Size |
| Married-Couple | 118 (57.8%) | 3.41 |
| Single Male/Father | 54 (26.5%) | 4.35 |
| Single Female/Mother | 32 (15.7%) | 2.75 |
| Total Families | 204 (100.0%) | 3.55 |
Median Household Size in La Tina Ranch
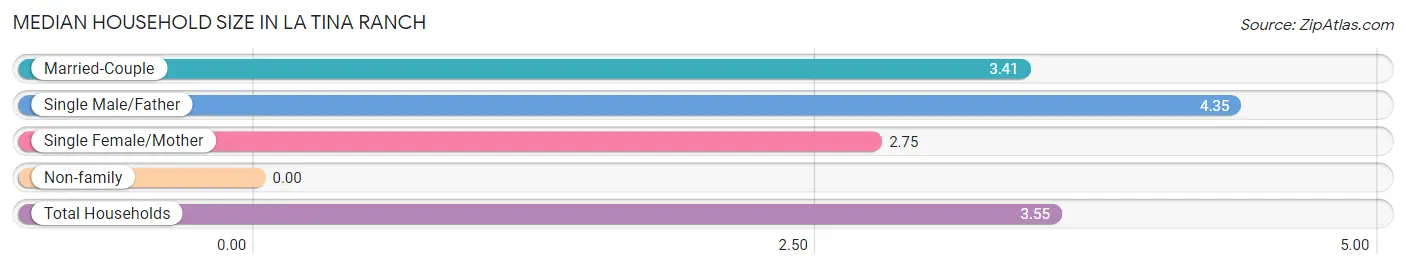
| Household Type | # Households | Household Size |
| Married-Couple | 118 (57.8%) | 3.41 |
| Single Male/Father | 54 (26.5%) | 4.35 |
| Single Female/Mother | 32 (15.7%) | 2.75 |
| Non-family | 0 (0.0%) | - |
| Total Households | 204 (100.0%) | 3.55 |
Household Size by Marriage Status in La Tina Ranch
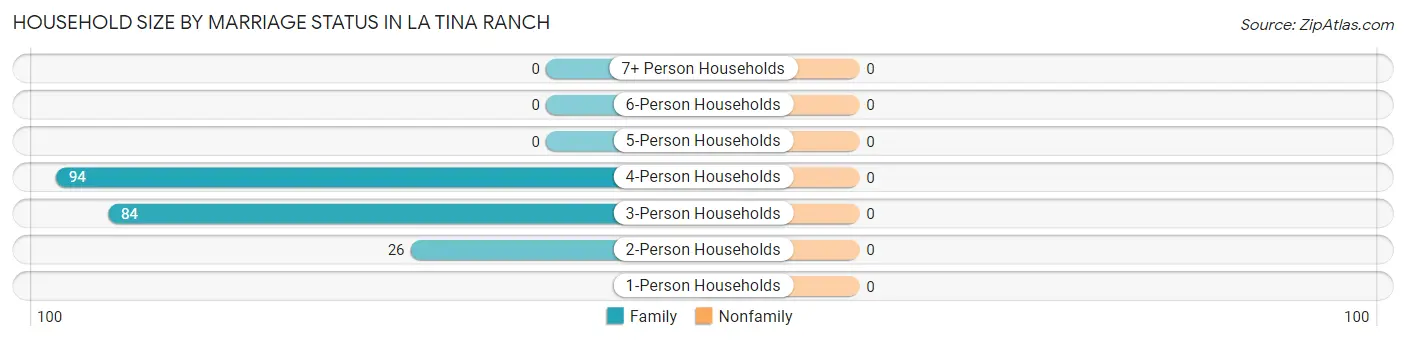
| Household Size | Family Households | Nonfamily Households |
| 1-Person Households | - | 0 (0.0%) |
| 2-Person Households | 26 (12.8%) | 0 (0.0%) |
| 3-Person Households | 84 (41.2%) | 0 (0.0%) |
| 4-Person Households | 94 (46.1%) | 0 (0.0%) |
| 5-Person Households | 0 (0.0%) | 0 (0.0%) |
| 6-Person Households | 0 (0.0%) | 0 (0.0%) |
| 7+ Person Households | 0 (0.0%) | 0 (0.0%) |
| Total | 204 (100.0%) | 0 (0.0%) |
Female Fertility in La Tina Ranch
Fertility by Age in La Tina Ranch
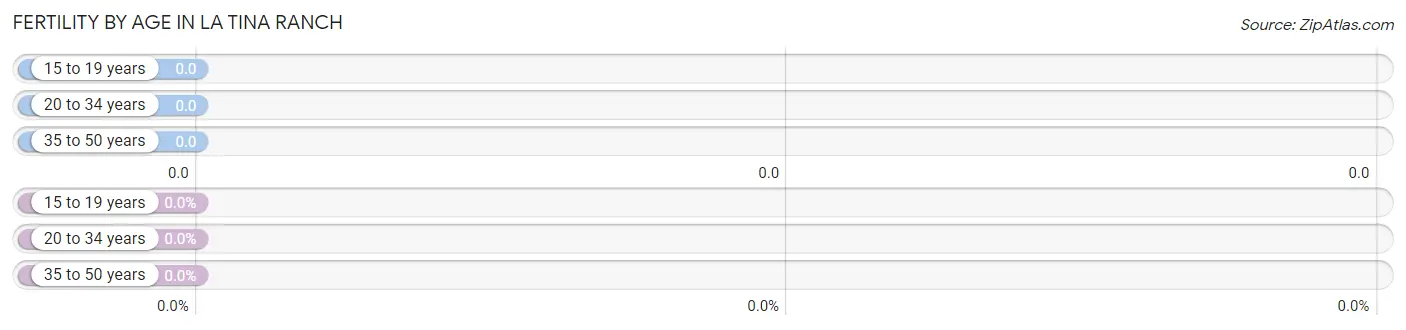
| Age Bracket | Women with Births | Births / 1,000 Women |
| 15 to 19 years | 0 (0.0%) | 0.0 |
| 20 to 34 years | 0 (0.0%) | 0.0 |
| 35 to 50 years | 0 (0.0%) | 0.0 |
| Total | 0 (0.0%) | 0.0 |
Fertility by Age by Marriage Status in La Tina Ranch
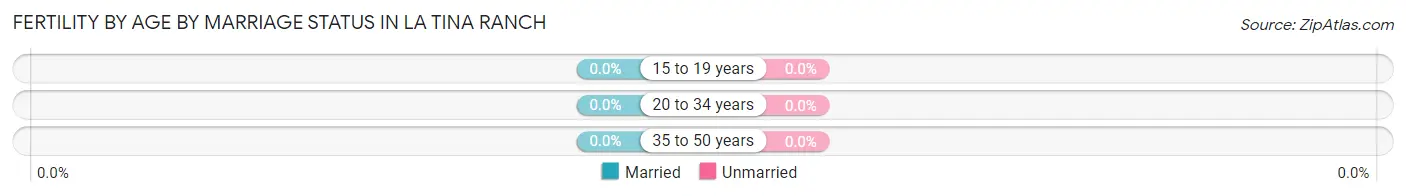
| Age Bracket | Married | Unmarried |
| 15 to 19 years | 0 (0.0%) | 0 (0.0%) |
| 20 to 34 years | 0 (0.0%) | 0 (0.0%) |
| 35 to 50 years | 0 (0.0%) | 0 (0.0%) |
| Total | 0 (0.0%) | 0 (0.0%) |
Fertility by Education in La Tina Ranch
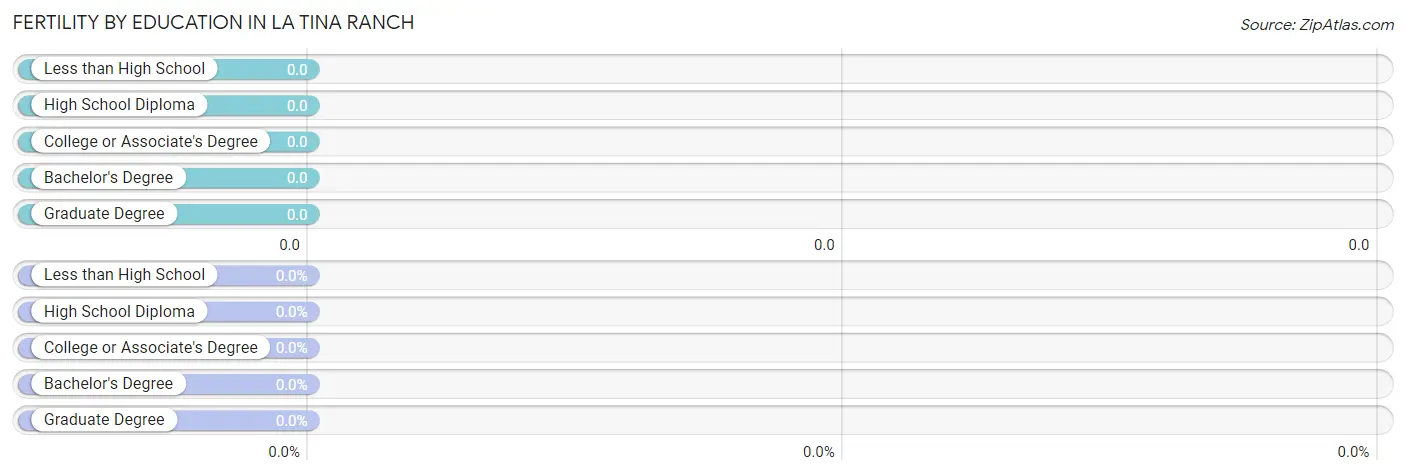
| Educational Attainment | Women with Births | Births / 1,000 Women |
| Less than High School | 0 (0.0%) | 0.0 |
| High School Diploma | 0 (0.0%) | 0.0 |
| College or Associate's Degree | 0 (0.0%) | 0.0 |
| Bachelor's Degree | 0 (0.0%) | 0.0 |
| Graduate Degree | 0 (0.0%) | 0.0 |
| Total | 0 (0.0%) | 0.0 |
Fertility by Education by Marriage Status in La Tina Ranch
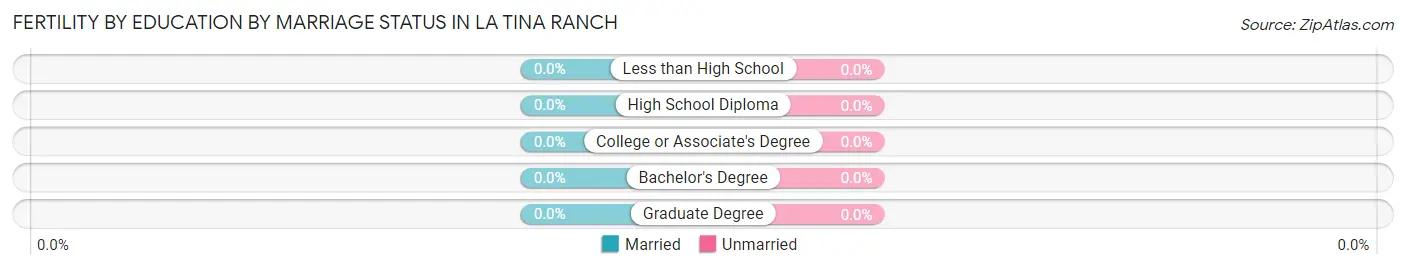
| Educational Attainment | Married | Unmarried |
| Less than High School | 0 (0.0%) | 0 (0.0%) |
| High School Diploma | 0 (0.0%) | 0 (0.0%) |
| College or Associate's Degree | 0 (0.0%) | 0 (0.0%) |
| Bachelor's Degree | 0 (0.0%) | 0 (0.0%) |
| Graduate Degree | 0 (0.0%) | 0 (0.0%) |
| Total | 0 (0.0%) | 0 (0.0%) |
Employment Characteristics in La Tina Ranch
Employment by Class of Employer in La Tina Ranch
Among the 329 employed individuals in La Tina Ranch, private company employees (159 | 48.3%), self-employed (not incorporated) (148 | 45.0%), and local government employees (22 | 6.7%) make up the most common classes of employment.
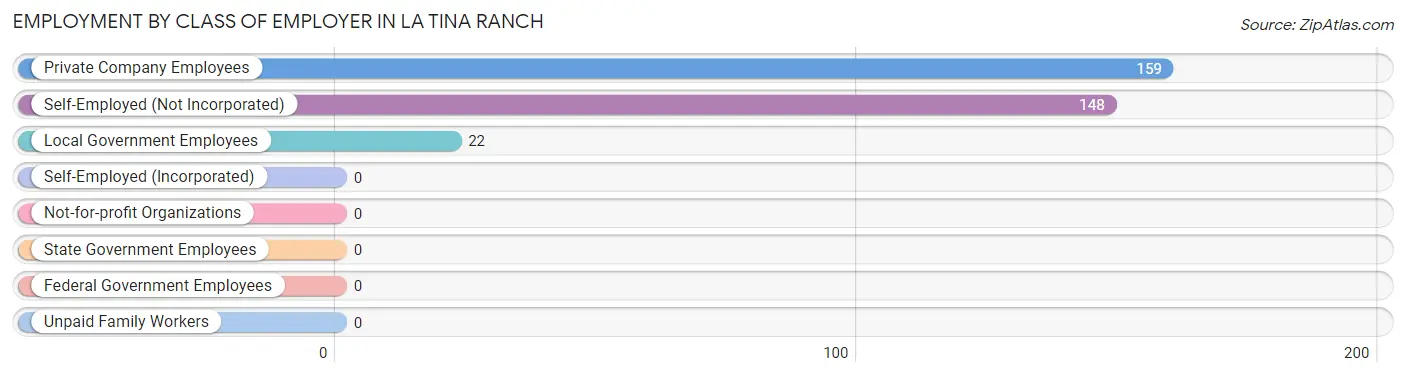
| Employer Class | # Employees | % Employees |
| Private Company Employees | 159 | 48.3% |
| Self-Employed (Incorporated) | 0 | 0.0% |
| Self-Employed (Not Incorporated) | 148 | 45.0% |
| Not-for-profit Organizations | 0 | 0.0% |
| Local Government Employees | 22 | 6.7% |
| State Government Employees | 0 | 0.0% |
| Federal Government Employees | 0 | 0.0% |
| Unpaid Family Workers | 0 | 0.0% |
| Total | 329 | 100.0% |
Employment Status by Age in La Tina Ranch
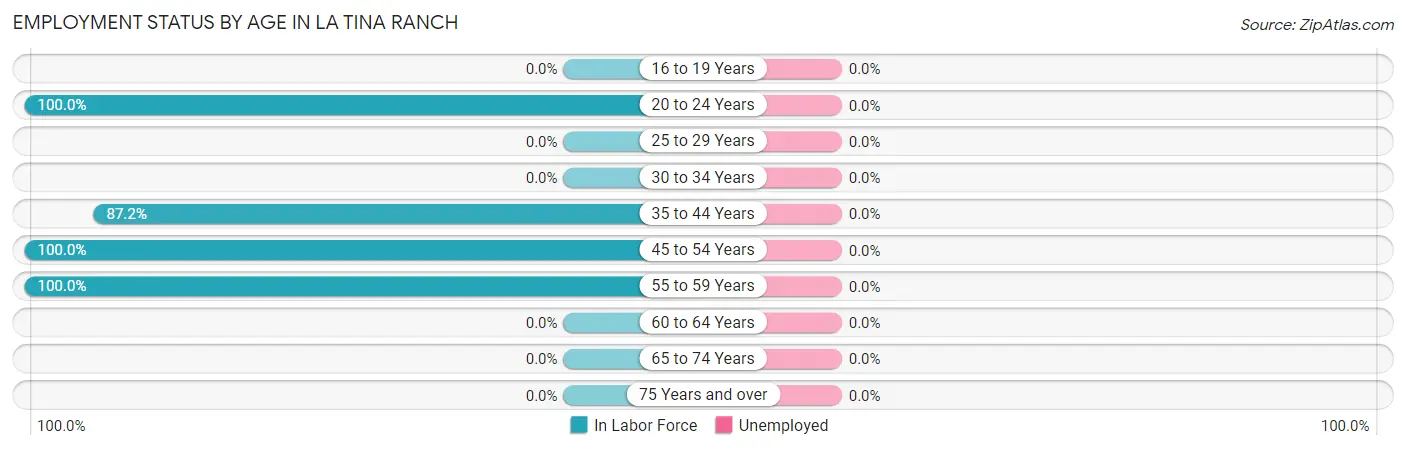
| Age Bracket | In Labor Force | Unemployed |
| 16 to 19 Years | 0 (0.0%) | 0 (0.0%) |
| 20 to 24 Years | 50 (100.0%) | 0 (0.0%) |
| 25 to 29 Years | 0 (0.0%) | 0 (0.0%) |
| 30 to 34 Years | 0 (0.0%) | 0 (0.0%) |
| 35 to 44 Years | 68 (87.2%) | 0 (0.0%) |
| 45 to 54 Years | 98 (100.0%) | 0 (0.0%) |
| 55 to 59 Years | 113 (100.0%) | 0 (0.0%) |
| 60 to 64 Years | 0 (0.0%) | 0 (0.0%) |
| 65 to 74 Years | 0 (0.0%) | 0 (0.0%) |
| 75 Years and over | 0 (0.0%) | 0 (0.0%) |
| Total | 329 (66.9%) | 0 (0.0%) |
Employment Status by Educational Attainment in La Tina Ranch
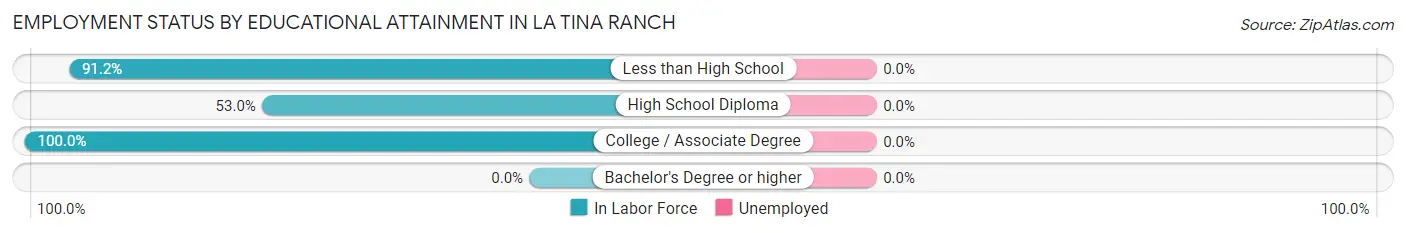
| Educational Attainment | In Labor Force | Unemployed |
| Less than High School | 103 (91.2%) | 0 (0.0%) |
| High School Diploma | 62 (53.0%) | 0 (0.0%) |
| College / Associate Degree | 114 (100.0%) | 0 (0.0%) |
| Bachelor's Degree or higher | 0 (0.0%) | 0 (0.0%) |
| Total | 279 (81.1%) | 0 (0.0%) |
Employment Occupations by Sex in La Tina Ranch
Management, Business, Science and Arts Occupations
The most common Management, Business, Science and Arts occupations in La Tina Ranch are Community & Social Service (22 | 6.7%), Education Instruction & Library (22 | 6.7%), Computers, Engineering & Science (9 | 2.7%), and Architecture & Engineering (9 | 2.7%).
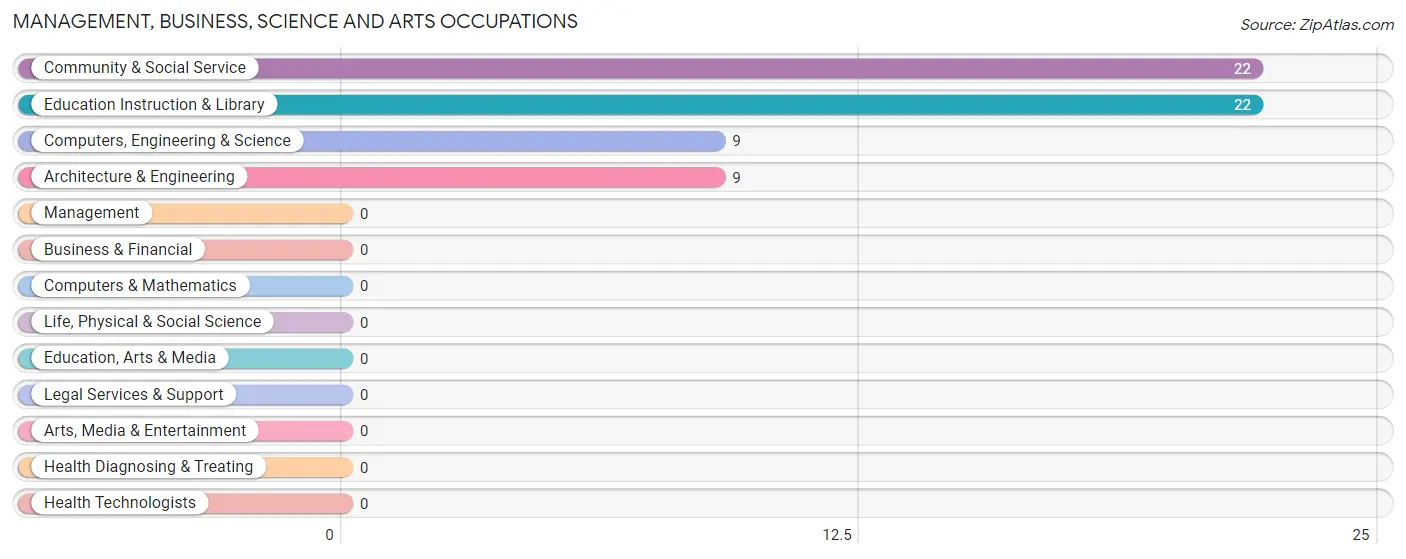
Management, Business, Science and Arts Occupations by Sex
Within the Management, Business, Science and Arts occupations in La Tina Ranch, the most male-oriented occupations are Computers, Engineering & Science (100.0%), and Architecture & Engineering (100.0%), while the most female-oriented occupations are Community & Social Service (100.0%), and Education Instruction & Library (100.0%).
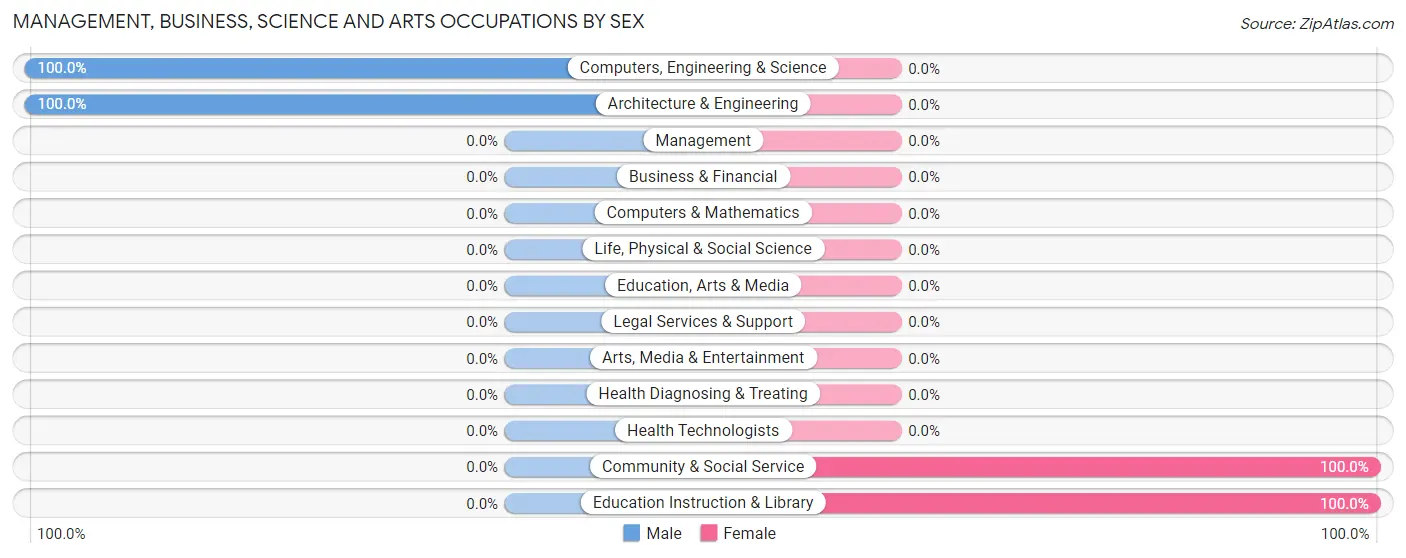
| Occupation | Male | Female |
| Management | 0 (0.0%) | 0 (0.0%) |
| Business & Financial | 0 (0.0%) | 0 (0.0%) |
| Computers, Engineering & Science | 9 (100.0%) | 0 (0.0%) |
| Computers & Mathematics | 0 (0.0%) | 0 (0.0%) |
| Architecture & Engineering | 9 (100.0%) | 0 (0.0%) |
| Life, Physical & Social Science | 0 (0.0%) | 0 (0.0%) |
| Community & Social Service | 0 (0.0%) | 22 (100.0%) |
| Education, Arts & Media | 0 (0.0%) | 0 (0.0%) |
| Legal Services & Support | 0 (0.0%) | 0 (0.0%) |
| Education Instruction & Library | 0 (0.0%) | 22 (100.0%) |
| Arts, Media & Entertainment | 0 (0.0%) | 0 (0.0%) |
| Health Diagnosing & Treating | 0 (0.0%) | 0 (0.0%) |
| Health Technologists | 0 (0.0%) | 0 (0.0%) |
| Total (Category) | 9 (29.0%) | 22 (71.0%) |
| Total (Overall) | 171 (52.0%) | 158 (48.0%) |
Services Occupations
The most common Services occupations in La Tina Ranch are Food Preparation & Serving (90 | 27.4%), Healthcare Support (46 | 14.0%), and Cleaning & Maintenance (46 | 14.0%).
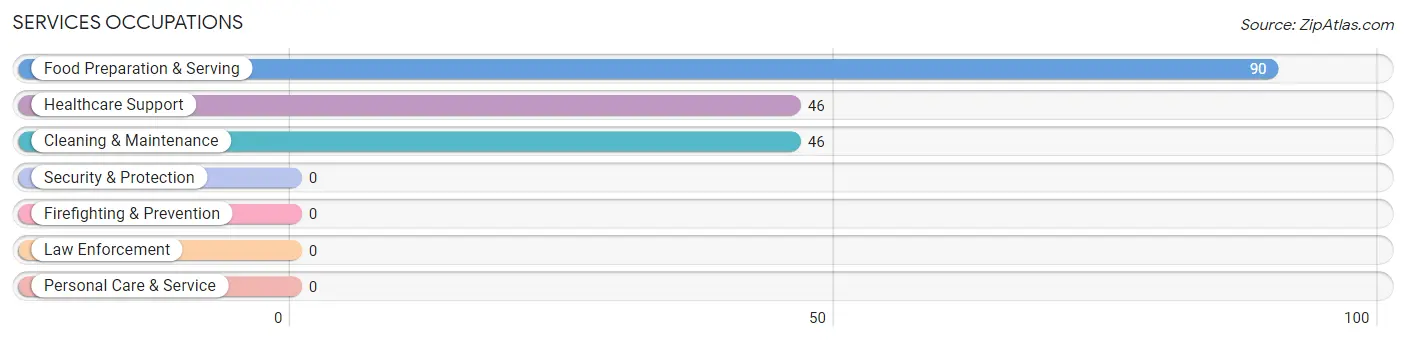
Services Occupations by Sex
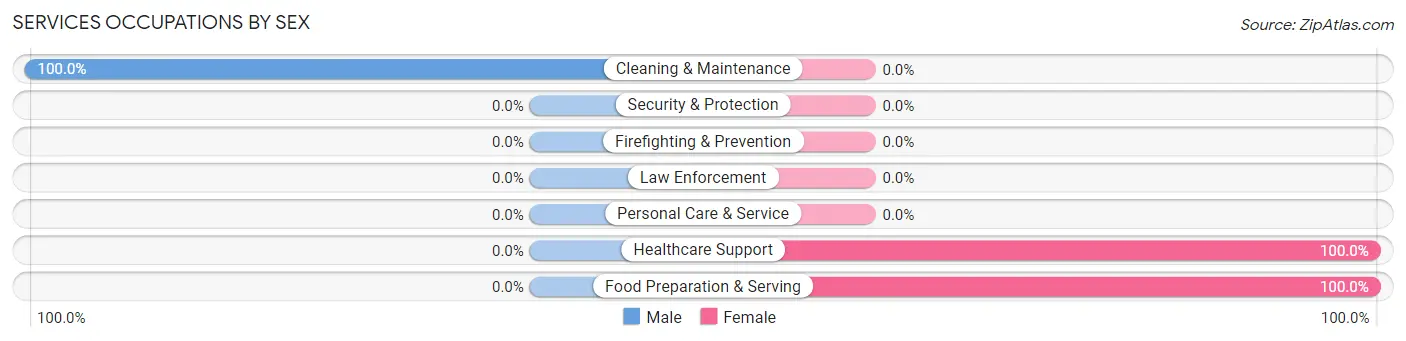
| Occupation | Male | Female |
| Healthcare Support | 0 (0.0%) | 46 (100.0%) |
| Security & Protection | 0 (0.0%) | 0 (0.0%) |
| Firefighting & Prevention | 0 (0.0%) | 0 (0.0%) |
| Law Enforcement | 0 (0.0%) | 0 (0.0%) |
| Food Preparation & Serving | 0 (0.0%) | 90 (100.0%) |
| Cleaning & Maintenance | 46 (100.0%) | 0 (0.0%) |
| Personal Care & Service | 0 (0.0%) | 0 (0.0%) |
| Total (Category) | 46 (25.3%) | 136 (74.7%) |
| Total (Overall) | 171 (52.0%) | 158 (48.0%) |
Sales and Office Occupations
The most common Sales and Office occupations in La Tina Ranch are , and Sales & Related (54 | 16.4%).
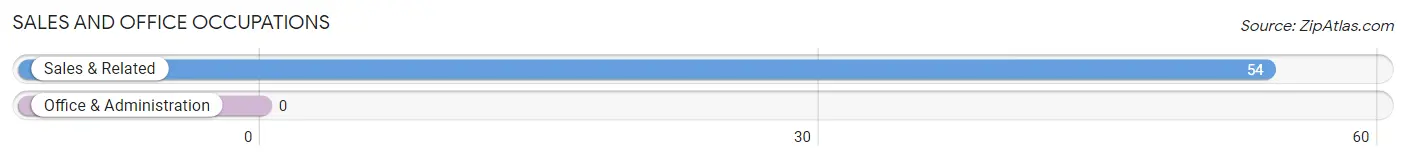
Sales and Office Occupations by Sex

| Occupation | Male | Female |
| Sales & Related | 54 (100.0%) | 0 (0.0%) |
| Office & Administration | 0 (0.0%) | 0 (0.0%) |
| Total (Category) | 54 (100.0%) | 0 (0.0%) |
| Total (Overall) | 171 (52.0%) | 158 (48.0%) |
Natural Resources, Construction and Maintenance Occupations
The most common Natural Resources, Construction and Maintenance occupations in La Tina Ranch are , and Installation, Maintenance & Repair (62 | 18.8%).
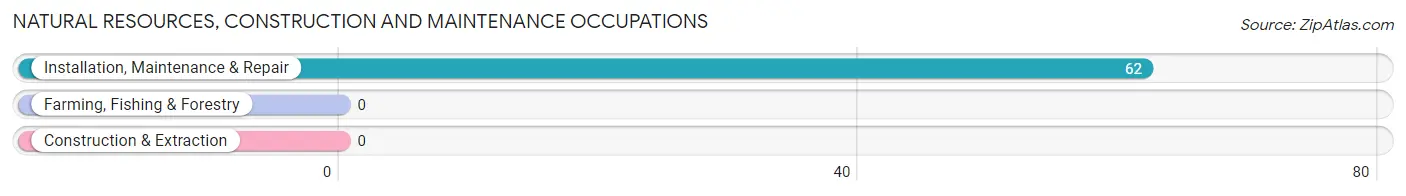
Natural Resources, Construction and Maintenance Occupations by Sex
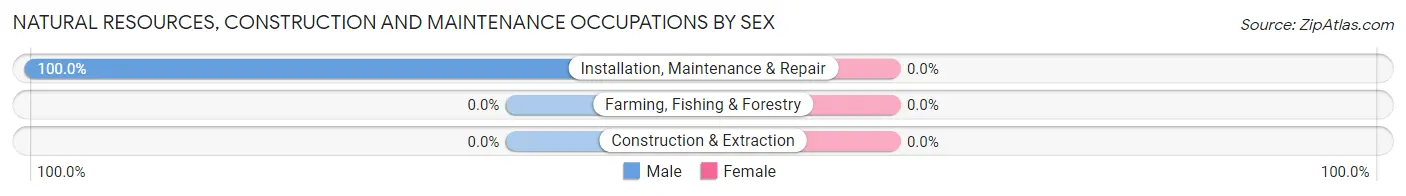
| Occupation | Male | Female |
| Farming, Fishing & Forestry | 0 (0.0%) | 0 (0.0%) |
| Construction & Extraction | 0 (0.0%) | 0 (0.0%) |
| Installation, Maintenance & Repair | 62 (100.0%) | 0 (0.0%) |
| Total (Category) | 62 (100.0%) | 0 (0.0%) |
| Total (Overall) | 171 (52.0%) | 158 (48.0%) |
Production, Transportation and Moving Occupations
Production, Transportation and Moving Occupations by Sex
| Occupation | Male | Female |
| Production | 0 (0.0%) | 0 (0.0%) |
| Transportation | 0 (0.0%) | 0 (0.0%) |
| Material Moving | 0 (0.0%) | 0 (0.0%) |
| Total (Category) | 0 (0.0%) | 0 (0.0%) |
| Total (Overall) | 171 (52.0%) | 158 (48.0%) |
Employment Industries by Sex in La Tina Ranch
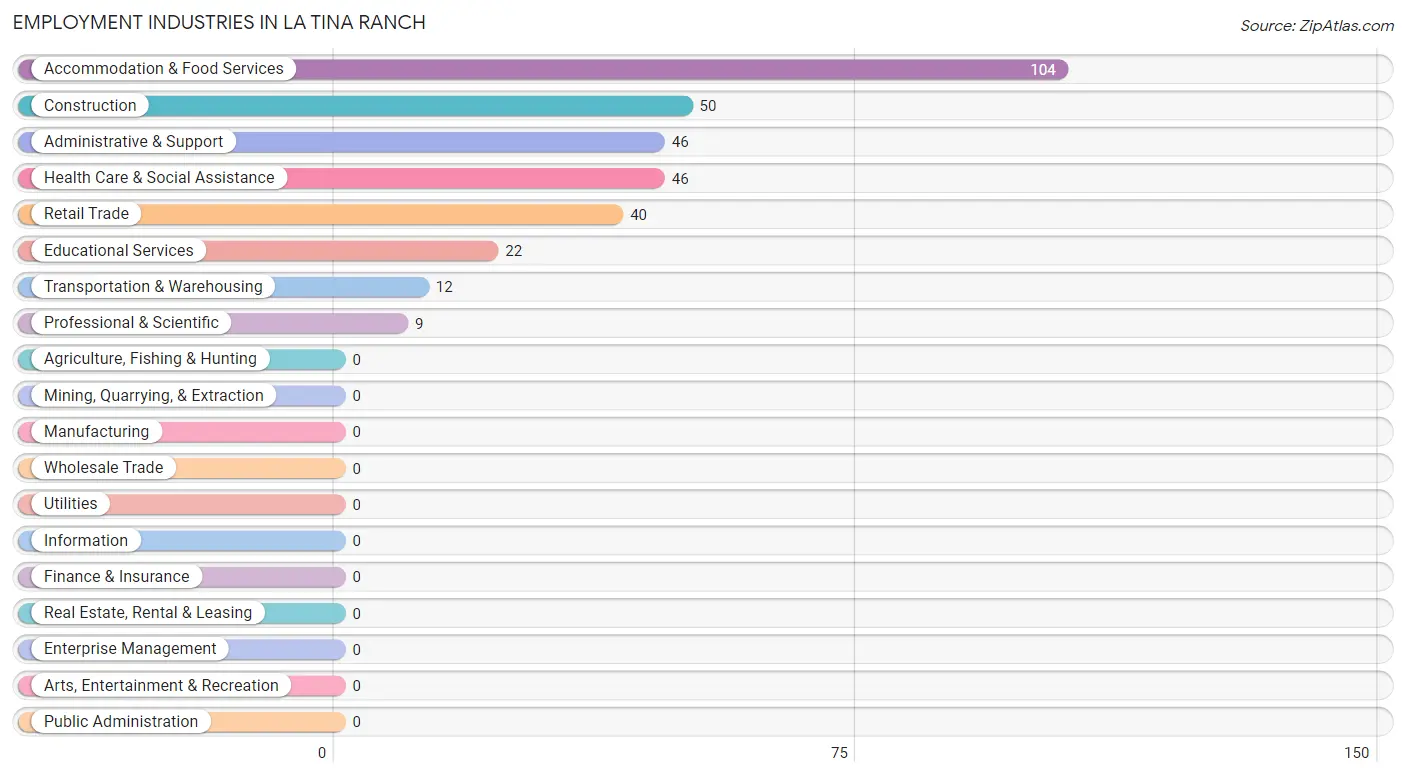
Employment Industries in La Tina Ranch
The major employment industries in La Tina Ranch include Accommodation & Food Services (104 | 31.6%), Construction (50 | 15.2%), Administrative & Support (46 | 14.0%), Health Care & Social Assistance (46 | 14.0%), and Retail Trade (40 | 12.2%).
Employment Industries by Sex in La Tina Ranch
The La Tina Ranch industries that see more men than women are Construction (100.0%), Transportation & Warehousing (100.0%), and Professional & Scientific (100.0%), whereas the industries that tend to have a higher number of women are Retail Trade (100.0%), Educational Services (100.0%), and Health Care & Social Assistance (100.0%).
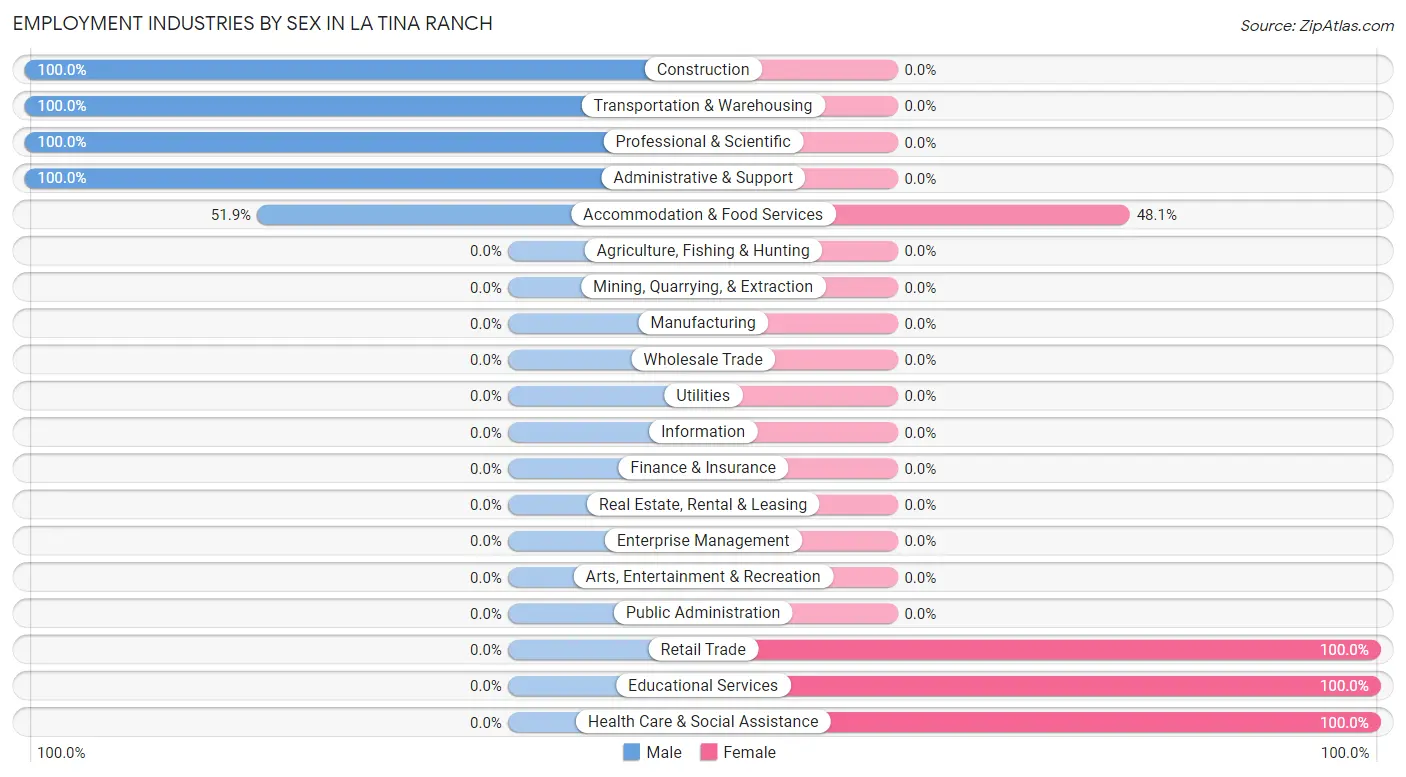
| Industry | Male | Female |
| Agriculture, Fishing & Hunting | 0 (0.0%) | 0 (0.0%) |
| Mining, Quarrying, & Extraction | 0 (0.0%) | 0 (0.0%) |
| Construction | 50 (100.0%) | 0 (0.0%) |
| Manufacturing | 0 (0.0%) | 0 (0.0%) |
| Wholesale Trade | 0 (0.0%) | 0 (0.0%) |
| Retail Trade | 0 (0.0%) | 40 (100.0%) |
| Transportation & Warehousing | 12 (100.0%) | 0 (0.0%) |
| Utilities | 0 (0.0%) | 0 (0.0%) |
| Information | 0 (0.0%) | 0 (0.0%) |
| Finance & Insurance | 0 (0.0%) | 0 (0.0%) |
| Real Estate, Rental & Leasing | 0 (0.0%) | 0 (0.0%) |
| Professional & Scientific | 9 (100.0%) | 0 (0.0%) |
| Enterprise Management | 0 (0.0%) | 0 (0.0%) |
| Administrative & Support | 46 (100.0%) | 0 (0.0%) |
| Educational Services | 0 (0.0%) | 22 (100.0%) |
| Health Care & Social Assistance | 0 (0.0%) | 46 (100.0%) |
| Arts, Entertainment & Recreation | 0 (0.0%) | 0 (0.0%) |
| Accommodation & Food Services | 54 (51.9%) | 50 (48.1%) |
| Public Administration | 0 (0.0%) | 0 (0.0%) |
| Total | 171 (52.0%) | 158 (48.0%) |
Education in La Tina Ranch
School Enrollment in La Tina Ranch
The most common levels of schooling among the 242 students in La Tina Ranch are elementary school (84 | 34.7%), high school (66 | 27.3%), and college / undergraduate (55 | 22.7%).
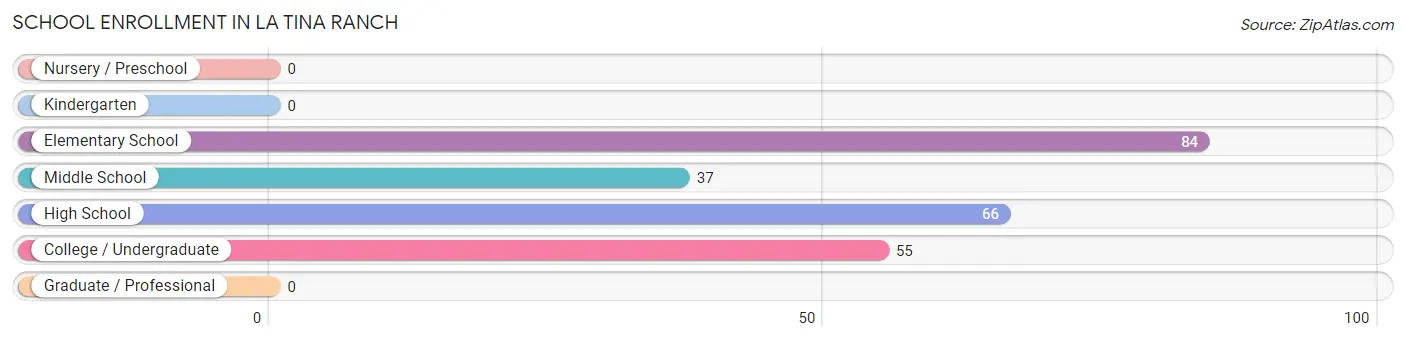
| School Level | # Students | % Students |
| Nursery / Preschool | 0 | 0.0% |
| Kindergarten | 0 | 0.0% |
| Elementary School | 84 | 34.7% |
| Middle School | 37 | 15.3% |
| High School | 66 | 27.3% |
| College / Undergraduate | 55 | 22.7% |
| Graduate / Professional | 0 | 0.0% |
| Total | 242 | 100.0% |
School Enrollment by Age by Funding Source in La Tina Ranch
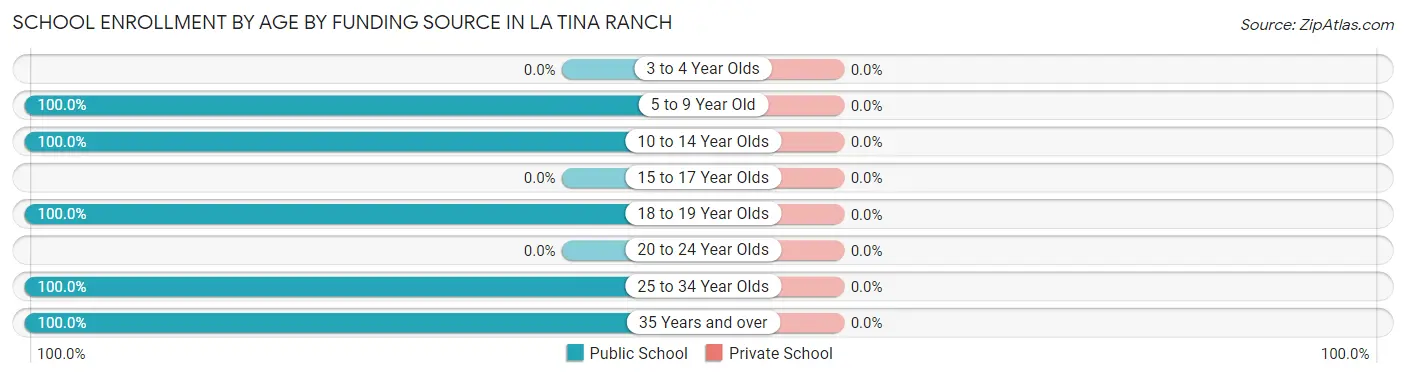
| Age Bracket | Public School | Private School |
| 3 to 4 Year Olds | 0 (0.0%) | 0 (0.0%) |
| 5 to 9 Year Old | 84 (100.0%) | 0 (0.0%) |
| 10 to 14 Year Olds | 37 (100.0%) | 0 (0.0%) |
| 15 to 17 Year Olds | 0 (0.0%) | 0 (0.0%) |
| 18 to 19 Year Olds | 56 (100.0%) | 0 (0.0%) |
| 20 to 24 Year Olds | 0 (0.0%) | 0 (0.0%) |
| 25 to 34 Year Olds | 55 (100.0%) | 0 (0.0%) |
| 35 Years and over | 10 (100.0%) | 0 (0.0%) |
| Total | 242 (100.0%) | 0 (0.0%) |
Educational Attainment by Field of Study in La Tina Ranch
| Field of Study | # Graduates | % Graduates |
| Computers & Mathematics | 0 | 0.0% |
| Bio, Nature & Agricultural | 0 | 0.0% |
| Physical & Health Sciences | 0 | 0.0% |
| Psychology | 0 | 0.0% |
| Social Sciences | 0 | 0.0% |
| Engineering | 0 | 0.0% |
| Multidisciplinary Studies | 0 | 0.0% |
| Science & Technology | 0 | 0.0% |
| Business | 0 | 0.0% |
| Education | 0 | 0.0% |
| Literature & Languages | 0 | 0.0% |
| Liberal Arts & History | 0 | 0.0% |
| Visual & Performing Arts | 0 | 0.0% |
| Communications | 0 | 0.0% |
| Arts & Humanities | 0 | 0.0% |
| Total | 0 | 0.0% |
Transportation & Commute in La Tina Ranch
Vehicle Availability by Sex in La Tina Ranch
The most prevalent vehicle ownership categories in La Tina Ranch are males with 2 vehicles (104, accounting for 60.8%) and females with 2 vehicles (68, making up 65.8%).
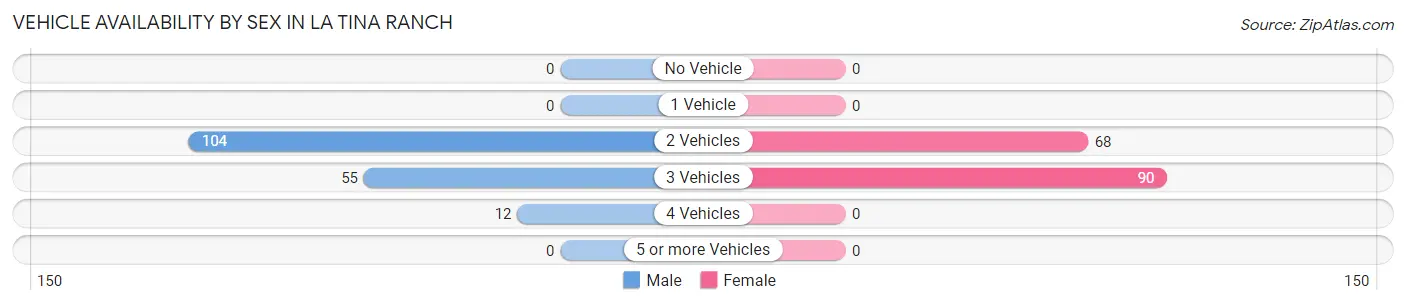
| Vehicles Available | Male | Female |
| No Vehicle | 0 (0.0%) | 0 (0.0%) |
| 1 Vehicle | 0 (0.0%) | 0 (0.0%) |
| 2 Vehicles | 104 (60.8%) | 68 (43.0%) |
| 3 Vehicles | 55 (32.2%) | 90 (57.0%) |
| 4 Vehicles | 12 (7.0%) | 0 (0.0%) |
| 5 or more Vehicles | 0 (0.0%) | 0 (0.0%) |
| Total | 171 (100.0%) | 158 (100.0%) |
Commute Time in La Tina Ranch
The most frequently occuring commute durations in La Tina Ranch are 25 to 29 minutes (54 commuters, 28.0%), 45 to 59 minutes (50 commuters, 25.9%), and 10 to 14 minutes (46 commuters, 23.8%).
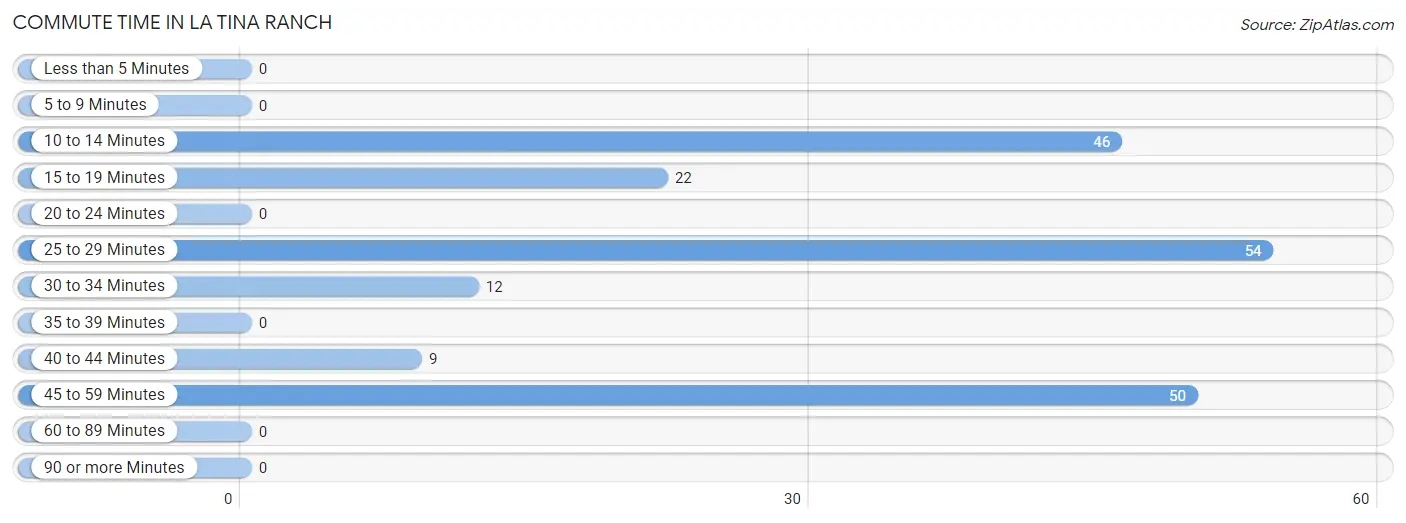
| Commute Time | # Commuters | % Commuters |
| Less than 5 Minutes | 0 | 0.0% |
| 5 to 9 Minutes | 0 | 0.0% |
| 10 to 14 Minutes | 46 | 23.8% |
| 15 to 19 Minutes | 22 | 11.4% |
| 20 to 24 Minutes | 0 | 0.0% |
| 25 to 29 Minutes | 54 | 28.0% |
| 30 to 34 Minutes | 12 | 6.2% |
| 35 to 39 Minutes | 0 | 0.0% |
| 40 to 44 Minutes | 9 | 4.7% |
| 45 to 59 Minutes | 50 | 25.9% |
| 60 to 89 Minutes | 0 | 0.0% |
| 90 or more Minutes | 0 | 0.0% |
Commute Time by Sex in La Tina Ranch
The most common commute times in La Tina Ranch are 25 to 29 minutes (54 commuters, 72.0%) for males and 45 to 59 minutes (50 commuters, 42.4%) for females.
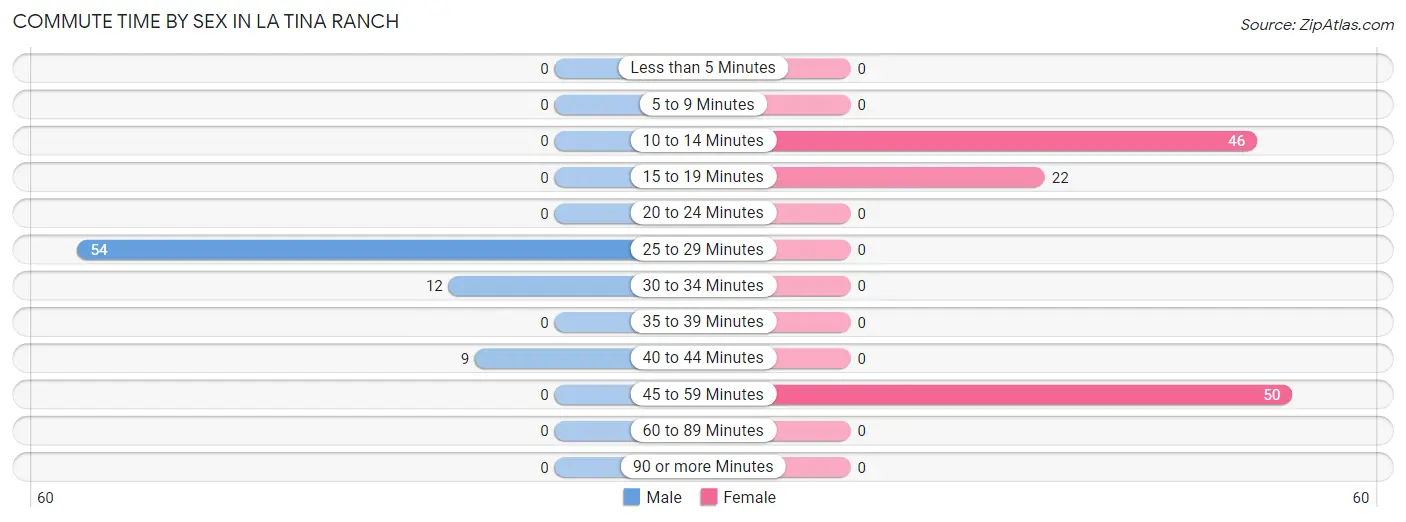
| Commute Time | Male | Female |
| Less than 5 Minutes | 0 (0.0%) | 0 (0.0%) |
| 5 to 9 Minutes | 0 (0.0%) | 0 (0.0%) |
| 10 to 14 Minutes | 0 (0.0%) | 46 (39.0%) |
| 15 to 19 Minutes | 0 (0.0%) | 22 (18.6%) |
| 20 to 24 Minutes | 0 (0.0%) | 0 (0.0%) |
| 25 to 29 Minutes | 54 (72.0%) | 0 (0.0%) |
| 30 to 34 Minutes | 12 (16.0%) | 0 (0.0%) |
| 35 to 39 Minutes | 0 (0.0%) | 0 (0.0%) |
| 40 to 44 Minutes | 9 (12.0%) | 0 (0.0%) |
| 45 to 59 Minutes | 0 (0.0%) | 50 (42.4%) |
| 60 to 89 Minutes | 0 (0.0%) | 0 (0.0%) |
| 90 or more Minutes | 0 (0.0%) | 0 (0.0%) |
Time of Departure to Work by Sex in La Tina Ranch
The most frequent times of departure to work in La Tina Ranch are 6:00 AM to 6:29 AM (54, 72.0%) for males and 7:30 AM to 7:59 AM (96, 81.4%) for females.
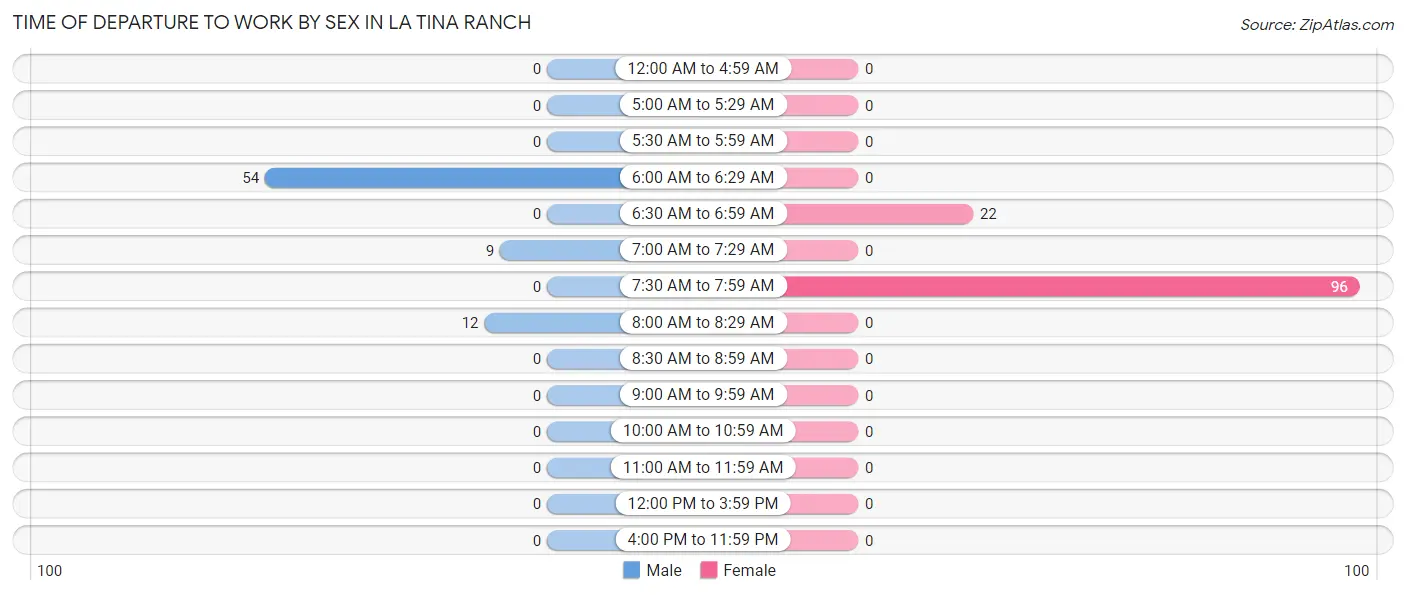
| Time of Departure | Male | Female |
| 12:00 AM to 4:59 AM | 0 (0.0%) | 0 (0.0%) |
| 5:00 AM to 5:29 AM | 0 (0.0%) | 0 (0.0%) |
| 5:30 AM to 5:59 AM | 0 (0.0%) | 0 (0.0%) |
| 6:00 AM to 6:29 AM | 54 (72.0%) | 0 (0.0%) |
| 6:30 AM to 6:59 AM | 0 (0.0%) | 22 (18.6%) |
| 7:00 AM to 7:29 AM | 9 (12.0%) | 0 (0.0%) |
| 7:30 AM to 7:59 AM | 0 (0.0%) | 96 (81.4%) |
| 8:00 AM to 8:29 AM | 12 (16.0%) | 0 (0.0%) |
| 8:30 AM to 8:59 AM | 0 (0.0%) | 0 (0.0%) |
| 9:00 AM to 9:59 AM | 0 (0.0%) | 0 (0.0%) |
| 10:00 AM to 10:59 AM | 0 (0.0%) | 0 (0.0%) |
| 11:00 AM to 11:59 AM | 0 (0.0%) | 0 (0.0%) |
| 12:00 PM to 3:59 PM | 0 (0.0%) | 0 (0.0%) |
| 4:00 PM to 11:59 PM | 0 (0.0%) | 0 (0.0%) |
| Total | 75 (100.0%) | 118 (100.0%) |
Housing Occupancy in La Tina Ranch
Occupancy by Ownership in La Tina Ranch
Of the total 204 dwellings in La Tina Ranch, owner-occupied units account for 204 (100.0%), while renter-occupied units make up 0 (0.0%).
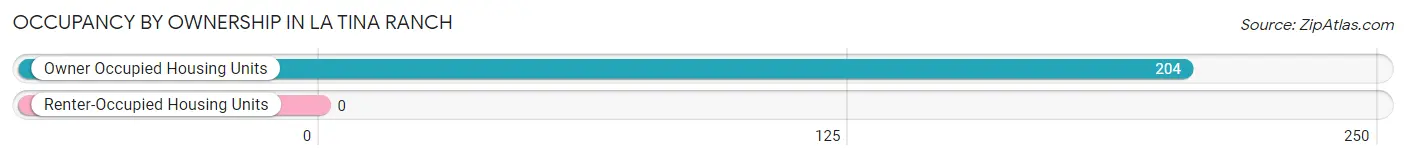
| Occupancy | # Housing Units | % Housing Units |
| Owner Occupied Housing Units | 204 | 100.0% |
| Renter-Occupied Housing Units | 0 | 0.0% |
| Total Occupied Housing Units | 204 | 100.0% |
Occupancy by Household Size in La Tina Ranch
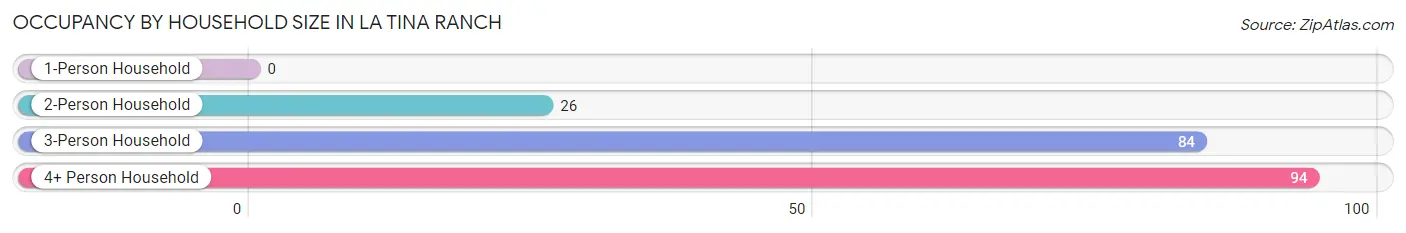
| Household Size | # Housing Units | % Housing Units |
| 1-Person Household | 0 | 0.0% |
| 2-Person Household | 26 | 12.8% |
| 3-Person Household | 84 | 41.2% |
| 4+ Person Household | 94 | 46.1% |
| Total Housing Units | 204 | 100.0% |
Occupancy by Ownership by Household Size in La Tina Ranch

| Household Size | Owner-occupied | Renter-occupied |
| 1-Person Household | 0 (0.0%) | 0 (0.0%) |
| 2-Person Household | 26 (100.0%) | 0 (0.0%) |
| 3-Person Household | 84 (100.0%) | 0 (0.0%) |
| 4+ Person Household | 94 (100.0%) | 0 (0.0%) |
| Total Housing Units | 204 (100.0%) | 0 (0.0%) |
Occupancy by Educational Attainment in La Tina Ranch
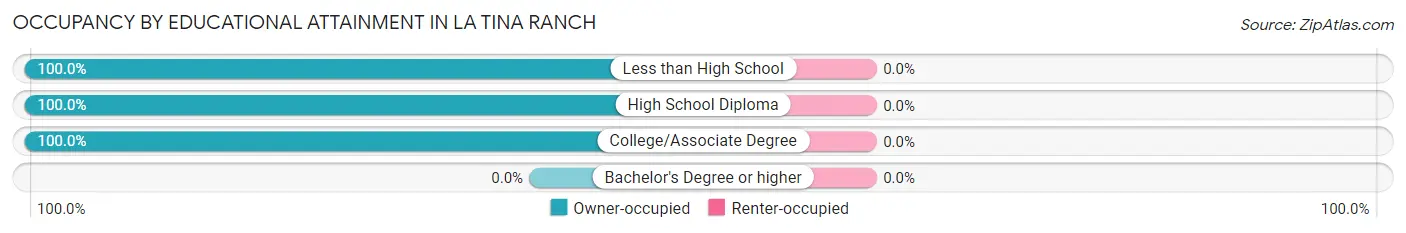
| Household Size | Owner-occupied | Renter-occupied |
| Less than High School | 110 (100.0%) | 0 (0.0%) |
| High School Diploma | 72 (100.0%) | 0 (0.0%) |
| College/Associate Degree | 22 (100.0%) | 0 (0.0%) |
| Bachelor's Degree or higher | 0 (0.0%) | 0 (0.0%) |
Occupancy by Age of Householder in La Tina Ranch
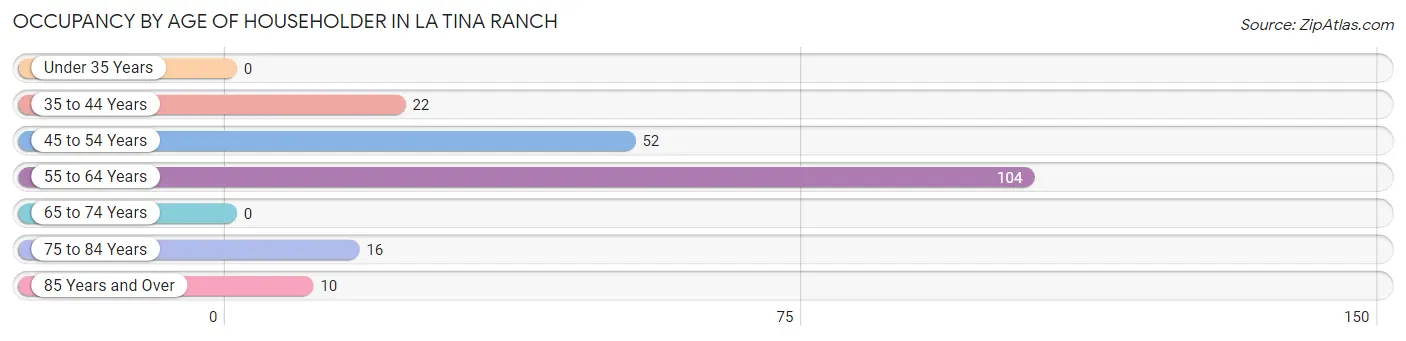
| Age Bracket | # Households | % Households |
| Under 35 Years | 0 | 0.0% |
| 35 to 44 Years | 22 | 10.8% |
| 45 to 54 Years | 52 | 25.5% |
| 55 to 64 Years | 104 | 51.0% |
| 65 to 74 Years | 0 | 0.0% |
| 75 to 84 Years | 16 | 7.8% |
| 85 Years and Over | 10 | 4.9% |
| Total | 204 | 100.0% |
Housing Finances in La Tina Ranch
Median Income by Occupancy in La Tina Ranch
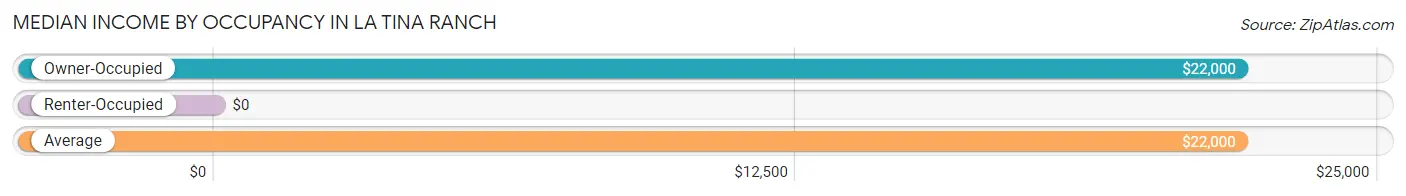
| Occupancy Type | # Households | Median Income |
| Owner-Occupied | 204 (100.0%) | $22,000 |
| Renter-Occupied | 0 (0.0%) | $0 |
| Average | 204 (100.0%) | $22,000 |
Occupancy by Householder Income Bracket in La Tina Ranch
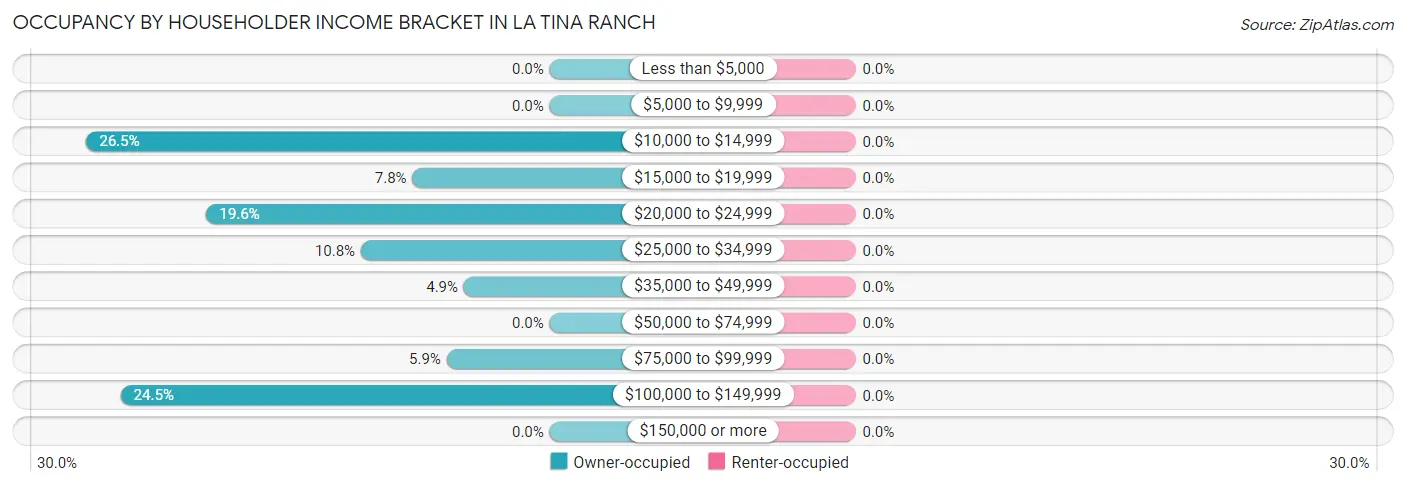
| Income Bracket | Owner-occupied | Renter-occupied |
| Less than $5,000 | 0 (0.0%) | 0 (0.0%) |
| $5,000 to $9,999 | 0 (0.0%) | 0 (0.0%) |
| $10,000 to $14,999 | 54 (26.5%) | 0 (0.0%) |
| $15,000 to $19,999 | 16 (7.8%) | 0 (0.0%) |
| $20,000 to $24,999 | 40 (19.6%) | 0 (0.0%) |
| $25,000 to $34,999 | 22 (10.8%) | 0 (0.0%) |
| $35,000 to $49,999 | 10 (4.9%) | 0 (0.0%) |
| $50,000 to $74,999 | 0 (0.0%) | 0 (0.0%) |
| $75,000 to $99,999 | 12 (5.9%) | 0 (0.0%) |
| $100,000 to $149,999 | 50 (24.5%) | 0 (0.0%) |
| $150,000 or more | 0 (0.0%) | 0 (0.0%) |
| Total | 204 (100.0%) | 0 (0.0%) |
Monthly Housing Cost Tiers in La Tina Ranch
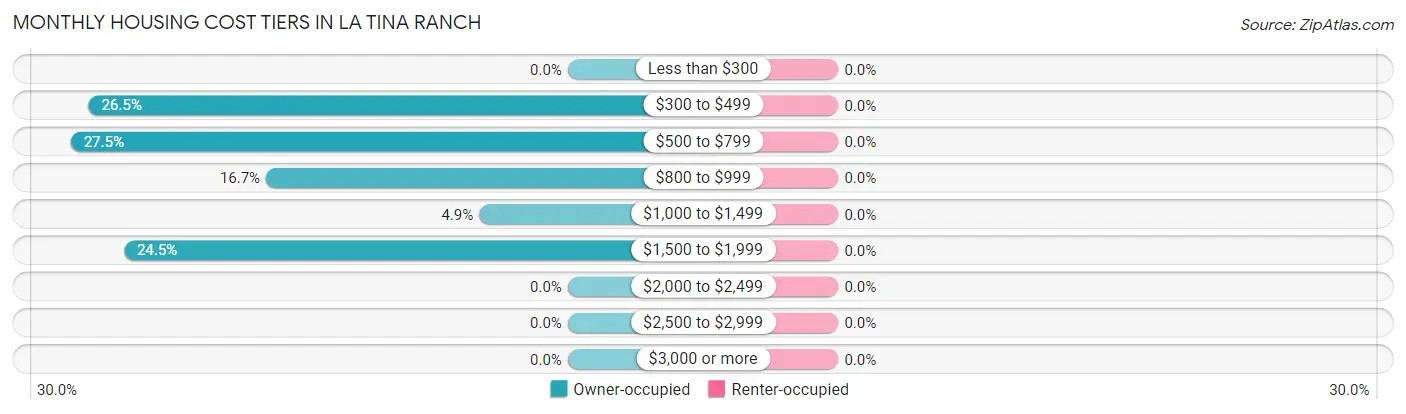
| Monthly Cost | Owner-occupied | Renter-occupied |
| Less than $300 | 0 (0.0%) | 0 (0.0%) |
| $300 to $499 | 54 (26.5%) | 0 (0.0%) |
| $500 to $799 | 56 (27.5%) | 0 (0.0%) |
| $800 to $999 | 34 (16.7%) | 0 (0.0%) |
| $1,000 to $1,499 | 10 (4.9%) | 0 (0.0%) |
| $1,500 to $1,999 | 50 (24.5%) | 0 (0.0%) |
| $2,000 to $2,499 | 0 (0.0%) | 0 (0.0%) |
| $2,500 to $2,999 | 0 (0.0%) | 0 (0.0%) |
| $3,000 or more | 0 (0.0%) | 0 (0.0%) |
| Total | 204 (100.0%) | 0 (0.0%) |
Physical Housing Characteristics in La Tina Ranch
Housing Structures in La Tina Ranch
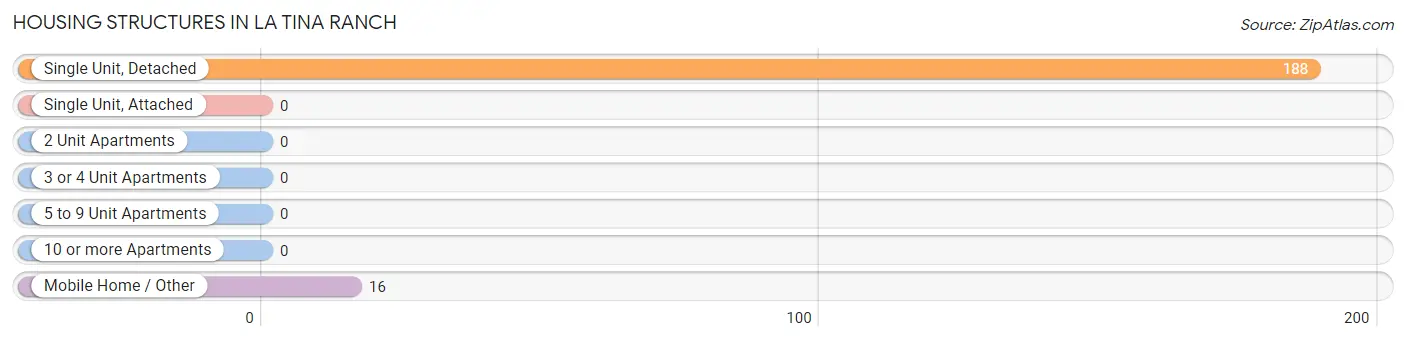
| Structure Type | # Housing Units | % Housing Units |
| Single Unit, Detached | 188 | 92.2% |
| Single Unit, Attached | 0 | 0.0% |
| 2 Unit Apartments | 0 | 0.0% |
| 3 or 4 Unit Apartments | 0 | 0.0% |
| 5 to 9 Unit Apartments | 0 | 0.0% |
| 10 or more Apartments | 0 | 0.0% |
| Mobile Home / Other | 16 | 7.8% |
| Total | 204 | 100.0% |
Housing Structures by Occupancy in La Tina Ranch
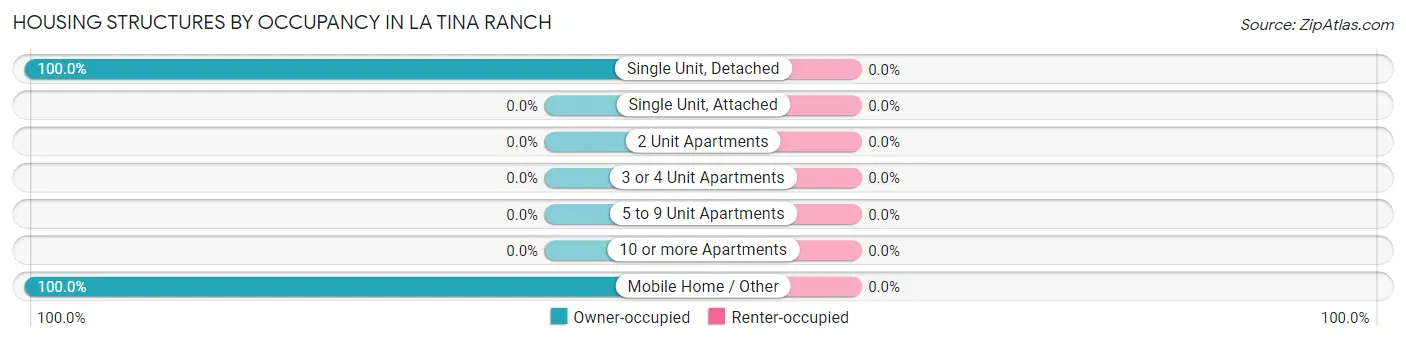
| Structure Type | Owner-occupied | Renter-occupied |
| Single Unit, Detached | 188 (100.0%) | 0 (0.0%) |
| Single Unit, Attached | 0 (0.0%) | 0 (0.0%) |
| 2 Unit Apartments | 0 (0.0%) | 0 (0.0%) |
| 3 or 4 Unit Apartments | 0 (0.0%) | 0 (0.0%) |
| 5 to 9 Unit Apartments | 0 (0.0%) | 0 (0.0%) |
| 10 or more Apartments | 0 (0.0%) | 0 (0.0%) |
| Mobile Home / Other | 16 (100.0%) | 0 (0.0%) |
| Total | 204 (100.0%) | 0 (0.0%) |
Housing Structures by Number of Rooms in La Tina Ranch
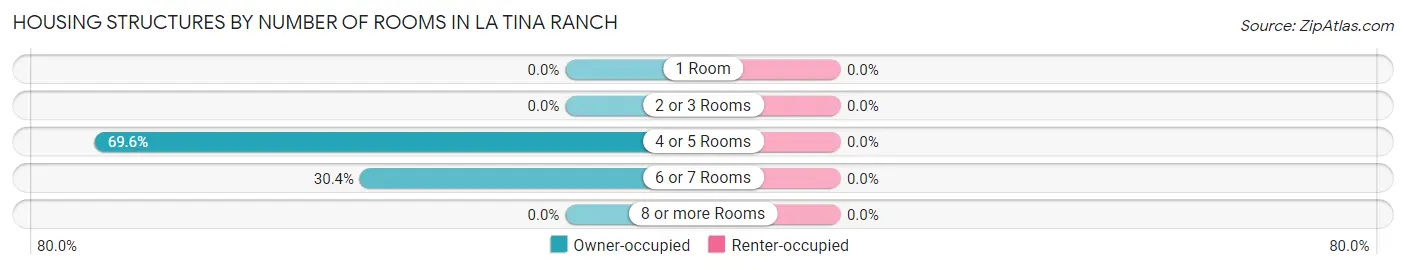
| Number of Rooms | Owner-occupied | Renter-occupied |
| 1 Room | 0 (0.0%) | 0 (0.0%) |
| 2 or 3 Rooms | 0 (0.0%) | 0 (0.0%) |
| 4 or 5 Rooms | 142 (69.6%) | 0 (0.0%) |
| 6 or 7 Rooms | 62 (30.4%) | 0 (0.0%) |
| 8 or more Rooms | 0 (0.0%) | 0 (0.0%) |
| Total | 204 (100.0%) | 0 (0.0%) |
Housing Structure by Heating Type in La Tina Ranch
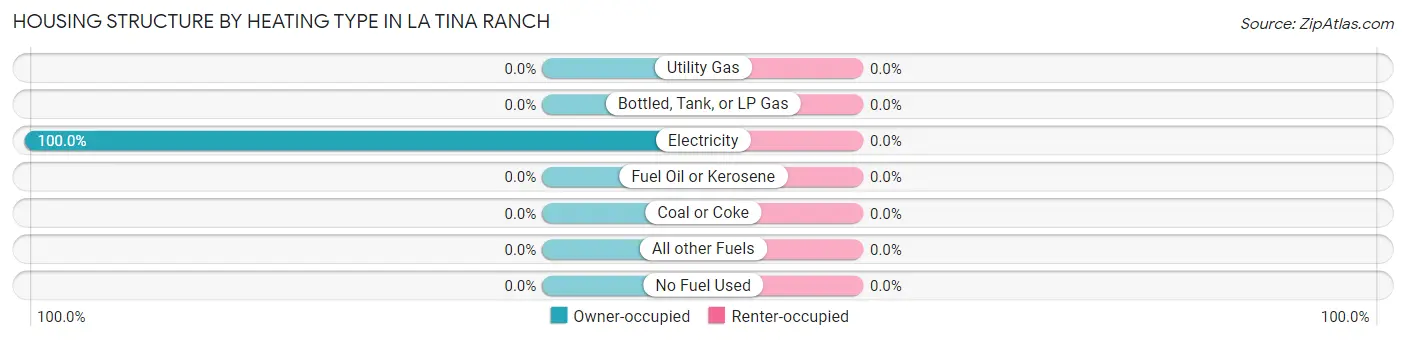
| Heating Type | Owner-occupied | Renter-occupied |
| Utility Gas | 0 (0.0%) | 0 (0.0%) |
| Bottled, Tank, or LP Gas | 0 (0.0%) | 0 (0.0%) |
| Electricity | 204 (100.0%) | 0 (0.0%) |
| Fuel Oil or Kerosene | 0 (0.0%) | 0 (0.0%) |
| Coal or Coke | 0 (0.0%) | 0 (0.0%) |
| All other Fuels | 0 (0.0%) | 0 (0.0%) |
| No Fuel Used | 0 (0.0%) | 0 (0.0%) |
| Total | 204 (100.0%) | 0 (0.0%) |
Household Vehicle Usage in La Tina Ranch
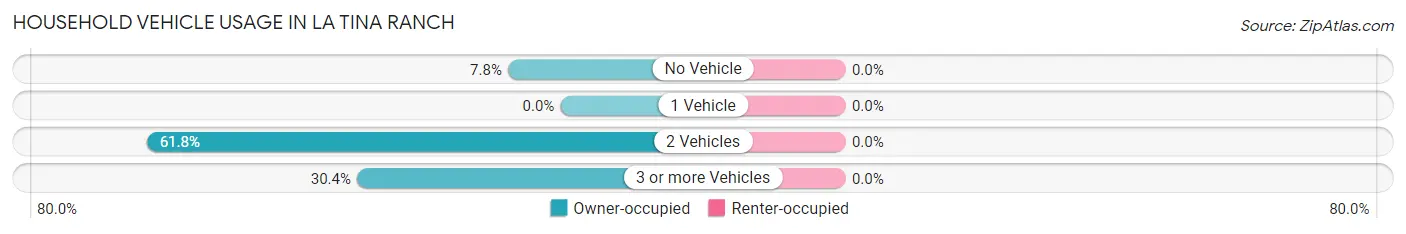
| Vehicles per Household | Owner-occupied | Renter-occupied |
| No Vehicle | 16 (7.8%) | 0 (0.0%) |
| 1 Vehicle | 0 (0.0%) | 0 (0.0%) |
| 2 Vehicles | 126 (61.8%) | 0 (0.0%) |
| 3 or more Vehicles | 62 (30.4%) | 0 (0.0%) |
| Total | 204 (100.0%) | 0 (0.0%) |
Real Estate & Mortgages in La Tina Ranch
Real Estate and Mortgage Overview in La Tina Ranch
| Characteristic | Without Mortgage | With Mortgage |
| Housing Units | 94 | 110 |
| Median Property Value | - | - |
| Median Household Income | - | - |
| Monthly Housing Costs | - | - |
| Real Estate Taxes | - | - |
Property Value by Mortgage Status in La Tina Ranch
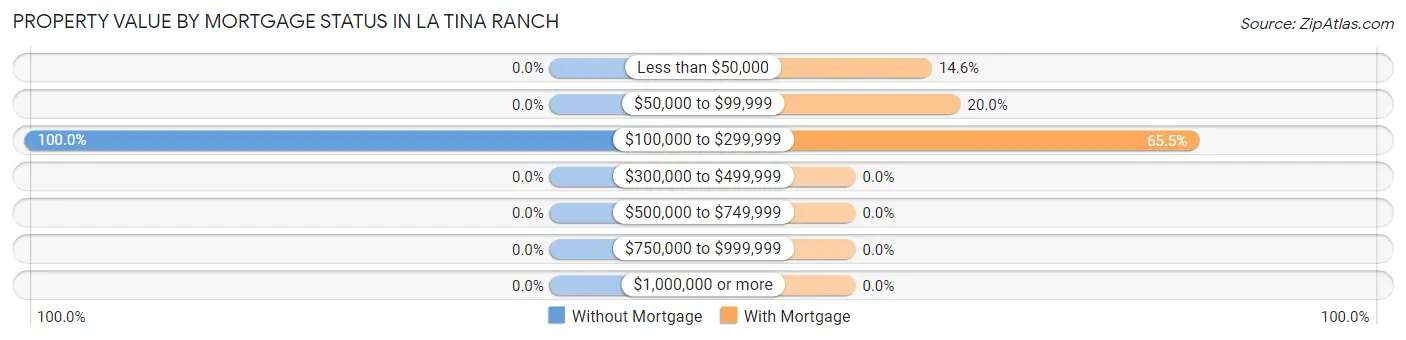
| Property Value | Without Mortgage | With Mortgage |
| Less than $50,000 | 0 (0.0%) | 16 (14.5%) |
| $50,000 to $99,999 | 0 (0.0%) | 22 (20.0%) |
| $100,000 to $299,999 | 94 (100.0%) | 72 (65.4%) |
| $300,000 to $499,999 | 0 (0.0%) | 0 (0.0%) |
| $500,000 to $749,999 | 0 (0.0%) | 0 (0.0%) |
| $750,000 to $999,999 | 0 (0.0%) | 0 (0.0%) |
| $1,000,000 or more | 0 (0.0%) | 0 (0.0%) |
| Total | 94 (100.0%) | 110 (100.0%) |
Household Income by Mortgage Status in La Tina Ranch
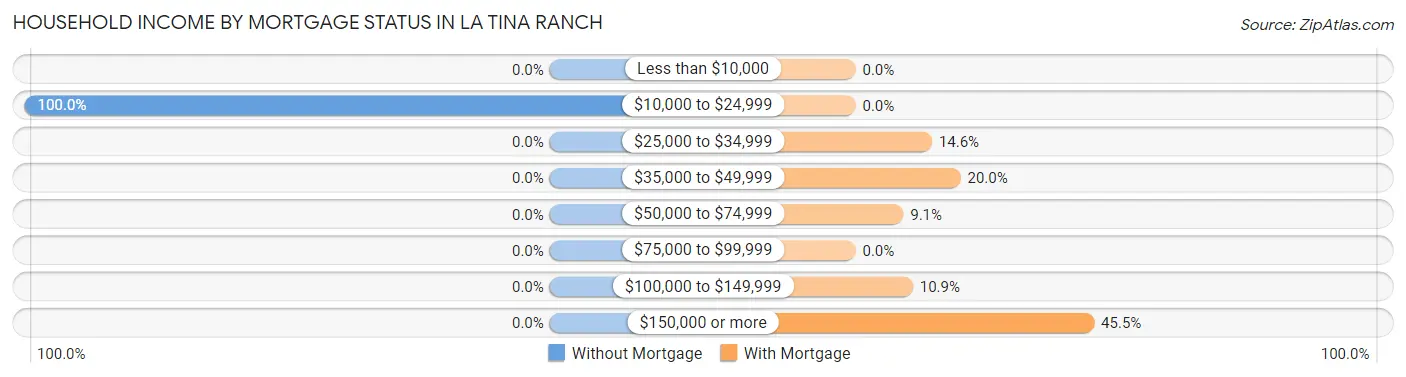
| Household Income | Without Mortgage | With Mortgage |
| Less than $10,000 | 0 (0.0%) | 0 (0.0%) |
| $10,000 to $24,999 | 94 (100.0%) | 0 (0.0%) |
| $25,000 to $34,999 | 0 (0.0%) | 16 (14.5%) |
| $35,000 to $49,999 | 0 (0.0%) | 22 (20.0%) |
| $50,000 to $74,999 | 0 (0.0%) | 10 (9.1%) |
| $75,000 to $99,999 | 0 (0.0%) | 0 (0.0%) |
| $100,000 to $149,999 | 0 (0.0%) | 12 (10.9%) |
| $150,000 or more | 0 (0.0%) | 50 (45.5%) |
| Total | 94 (100.0%) | 110 (100.0%) |
Property Value to Household Income Ratio in La Tina Ranch
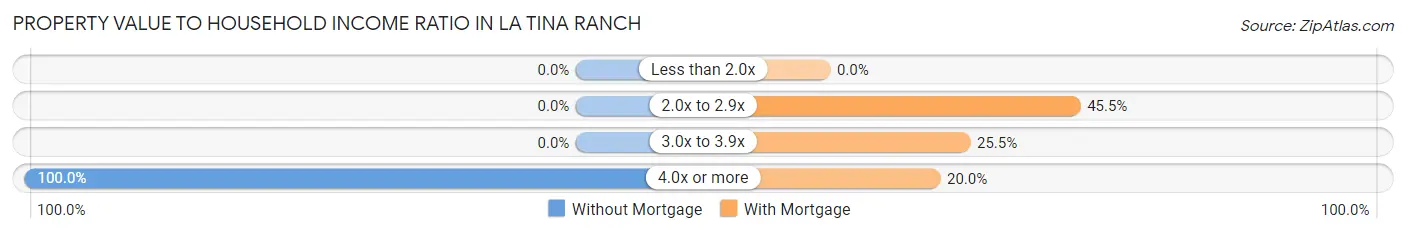
| Value-to-Income Ratio | Without Mortgage | With Mortgage |
| Less than 2.0x | 0 (0.0%) | 0 (0.0%) |
| 2.0x to 2.9x | 0 (0.0%) | 50 (45.5%) |
| 3.0x to 3.9x | 0 (0.0%) | 28 (25.5%) |
| 4.0x or more | 94 (100.0%) | 22 (20.0%) |
| Total | 94 (100.0%) | 110 (100.0%) |
Real Estate Taxes by Mortgage Status in La Tina Ranch
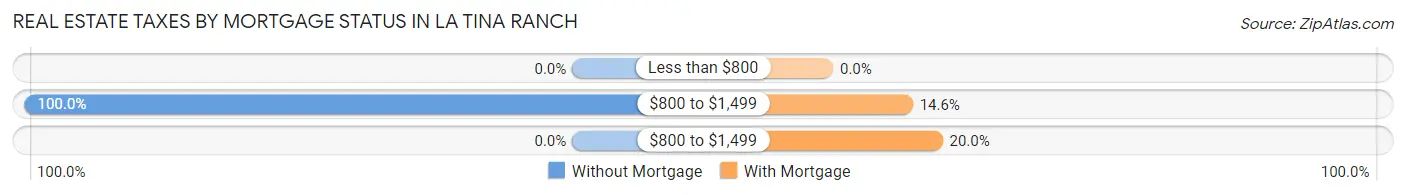
| Property Taxes | Without Mortgage | With Mortgage |
| Less than $800 | 0 (0.0%) | 0 (0.0%) |
| $800 to $1,499 | 94 (100.0%) | 16 (14.5%) |
| $800 to $1,499 | 0 (0.0%) | 22 (20.0%) |
| Total | 94 (100.0%) | 110 (100.0%) |
Health & Disability in La Tina Ranch
Health Insurance Coverage by Age in La Tina Ranch
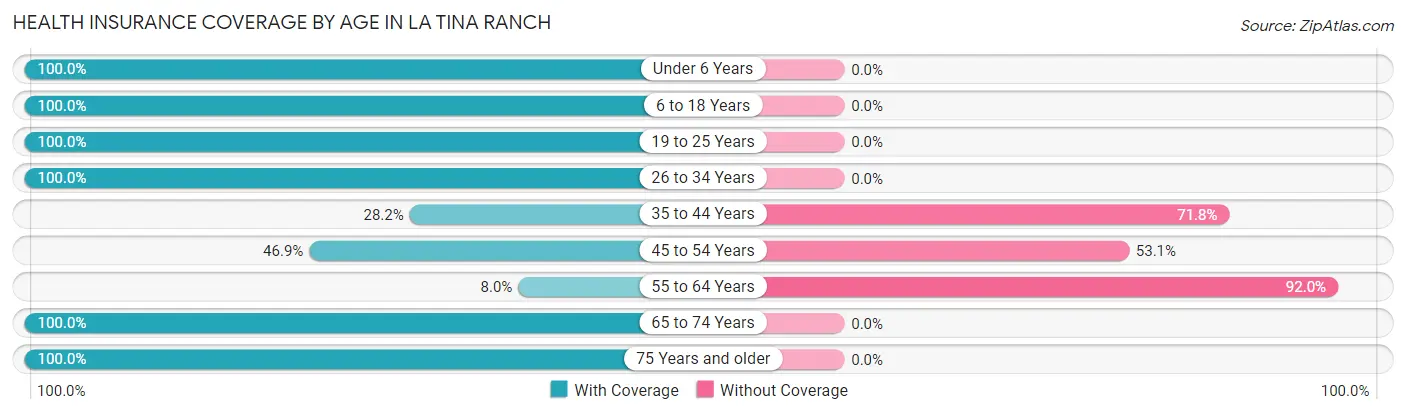
| Age Bracket | With Coverage | Without Coverage |
| Under 6 Years | 112 (100.0%) | 0 (0.0%) |
| 6 to 18 Years | 177 (100.0%) | 0 (0.0%) |
| 19 to 25 Years | 50 (100.0%) | 0 (0.0%) |
| 26 to 34 Years | 55 (100.0%) | 0 (0.0%) |
| 35 to 44 Years | 22 (28.2%) | 56 (71.8%) |
| 45 to 54 Years | 46 (46.9%) | 52 (53.1%) |
| 55 to 64 Years | 9 (8.0%) | 104 (92.0%) |
| 65 to 74 Years | 16 (100.0%) | 0 (0.0%) |
| 75 Years and older | 26 (100.0%) | 0 (0.0%) |
| Total | 513 (70.8%) | 212 (29.2%) |
Health Insurance Coverage by Citizenship Status in La Tina Ranch
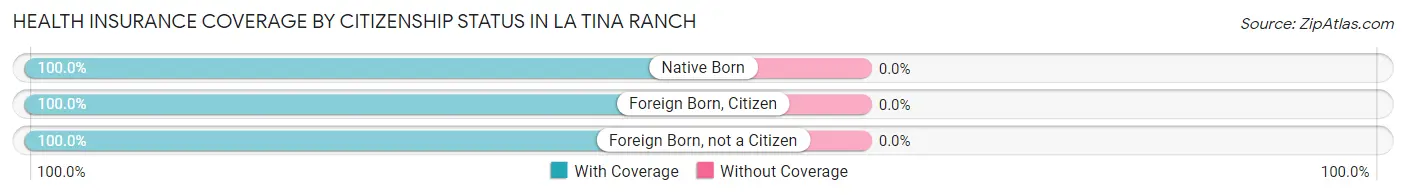
| Citizenship Status | With Coverage | Without Coverage |
| Native Born | 112 (100.0%) | 0 (0.0%) |
| Foreign Born, Citizen | 177 (100.0%) | 0 (0.0%) |
| Foreign Born, not a Citizen | 50 (100.0%) | 0 (0.0%) |
Health Insurance Coverage by Household Income in La Tina Ranch
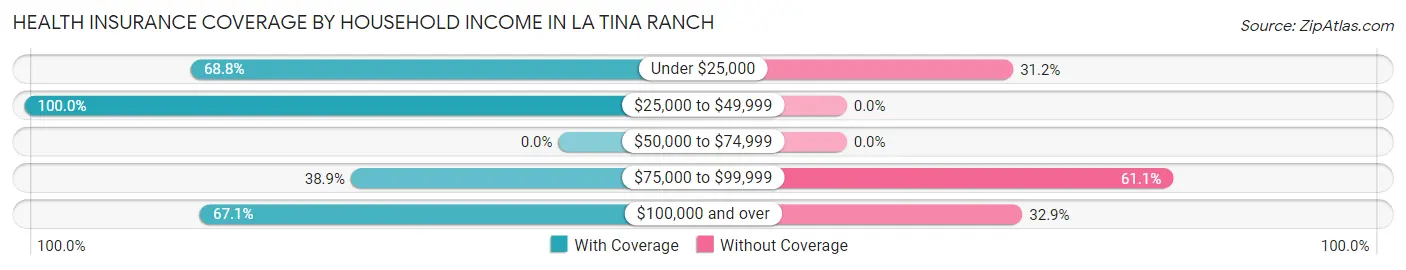
| Household Income | With Coverage | Without Coverage |
| Under $25,000 | 309 (68.8%) | 140 (31.2%) |
| $25,000 to $49,999 | 88 (100.0%) | 0 (0.0%) |
| $50,000 to $74,999 | 0 (0.0%) | 0 (0.0%) |
| $75,000 to $99,999 | 14 (38.9%) | 22 (61.1%) |
| $100,000 and over | 102 (67.1%) | 50 (32.9%) |
Public vs Private Health Insurance Coverage by Age in La Tina Ranch
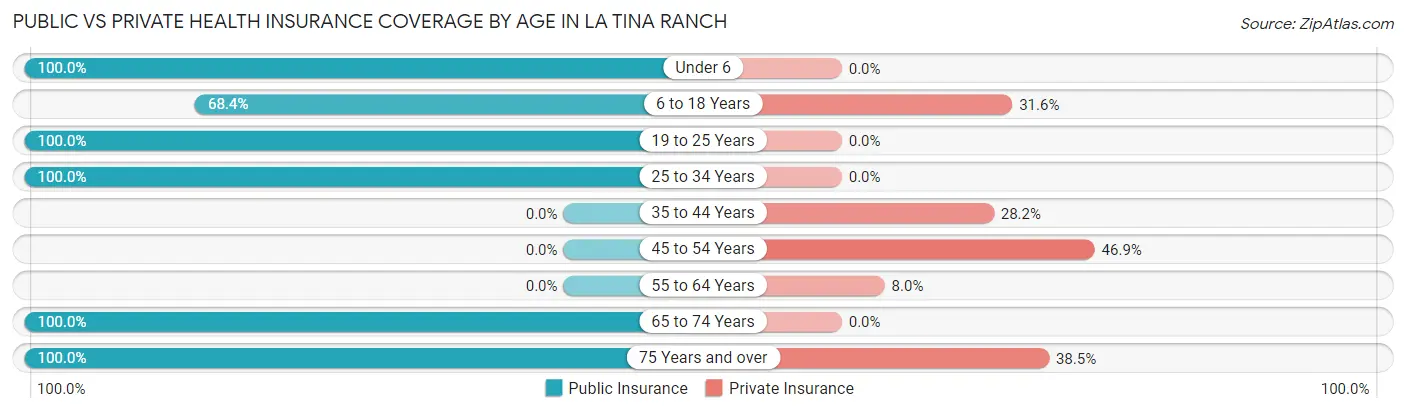
| Age Bracket | Public Insurance | Private Insurance |
| Under 6 | 112 (100.0%) | 0 (0.0%) |
| 6 to 18 Years | 121 (68.4%) | 56 (31.6%) |
| 19 to 25 Years | 50 (100.0%) | 0 (0.0%) |
| 25 to 34 Years | 55 (100.0%) | 0 (0.0%) |
| 35 to 44 Years | 0 (0.0%) | 22 (28.2%) |
| 45 to 54 Years | 0 (0.0%) | 46 (46.9%) |
| 55 to 64 Years | 0 (0.0%) | 9 (8.0%) |
| 65 to 74 Years | 16 (100.0%) | 0 (0.0%) |
| 75 Years and over | 26 (100.0%) | 10 (38.5%) |
| Total | 380 (52.4%) | 143 (19.7%) |
Disability Status by Sex by Age in La Tina Ranch
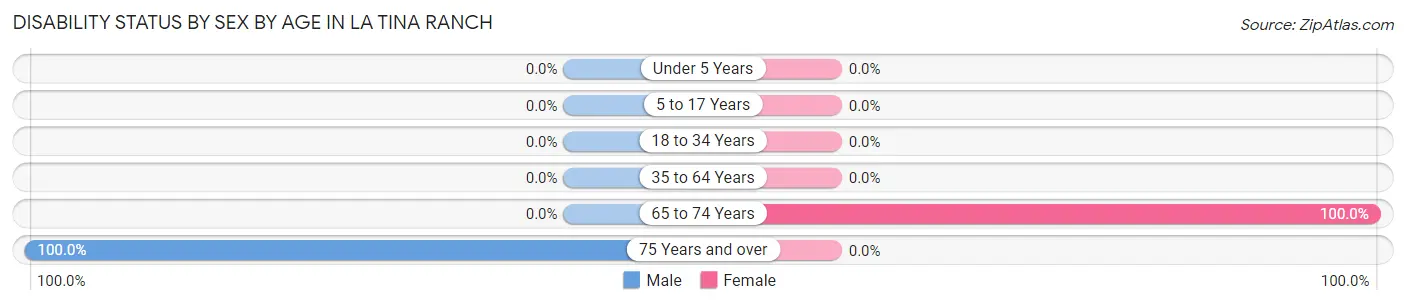
| Age Bracket | Male | Female |
| Under 5 Years | 0 (0.0%) | 0 (0.0%) |
| 5 to 17 Years | 0 (0.0%) | 0 (0.0%) |
| 18 to 34 Years | 0 (0.0%) | 0 (0.0%) |
| 35 to 64 Years | 0 (0.0%) | 0 (0.0%) |
| 65 to 74 Years | 0 (0.0%) | 16 (100.0%) |
| 75 Years and over | 16 (100.0%) | 0 (0.0%) |
Disability Class by Sex by Age in La Tina Ranch
Disability Class: Hearing Difficulty
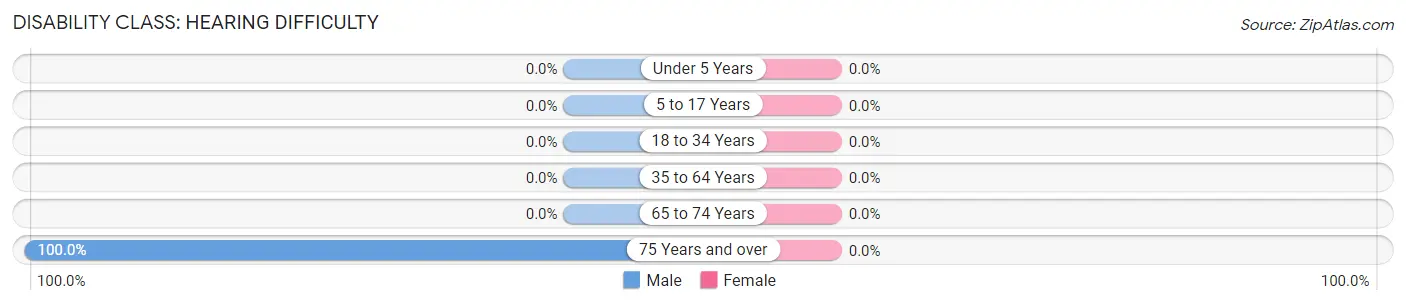
| Age Bracket | Male | Female |
| Under 5 Years | 0 (0.0%) | 0 (0.0%) |
| 5 to 17 Years | 0 (0.0%) | 0 (0.0%) |
| 18 to 34 Years | 0 (0.0%) | 0 (0.0%) |
| 35 to 64 Years | 0 (0.0%) | 0 (0.0%) |
| 65 to 74 Years | 0 (0.0%) | 0 (0.0%) |
| 75 Years and over | 16 (100.0%) | 0 (0.0%) |
Disability Class: Vision Difficulty
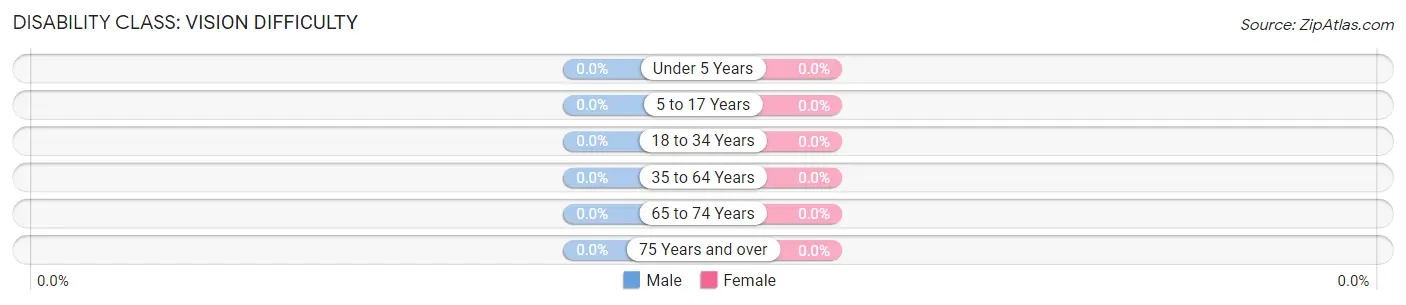
| Age Bracket | Male | Female |
| Under 5 Years | 0 (0.0%) | 0 (0.0%) |
| 5 to 17 Years | 0 (0.0%) | 0 (0.0%) |
| 18 to 34 Years | 0 (0.0%) | 0 (0.0%) |
| 35 to 64 Years | 0 (0.0%) | 0 (0.0%) |
| 65 to 74 Years | 0 (0.0%) | 0 (0.0%) |
| 75 Years and over | 0 (0.0%) | 0 (0.0%) |
Disability Class: Cognitive Difficulty
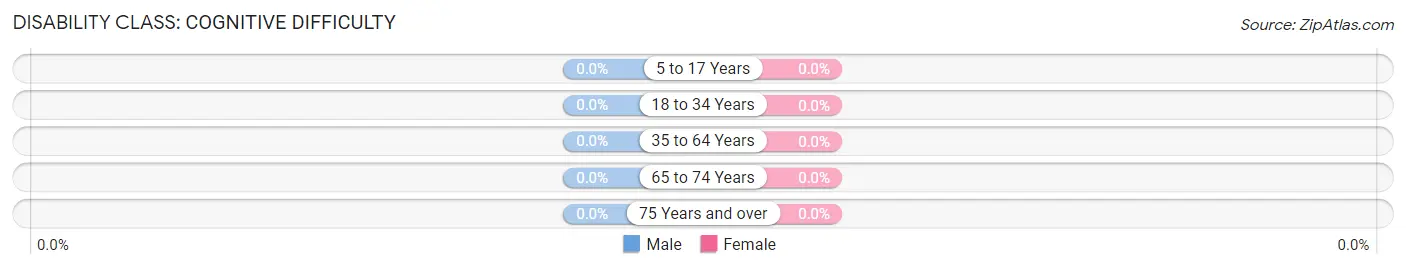
| Age Bracket | Male | Female |
| 5 to 17 Years | 0 (0.0%) | 0 (0.0%) |
| 18 to 34 Years | 0 (0.0%) | 0 (0.0%) |
| 35 to 64 Years | 0 (0.0%) | 0 (0.0%) |
| 65 to 74 Years | 0 (0.0%) | 0 (0.0%) |
| 75 Years and over | 0 (0.0%) | 0 (0.0%) |
Disability Class: Ambulatory Difficulty
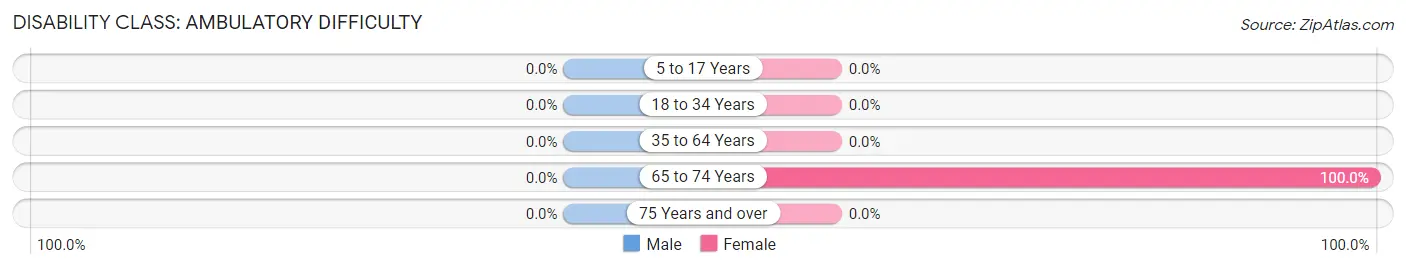
| Age Bracket | Male | Female |
| 5 to 17 Years | 0 (0.0%) | 0 (0.0%) |
| 18 to 34 Years | 0 (0.0%) | 0 (0.0%) |
| 35 to 64 Years | 0 (0.0%) | 0 (0.0%) |
| 65 to 74 Years | 0 (0.0%) | 16 (100.0%) |
| 75 Years and over | 0 (0.0%) | 0 (0.0%) |
Disability Class: Self-Care Difficulty

| Age Bracket | Male | Female |
| 5 to 17 Years | 0 (0.0%) | 0 (0.0%) |
| 18 to 34 Years | 0 (0.0%) | 0 (0.0%) |
| 35 to 64 Years | 0 (0.0%) | 0 (0.0%) |
| 65 to 74 Years | 0 (0.0%) | 16 (100.0%) |
| 75 Years and over | 0 (0.0%) | 0 (0.0%) |
Technology Access in La Tina Ranch
Computing Device Access in La Tina Ranch
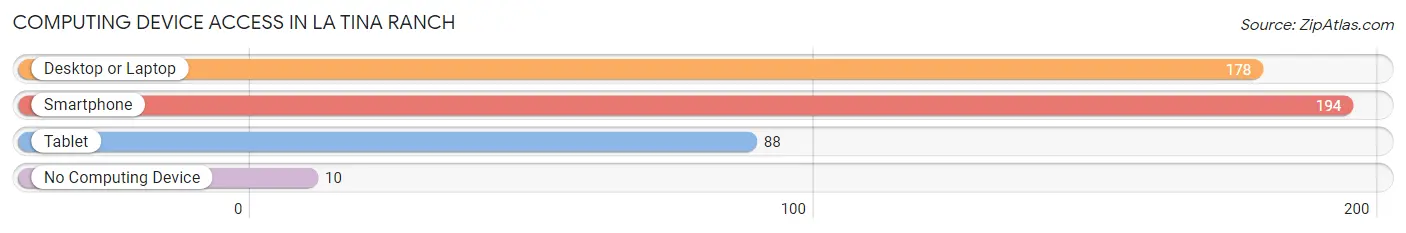
| Device Type | # Households | % Households |
| Desktop or Laptop | 178 | 87.3% |
| Smartphone | 194 | 95.1% |
| Tablet | 88 | 43.1% |
| No Computing Device | 10 | 4.9% |
| Total | 204 | 100.0% |
Internet Access in La Tina Ranch
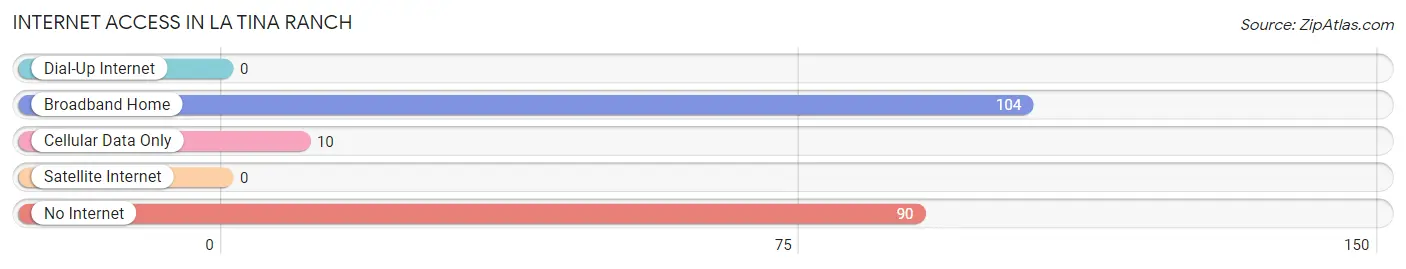
| Internet Type | # Households | % Households |
| Dial-Up Internet | 0 | 0.0% |
| Broadband Home | 104 | 51.0% |
| Cellular Data Only | 10 | 4.9% |
| Satellite Internet | 0 | 0.0% |
| No Internet | 90 | 44.1% |
| Total | 204 | 100.0% |
La Tina Ranch Summary
Tina Ranch, TX is a small unincorporated community located in the western part of Texas, in the county of El Paso. It is situated in the foothills of the Franklin Mountains, about 20 miles west of El Paso. The area is known for its rich history, diverse geography, and vibrant economy.
History
Tina Ranch, TX was first settled in the late 1800s by a group of Mexican settlers. The area was originally known as “La Tina”, which translates to “the little one” in Spanish. The settlers were attracted to the area due to its fertile soil and abundant water sources. The area was also known for its abundance of wild game, which provided the settlers with a steady source of food.
In the early 1900s, the area was home to a number of small ranches, which were owned by local families. These ranches were used to raise cattle, sheep, and horses. The area was also known for its production of wool, which was used to make blankets and clothing.
In the mid-1900s, the area began to experience a population boom as more people moved to the area. This influx of people led to the development of a number of small businesses, including a general store, a post office, and a school.
Geography
Tina Ranch, TX is located in the western part of Texas, in the county of El Paso. It is situated in the foothills of the Franklin Mountains, about 20 miles west of El Paso. The area is known for its diverse geography, which includes rolling hills, canyons, and mesas. The area is also home to a number of natural springs, which provide a steady source of water for the area.
The climate in Tina Ranch, TX is generally mild, with temperatures ranging from the mid-50s in the winter to the mid-90s in the summer. The area receives an average of 12 inches of rain per year, with most of the precipitation occurring in the spring and summer months.
Economy
Tina Ranch, TX is home to a vibrant economy, which is largely based on agriculture and ranching. The area is known for its production of cattle, sheep, and horses, as well as its production of wool. The area is also home to a number of small businesses, including a general store, a post office, and a school.
In recent years, the area has seen an influx of new businesses, including a number of restaurants, bars, and shops. The area is also home to a number of tourist attractions, including the Franklin Mountains State Park and the El Paso Zoo.
Demographics
As of the 2010 census, the population of Tina Ranch, TX was 1,845. The population is largely Hispanic, with over 90% of the population identifying as such. The median household income in the area is $35,000, and the median age is 33. The area is also home to a number of small businesses, including a general store, a post office, and a school.
Common Questions
What is Per Capita Income in La Tina Ranch?
Per Capita income in La Tina Ranch is $13,703.
What is the Median Family Income in La Tina Ranch?
Median Family Income in La Tina Ranch is $22,000.
What is the Median Household income in La Tina Ranch?
Median Household Income in La Tina Ranch is $22,000.
What is Inequality or Gini Index in La Tina Ranch?
Inequality or Gini Index in La Tina Ranch is 0.45.
What is the Total Population of La Tina Ranch?
Total Population of La Tina Ranch is 725.
What is the Total Male Population of La Tina Ranch?
Total Male Population of La Tina Ranch is 370.
What is the Total Female Population of La Tina Ranch?
Total Female Population of La Tina Ranch is 355.
What is the Ratio of Males per 100 Females in La Tina Ranch?
There are 104.23 Males per 100 Females in La Tina Ranch.
What is the Ratio of Females per 100 Males in La Tina Ranch?
There are 95.95 Females per 100 Males in La Tina Ranch.
What is the Median Population Age in La Tina Ranch?
Median Population Age in La Tina Ranch is 26.4 Years.
What is the Average Family Size in La Tina Ranch
Average Family Size in La Tina Ranch is 3.5 People.
What is the Average Household Size in La Tina Ranch
Average Household Size in La Tina Ranch is 3.5 People.
How Large is the Labor Force in La Tina Ranch?
There are 329 People in the Labor Forcein in La Tina Ranch.
What is the Percentage of People in the Labor Force in La Tina Ranch?
66.9% of People are in the Labor Force in La Tina Ranch.