Zip Codes with the Highest Percentage of Population Employed in Food Preparation & Serving in Edinburg, TX
RELATED REPORTS & OPTIONS
Food Preparation & Serving
Edinburg
Compare Zip Codes
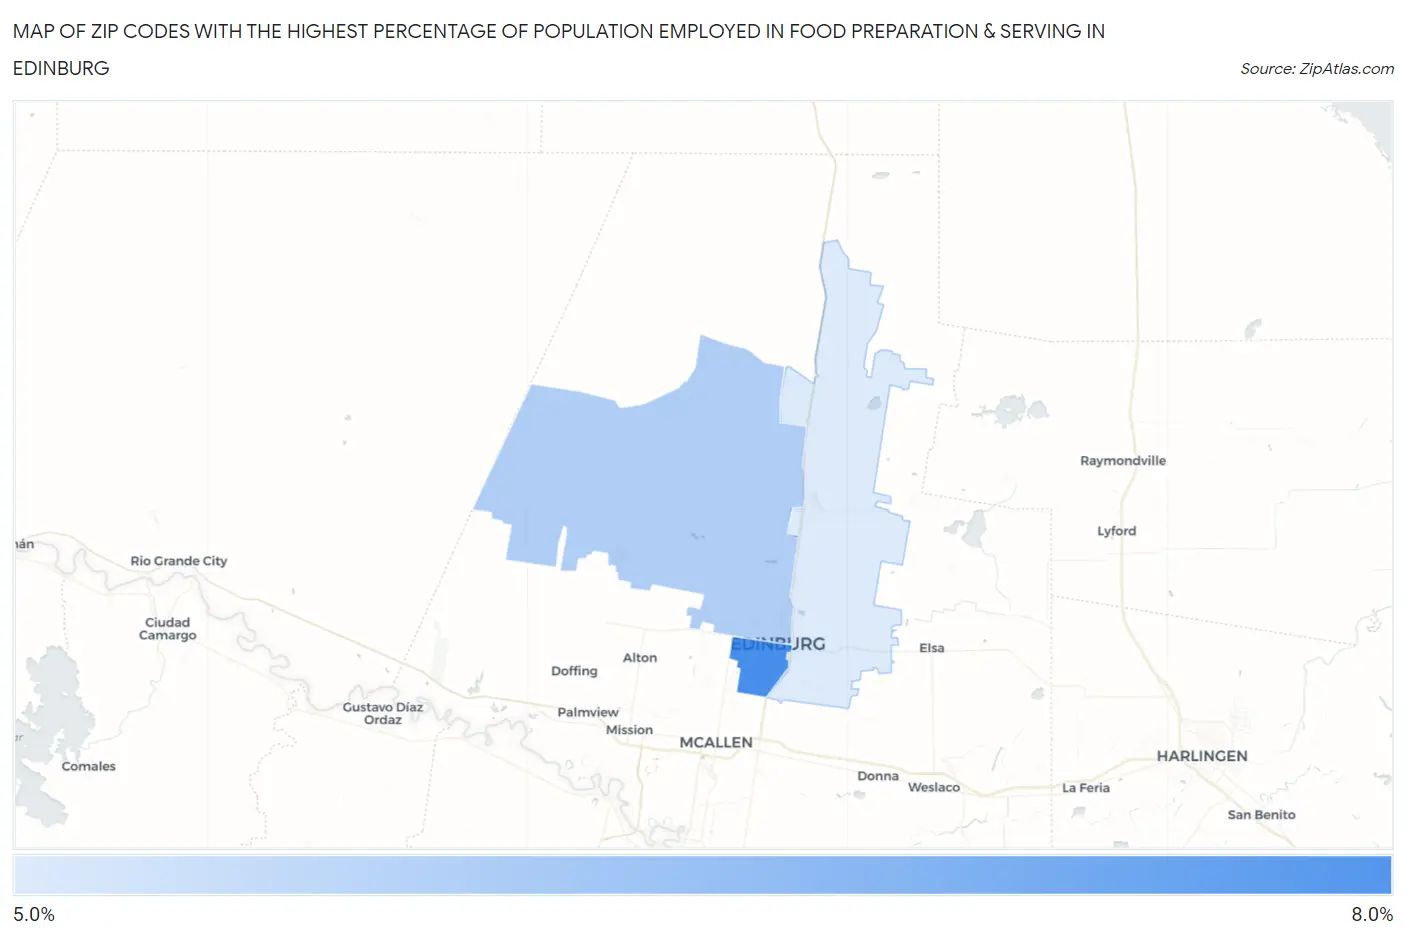
Map of Zip Codes with the Highest Percentage of Population Employed in Food Preparation & Serving in Edinburg
5.1%
6.4%
Zip Codes with the Highest Percentage of Population Employed in Food Preparation & Serving in Edinburg, TX
| Zip Code | % Employed | vs State | vs National | |
| 1. | 78539 | 6.4% | 5.4%(+1.00)#507 | 5.3%(+1.07)#8,259 |
| 2. | 78541 | 5.5% | 5.4%(+0.102)#681 | 5.3%(+0.167)#11,211 |
| 3. | 78542 | 5.1% | 5.4%(-0.286)#792 | 5.3%(-0.221)#12,668 |
1
Common Questions
What are the Top Zip Codes with the Highest Percentage of Population Employed in Food Preparation & Serving in Edinburg, TX?
Top Zip Codes with the Highest Percentage of Population Employed in Food Preparation & Serving in Edinburg, TX are:
What zip code has the Highest Percentage of Population Employed in Food Preparation & Serving in Edinburg, TX?
78539 has the Highest Percentage of Population Employed in Food Preparation & Serving in Edinburg, TX with 6.4%.
What is the Percentage of Population Employed in Food Preparation & Serving in Edinburg, TX?
Percentage of Population Employed in Food Preparation & Serving in Edinburg is 5.8%.
What is the Percentage of Population Employed in Food Preparation & Serving in Texas?
Percentage of Population Employed in Food Preparation & Serving in Texas is 5.4%.
What is the Percentage of Population Employed in Food Preparation & Serving in the United States?
Percentage of Population Employed in Food Preparation & Serving in the United States is 5.3%.