Zip Codes with the Highest Percentage of Population Employed in Food Preparation & Serving in Texas
RELATED REPORTS & OPTIONS
Food Preparation & Serving
Texas
Compare Zip Codes
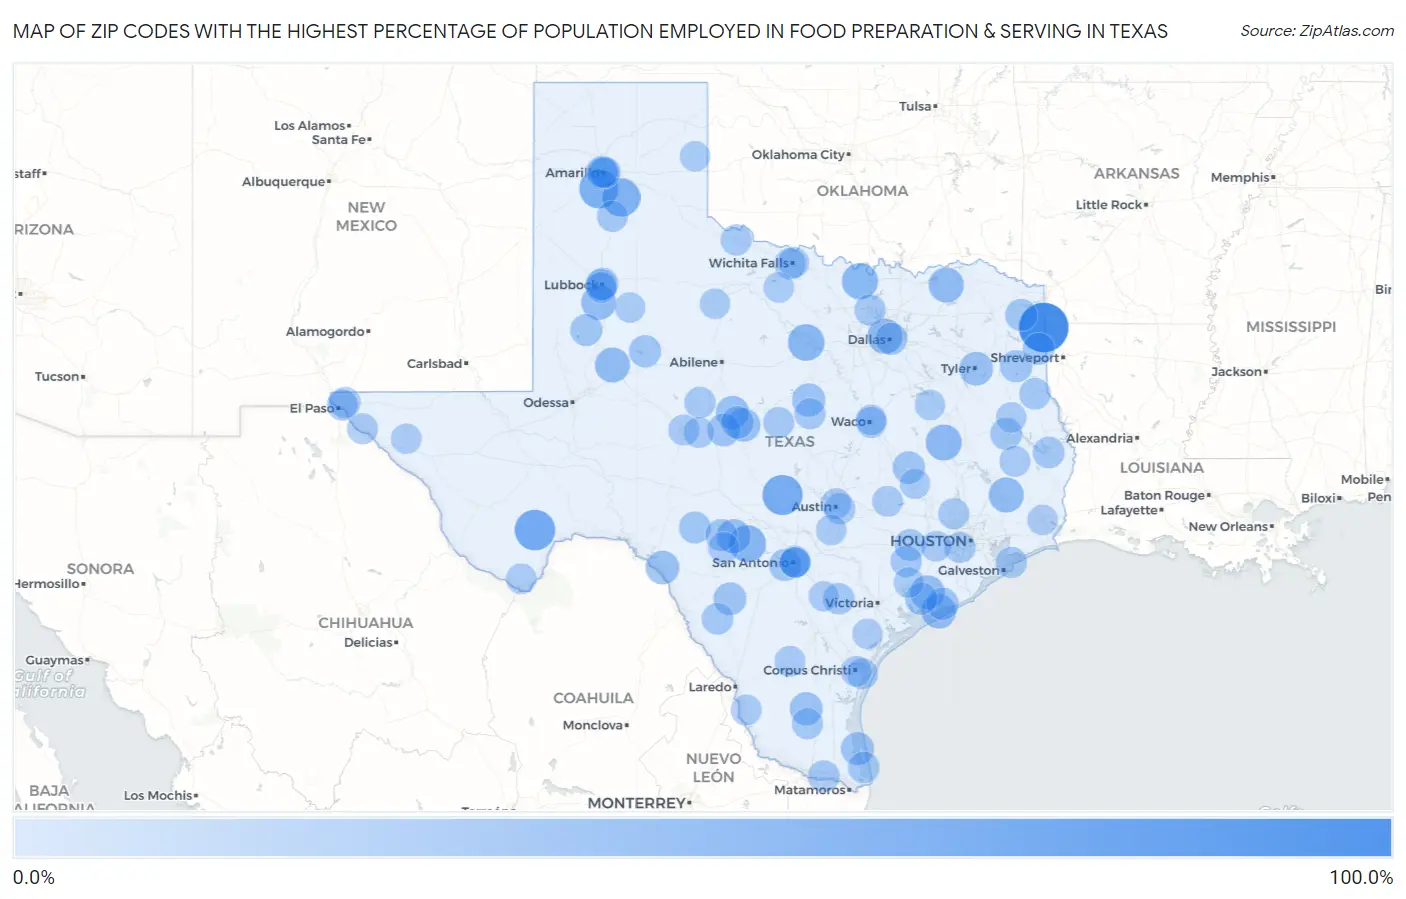
Map of Zip Codes with the Highest Percentage of Population Employed in Food Preparation & Serving in Texas
0.0%
100.0%
Zip Codes with the Highest Percentage of Population Employed in Food Preparation & Serving in Texas
| Zip Code | % Employed | vs State | vs National | |
| 1. | 75565 | 88.6% | 5.4%(+83.2)#1 | 5.3%(+83.3)#16 |
| 2. | 79842 | 52.0% | 5.4%(+46.7)#2 | 5.3%(+46.7)#49 |
| 3. | 78675 | 50.0% | 5.4%(+44.6)#3 | 5.3%(+44.7)#58 |
| 4. | 79016 | 45.4% | 5.4%(+40.1)#4 | 5.3%(+40.1)#72 |
| 5. | 79094 | 42.9% | 5.4%(+37.5)#5 | 5.3%(+37.6)#89 |
| 6. | 78883 | 37.5% | 5.4%(+32.1)#6 | 5.3%(+32.2)#123 |
| 7. | 76484 | 35.7% | 5.4%(+30.3)#7 | 5.3%(+30.4)#143 |
| 8. | 76253 | 34.2% | 5.4%(+28.9)#8 | 5.3%(+28.9)#159 |
| 9. | 75833 | 33.4% | 5.4%(+28.1)#9 | 5.3%(+28.1)#167 |
| 10. | 77369 | 29.9% | 5.4%(+24.6)#10 | 5.3%(+24.7)#212 |
| 11. | 75470 | 29.8% | 5.4%(+24.5)#11 | 5.3%(+24.5)#215 |
| 12. | 75247 | 29.8% | 5.4%(+24.4)#12 | 5.3%(+24.5)#216 |
| 13. | 79748 | 29.5% | 5.4%(+24.2)#13 | 5.3%(+24.2)#223 |
| 14. | 79383 | 28.9% | 5.4%(+23.5)#14 | 5.3%(+23.6)#235 |
| 15. | 77457 | 28.3% | 5.4%(+22.9)#15 | 5.3%(+23.0)#243 |
| 16. | 77456 | 27.2% | 5.4%(+21.9)#16 | 5.3%(+22.0)#259 |
| 17. | 78885 | 26.2% | 5.4%(+20.8)#17 | 5.3%(+20.9)#283 |
| 18. | 78843 | 24.3% | 5.4%(+18.9)#18 | 5.3%(+19.0)#333 |
| 19. | 75711 | 24.1% | 5.4%(+18.7)#19 | 5.3%(+18.8)#338 |
| 20. | 79101 | 23.9% | 5.4%(+18.6)#20 | 5.3%(+18.6)#346 |
| 21. | 76873 | 23.3% | 5.4%(+18.0)#21 | 5.3%(+18.0)#375 |
| 22. | 76884 | 23.1% | 5.4%(+17.7)#22 | 5.3%(+17.8)#382 |
| 23. | 76436 | 22.8% | 5.4%(+17.5)#23 | 5.3%(+17.5)#389 |
| 24. | 78598 | 22.2% | 5.4%(+16.9)#24 | 5.3%(+16.9)#412 |
| 25. | 78355 | 22.0% | 5.4%(+16.6)#25 | 5.3%(+16.7)#420 |
| 26. | 76862 | 20.9% | 5.4%(+15.6)#26 | 5.3%(+15.6)#462 |
| 27. | 78829 | 20.6% | 5.4%(+15.2)#27 | 5.3%(+15.3)#474 |
| 28. | 76845 | 20.0% | 5.4%(+14.6)#28 | 5.3%(+14.7)#503 |
| 29. | 77859 | 19.7% | 5.4%(+14.4)#29 | 5.3%(+14.5)#520 |
| 30. | 77483 | 19.3% | 5.4%(+14.0)#30 | 5.3%(+14.0)#542 |
| 31. | 77419 | 19.0% | 5.4%(+13.6)#31 | 5.3%(+13.7)#568 |
| 32. | 79527 | 18.8% | 5.4%(+13.4)#32 | 5.3%(+13.5)#587 |
| 33. | 75641 | 18.4% | 5.4%(+13.1)#33 | 5.3%(+13.1)#618 |
| 34. | 78236 | 18.4% | 5.4%(+13.0)#34 | 5.3%(+13.1)#621 |
| 35. | 75566 | 18.2% | 5.4%(+12.9)#35 | 5.3%(+12.9)#635 |
| 36. | 75246 | 18.1% | 5.4%(+12.8)#36 | 5.3%(+12.8)#646 |
| 37. | 79377 | 18.1% | 5.4%(+12.7)#37 | 5.3%(+12.8)#653 |
| 38. | 79401 | 18.0% | 5.4%(+12.7)#38 | 5.3%(+12.7)#658 |
| 39. | 75661 | 17.8% | 5.4%(+12.4)#39 | 5.3%(+12.5)#677 |
| 40. | 75903 | 17.6% | 5.4%(+12.3)#40 | 5.3%(+12.4)#687 |
| 41. | 78880 | 17.6% | 5.4%(+12.3)#41 | 5.3%(+12.3)#689 |
| 42. | 78873 | 17.5% | 5.4%(+12.2)#42 | 5.3%(+12.2)#705 |
| 43. | 78834 | 16.7% | 5.4%(+11.4)#43 | 5.3%(+11.4)#770 |
| 44. | 75931 | 16.7% | 5.4%(+11.4)#44 | 5.3%(+11.4)#771 |
| 45. | 78597 | 16.7% | 5.4%(+11.3)#45 | 5.3%(+11.4)#774 |
| 46. | 78579 | 16.5% | 5.4%(+11.1)#46 | 5.3%(+11.2)#801 |
| 47. | 78935 | 16.3% | 5.4%(+10.9)#47 | 5.3%(+11.0)#825 |
| 48. | 75974 | 16.0% | 5.4%(+10.6)#48 | 5.3%(+10.7)#866 |
| 49. | 78151 | 15.8% | 5.4%(+10.5)#49 | 5.3%(+10.5)#882 |
| 50. | 77442 | 15.5% | 5.4%(+10.1)#50 | 5.3%(+10.2)#917 |
| 51. | 79411 | 15.5% | 5.4%(+10.1)#51 | 5.3%(+10.2)#922 |
| 52. | 78208 | 15.2% | 5.4%(+9.82)#52 | 5.3%(+9.88)#959 |
| 53. | 76201 | 15.1% | 5.4%(+9.70)#53 | 5.3%(+9.77)#974 |
| 54. | 77650 | 14.8% | 5.4%(+9.42)#54 | 5.3%(+9.48)#1,014 |
| 55. | 76865 | 14.8% | 5.4%(+9.40)#55 | 5.3%(+9.47)#1,018 |
| 56. | 79088 | 14.5% | 5.4%(+9.16)#56 | 5.3%(+9.23)#1,059 |
| 57. | 79908 | 14.5% | 5.4%(+9.11)#57 | 5.3%(+9.17)#1,067 |
| 58. | 77031 | 14.4% | 5.4%(+9.04)#58 | 5.3%(+9.10)#1,082 |
| 59. | 76309 | 14.3% | 5.4%(+8.98)#59 | 5.3%(+9.04)#1,087 |
| 60. | 79104 | 14.2% | 5.4%(+8.89)#60 | 5.3%(+8.96)#1,113 |
| 61. | 79225 | 14.2% | 5.4%(+8.87)#61 | 5.3%(+8.94)#1,117 |
| 62. | 78353 | 14.1% | 5.4%(+8.75)#62 | 5.3%(+8.82)#1,143 |
| 63. | 79906 | 14.0% | 5.4%(+8.67)#63 | 5.3%(+8.73)#1,154 |
| 64. | 76531 | 14.0% | 5.4%(+8.66)#64 | 5.3%(+8.72)#1,158 |
| 65. | 77362 | 14.0% | 5.4%(+8.64)#65 | 5.3%(+8.71)#1,162 |
| 66. | 76864 | 13.9% | 5.4%(+8.57)#66 | 5.3%(+8.64)#1,179 |
| 67. | 79853 | 13.7% | 5.4%(+8.38)#67 | 5.3%(+8.44)#1,225 |
| 68. | 76908 | 13.7% | 5.4%(+8.37)#68 | 5.3%(+8.44)#1,226 |
| 69. | 78742 | 13.6% | 5.4%(+8.29)#69 | 5.3%(+8.36)#1,241 |
| 70. | 78879 | 13.6% | 5.4%(+8.24)#70 | 5.3%(+8.31)#1,257 |
| 71. | 76798 | 13.5% | 5.4%(+8.16)#71 | 5.3%(+8.22)#1,276 |
| 72. | 78202 | 13.5% | 5.4%(+8.13)#72 | 5.3%(+8.20)#1,282 |
| 73. | 78419 | 13.4% | 5.4%(+8.09)#73 | 5.3%(+8.16)#1,288 |
| 74. | 79412 | 13.4% | 5.4%(+8.01)#74 | 5.3%(+8.08)#1,298 |
| 75. | 75936 | 13.4% | 5.4%(+8.00)#75 | 5.3%(+8.06)#1,301 |
| 76. | 78067 | 13.3% | 5.4%(+7.98)#76 | 5.3%(+8.05)#1,305 |
| 77. | 76937 | 13.2% | 5.4%(+7.81)#77 | 5.3%(+7.87)#1,357 |
| 78. | 77853 | 13.1% | 5.4%(+7.70)#78 | 5.3%(+7.77)#1,381 |
| 79. | 78756 | 13.0% | 5.4%(+7.66)#79 | 5.3%(+7.72)#1,393 |
| 80. | 76301 | 12.9% | 5.4%(+7.60)#80 | 5.3%(+7.66)#1,405 |
| 81. | 78411 | 12.9% | 5.4%(+7.58)#81 | 5.3%(+7.65)#1,407 |
| 82. | 78357 | 12.9% | 5.4%(+7.50)#82 | 5.3%(+7.57)#1,430 |
| 83. | 76704 | 12.5% | 5.4%(+7.15)#83 | 5.3%(+7.22)#1,509 |
| 84. | 78656 | 12.4% | 5.4%(+7.03)#84 | 5.3%(+7.09)#1,548 |
| 85. | 77476 | 12.3% | 5.4%(+6.99)#85 | 5.3%(+7.06)#1,555 |
| 86. | 79102 | 12.1% | 5.4%(+6.79)#86 | 5.3%(+6.86)#1,617 |
| 87. | 79834 | 12.0% | 5.4%(+6.65)#87 | 5.3%(+6.71)#1,666 |
| 88. | 79851 | 12.0% | 5.4%(+6.63)#88 | 5.3%(+6.69)#1,674 |
| 89. | 76351 | 11.9% | 5.4%(+6.59)#89 | 5.3%(+6.66)#1,688 |
| 90. | 75840 | 11.9% | 5.4%(+6.59)#90 | 5.3%(+6.65)#1,689 |
| 91. | 77701 | 11.9% | 5.4%(+6.59)#91 | 5.3%(+6.65)#1,691 |
| 92. | 79544 | 11.9% | 5.4%(+6.52)#92 | 5.3%(+6.58)#1,711 |
| 93. | 77455 | 11.8% | 5.4%(+6.48)#93 | 5.3%(+6.55)#1,725 |
| 94. | 78203 | 11.8% | 5.4%(+6.47)#94 | 5.3%(+6.54)#1,728 |
| 95. | 79356 | 11.8% | 5.4%(+6.47)#95 | 5.3%(+6.53)#1,729 |
| 96. | 79096 | 11.8% | 5.4%(+6.43)#96 | 5.3%(+6.49)#1,742 |
| 97. | 75962 | 11.7% | 5.4%(+6.37)#97 | 5.3%(+6.44)#1,763 |
| 98. | 77843 | 11.6% | 5.4%(+6.22)#98 | 5.3%(+6.28)#1,823 |
| 99. | 78118 | 11.5% | 5.4%(+6.18)#99 | 5.3%(+6.25)#1,840 |
| 100. | 78377 | 11.5% | 5.4%(+6.11)#100 | 5.3%(+6.17)#1,857 |
Common Questions
What are the Top 10 Zip Codes with the Highest Percentage of Population Employed in Food Preparation & Serving in Texas?
Top 10 Zip Codes with the Highest Percentage of Population Employed in Food Preparation & Serving in Texas are:
What zip code has the Highest Percentage of Population Employed in Food Preparation & Serving in Texas?
75565 has the Highest Percentage of Population Employed in Food Preparation & Serving in Texas with 88.6%.
What is the Percentage of Population Employed in Food Preparation & Serving in the State of Texas?
Percentage of Population Employed in Food Preparation & Serving in Texas is 5.4%.
What is the Percentage of Population Employed in Food Preparation & Serving in the United States?
Percentage of Population Employed in Food Preparation & Serving in the United States is 5.3%.