Zip Codes with the Highest Percentage of Population Employed in Food Preparation & Serving in Lufkin, TX
RELATED REPORTS & OPTIONS
Food Preparation & Serving
Lufkin
Compare Zip Codes
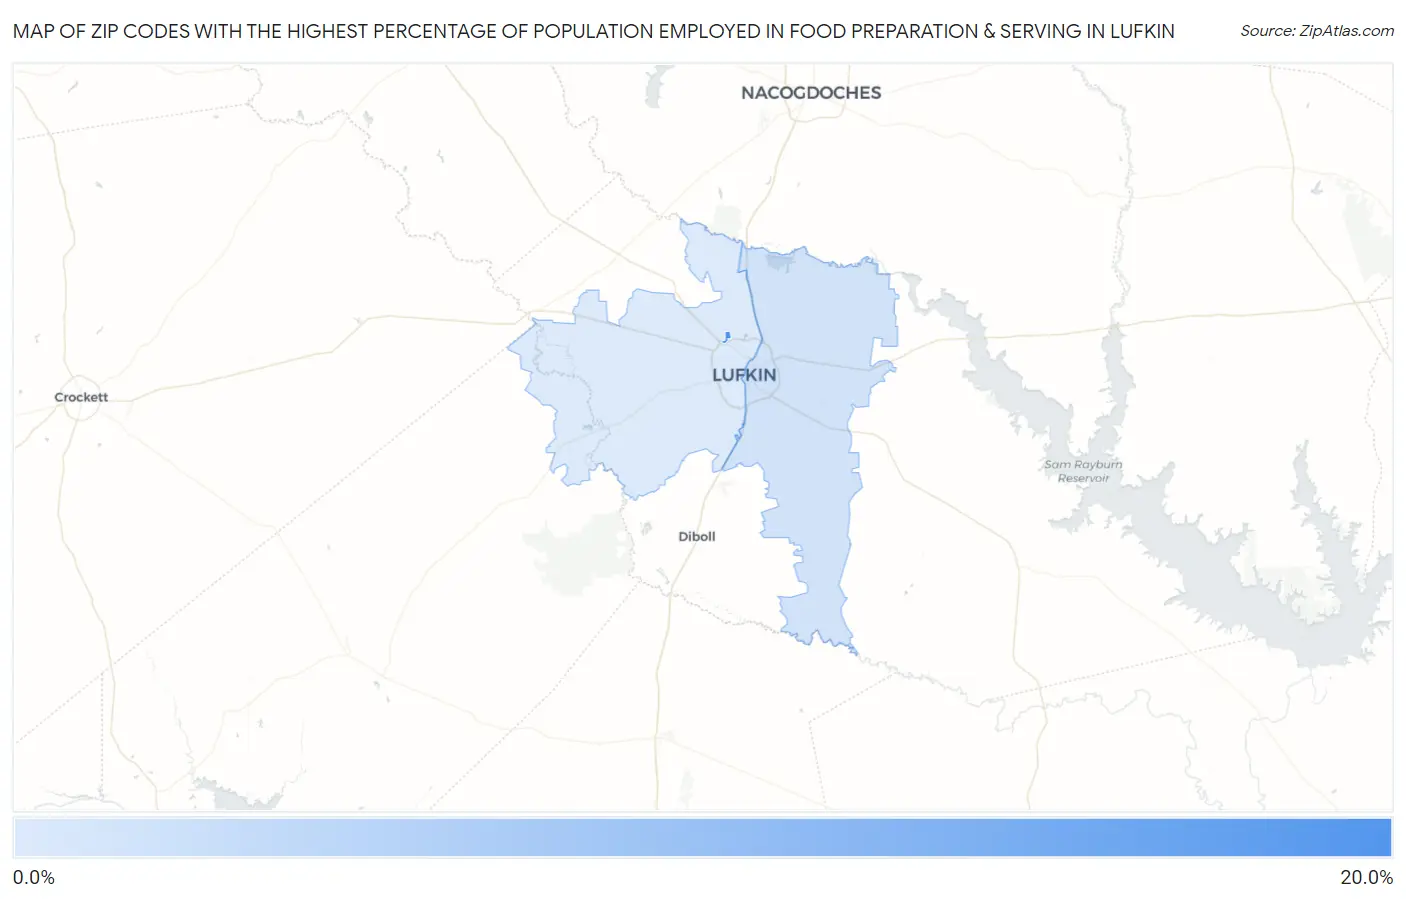
Map of Zip Codes with the Highest Percentage of Population Employed in Food Preparation & Serving in Lufkin
6.1%
17.6%
Zip Codes with the Highest Percentage of Population Employed in Food Preparation & Serving in Lufkin, TX
| Zip Code | % Employed | vs State | vs National | |
| 1. | 75903 | 17.6% | 5.4%(+12.3)#40 | 5.3%(+12.4)#687 |
| 2. | 75901 | 6.9% | 5.4%(+1.56)#424 | 5.3%(+1.63)#6,782 |
| 3. | 75904 | 6.1% | 5.4%(+0.748)#544 | 5.3%(+0.813)#9,026 |
1
Common Questions
What are the Top Zip Codes with the Highest Percentage of Population Employed in Food Preparation & Serving in Lufkin, TX?
Top Zip Codes with the Highest Percentage of Population Employed in Food Preparation & Serving in Lufkin, TX are:
What zip code has the Highest Percentage of Population Employed in Food Preparation & Serving in Lufkin, TX?
75903 has the Highest Percentage of Population Employed in Food Preparation & Serving in Lufkin, TX with 17.6%.
What is the Percentage of Population Employed in Food Preparation & Serving in Lufkin, TX?
Percentage of Population Employed in Food Preparation & Serving in Lufkin is 8.4%.
What is the Percentage of Population Employed in Food Preparation & Serving in Texas?
Percentage of Population Employed in Food Preparation & Serving in Texas is 5.4%.
What is the Percentage of Population Employed in Food Preparation & Serving in the United States?
Percentage of Population Employed in Food Preparation & Serving in the United States is 5.3%.