Zip Codes with the Highest Percentage of Population Employed in Food Preparation & Serving in Arlington, TX
RELATED REPORTS & OPTIONS
Food Preparation & Serving
Arlington
Compare Zip Codes
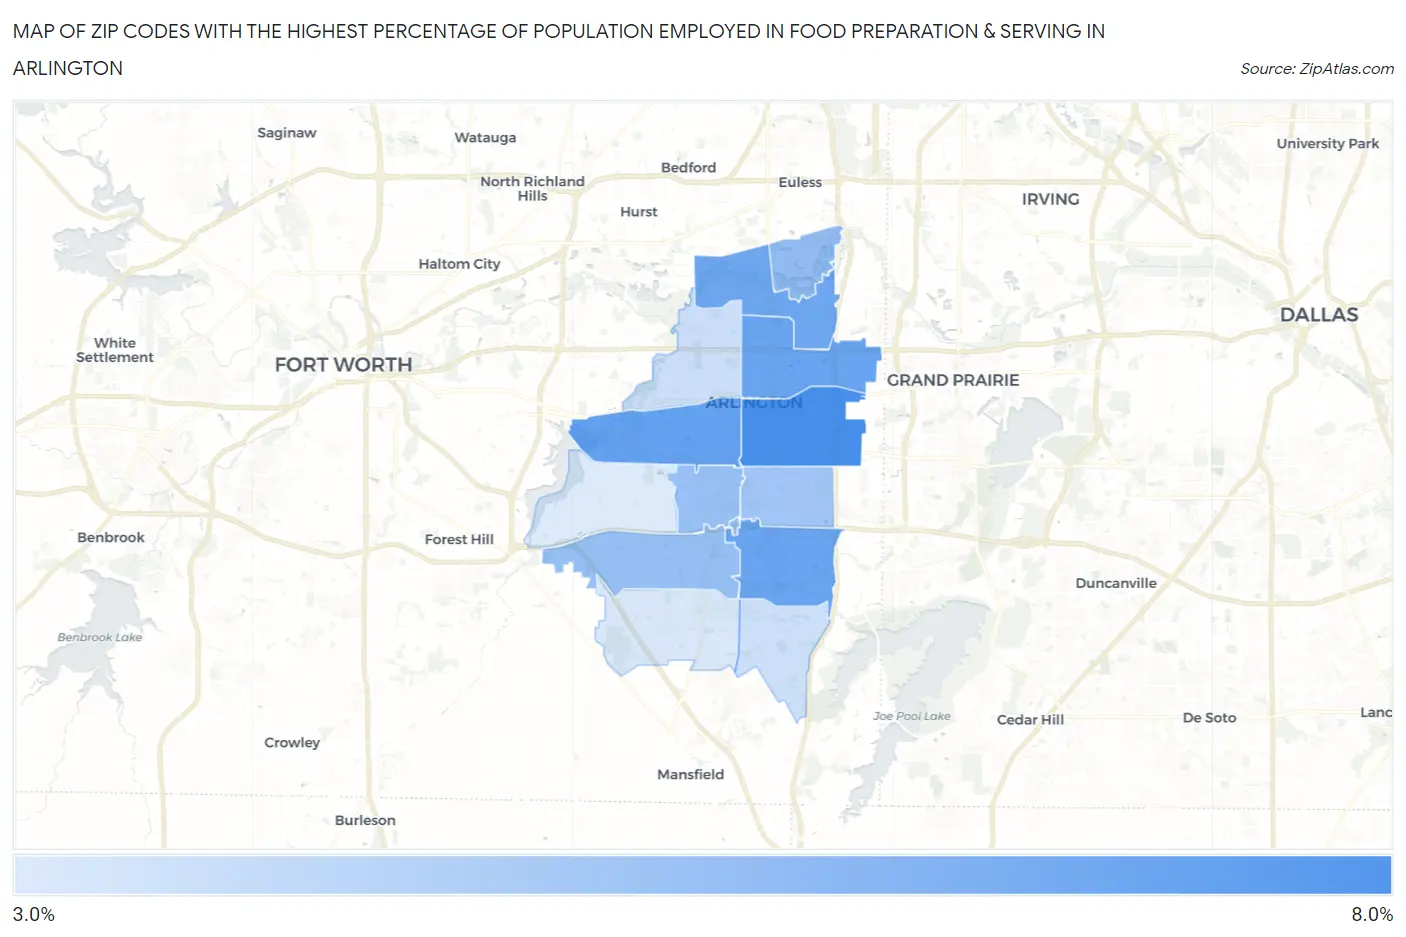
Map of Zip Codes with the Highest Percentage of Population Employed in Food Preparation & Serving in Arlington
3.6%
7.4%
Zip Codes with the Highest Percentage of Population Employed in Food Preparation & Serving in Arlington, TX
| Zip Code | % Employed | vs State | vs National | |
| 1. | 76010 | 7.4% | 5.4%(+2.04)#363 | 5.3%(+2.11)#5,754 |
| 2. | 76013 | 6.7% | 5.4%(+1.31)#458 | 5.3%(+1.38)#7,441 |
| 3. | 76018 | 6.5% | 5.4%(+1.19)#482 | 5.3%(+1.25)#7,765 |
| 4. | 76011 | 6.5% | 5.4%(+1.15)#485 | 5.3%(+1.22)#7,857 |
| 5. | 76006 | 6.4% | 5.4%(+1.03)#505 | 5.3%(+1.09)#8,201 |
| 6. | 76005 | 5.5% | 5.4%(+0.124)#677 | 5.3%(+0.189)#11,141 |
| 7. | 76017 | 5.4% | 5.4%(+0.077)#689 | 5.3%(+0.142)#11,307 |
| 8. | 76015 | 5.3% | 5.4%(-0.008)#716 | 5.3%(+0.058)#11,601 |
| 9. | 76014 | 5.1% | 5.4%(-0.251)#781 | 5.3%(-0.186)#12,546 |
| 10. | 76012 | 4.1% | 5.4%(-1.25)#1,014 | 5.3%(-1.18)#16,689 |
| 11. | 76002 | 4.0% | 5.4%(-1.34)#1,042 | 5.3%(-1.27)#17,084 |
| 12. | 76001 | 3.7% | 5.4%(-1.62)#1,104 | 5.3%(-1.56)#18,214 |
| 13. | 76016 | 3.6% | 5.4%(-1.73)#1,133 | 5.3%(-1.67)#18,704 |
1
Common Questions
What are the Top 10 Zip Codes with the Highest Percentage of Population Employed in Food Preparation & Serving in Arlington, TX?
Top 10 Zip Codes with the Highest Percentage of Population Employed in Food Preparation & Serving in Arlington, TX are:
What zip code has the Highest Percentage of Population Employed in Food Preparation & Serving in Arlington, TX?
76010 has the Highest Percentage of Population Employed in Food Preparation & Serving in Arlington, TX with 7.4%.
What is the Percentage of Population Employed in Food Preparation & Serving in Arlington, TX?
Percentage of Population Employed in Food Preparation & Serving in Arlington is 5.5%.
What is the Percentage of Population Employed in Food Preparation & Serving in Texas?
Percentage of Population Employed in Food Preparation & Serving in Texas is 5.4%.
What is the Percentage of Population Employed in Food Preparation & Serving in the United States?
Percentage of Population Employed in Food Preparation & Serving in the United States is 5.3%.