Zip Codes with the Highest Percentage of Population Employed in Food Preparation & Serving in Athens, TX
RELATED REPORTS & OPTIONS
Food Preparation & Serving
Athens
Compare Zip Codes
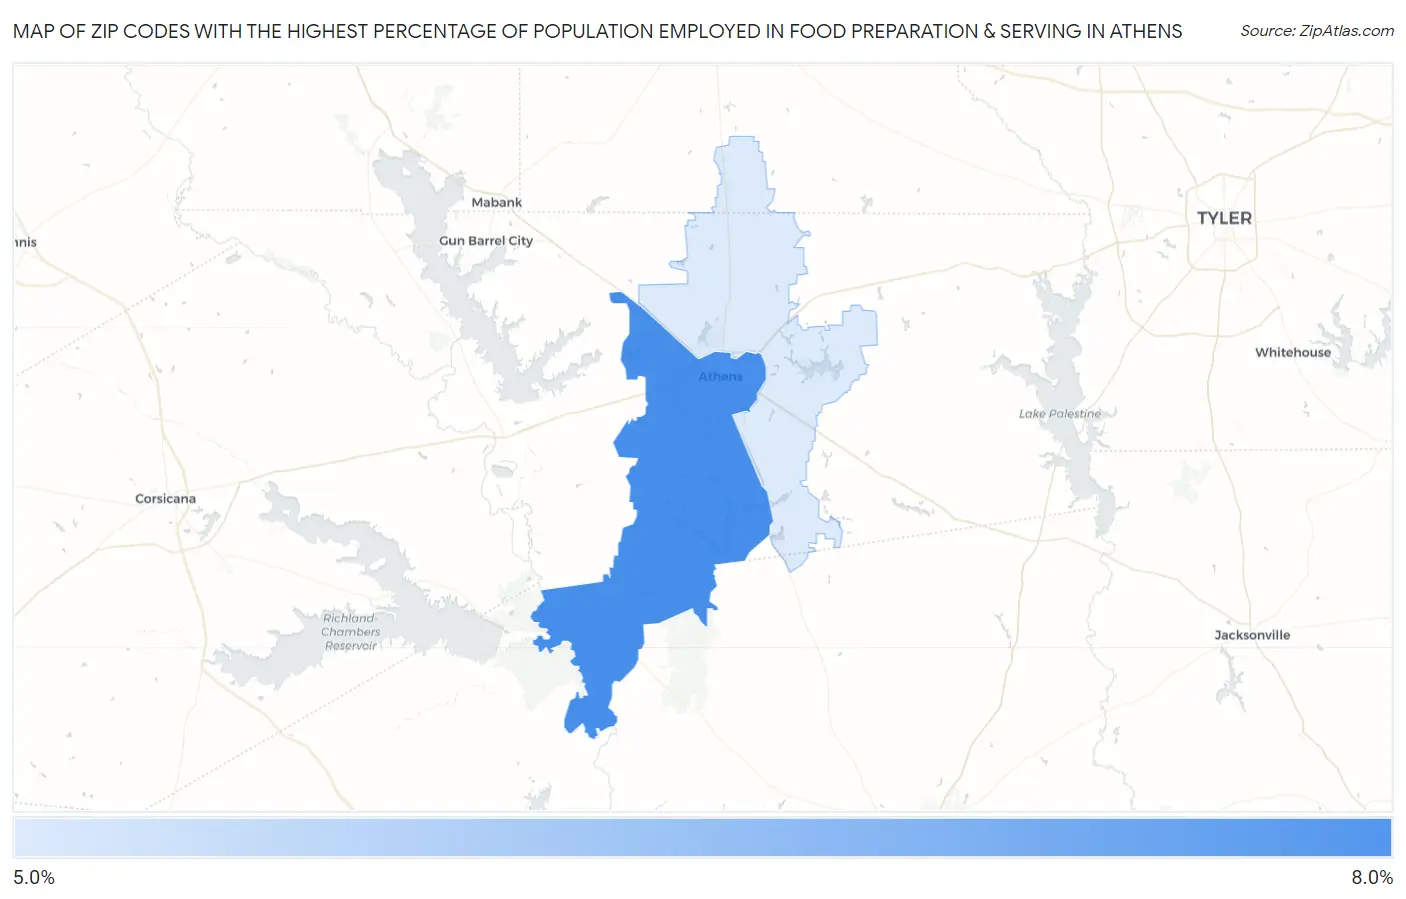
Map of Zip Codes with the Highest Percentage of Population Employed in Food Preparation & Serving in Athens
5.3%
7.4%
Zip Codes with the Highest Percentage of Population Employed in Food Preparation & Serving in Athens, TX
| Zip Code | % Employed | vs State | vs National | |
| 1. | 75751 | 7.4% | 5.4%(+2.07)#358 | 5.3%(+2.14)#5,704 |
| 2. | 75752 | 5.3% | 5.4%(-0.046)#729 | 5.3%(+0.019)#11,743 |
1
Common Questions
What are the Top Zip Codes with the Highest Percentage of Population Employed in Food Preparation & Serving in Athens, TX?
Top Zip Codes with the Highest Percentage of Population Employed in Food Preparation & Serving in Athens, TX are:
What zip code has the Highest Percentage of Population Employed in Food Preparation & Serving in Athens, TX?
75751 has the Highest Percentage of Population Employed in Food Preparation & Serving in Athens, TX with 7.4%.
What is the Percentage of Population Employed in Food Preparation & Serving in Athens, TX?
Percentage of Population Employed in Food Preparation & Serving in Athens is 7.6%.
What is the Percentage of Population Employed in Food Preparation & Serving in Texas?
Percentage of Population Employed in Food Preparation & Serving in Texas is 5.4%.
What is the Percentage of Population Employed in Food Preparation & Serving in the United States?
Percentage of Population Employed in Food Preparation & Serving in the United States is 5.3%.