Zip Codes with the Highest Percentage of Population Employed in Food Preparation & Serving in Denison, TX
RELATED REPORTS & OPTIONS
Food Preparation & Serving
Denison
Compare Zip Codes
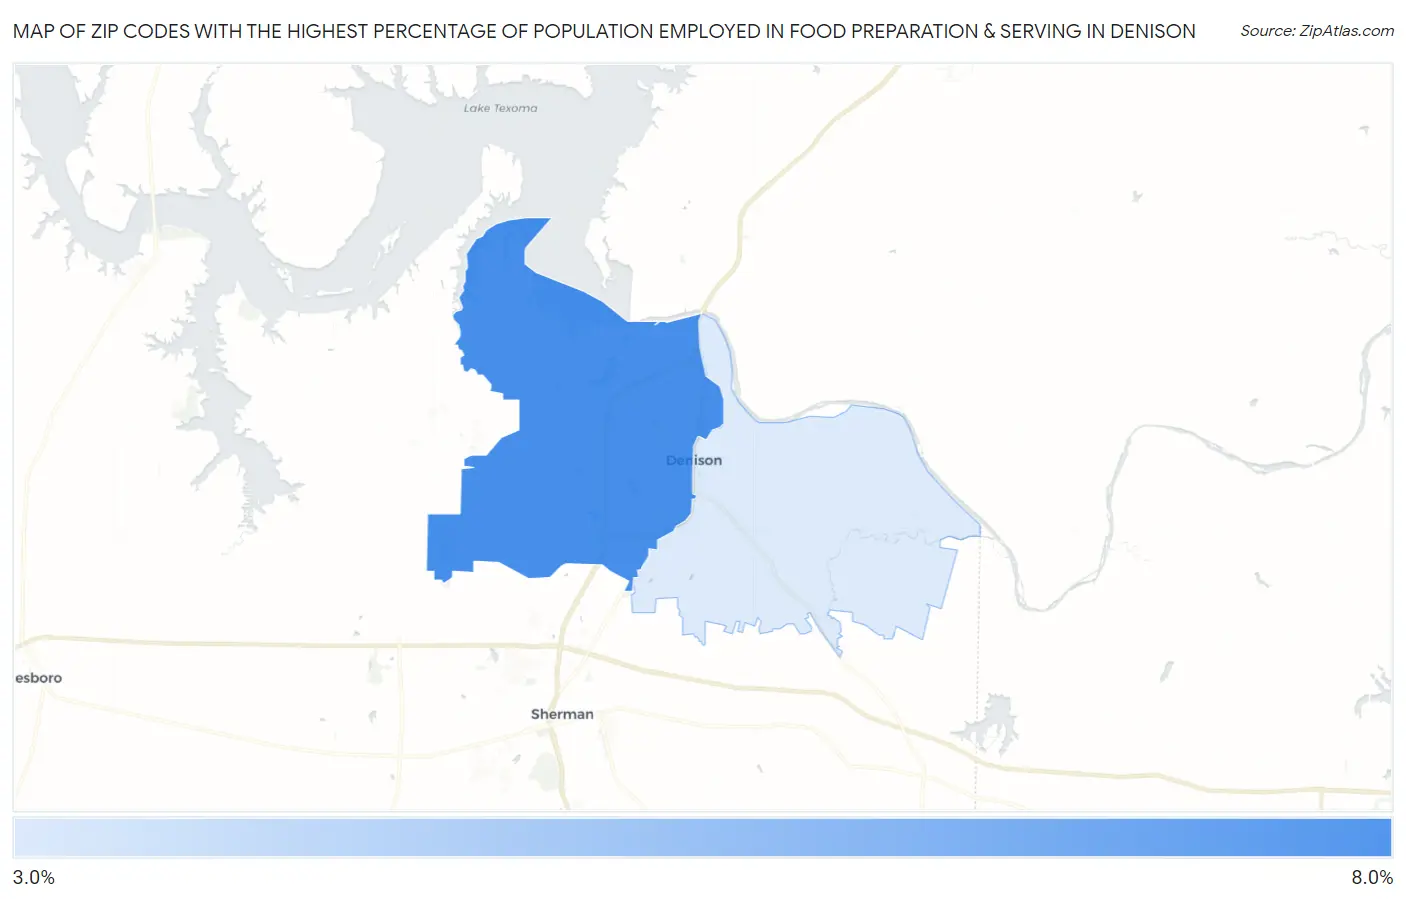
Map of Zip Codes with the Highest Percentage of Population Employed in Food Preparation & Serving in Denison
3.8%
6.4%
Zip Codes with the Highest Percentage of Population Employed in Food Preparation & Serving in Denison, TX
| Zip Code | % Employed | vs State | vs National | |
| 1. | 75020 | 6.4% | 5.4%(+1.07)#498 | 5.3%(+1.14)#8,082 |
| 2. | 75021 | 3.8% | 5.4%(-1.54)#1,087 | 5.3%(-1.48)#17,895 |
1
Common Questions
What are the Top Zip Codes with the Highest Percentage of Population Employed in Food Preparation & Serving in Denison, TX?
Top Zip Codes with the Highest Percentage of Population Employed in Food Preparation & Serving in Denison, TX are:
What zip code has the Highest Percentage of Population Employed in Food Preparation & Serving in Denison, TX?
75020 has the Highest Percentage of Population Employed in Food Preparation & Serving in Denison, TX with 6.4%.
What is the Percentage of Population Employed in Food Preparation & Serving in Denison, TX?
Percentage of Population Employed in Food Preparation & Serving in Denison is 6.4%.
What is the Percentage of Population Employed in Food Preparation & Serving in Texas?
Percentage of Population Employed in Food Preparation & Serving in Texas is 5.4%.
What is the Percentage of Population Employed in Food Preparation & Serving in the United States?
Percentage of Population Employed in Food Preparation & Serving in the United States is 5.3%.