Salineno North, TX Map & Demographics
Salineno North Overview
$7,058
PER CAPITA INCOME
0.44
INEQUALITY / GINI INDEX
77
TOTAL POPULATION
30
MALE POPULATION
47
FEMALE POPULATION
63.83
MALES / 100 FEMALES
156.67
FEMALES / 100 MALES
26.8
MEDIAN AGE
3.8
AVG FAMILY SIZE
3.0
AVG HOUSEHOLD SIZE
21
LABOR FORCE [ PEOPLE ]
48.8%
PERCENT IN LABOR FORCE
Income in Salineno North
Income Overview in Salineno North
| Characteristic | Number | Measure |
| Per Capita Income | 77 | $7,058 |
| Median Family Income | 18 | $0 |
| Mean Family Income | 18 | $24,911 |
| Median Household Income | 26 | $0 |
| Mean Household Income | 26 | $20,358 |
| Income Deficit | 18 | $0 |
| Wage / Income Gap (%) | 77 | 0.00% |
| Wage / Income Gap ($) | 77 | 100.00¢ per $1 |
| Gini / Inequality Index | 77 | 0.44 |
Earnings by Sex in Salineno North
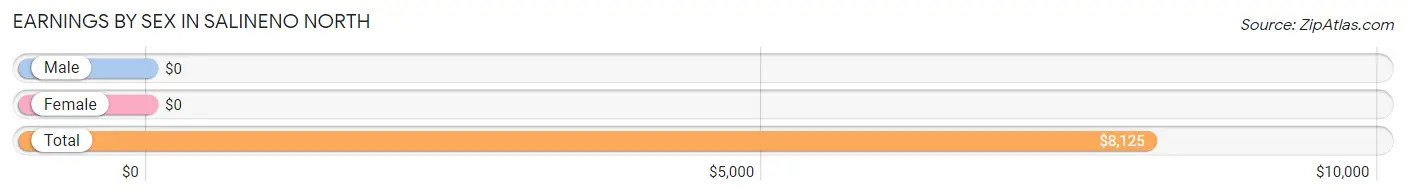
| Sex | Number | Average Earnings |
| Male | 5 (18.5%) | $0 |
| Female | 22 (81.5%) | $0 |
| Total | 27 (100.0%) | $8,125 |
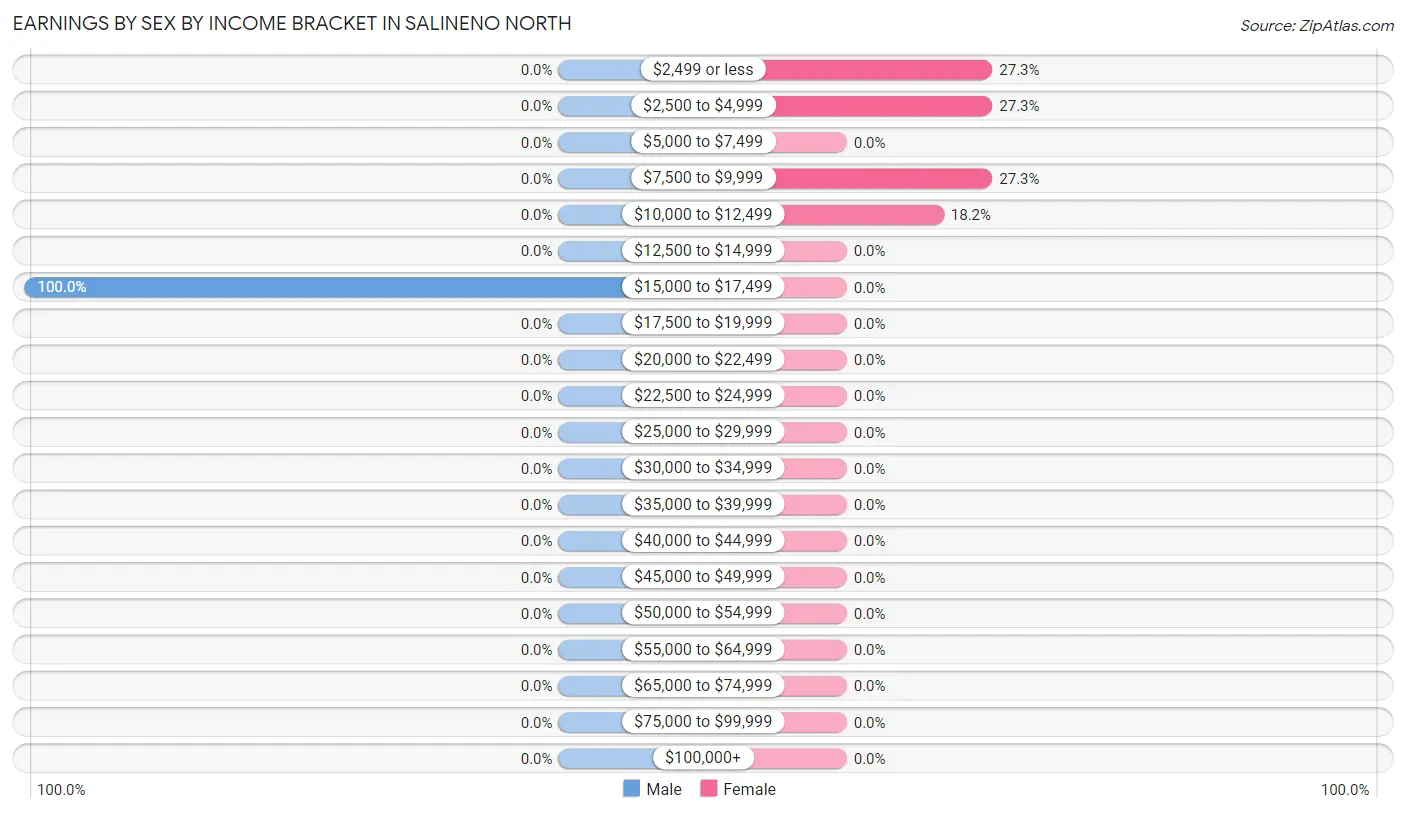
Earnings by Sex by Income Bracket in Salineno North
The most common earnings brackets in Salineno North are $15,000 to $17,499 for men (5 | 100.0%) and $2,499 or less for women (6 | 27.3%).
| Income | Male | Female |
| $2,499 or less | 0 (0.0%) | 6 (27.3%) |
| $2,500 to $4,999 | 0 (0.0%) | 6 (27.3%) |
| $5,000 to $7,499 | 0 (0.0%) | 0 (0.0%) |
| $7,500 to $9,999 | 0 (0.0%) | 6 (27.3%) |
| $10,000 to $12,499 | 0 (0.0%) | 4 (18.2%) |
| $12,500 to $14,999 | 0 (0.0%) | 0 (0.0%) |
| $15,000 to $17,499 | 5 (100.0%) | 0 (0.0%) |
| $17,500 to $19,999 | 0 (0.0%) | 0 (0.0%) |
| $20,000 to $22,499 | 0 (0.0%) | 0 (0.0%) |
| $22,500 to $24,999 | 0 (0.0%) | 0 (0.0%) |
| $25,000 to $29,999 | 0 (0.0%) | 0 (0.0%) |
| $30,000 to $34,999 | 0 (0.0%) | 0 (0.0%) |
| $35,000 to $39,999 | 0 (0.0%) | 0 (0.0%) |
| $40,000 to $44,999 | 0 (0.0%) | 0 (0.0%) |
| $45,000 to $49,999 | 0 (0.0%) | 0 (0.0%) |
| $50,000 to $54,999 | 0 (0.0%) | 0 (0.0%) |
| $55,000 to $64,999 | 0 (0.0%) | 0 (0.0%) |
| $65,000 to $74,999 | 0 (0.0%) | 0 (0.0%) |
| $75,000 to $99,999 | 0 (0.0%) | 0 (0.0%) |
| $100,000+ | 0 (0.0%) | 0 (0.0%) |
| Total | 5 (100.0%) | 22 (100.0%) |
Earnings by Sex by Educational Attainment in Salineno North
| Educational Attainment | Male Income | Female Income |
| Less than High School | - | - |
| High School Diploma | - | - |
| College or Associate's Degree | - | - |
| Bachelor's Degree | - | - |
| Graduate Degree | - | - |
| Total | - | - |
Family Income in Salineno North
Family Income Brackets in Salineno North
According to the Salineno North family income data, there are 6 families falling into the less than $10,000 income range, which is the most common income bracket and makes up 33.3% of all families.
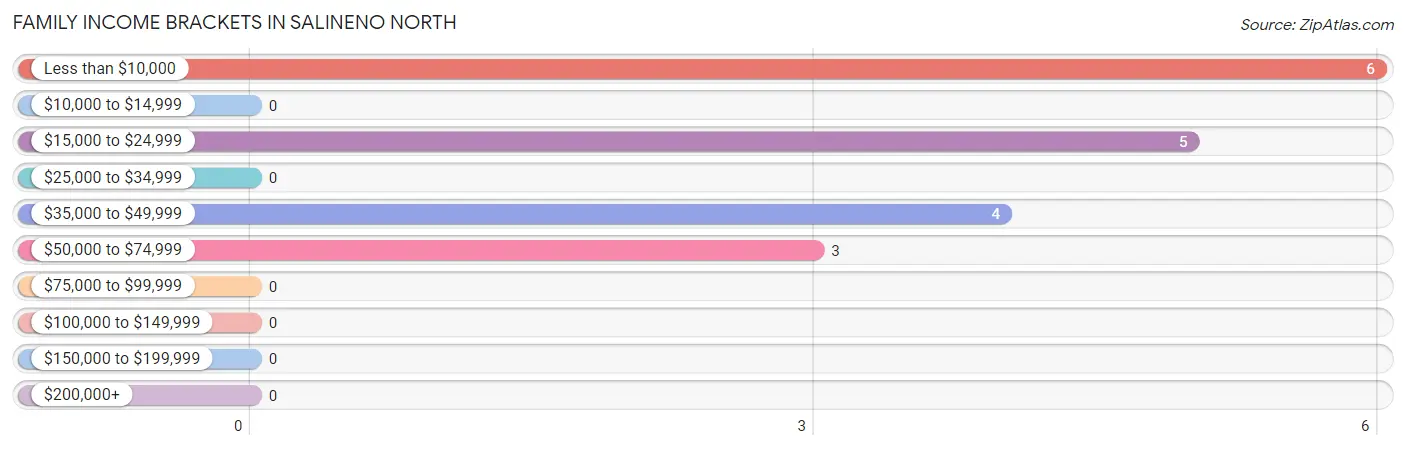
| Income Bracket | # Families | % Families |
| Less than $10,000 | 6 | 33.3% |
| $10,000 to $14,999 | 0 | 0.0% |
| $15,000 to $24,999 | 5 | 27.8% |
| $25,000 to $34,999 | 0 | 0.0% |
| $35,000 to $49,999 | 4 | 22.2% |
| $50,000 to $74,999 | 3 | 16.7% |
| $75,000 to $99,999 | 0 | 0.0% |
| $100,000 to $149,999 | 0 | 0.0% |
| $150,000 to $199,999 | 0 | 0.0% |
| $200,000+ | 0 | 0.0% |
Family Income by Famaliy Size in Salineno North
| Income Bracket | # Families | Median Income |
| 2-Person Families | 9 (50.0%) | $0 |
| 3-Person Families | 0 (0.0%) | $0 |
| 4-Person Families | 9 (50.0%) | $0 |
| 5-Person Families | 0 (0.0%) | $0 |
| 6-Person Families | 0 (0.0%) | $0 |
| 7+ Person Families | 0 (0.0%) | $0 |
| Total | 18 (100.0%) | $0 |
Family Income by Number of Earners in Salineno North
| Number of Earners | # Families | Median Income |
| No Earners | 3 (16.7%) | $0 |
| 1 Earner | 6 (33.3%) | $0 |
| 2 Earners | 9 (50.0%) | $0 |
| 3+ Earners | 0 (0.0%) | $0 |
| Total | 18 (100.0%) | $0 |
Household Income in Salineno North
Household Income Brackets in Salineno North
With 8 households falling in the category, the $10,000 to $14,999 income range is the most frequent in Salineno North, accounting for 30.8% of all households.
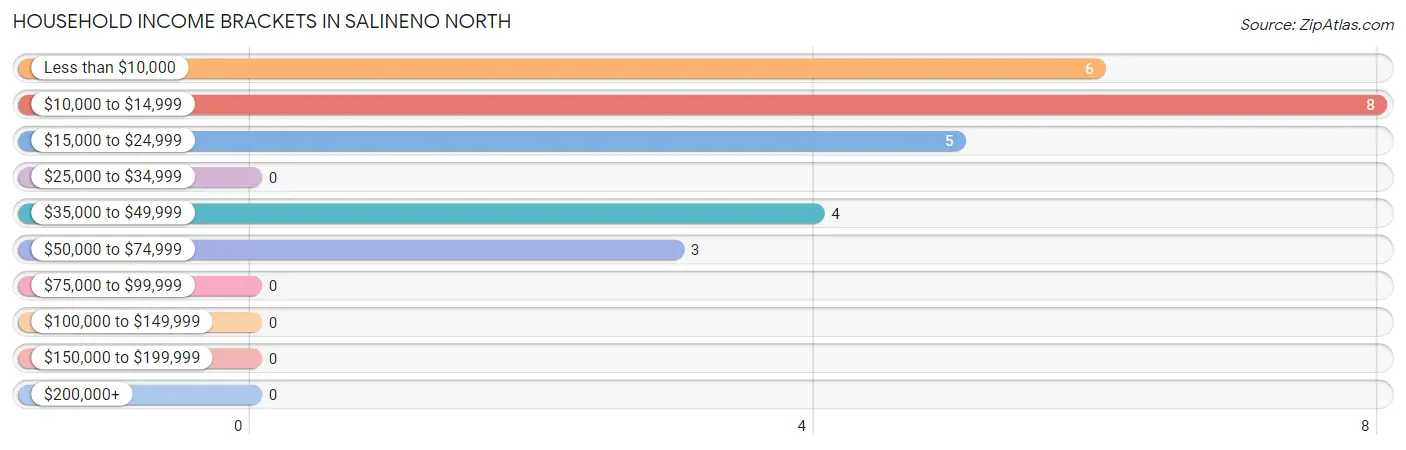
| Income Bracket | # Households | % Households |
| Less than $10,000 | 6 | 23.1% |
| $10,000 to $14,999 | 8 | 30.8% |
| $15,000 to $24,999 | 5 | 19.2% |
| $25,000 to $34,999 | 0 | 0.0% |
| $35,000 to $49,999 | 4 | 15.4% |
| $50,000 to $74,999 | 3 | 11.5% |
| $75,000 to $99,999 | 0 | 0.0% |
| $100,000 to $149,999 | 0 | 0.0% |
| $150,000 to $199,999 | 0 | 0.0% |
| $200,000+ | 0 | 0.0% |
Household Income by Householder Age in Salineno North
| Income Bracket | # Households | Median Income |
| 15 to 24 Years | 0 (0.0%) | $0 |
| 25 to 44 Years | 11 (42.3%) | $0 |
| 45 to 64 Years | 4 (15.4%) | $0 |
| 65+ Years | 11 (42.3%) | $0 |
| Total | 26 (100.0%) | $0 |
Poverty in Salineno North
Income Below Poverty by Sex and Age in Salineno North
With 66.7% poverty level for males and 55.3% for females among the residents of Salineno North, 6 to 11 year old males and 5 year old females are the most vulnerable to poverty, with 7 males (100.0%) and 6 females (100.0%) in their respective age groups living below the poverty level.
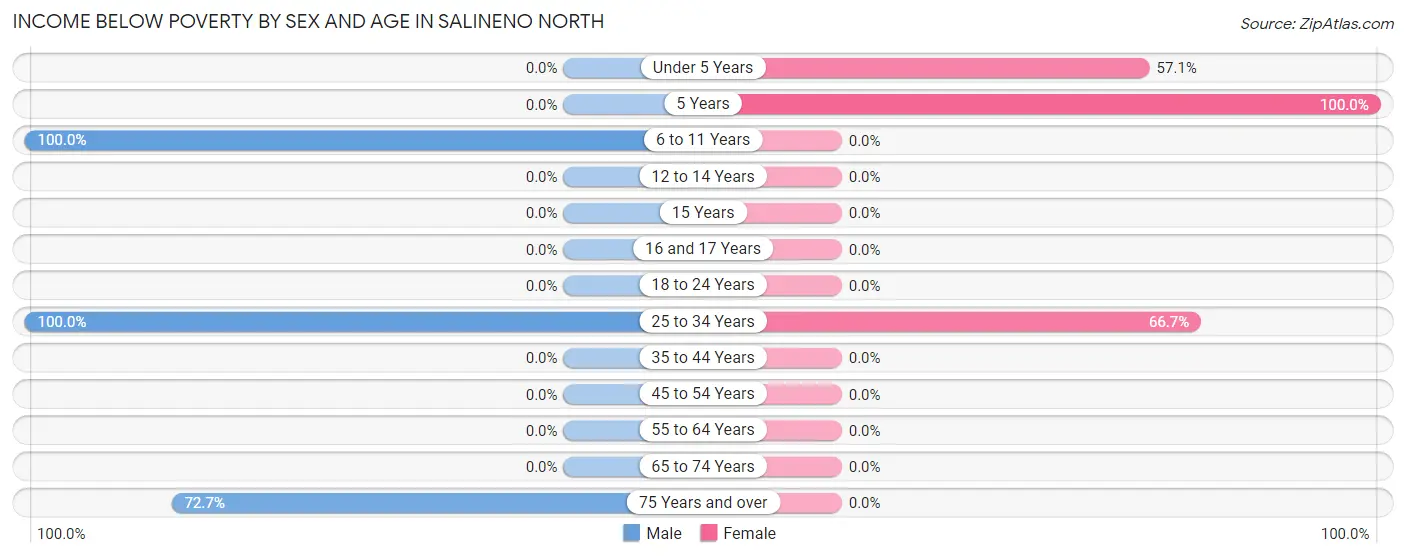
| Age Bracket | Male | Female |
| Under 5 Years | 0 (0.0%) | 8 (57.1%) |
| 5 Years | 0 (0.0%) | 6 (100.0%) |
| 6 to 11 Years | 7 (100.0%) | 0 (0.0%) |
| 12 to 14 Years | 0 (0.0%) | 0 (0.0%) |
| 15 Years | 0 (0.0%) | 0 (0.0%) |
| 16 and 17 Years | 0 (0.0%) | 0 (0.0%) |
| 18 to 24 Years | 0 (0.0%) | 0 (0.0%) |
| 25 to 34 Years | 5 (100.0%) | 12 (66.7%) |
| 35 to 44 Years | 0 (0.0%) | 0 (0.0%) |
| 45 to 54 Years | 0 (0.0%) | 0 (0.0%) |
| 55 to 64 Years | 0 (0.0%) | 0 (0.0%) |
| 65 to 74 Years | 0 (0.0%) | 0 (0.0%) |
| 75 Years and over | 8 (72.7%) | 0 (0.0%) |
| Total | 20 (66.7%) | 26 (55.3%) |
Income Above Poverty by Sex and Age in Salineno North
According to the poverty statistics in Salineno North, males aged under 5 years and females aged 55 to 64 years are the age groups that are most secure financially, with 100.0% of males and 100.0% of females in these age groups living above the poverty line.
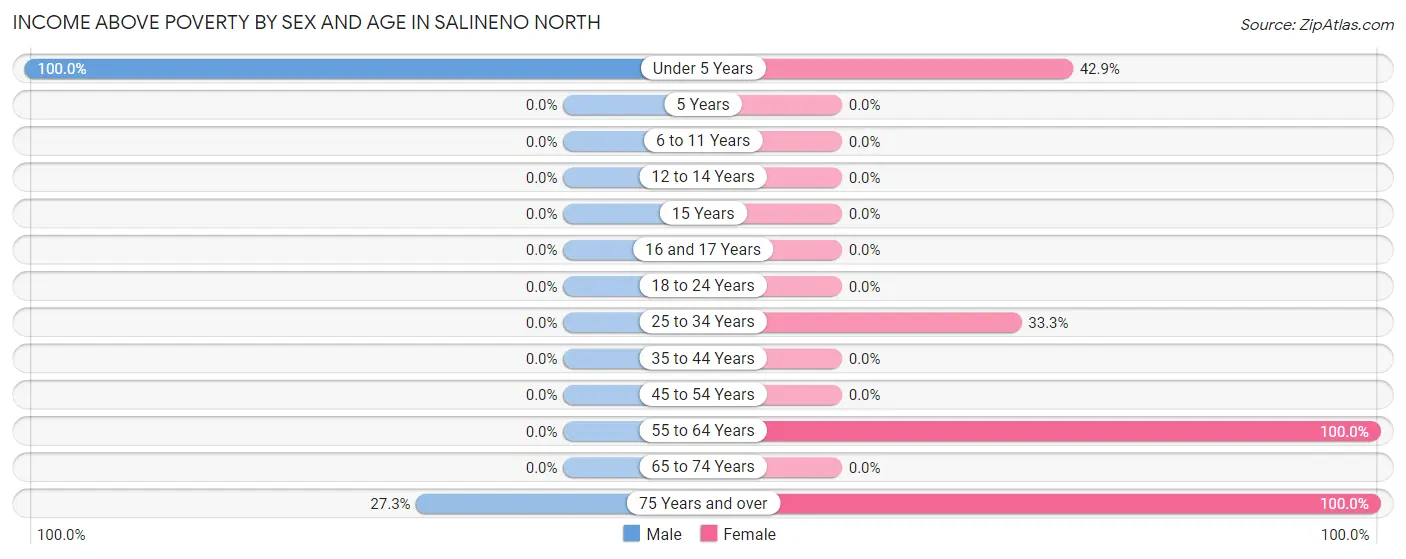
| Age Bracket | Male | Female |
| Under 5 Years | 7 (100.0%) | 6 (42.9%) |
| 5 Years | 0 (0.0%) | 0 (0.0%) |
| 6 to 11 Years | 0 (0.0%) | 0 (0.0%) |
| 12 to 14 Years | 0 (0.0%) | 0 (0.0%) |
| 15 Years | 0 (0.0%) | 0 (0.0%) |
| 16 and 17 Years | 0 (0.0%) | 0 (0.0%) |
| 18 to 24 Years | 0 (0.0%) | 0 (0.0%) |
| 25 to 34 Years | 0 (0.0%) | 6 (33.3%) |
| 35 to 44 Years | 0 (0.0%) | 0 (0.0%) |
| 45 to 54 Years | 0 (0.0%) | 0 (0.0%) |
| 55 to 64 Years | 0 (0.0%) | 4 (100.0%) |
| 65 to 74 Years | 0 (0.0%) | 0 (0.0%) |
| 75 Years and over | 3 (27.3%) | 5 (100.0%) |
| Total | 10 (33.3%) | 21 (44.7%) |
Income Below Poverty Among Married-Couple Families in Salineno North
The poverty statistics for married-couple families in Salineno North show that 62.5% or 5 of the total 8 families live below the poverty line. Families with 1 or 2 children have the highest poverty rate of 100.0%, comprising of 5 families. On the other hand, families with no children have the lowest poverty rate of 0.0%, which includes 0 families.
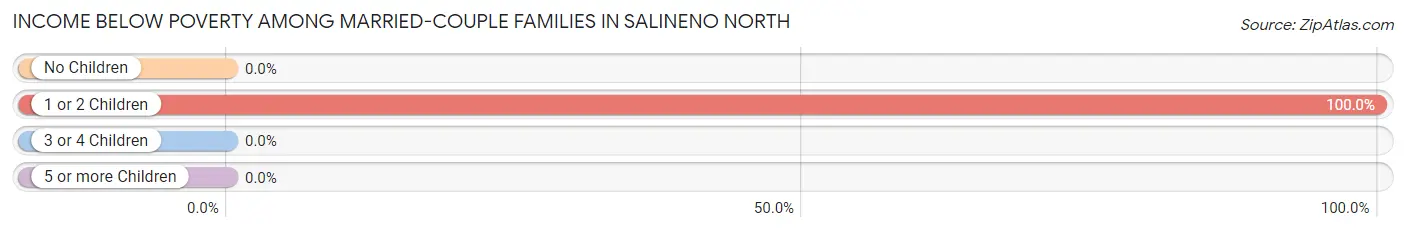
| Children | Above Poverty | Below Poverty |
| No Children | 3 (100.0%) | 0 (0.0%) |
| 1 or 2 Children | 0 (0.0%) | 5 (100.0%) |
| 3 or 4 Children | 0 (0.0%) | 0 (0.0%) |
| 5 or more Children | 0 (0.0%) | 0 (0.0%) |
| Total | 3 (37.5%) | 5 (62.5%) |
Income Below Poverty Among Single-Parent Households in Salineno North
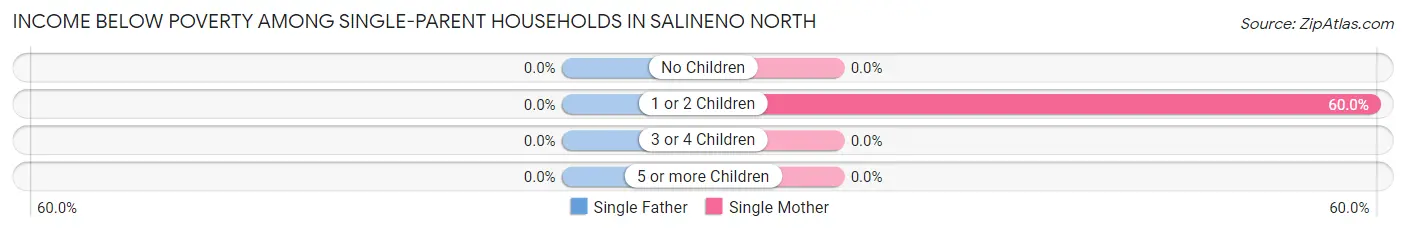
| Children | Single Father | Single Mother |
| No Children | 0 (0.0%) | 0 (0.0%) |
| 1 or 2 Children | 0 (0.0%) | 6 (60.0%) |
| 3 or 4 Children | 0 (0.0%) | 0 (0.0%) |
| 5 or more Children | 0 (0.0%) | 0 (0.0%) |
| Total | 0 (0.0%) | 6 (60.0%) |
Income Below Poverty Among Married-Couple vs Single-Parent Households in Salineno North
The poverty data for Salineno North shows that 5 of the married-couple family households (62.5%) and 6 of the single-parent households (60.0%) are living below the poverty level. Within the married-couple family households, those with 1 or 2 children have the highest poverty rate, with 5 households (100.0%) falling below the poverty line. Among the single-parent households, those with 1 or 2 children have the highest poverty rate, with 6 household (60.0%) living below poverty.
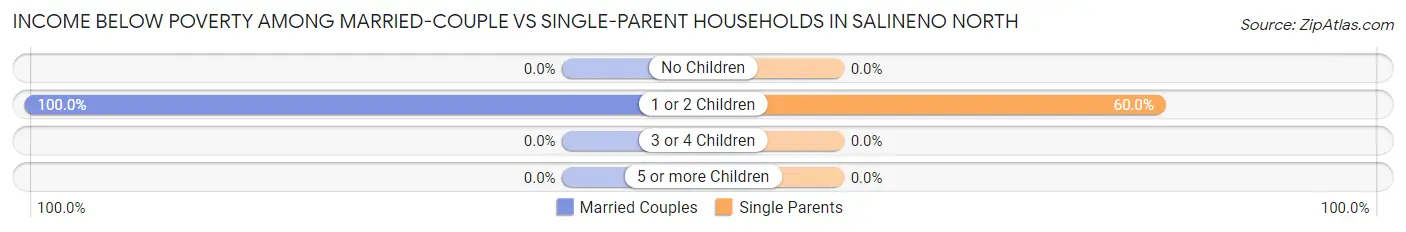
| Children | Married-Couple Families | Single-Parent Households |
| No Children | 0 (0.0%) | 0 (0.0%) |
| 1 or 2 Children | 5 (100.0%) | 6 (60.0%) |
| 3 or 4 Children | 0 (0.0%) | 0 (0.0%) |
| 5 or more Children | 0 (0.0%) | 0 (0.0%) |
| Total | 5 (62.5%) | 6 (60.0%) |
Race in Salineno North
The most populous races in Salineno North are Hispanic or Latino (77 | 100.0%), White / Caucasian (61 | 79.2%), and Two or more Races (16 | 20.8%).
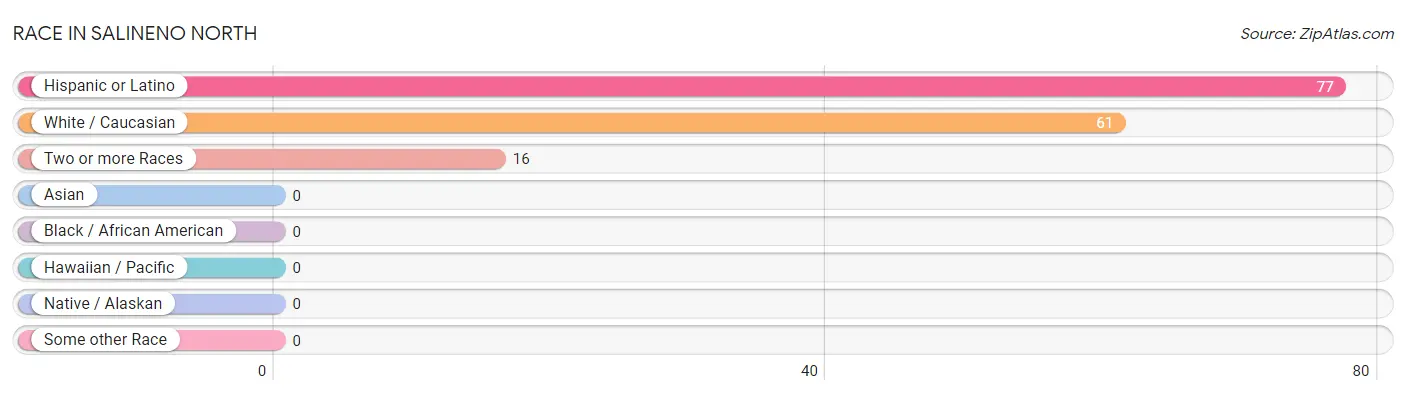
| Race | # Population | % Population |
| Asian | 0 | 0.0% |
| Black / African American | 0 | 0.0% |
| Hawaiian / Pacific | 0 | 0.0% |
| Hispanic or Latino | 77 | 100.0% |
| Native / Alaskan | 0 | 0.0% |
| White / Caucasian | 61 | 79.2% |
| Two or more Races | 16 | 20.8% |
| Some other Race | 0 | 0.0% |
| Total | 77 | 100.0% |
Ancestry in Salineno North
The most populous ancestries reported in Salineno North are , and Mexican (64 | 83.1%), together accounting for 83.1% of all Salineno North residents.

| Ancestry | # Population | % Population |
| Mexican | 64 | 83.1% | View All 1 Rows |
Immigrants in Salineno North
The most numerous immigrant groups reported in Salineno North came from Central America (17 | 22.1%), Latin America (17 | 22.1%), and Mexico (17 | 22.1%), together accounting for 66.2% of all Salineno North residents.
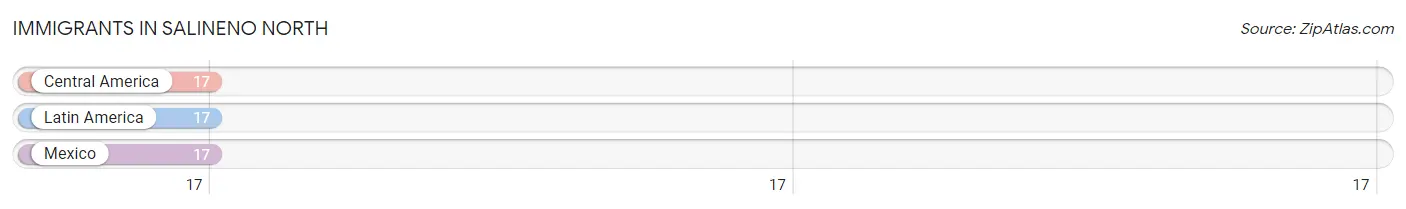
| Immigration Origin | # Population | % Population |
| Central America | 17 | 22.1% |
| Latin America | 17 | 22.1% |
| Mexico | 17 | 22.1% | View All 3 Rows |
Sex and Age in Salineno North
Sex and Age in Salineno North
The most populous age groups in Salineno North are 75 to 79 Years (8 | 26.7%) for men and 25 to 29 Years (18 | 38.3%) for women.
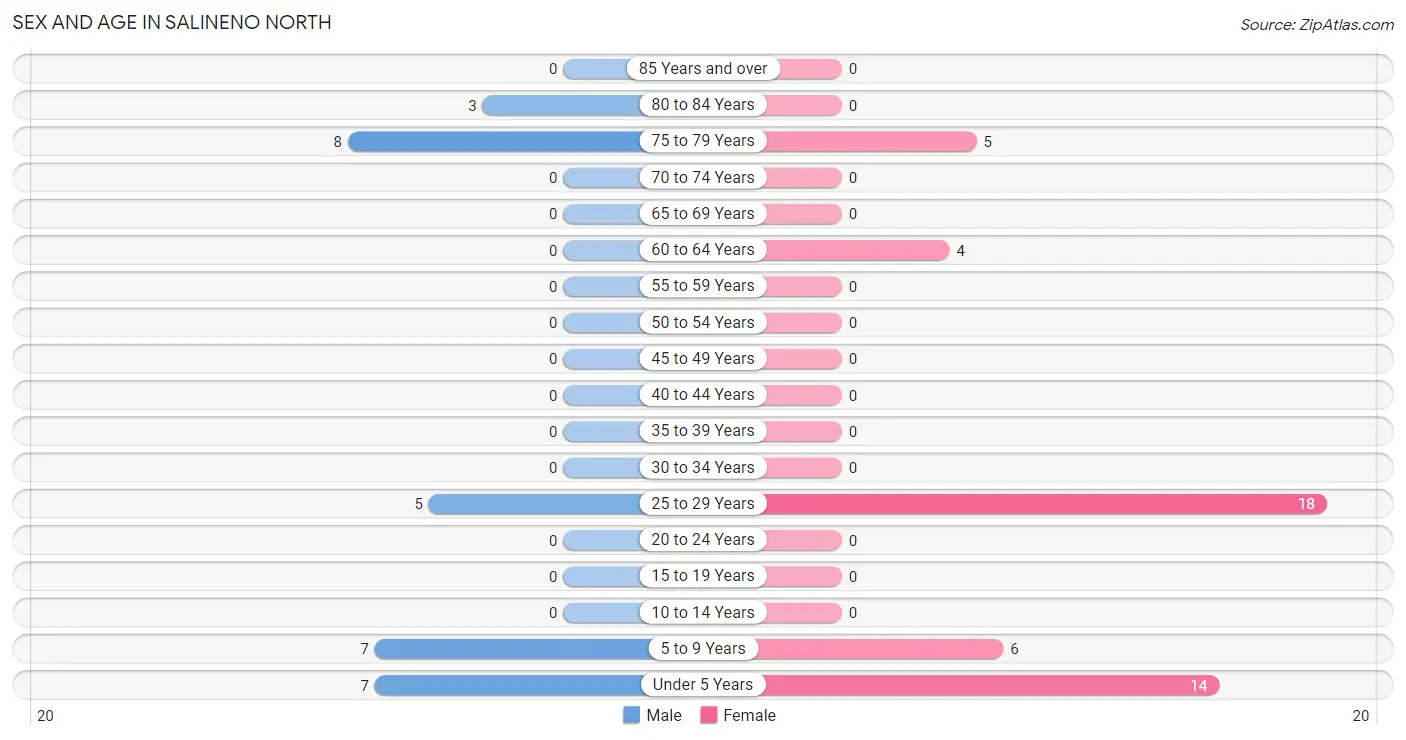
| Age Bracket | Male | Female |
| Under 5 Years | 7 (23.3%) | 14 (29.8%) |
| 5 to 9 Years | 7 (23.3%) | 6 (12.8%) |
| 10 to 14 Years | 0 (0.0%) | 0 (0.0%) |
| 15 to 19 Years | 0 (0.0%) | 0 (0.0%) |
| 20 to 24 Years | 0 (0.0%) | 0 (0.0%) |
| 25 to 29 Years | 5 (16.7%) | 18 (38.3%) |
| 30 to 34 Years | 0 (0.0%) | 0 (0.0%) |
| 35 to 39 Years | 0 (0.0%) | 0 (0.0%) |
| 40 to 44 Years | 0 (0.0%) | 0 (0.0%) |
| 45 to 49 Years | 0 (0.0%) | 0 (0.0%) |
| 50 to 54 Years | 0 (0.0%) | 0 (0.0%) |
| 55 to 59 Years | 0 (0.0%) | 0 (0.0%) |
| 60 to 64 Years | 0 (0.0%) | 4 (8.5%) |
| 65 to 69 Years | 0 (0.0%) | 0 (0.0%) |
| 70 to 74 Years | 0 (0.0%) | 0 (0.0%) |
| 75 to 79 Years | 8 (26.7%) | 5 (10.6%) |
| 80 to 84 Years | 3 (10.0%) | 0 (0.0%) |
| 85 Years and over | 0 (0.0%) | 0 (0.0%) |
| Total | 30 (100.0%) | 47 (100.0%) |
Families and Households in Salineno North
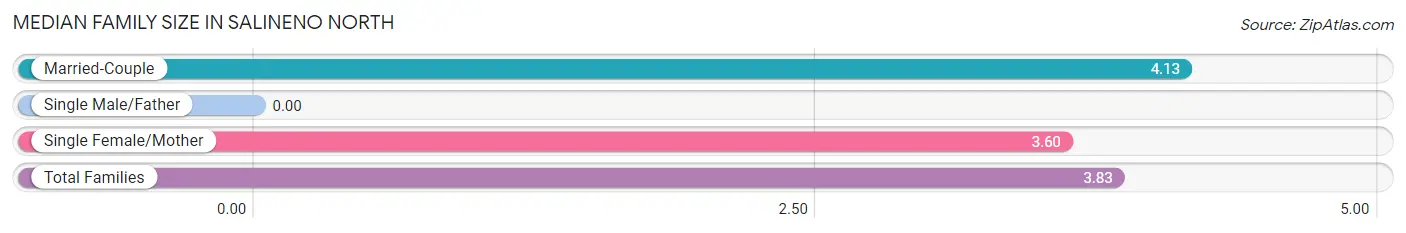
Median Family Size in Salineno North
| Family Type | # Families | Family Size |
| Married-Couple | 8 (44.4%) | 4.13 |
| Single Male/Father | 0 (0.0%) | - |
| Single Female/Mother | 10 (55.6%) | 3.60 |
| Total Families | 18 (100.0%) | 3.83 |
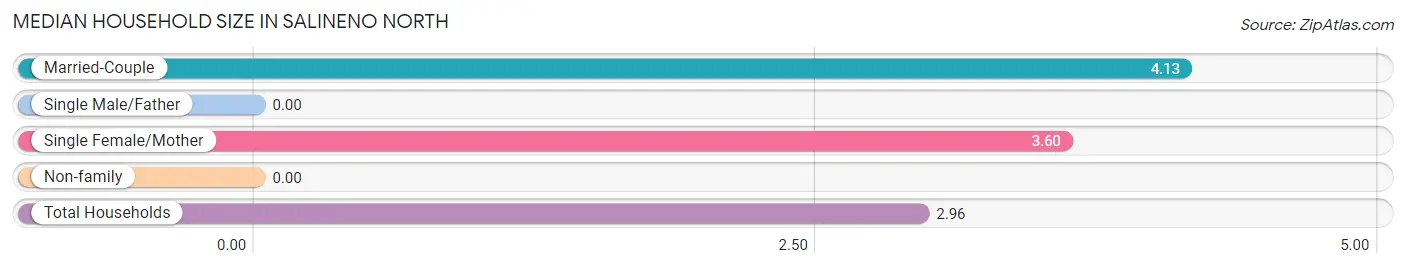
Median Household Size in Salineno North
| Household Type | # Households | Household Size |
| Married-Couple | 8 (30.8%) | 4.13 |
| Single Male/Father | 0 (0.0%) | - |
| Single Female/Mother | 10 (38.5%) | 3.60 |
| Non-family | 8 (30.8%) | - |
| Total Households | 26 (100.0%) | 2.96 |
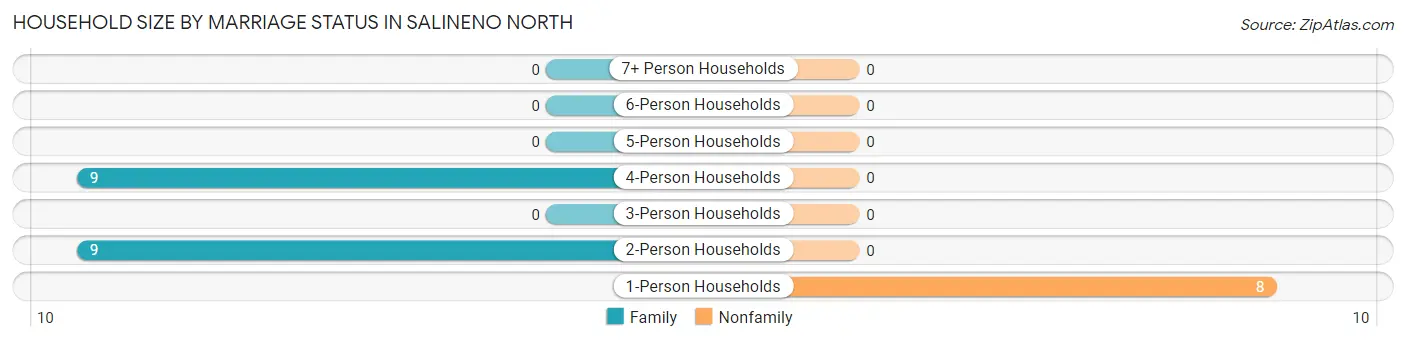
Household Size by Marriage Status in Salineno North
Out of a total of 26 households in Salineno North, 18 (69.2%) are family households, while 8 (30.8%) are nonfamily households. The most numerous type of family households are 2-person households, comprising 9, and the most common type of nonfamily households are 1-person households, comprising 8.
| Household Size | Family Households | Nonfamily Households |
| 1-Person Households | - | 8 (30.8%) |
| 2-Person Households | 9 (34.6%) | 0 (0.0%) |
| 3-Person Households | 0 (0.0%) | 0 (0.0%) |
| 4-Person Households | 9 (34.6%) | 0 (0.0%) |
| 5-Person Households | 0 (0.0%) | 0 (0.0%) |
| 6-Person Households | 0 (0.0%) | 0 (0.0%) |
| 7+ Person Households | 0 (0.0%) | 0 (0.0%) |
| Total | 18 (69.2%) | 8 (30.8%) |
Female Fertility in Salineno North
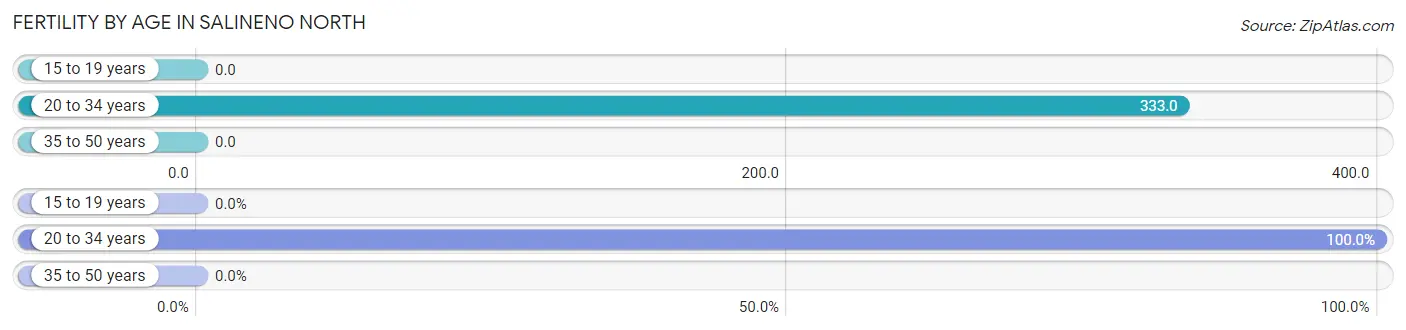
Fertility by Age in Salineno North
Average fertility rate in Salineno North is 333.0 births per 1,000 women. Women in the age bracket of 20 to 34 years have the highest fertility rate with 333.0 births per 1,000 women. Women in the age bracket of 20 to 34 years acount for 100.0% of all women with births.
| Age Bracket | Women with Births | Births / 1,000 Women |
| 15 to 19 years | 0 (0.0%) | 0.0 |
| 20 to 34 years | 6 (100.0%) | 333.0 |
| 35 to 50 years | 0 (0.0%) | 0.0 |
| Total | 6 (100.0%) | 333.0 |
Fertility by Age by Marriage Status in Salineno North
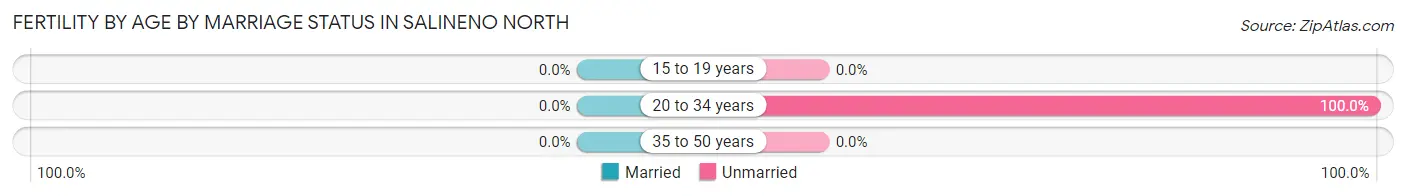
| Age Bracket | Married | Unmarried |
| 15 to 19 years | 0 (0.0%) | 0 (0.0%) |
| 20 to 34 years | 0 (0.0%) | 6 (100.0%) |
| 35 to 50 years | 0 (0.0%) | 0 (0.0%) |
| Total | 0 (0.0%) | 6 (100.0%) |
Fertility by Education in Salineno North
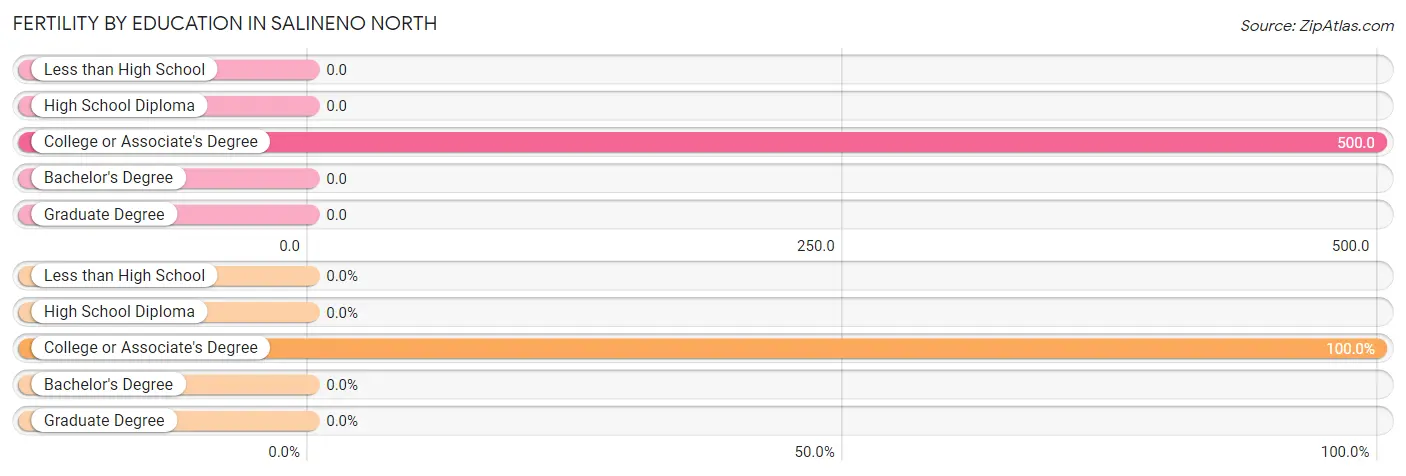
| Educational Attainment | Women with Births | Births / 1,000 Women |
| Less than High School | 0 (0.0%) | 0.0 |
| High School Diploma | 0 (0.0%) | 0.0 |
| College or Associate's Degree | 6 (100.0%) | 500.0 |
| Bachelor's Degree | 0 (0.0%) | 0.0 |
| Graduate Degree | 0 (0.0%) | 0.0 |
| Total | 6 (100.0%) | 333.0 |
Fertility by Education by Marriage Status in Salineno North
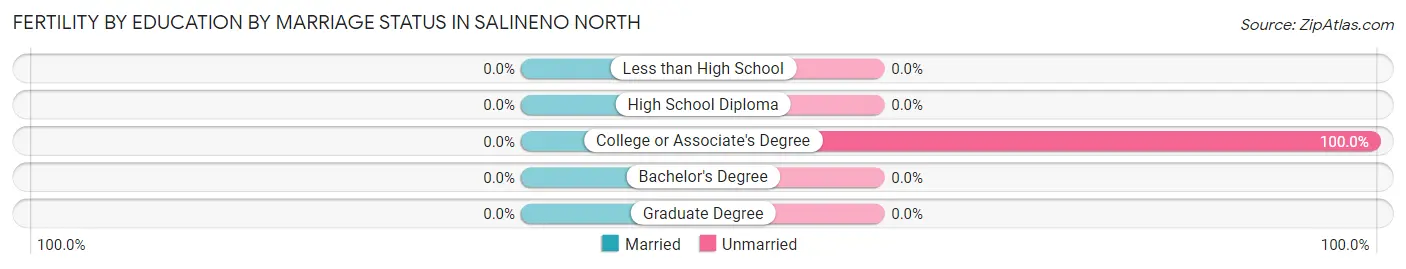
| Educational Attainment | Married | Unmarried |
| Less than High School | 0 (0.0%) | 0 (0.0%) |
| High School Diploma | 0 (0.0%) | 0 (0.0%) |
| College or Associate's Degree | 0 (0.0%) | 6 (100.0%) |
| Bachelor's Degree | 0 (0.0%) | 0 (0.0%) |
| Graduate Degree | 0 (0.0%) | 0 (0.0%) |
| Total | 0 (0.0%) | 6 (100.0%) |
Employment Characteristics in Salineno North
Employment by Class of Employer in Salineno North
Among the 21 employed individuals in Salineno North, local government employees (11 | 52.4%), and private company employees (10 | 47.6%) make up the most common classes of employment.
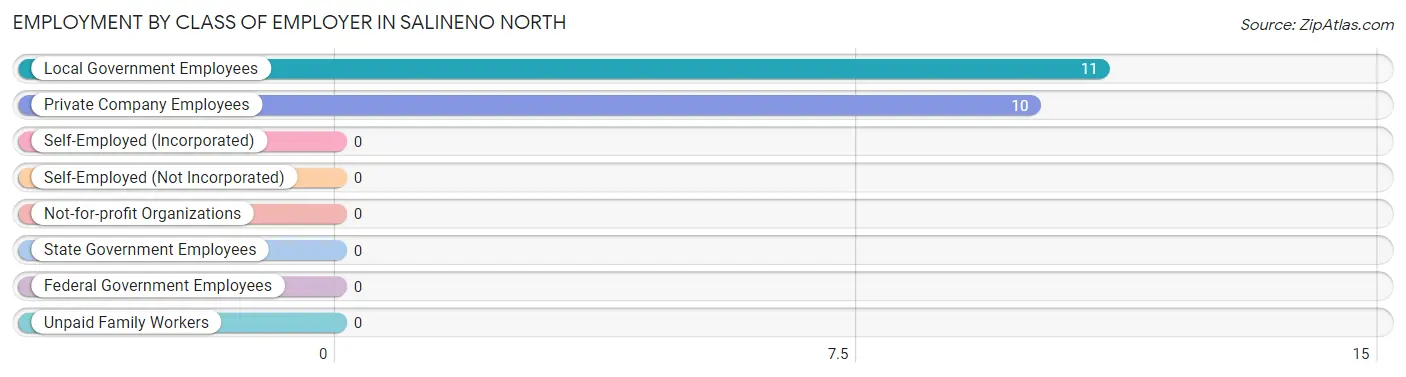
| Employer Class | # Employees | % Employees |
| Private Company Employees | 10 | 47.6% |
| Self-Employed (Incorporated) | 0 | 0.0% |
| Self-Employed (Not Incorporated) | 0 | 0.0% |
| Not-for-profit Organizations | 0 | 0.0% |
| Local Government Employees | 11 | 52.4% |
| State Government Employees | 0 | 0.0% |
| Federal Government Employees | 0 | 0.0% |
| Unpaid Family Workers | 0 | 0.0% |
| Total | 21 | 100.0% |
Employment Status by Age in Salineno North
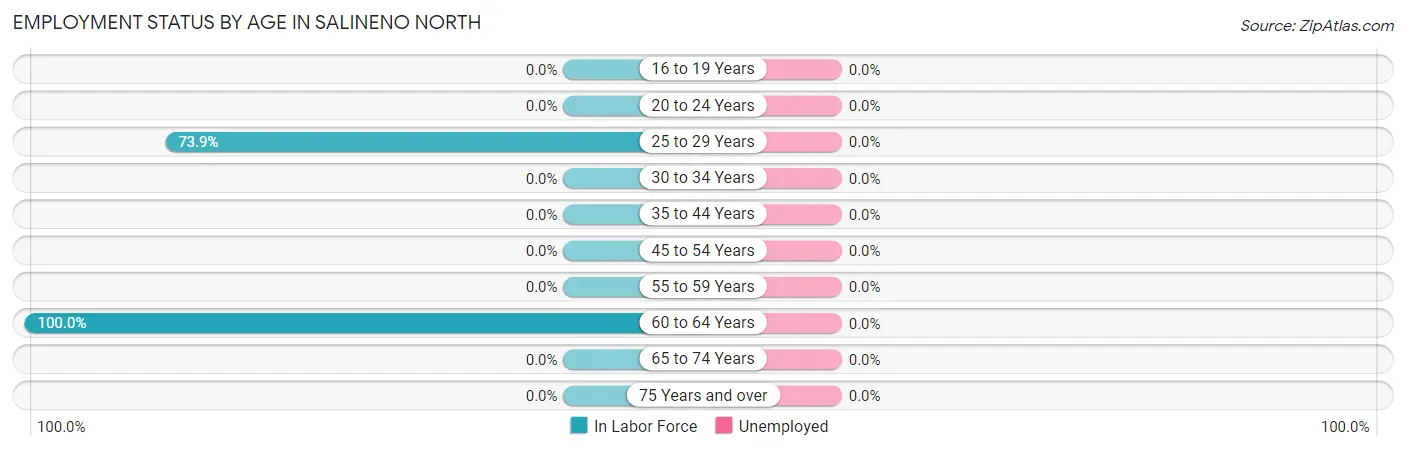
| Age Bracket | In Labor Force | Unemployed |
| 16 to 19 Years | 0 (0.0%) | 0 (0.0%) |
| 20 to 24 Years | 0 (0.0%) | 0 (0.0%) |
| 25 to 29 Years | 17 (73.9%) | 0 (0.0%) |
| 30 to 34 Years | 0 (0.0%) | 0 (0.0%) |
| 35 to 44 Years | 0 (0.0%) | 0 (0.0%) |
| 45 to 54 Years | 0 (0.0%) | 0 (0.0%) |
| 55 to 59 Years | 0 (0.0%) | 0 (0.0%) |
| 60 to 64 Years | 4 (100.0%) | 0 (0.0%) |
| 65 to 74 Years | 0 (0.0%) | 0 (0.0%) |
| 75 Years and over | 0 (0.0%) | 0 (0.0%) |
| Total | 21 (48.8%) | 0 (0.0%) |
Employment Status by Educational Attainment in Salineno North
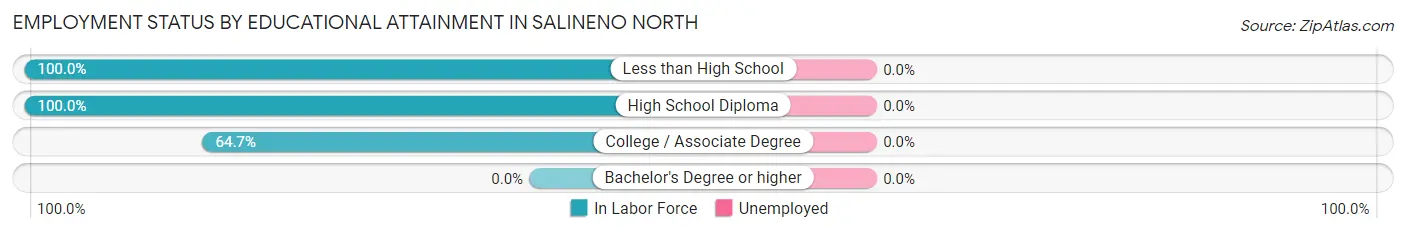
| Educational Attainment | In Labor Force | Unemployed |
| Less than High School | 4 (100.0%) | 0 (0.0%) |
| High School Diploma | 6 (100.0%) | 0 (0.0%) |
| College / Associate Degree | 11 (64.7%) | 0 (0.0%) |
| Bachelor's Degree or higher | 0 (0.0%) | 0 (0.0%) |
| Total | 21 (77.8%) | 0 (0.0%) |
Employment Occupations by Sex in Salineno North
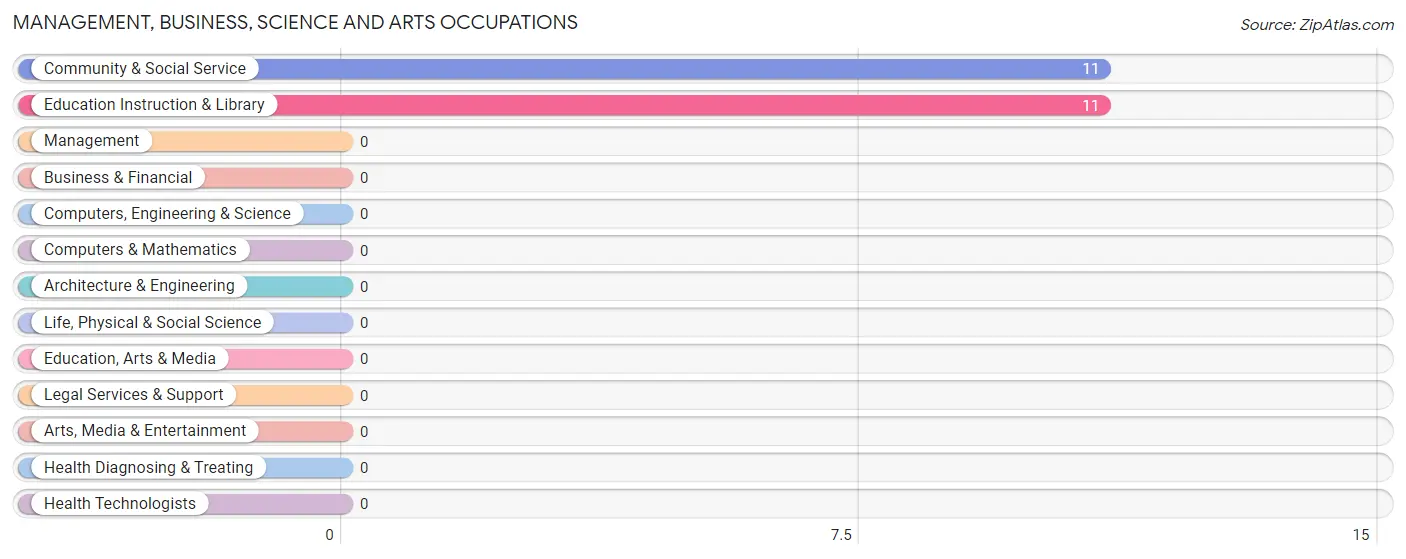
Management, Business, Science and Arts Occupations
The most common Management, Business, Science and Arts occupations in Salineno North are Community & Social Service (11 | 52.4%), and Education Instruction & Library (11 | 52.4%).
Management, Business, Science and Arts Occupations by Sex
Within the Management, Business, Science and Arts occupations in Salineno North, the most male-oriented occupations are Community & Social Service (45.5%), and Education Instruction & Library (45.5%), while the most female-oriented occupations are Community & Social Service (54.5%), and Education Instruction & Library (54.5%).
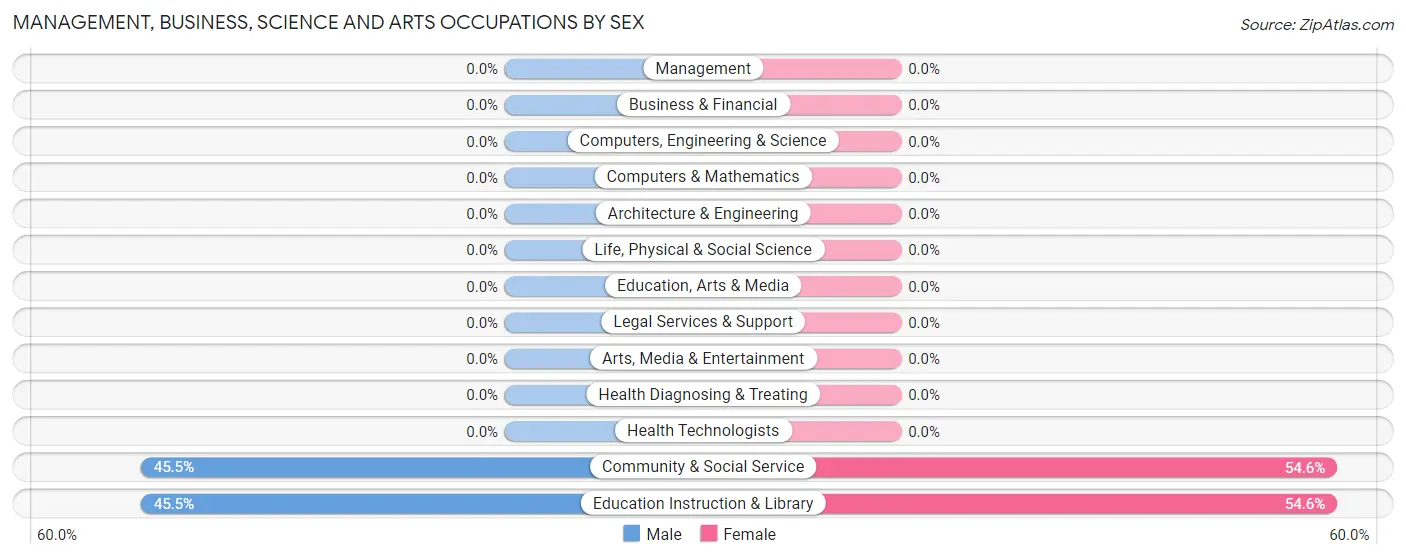
| Occupation | Male | Female |
| Management | 0 (0.0%) | 0 (0.0%) |
| Business & Financial | 0 (0.0%) | 0 (0.0%) |
| Computers, Engineering & Science | 0 (0.0%) | 0 (0.0%) |
| Computers & Mathematics | 0 (0.0%) | 0 (0.0%) |
| Architecture & Engineering | 0 (0.0%) | 0 (0.0%) |
| Life, Physical & Social Science | 0 (0.0%) | 0 (0.0%) |
| Community & Social Service | 5 (45.5%) | 6 (54.5%) |
| Education, Arts & Media | 0 (0.0%) | 0 (0.0%) |
| Legal Services & Support | 0 (0.0%) | 0 (0.0%) |
| Education Instruction & Library | 5 (45.5%) | 6 (54.5%) |
| Arts, Media & Entertainment | 0 (0.0%) | 0 (0.0%) |
| Health Diagnosing & Treating | 0 (0.0%) | 0 (0.0%) |
| Health Technologists | 0 (0.0%) | 0 (0.0%) |
| Total (Category) | 5 (45.5%) | 6 (54.5%) |
| Total (Overall) | 5 (23.8%) | 16 (76.2%) |
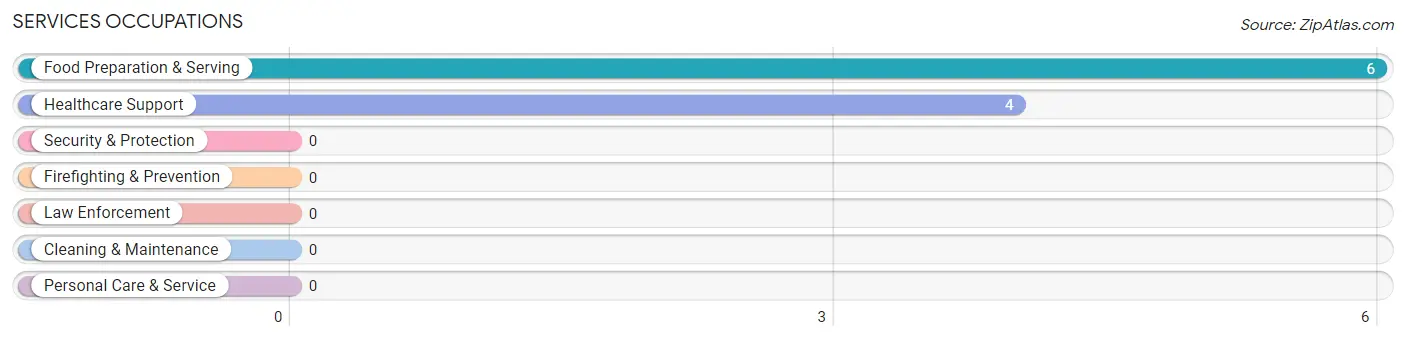
Services Occupations
The most common Services occupations in Salineno North are Food Preparation & Serving (6 | 28.6%), and Healthcare Support (4 | 19.1%).
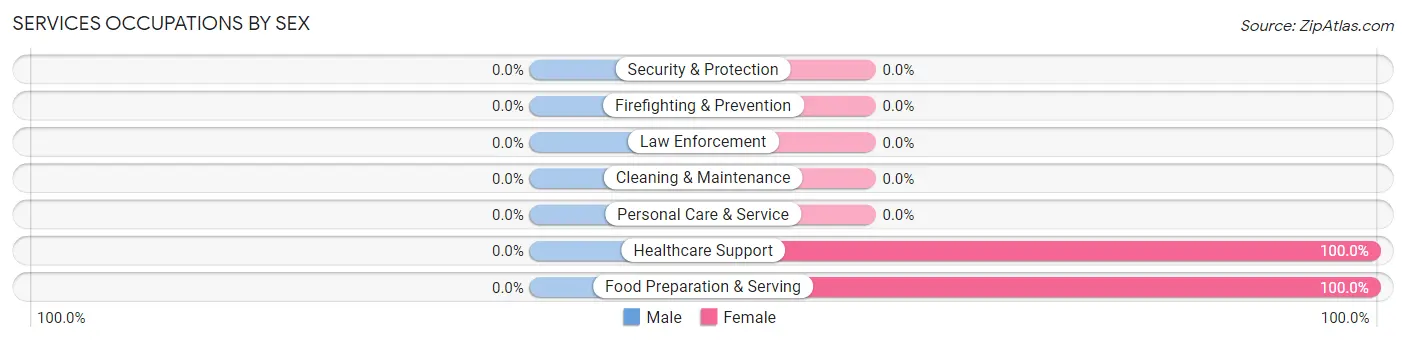
Services Occupations by Sex
| Occupation | Male | Female |
| Healthcare Support | 0 (0.0%) | 4 (100.0%) |
| Security & Protection | 0 (0.0%) | 0 (0.0%) |
| Firefighting & Prevention | 0 (0.0%) | 0 (0.0%) |
| Law Enforcement | 0 (0.0%) | 0 (0.0%) |
| Food Preparation & Serving | 0 (0.0%) | 6 (100.0%) |
| Cleaning & Maintenance | 0 (0.0%) | 0 (0.0%) |
| Personal Care & Service | 0 (0.0%) | 0 (0.0%) |
| Total (Category) | 0 (0.0%) | 10 (100.0%) |
| Total (Overall) | 5 (23.8%) | 16 (76.2%) |
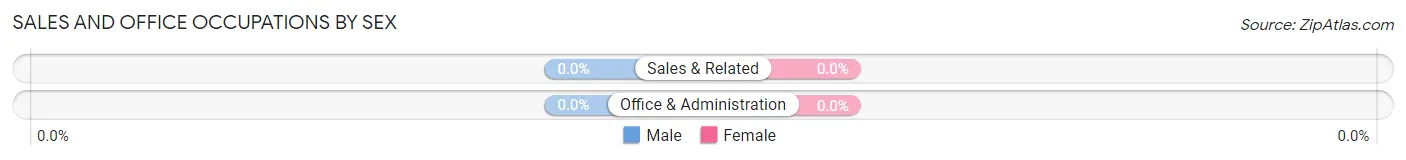
Sales and Office Occupations

Sales and Office Occupations by Sex
| Occupation | Male | Female |
| Sales & Related | 0 (0.0%) | 0 (0.0%) |
| Office & Administration | 0 (0.0%) | 0 (0.0%) |
| Total (Category) | 0 (0.0%) | 0 (0.0%) |
| Total (Overall) | 5 (23.8%) | 16 (76.2%) |
Natural Resources, Construction and Maintenance Occupations
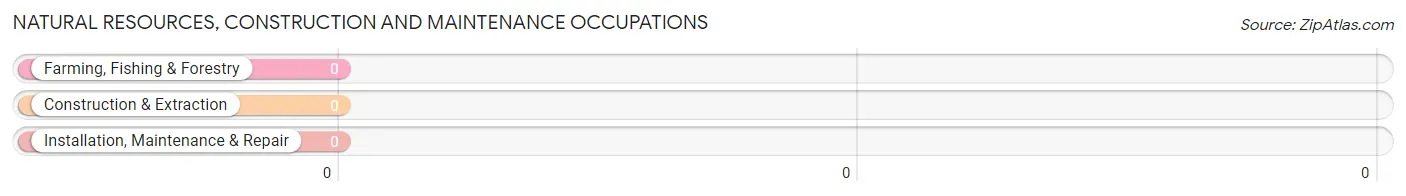
Natural Resources, Construction and Maintenance Occupations by Sex
| Occupation | Male | Female |
| Farming, Fishing & Forestry | 0 (0.0%) | 0 (0.0%) |
| Construction & Extraction | 0 (0.0%) | 0 (0.0%) |
| Installation, Maintenance & Repair | 0 (0.0%) | 0 (0.0%) |
| Total (Category) | 0 (0.0%) | 0 (0.0%) |
| Total (Overall) | 5 (23.8%) | 16 (76.2%) |
Production, Transportation and Moving Occupations
Production, Transportation and Moving Occupations by Sex
| Occupation | Male | Female |
| Production | 0 (0.0%) | 0 (0.0%) |
| Transportation | 0 (0.0%) | 0 (0.0%) |
| Material Moving | 0 (0.0%) | 0 (0.0%) |
| Total (Category) | 0 (0.0%) | 0 (0.0%) |
| Total (Overall) | 5 (23.8%) | 16 (76.2%) |
Employment Industries by Sex in Salineno North
Employment Industries in Salineno North
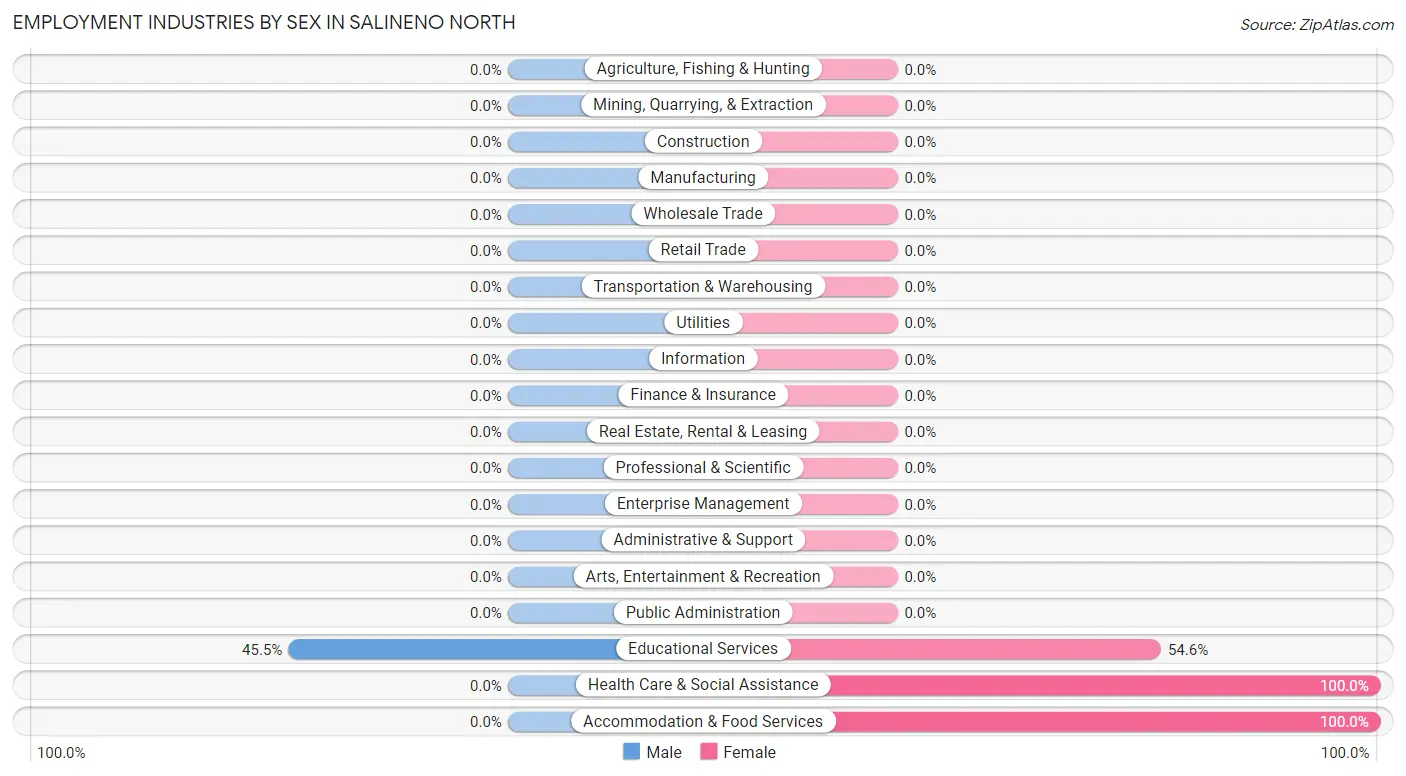
The major employment industries in Salineno North include Educational Services (11 | 52.4%), Accommodation & Food Services (6 | 28.6%), and Health Care & Social Assistance (4 | 19.1%).
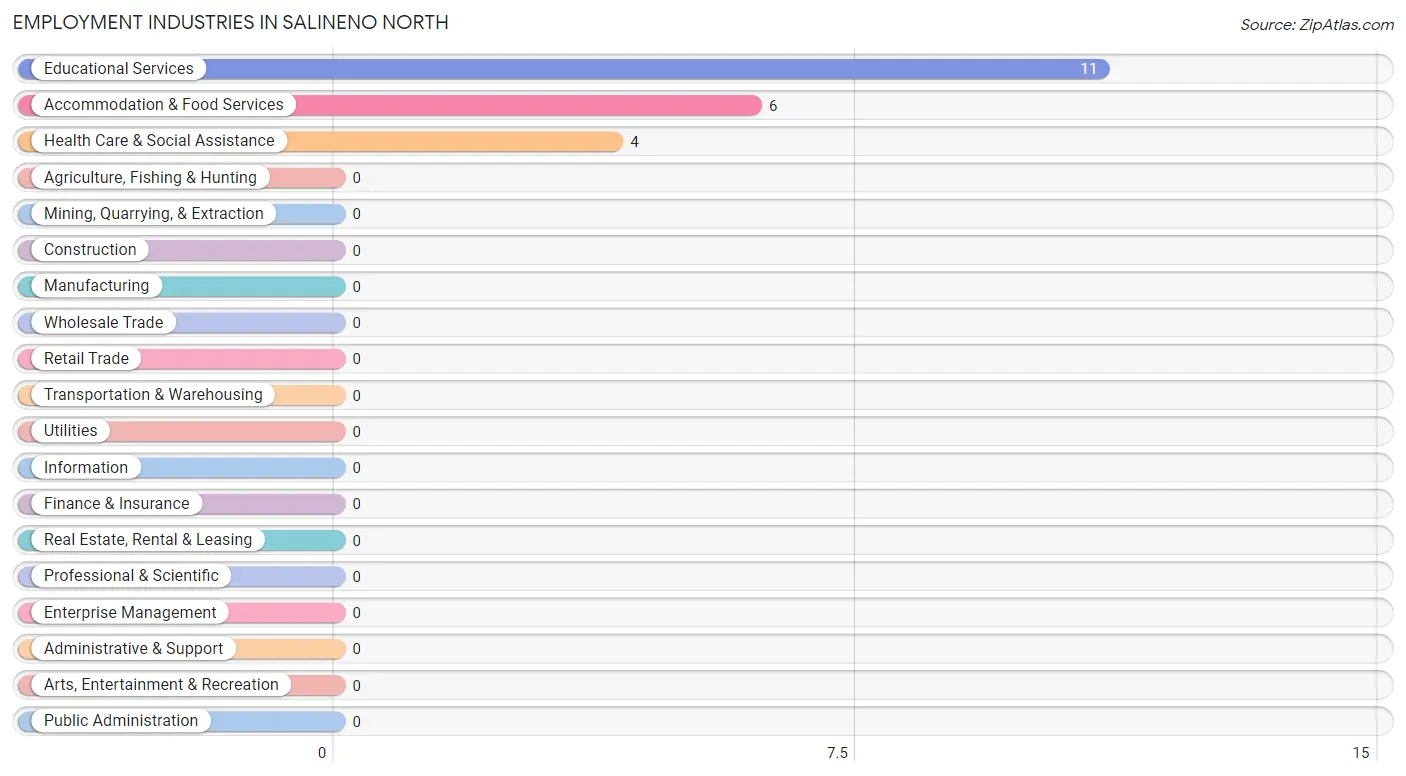
Employment Industries by Sex in Salineno North
| Industry | Male | Female |
| Agriculture, Fishing & Hunting | 0 (0.0%) | 0 (0.0%) |
| Mining, Quarrying, & Extraction | 0 (0.0%) | 0 (0.0%) |
| Construction | 0 (0.0%) | 0 (0.0%) |
| Manufacturing | 0 (0.0%) | 0 (0.0%) |
| Wholesale Trade | 0 (0.0%) | 0 (0.0%) |
| Retail Trade | 0 (0.0%) | 0 (0.0%) |
| Transportation & Warehousing | 0 (0.0%) | 0 (0.0%) |
| Utilities | 0 (0.0%) | 0 (0.0%) |
| Information | 0 (0.0%) | 0 (0.0%) |
| Finance & Insurance | 0 (0.0%) | 0 (0.0%) |
| Real Estate, Rental & Leasing | 0 (0.0%) | 0 (0.0%) |
| Professional & Scientific | 0 (0.0%) | 0 (0.0%) |
| Enterprise Management | 0 (0.0%) | 0 (0.0%) |
| Administrative & Support | 0 (0.0%) | 0 (0.0%) |
| Educational Services | 5 (45.5%) | 6 (54.5%) |
| Health Care & Social Assistance | 0 (0.0%) | 4 (100.0%) |
| Arts, Entertainment & Recreation | 0 (0.0%) | 0 (0.0%) |
| Accommodation & Food Services | 0 (0.0%) | 6 (100.0%) |
| Public Administration | 0 (0.0%) | 0 (0.0%) |
| Total | 5 (23.8%) | 16 (76.2%) |
Education in Salineno North
School Enrollment in Salineno North
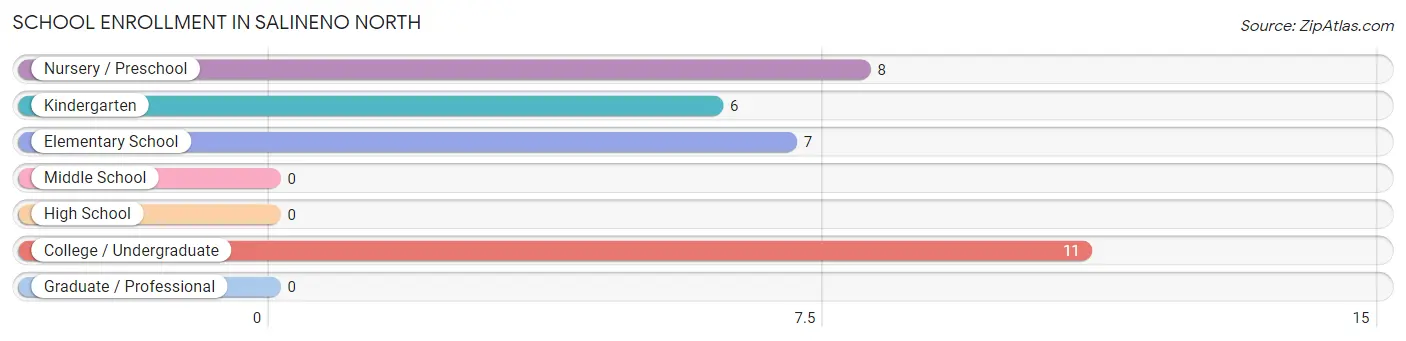
The most common levels of schooling among the 32 students in Salineno North are college / undergraduate (11 | 34.4%), nursery / preschool (8 | 25.0%), and elementary school (7 | 21.9%).
| School Level | # Students | % Students |
| Nursery / Preschool | 8 | 25.0% |
| Kindergarten | 6 | 18.8% |
| Elementary School | 7 | 21.9% |
| Middle School | 0 | 0.0% |
| High School | 0 | 0.0% |
| College / Undergraduate | 11 | 34.4% |
| Graduate / Professional | 0 | 0.0% |
| Total | 32 | 100.0% |
School Enrollment by Age by Funding Source in Salineno North
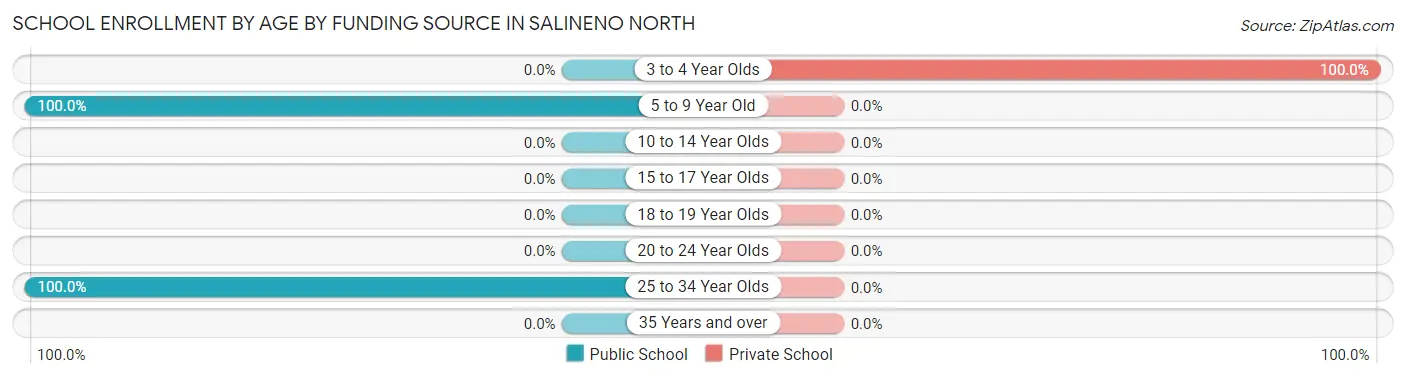
Out of a total of 32 students who are enrolled in schools in Salineno North, 8 (25.0%) attend a private institution, while the remaining 24 (75.0%) are enrolled in public schools. The age group of 3 to 4 year olds has the highest likelihood of being enrolled in private schools, with 8 (100.0% in the age bracket) enrolled. Conversely, the age group of 5 to 9 year old has the lowest likelihood of being enrolled in a private school, with 13 (100.0% in the age bracket) attending a public institution.
| Age Bracket | Public School | Private School |
| 3 to 4 Year Olds | 0 (0.0%) | 8 (100.0%) |
| 5 to 9 Year Old | 13 (100.0%) | 0 (0.0%) |
| 10 to 14 Year Olds | 0 (0.0%) | 0 (0.0%) |
| 15 to 17 Year Olds | 0 (0.0%) | 0 (0.0%) |
| 18 to 19 Year Olds | 0 (0.0%) | 0 (0.0%) |
| 20 to 24 Year Olds | 0 (0.0%) | 0 (0.0%) |
| 25 to 34 Year Olds | 11 (100.0%) | 0 (0.0%) |
| 35 Years and over | 0 (0.0%) | 0 (0.0%) |
| Total | 24 (75.0%) | 8 (25.0%) |
Educational Attainment by Field of Study in Salineno North
| Field of Study | # Graduates | % Graduates |
| Computers & Mathematics | 0 | 0.0% |
| Bio, Nature & Agricultural | 0 | 0.0% |
| Physical & Health Sciences | 0 | 0.0% |
| Psychology | 0 | 0.0% |
| Social Sciences | 0 | 0.0% |
| Engineering | 0 | 0.0% |
| Multidisciplinary Studies | 0 | 0.0% |
| Science & Technology | 0 | 0.0% |
| Business | 0 | 0.0% |
| Education | 0 | 0.0% |
| Literature & Languages | 0 | 0.0% |
| Liberal Arts & History | 0 | 0.0% |
| Visual & Performing Arts | 0 | 0.0% |
| Communications | 0 | 0.0% |
| Arts & Humanities | 0 | 0.0% |
| Total | 0 | 0.0% |
Transportation & Commute in Salineno North
Vehicle Availability by Sex in Salineno North
The most prevalent vehicle ownership categories in Salineno North are males with 3 vehicles (5, accounting for 100.0%) and females with 3 vehicles (6, making up 31.2%).
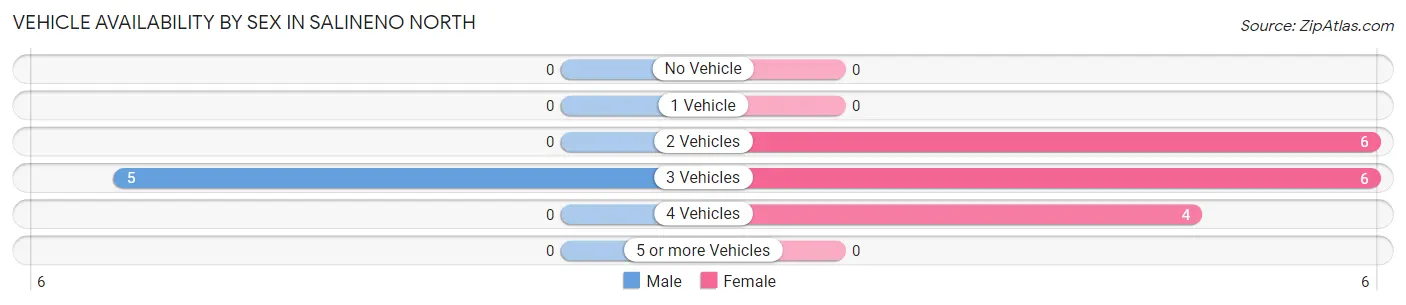
| Vehicles Available | Male | Female |
| No Vehicle | 0 (0.0%) | 0 (0.0%) |
| 1 Vehicle | 0 (0.0%) | 0 (0.0%) |
| 2 Vehicles | 0 (0.0%) | 6 (37.5%) |
| 3 Vehicles | 5 (100.0%) | 6 (37.5%) |
| 4 Vehicles | 0 (0.0%) | 4 (25.0%) |
| 5 or more Vehicles | 0 (0.0%) | 0 (0.0%) |
| Total | 5 (100.0%) | 16 (100.0%) |
Commute Time in Salineno North
The most frequently occuring commute durations in Salineno North are 10 to 14 minutes (6 commuters, 28.6%), 30 to 34 minutes (6 commuters, 28.6%), and 15 to 19 minutes (5 commuters, 23.8%).
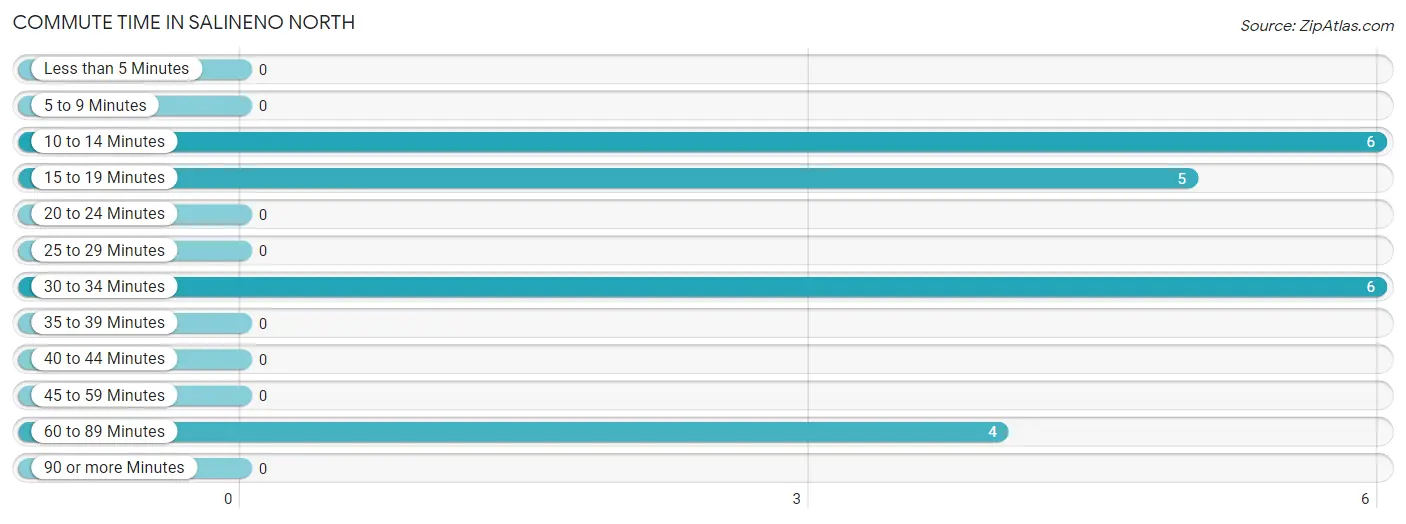
| Commute Time | # Commuters | % Commuters |
| Less than 5 Minutes | 0 | 0.0% |
| 5 to 9 Minutes | 0 | 0.0% |
| 10 to 14 Minutes | 6 | 28.6% |
| 15 to 19 Minutes | 5 | 23.8% |
| 20 to 24 Minutes | 0 | 0.0% |
| 25 to 29 Minutes | 0 | 0.0% |
| 30 to 34 Minutes | 6 | 28.6% |
| 35 to 39 Minutes | 0 | 0.0% |
| 40 to 44 Minutes | 0 | 0.0% |
| 45 to 59 Minutes | 0 | 0.0% |
| 60 to 89 Minutes | 4 | 19.1% |
| 90 or more Minutes | 0 | 0.0% |
Commute Time by Sex in Salineno North
The most common commute times in Salineno North are 15 to 19 minutes (5 commuters, 100.0%) for males and 10 to 14 minutes (6 commuters, 37.5%) for females.
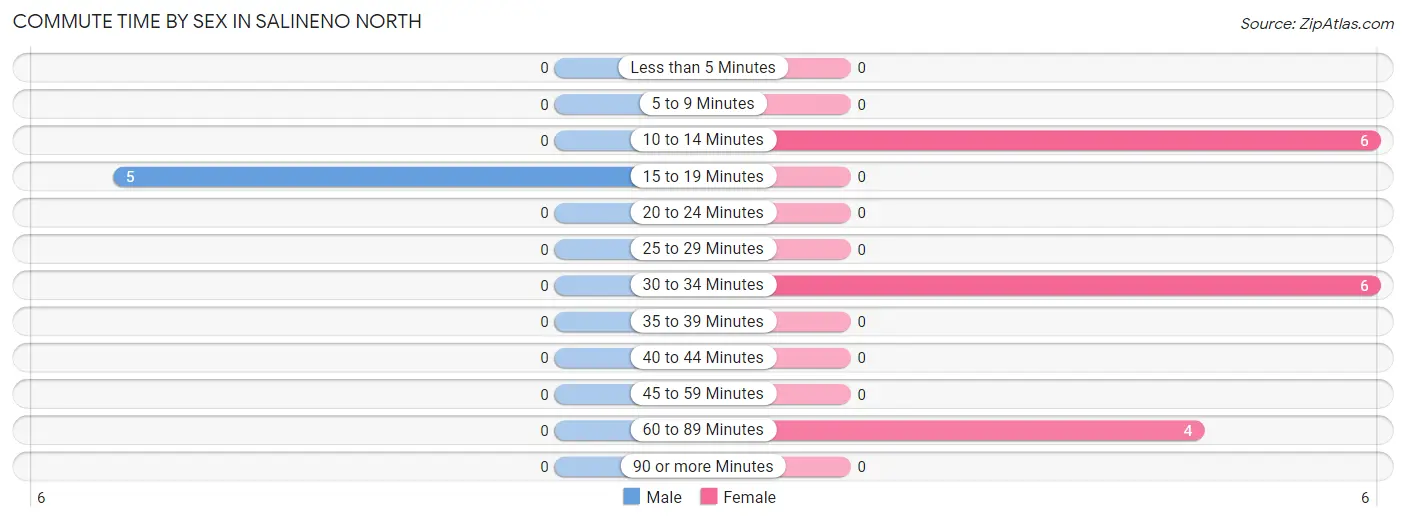
| Commute Time | Male | Female |
| Less than 5 Minutes | 0 (0.0%) | 0 (0.0%) |
| 5 to 9 Minutes | 0 (0.0%) | 0 (0.0%) |
| 10 to 14 Minutes | 0 (0.0%) | 6 (37.5%) |
| 15 to 19 Minutes | 5 (100.0%) | 0 (0.0%) |
| 20 to 24 Minutes | 0 (0.0%) | 0 (0.0%) |
| 25 to 29 Minutes | 0 (0.0%) | 0 (0.0%) |
| 30 to 34 Minutes | 0 (0.0%) | 6 (37.5%) |
| 35 to 39 Minutes | 0 (0.0%) | 0 (0.0%) |
| 40 to 44 Minutes | 0 (0.0%) | 0 (0.0%) |
| 45 to 59 Minutes | 0 (0.0%) | 0 (0.0%) |
| 60 to 89 Minutes | 0 (0.0%) | 4 (25.0%) |
| 90 or more Minutes | 0 (0.0%) | 0 (0.0%) |
Time of Departure to Work by Sex in Salineno North
The most frequent times of departure to work in Salineno North are 7:30 AM to 7:59 AM (5, 100.0%) for males and 5:30 AM to 5:59 AM (6, 37.5%) for females.
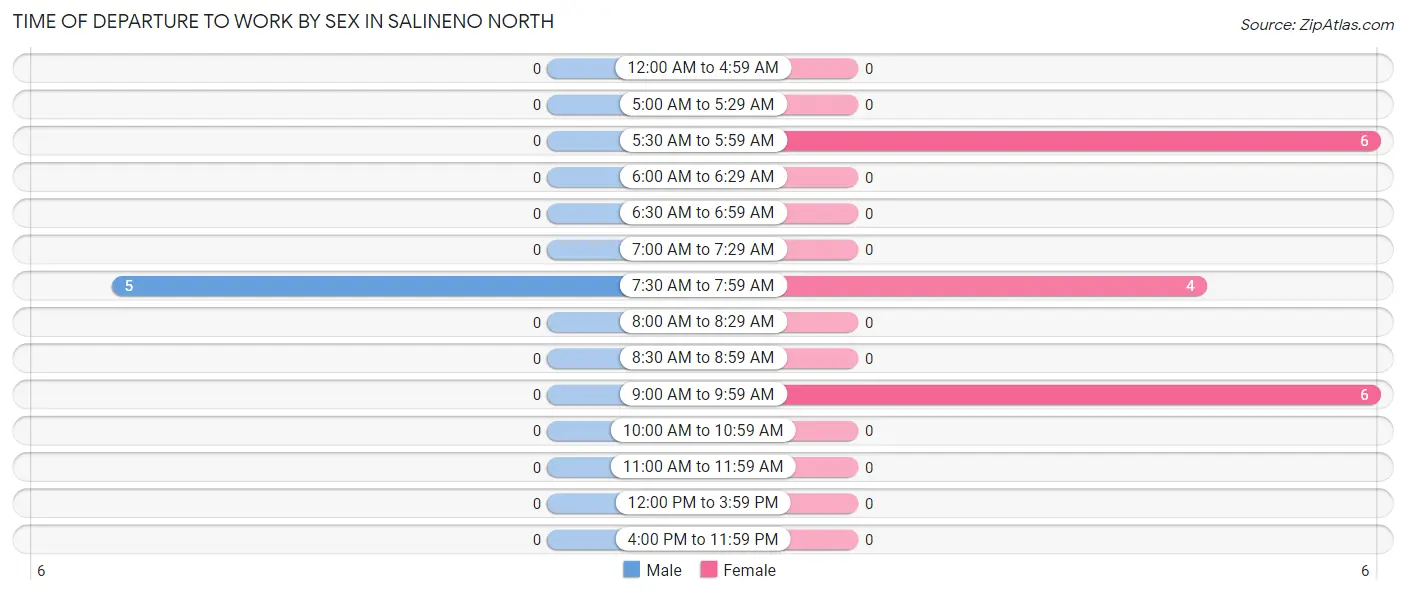
| Time of Departure | Male | Female |
| 12:00 AM to 4:59 AM | 0 (0.0%) | 0 (0.0%) |
| 5:00 AM to 5:29 AM | 0 (0.0%) | 0 (0.0%) |
| 5:30 AM to 5:59 AM | 0 (0.0%) | 6 (37.5%) |
| 6:00 AM to 6:29 AM | 0 (0.0%) | 0 (0.0%) |
| 6:30 AM to 6:59 AM | 0 (0.0%) | 0 (0.0%) |
| 7:00 AM to 7:29 AM | 0 (0.0%) | 0 (0.0%) |
| 7:30 AM to 7:59 AM | 5 (100.0%) | 4 (25.0%) |
| 8:00 AM to 8:29 AM | 0 (0.0%) | 0 (0.0%) |
| 8:30 AM to 8:59 AM | 0 (0.0%) | 0 (0.0%) |
| 9:00 AM to 9:59 AM | 0 (0.0%) | 6 (37.5%) |
| 10:00 AM to 10:59 AM | 0 (0.0%) | 0 (0.0%) |
| 11:00 AM to 11:59 AM | 0 (0.0%) | 0 (0.0%) |
| 12:00 PM to 3:59 PM | 0 (0.0%) | 0 (0.0%) |
| 4:00 PM to 11:59 PM | 0 (0.0%) | 0 (0.0%) |
| Total | 5 (100.0%) | 16 (100.0%) |
Housing Occupancy in Salineno North
Occupancy by Ownership in Salineno North
Of the total 26 dwellings in Salineno North, owner-occupied units account for 26 (100.0%), while renter-occupied units make up 0 (0.0%).
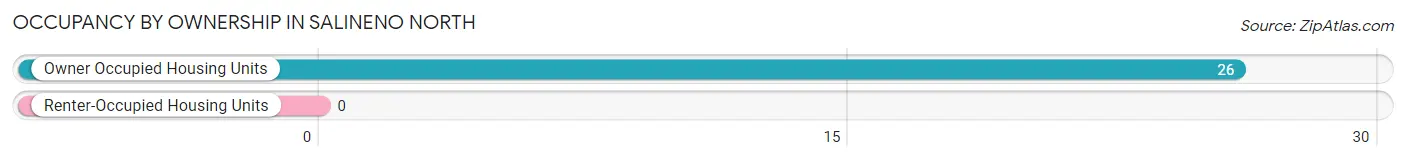
| Occupancy | # Housing Units | % Housing Units |
| Owner Occupied Housing Units | 26 | 100.0% |
| Renter-Occupied Housing Units | 0 | 0.0% |
| Total Occupied Housing Units | 26 | 100.0% |
Occupancy by Household Size in Salineno North
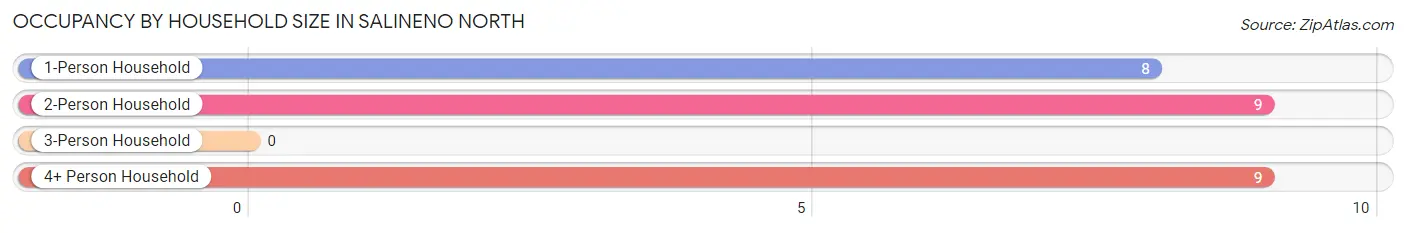
| Household Size | # Housing Units | % Housing Units |
| 1-Person Household | 8 | 30.8% |
| 2-Person Household | 9 | 34.6% |
| 3-Person Household | 0 | 0.0% |
| 4+ Person Household | 9 | 34.6% |
| Total Housing Units | 26 | 100.0% |
Occupancy by Ownership by Household Size in Salineno North
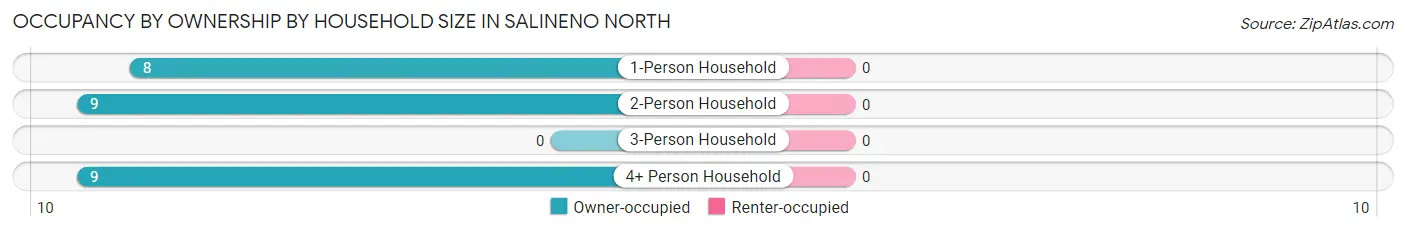
| Household Size | Owner-occupied | Renter-occupied |
| 1-Person Household | 8 (100.0%) | 0 (0.0%) |
| 2-Person Household | 9 (100.0%) | 0 (0.0%) |
| 3-Person Household | 0 (0.0%) | 0 (0.0%) |
| 4+ Person Household | 9 (100.0%) | 0 (0.0%) |
| Total Housing Units | 26 (100.0%) | 0 (0.0%) |
Occupancy by Educational Attainment in Salineno North
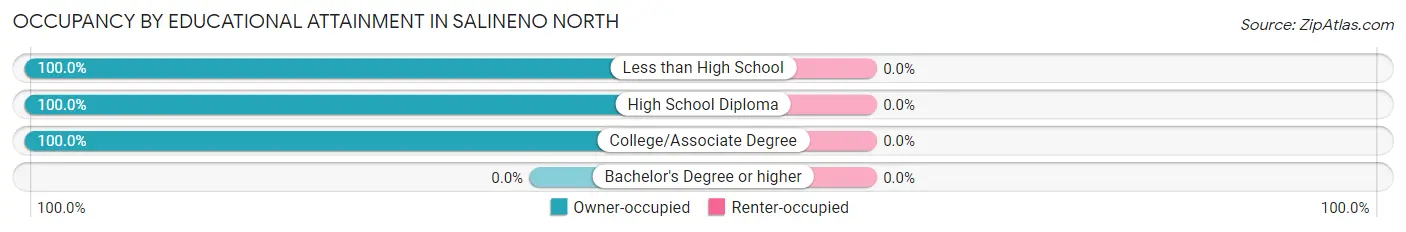
| Household Size | Owner-occupied | Renter-occupied |
| Less than High School | 12 (100.0%) | 0 (0.0%) |
| High School Diploma | 3 (100.0%) | 0 (0.0%) |
| College/Associate Degree | 11 (100.0%) | 0 (0.0%) |
| Bachelor's Degree or higher | 0 (0.0%) | 0 (0.0%) |
Occupancy by Age of Householder in Salineno North
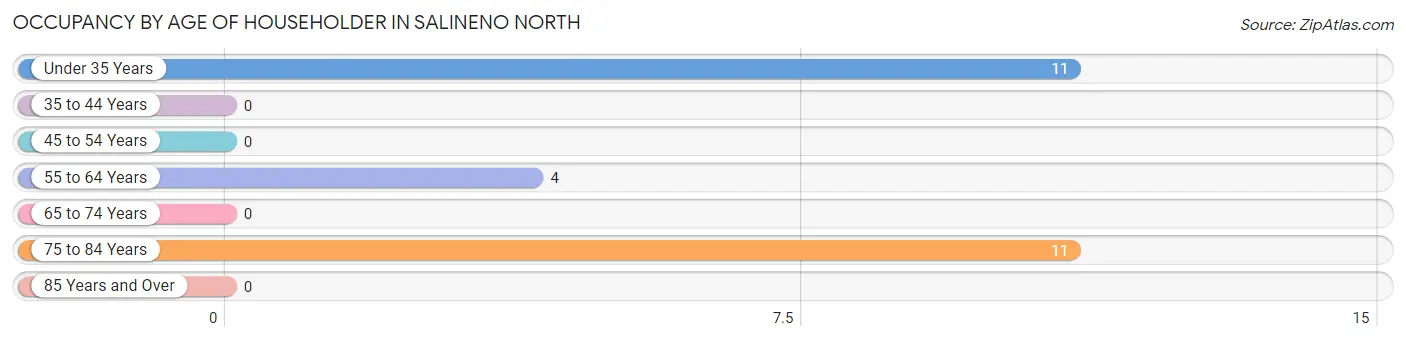
| Age Bracket | # Households | % Households |
| Under 35 Years | 11 | 42.3% |
| 35 to 44 Years | 0 | 0.0% |
| 45 to 54 Years | 0 | 0.0% |
| 55 to 64 Years | 4 | 15.4% |
| 65 to 74 Years | 0 | 0.0% |
| 75 to 84 Years | 11 | 42.3% |
| 85 Years and Over | 0 | 0.0% |
| Total | 26 | 100.0% |
Housing Finances in Salineno North
Median Income by Occupancy in Salineno North
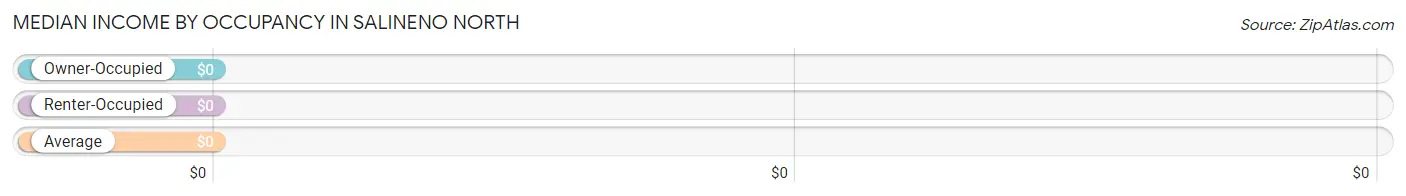
| Occupancy Type | # Households | Median Income |
| Owner-Occupied | 26 (100.0%) | $0 |
| Renter-Occupied | 0 (0.0%) | $0 |
| Average | 26 (100.0%) | $0 |
Occupancy by Householder Income Bracket in Salineno North
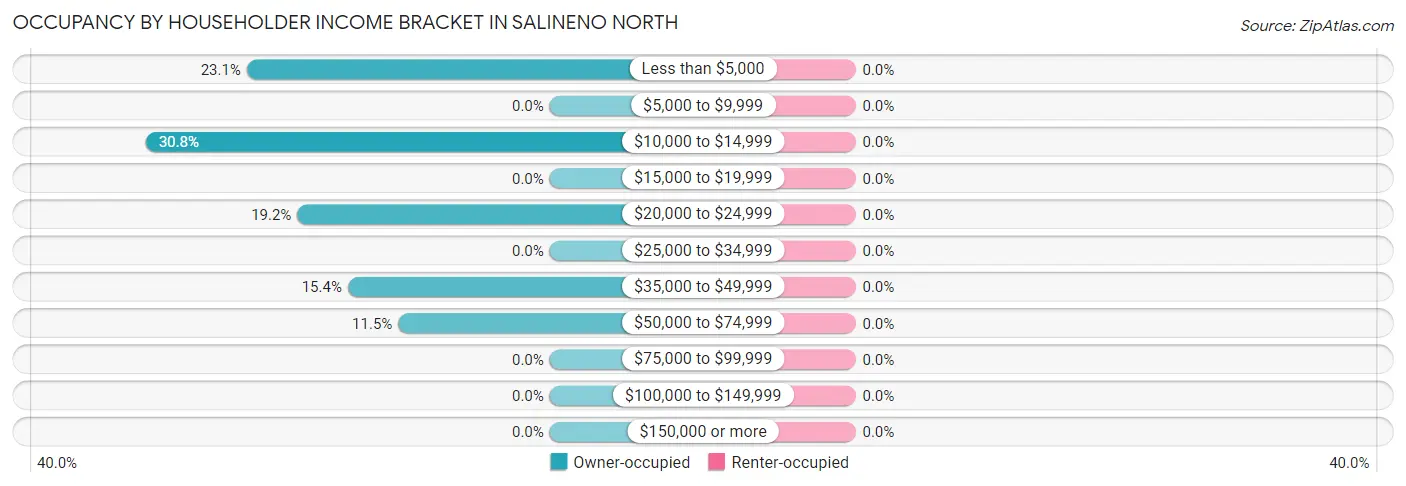
| Income Bracket | Owner-occupied | Renter-occupied |
| Less than $5,000 | 6 (23.1%) | 0 (0.0%) |
| $5,000 to $9,999 | 0 (0.0%) | 0 (0.0%) |
| $10,000 to $14,999 | 8 (30.8%) | 0 (0.0%) |
| $15,000 to $19,999 | 0 (0.0%) | 0 (0.0%) |
| $20,000 to $24,999 | 5 (19.2%) | 0 (0.0%) |
| $25,000 to $34,999 | 0 (0.0%) | 0 (0.0%) |
| $35,000 to $49,999 | 4 (15.4%) | 0 (0.0%) |
| $50,000 to $74,999 | 3 (11.5%) | 0 (0.0%) |
| $75,000 to $99,999 | 0 (0.0%) | 0 (0.0%) |
| $100,000 to $149,999 | 0 (0.0%) | 0 (0.0%) |
| $150,000 or more | 0 (0.0%) | 0 (0.0%) |
| Total | 26 (100.0%) | 0 (0.0%) |
Monthly Housing Cost Tiers in Salineno North
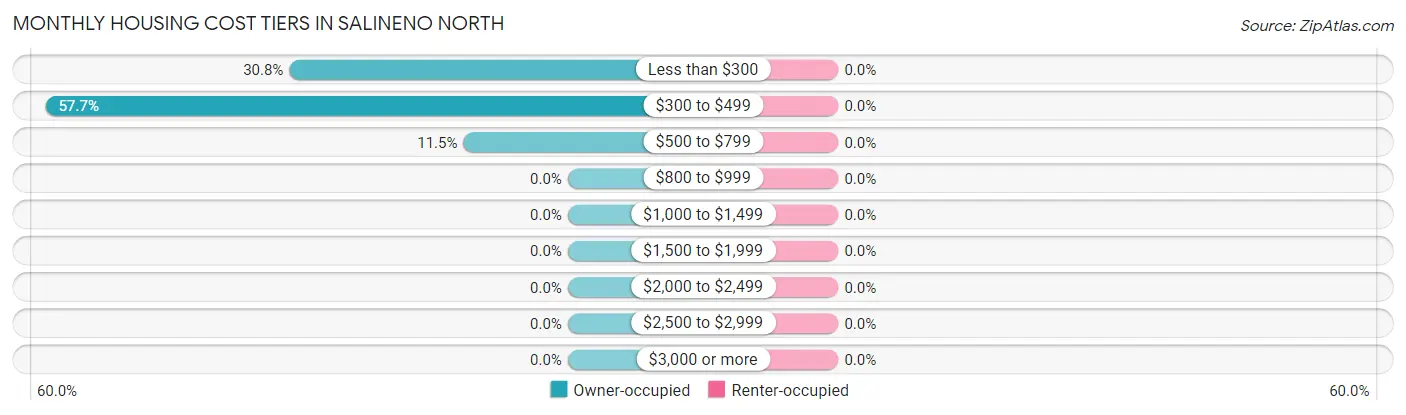
| Monthly Cost | Owner-occupied | Renter-occupied |
| Less than $300 | 8 (30.8%) | 0 (0.0%) |
| $300 to $499 | 15 (57.7%) | 0 (0.0%) |
| $500 to $799 | 3 (11.5%) | 0 (0.0%) |
| $800 to $999 | 0 (0.0%) | 0 (0.0%) |
| $1,000 to $1,499 | 0 (0.0%) | 0 (0.0%) |
| $1,500 to $1,999 | 0 (0.0%) | 0 (0.0%) |
| $2,000 to $2,499 | 0 (0.0%) | 0 (0.0%) |
| $2,500 to $2,999 | 0 (0.0%) | 0 (0.0%) |
| $3,000 or more | 0 (0.0%) | 0 (0.0%) |
| Total | 26 (100.0%) | 0 (0.0%) |
Physical Housing Characteristics in Salineno North
Housing Structures in Salineno North
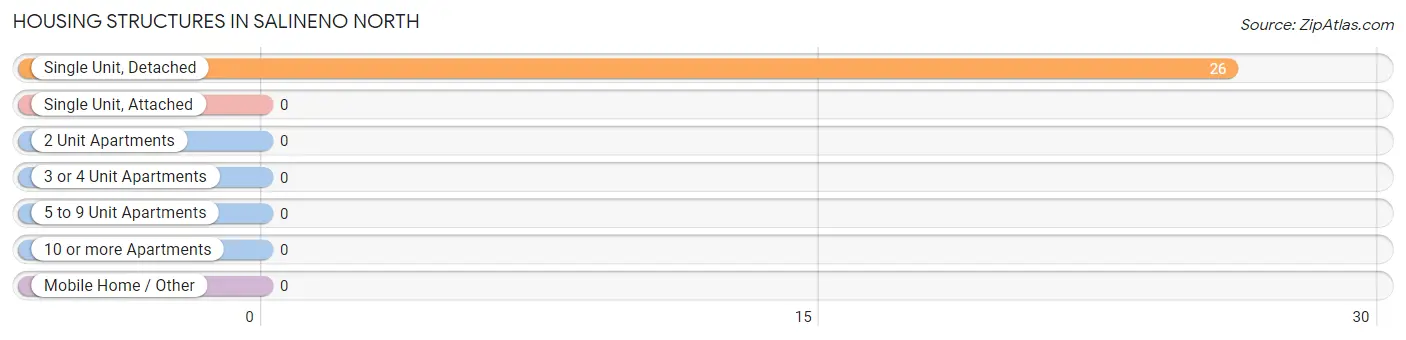
| Structure Type | # Housing Units | % Housing Units |
| Single Unit, Detached | 26 | 100.0% |
| Single Unit, Attached | 0 | 0.0% |
| 2 Unit Apartments | 0 | 0.0% |
| 3 or 4 Unit Apartments | 0 | 0.0% |
| 5 to 9 Unit Apartments | 0 | 0.0% |
| 10 or more Apartments | 0 | 0.0% |
| Mobile Home / Other | 0 | 0.0% |
| Total | 26 | 100.0% |
Housing Structures by Occupancy in Salineno North
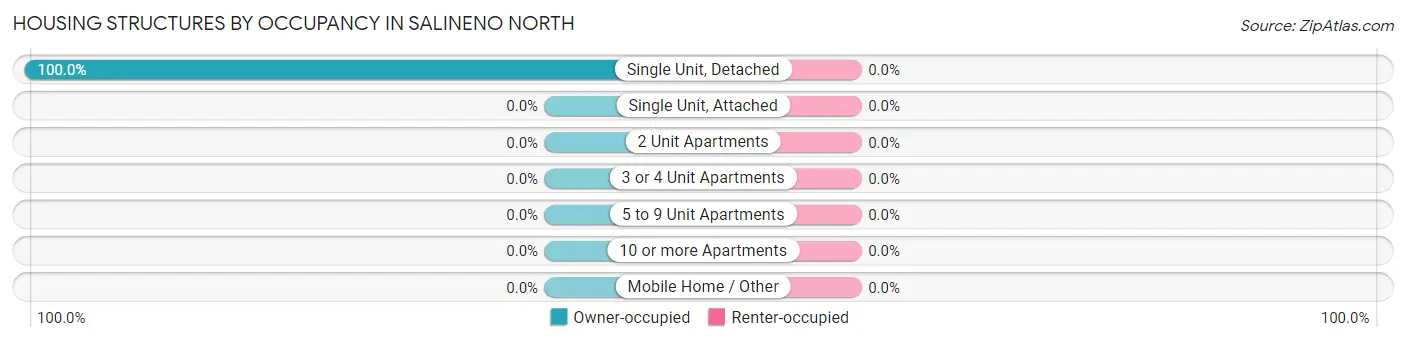
| Structure Type | Owner-occupied | Renter-occupied |
| Single Unit, Detached | 26 (100.0%) | 0 (0.0%) |
| Single Unit, Attached | 0 (0.0%) | 0 (0.0%) |
| 2 Unit Apartments | 0 (0.0%) | 0 (0.0%) |
| 3 or 4 Unit Apartments | 0 (0.0%) | 0 (0.0%) |
| 5 to 9 Unit Apartments | 0 (0.0%) | 0 (0.0%) |
| 10 or more Apartments | 0 (0.0%) | 0 (0.0%) |
| Mobile Home / Other | 0 (0.0%) | 0 (0.0%) |
| Total | 26 (100.0%) | 0 (0.0%) |
Housing Structures by Number of Rooms in Salineno North
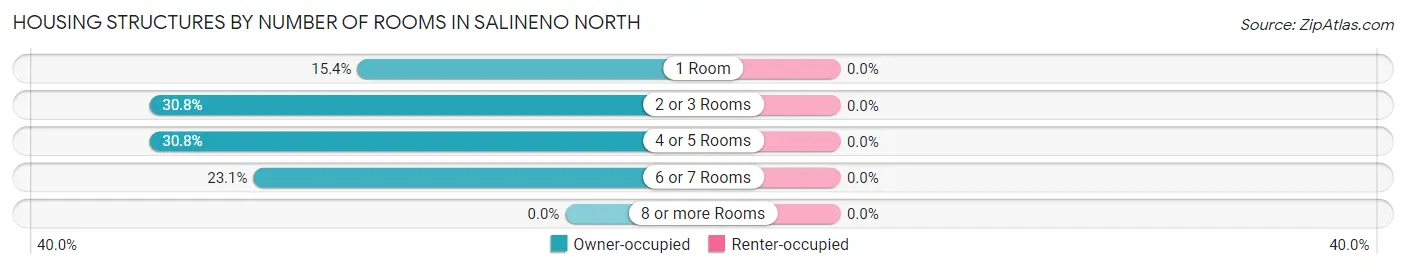
| Number of Rooms | Owner-occupied | Renter-occupied |
| 1 Room | 4 (15.4%) | 0 (0.0%) |
| 2 or 3 Rooms | 8 (30.8%) | 0 (0.0%) |
| 4 or 5 Rooms | 8 (30.8%) | 0 (0.0%) |
| 6 or 7 Rooms | 6 (23.1%) | 0 (0.0%) |
| 8 or more Rooms | 0 (0.0%) | 0 (0.0%) |
| Total | 26 (100.0%) | 0 (0.0%) |
Housing Structure by Heating Type in Salineno North
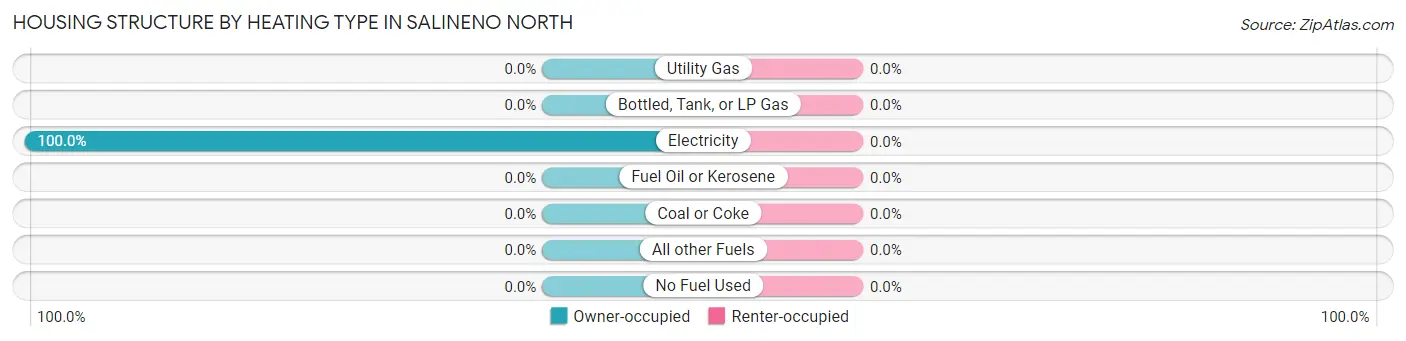
| Heating Type | Owner-occupied | Renter-occupied |
| Utility Gas | 0 (0.0%) | 0 (0.0%) |
| Bottled, Tank, or LP Gas | 0 (0.0%) | 0 (0.0%) |
| Electricity | 26 (100.0%) | 0 (0.0%) |
| Fuel Oil or Kerosene | 0 (0.0%) | 0 (0.0%) |
| Coal or Coke | 0 (0.0%) | 0 (0.0%) |
| All other Fuels | 0 (0.0%) | 0 (0.0%) |
| No Fuel Used | 0 (0.0%) | 0 (0.0%) |
| Total | 26 (100.0%) | 0 (0.0%) |
Household Vehicle Usage in Salineno North
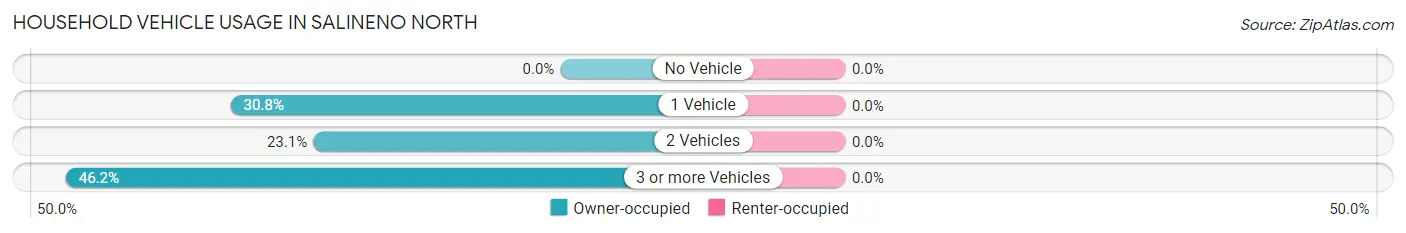
| Vehicles per Household | Owner-occupied | Renter-occupied |
| No Vehicle | 0 (0.0%) | 0 (0.0%) |
| 1 Vehicle | 8 (30.8%) | 0 (0.0%) |
| 2 Vehicles | 6 (23.1%) | 0 (0.0%) |
| 3 or more Vehicles | 12 (46.2%) | 0 (0.0%) |
| Total | 26 (100.0%) | 0 (0.0%) |
Real Estate & Mortgages in Salineno North
Real Estate and Mortgage Overview in Salineno North
| Characteristic | Without Mortgage | With Mortgage |
| Housing Units | 26 | 0 |
| Median Property Value | - | - |
| Median Household Income | - | - |
| Monthly Housing Costs | $400 | $0 |
| Real Estate Taxes | - | - |
Property Value by Mortgage Status in Salineno North
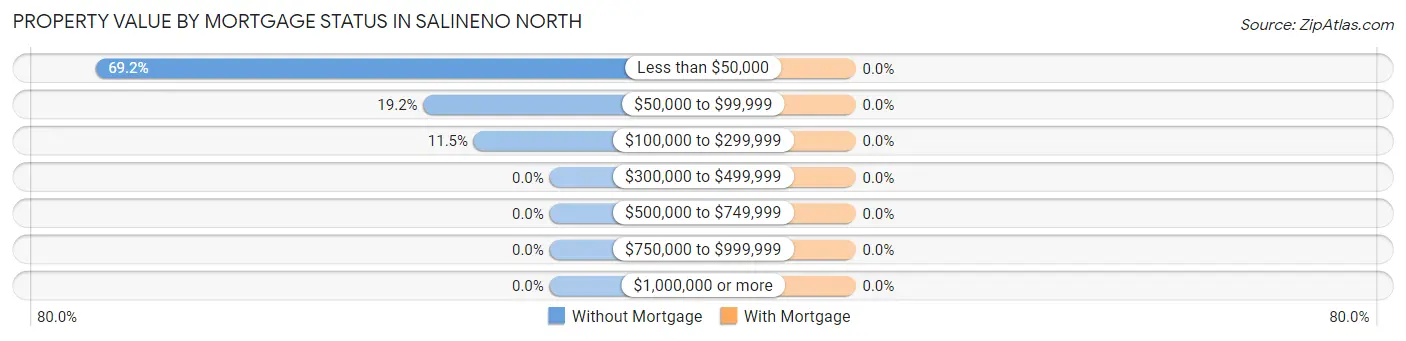
| Property Value | Without Mortgage | With Mortgage |
| Less than $50,000 | 18 (69.2%) | 0 (0.0%) |
| $50,000 to $99,999 | 5 (19.2%) | 0 (0.0%) |
| $100,000 to $299,999 | 3 (11.5%) | 0 (0.0%) |
| $300,000 to $499,999 | 0 (0.0%) | 0 (0.0%) |
| $500,000 to $749,999 | 0 (0.0%) | 0 (0.0%) |
| $750,000 to $999,999 | 0 (0.0%) | 0 (0.0%) |
| $1,000,000 or more | 0 (0.0%) | 0 (0.0%) |
| Total | 26 (100.0%) | 0 (0.0%) |
Household Income by Mortgage Status in Salineno North
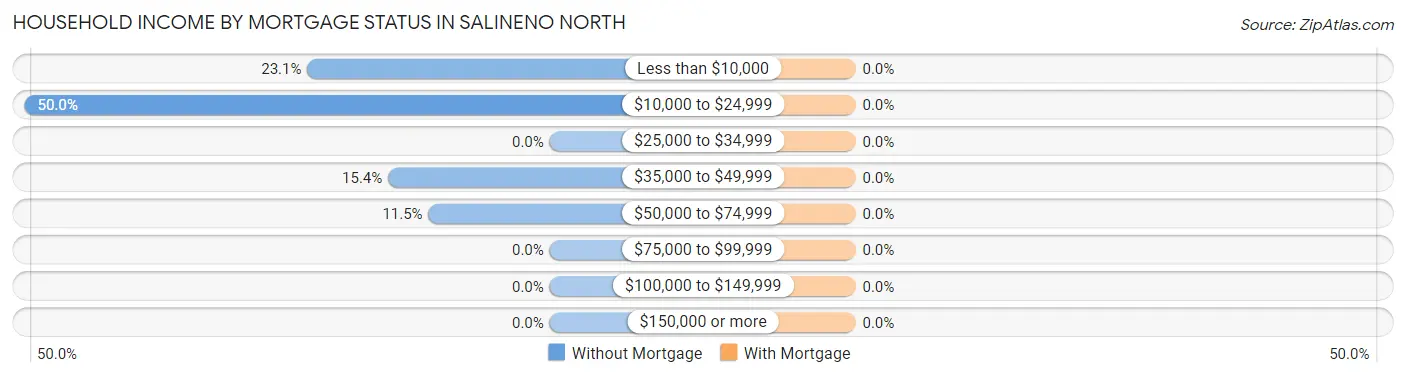
| Household Income | Without Mortgage | With Mortgage |
| Less than $10,000 | 6 (23.1%) | 0 (0.0%) |
| $10,000 to $24,999 | 13 (50.0%) | 0 (0.0%) |
| $25,000 to $34,999 | 0 (0.0%) | 0 (0.0%) |
| $35,000 to $49,999 | 4 (15.4%) | 0 (0.0%) |
| $50,000 to $74,999 | 3 (11.5%) | 0 (0.0%) |
| $75,000 to $99,999 | 0 (0.0%) | 0 (0.0%) |
| $100,000 to $149,999 | 0 (0.0%) | 0 (0.0%) |
| $150,000 or more | 0 (0.0%) | 0 (0.0%) |
| Total | 26 (100.0%) | 0 (0.0%) |
Property Value to Household Income Ratio in Salineno North
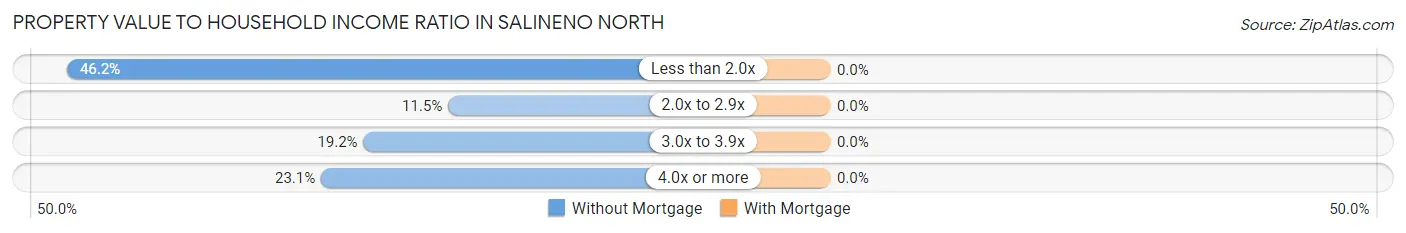
| Value-to-Income Ratio | Without Mortgage | With Mortgage |
| Less than 2.0x | 12 (46.2%) | 0 (0.0%) |
| 2.0x to 2.9x | 3 (11.5%) | 0 (0.0%) |
| 3.0x to 3.9x | 5 (19.2%) | 0 (0.0%) |
| 4.0x or more | 6 (23.1%) | 0 (0.0%) |
| Total | 26 (100.0%) | 0 (0.0%) |
Real Estate Taxes by Mortgage Status in Salineno North
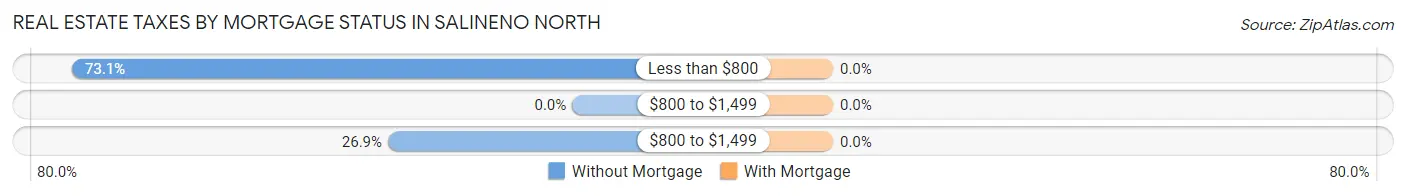
| Property Taxes | Without Mortgage | With Mortgage |
| Less than $800 | 19 (73.1%) | 0 (0.0%) |
| $800 to $1,499 | 0 (0.0%) | 0 (0.0%) |
| $800 to $1,499 | 7 (26.9%) | 0 (0.0%) |
| Total | 26 (100.0%) | 0 (0.0%) |
Health & Disability in Salineno North
Health Insurance Coverage by Age in Salineno North
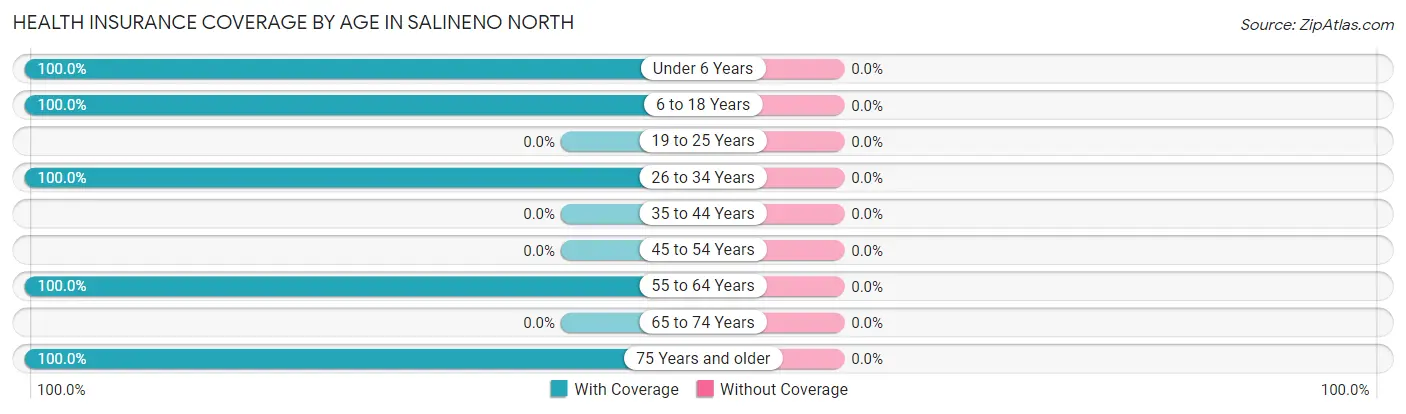
| Age Bracket | With Coverage | Without Coverage |
| Under 6 Years | 27 (100.0%) | 0 (0.0%) |
| 6 to 18 Years | 7 (100.0%) | 0 (0.0%) |
| 19 to 25 Years | 0 (0.0%) | 0 (0.0%) |
| 26 to 34 Years | 23 (100.0%) | 0 (0.0%) |
| 35 to 44 Years | 0 (0.0%) | 0 (0.0%) |
| 45 to 54 Years | 0 (0.0%) | 0 (0.0%) |
| 55 to 64 Years | 4 (100.0%) | 0 (0.0%) |
| 65 to 74 Years | 0 (0.0%) | 0 (0.0%) |
| 75 Years and older | 16 (100.0%) | 0 (0.0%) |
| Total | 77 (100.0%) | 0 (0.0%) |
Health Insurance Coverage by Citizenship Status in Salineno North

| Citizenship Status | With Coverage | Without Coverage |
| Native Born | 27 (100.0%) | 0 (0.0%) |
| Foreign Born, Citizen | 7 (100.0%) | 0 (0.0%) |
| Foreign Born, not a Citizen | 0 (0.0%) | 0 (0.0%) |
Health Insurance Coverage by Household Income in Salineno North
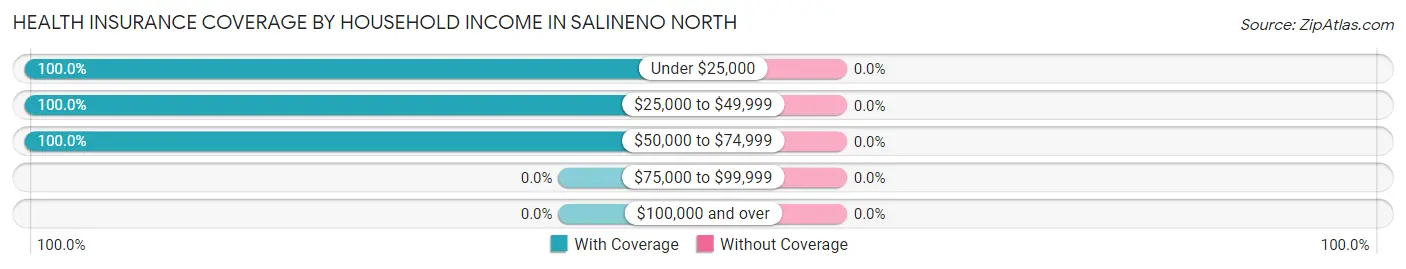
| Household Income | With Coverage | Without Coverage |
| Under $25,000 | 46 (100.0%) | 0 (0.0%) |
| $25,000 to $49,999 | 23 (100.0%) | 0 (0.0%) |
| $50,000 to $74,999 | 8 (100.0%) | 0 (0.0%) |
| $75,000 to $99,999 | 0 (0.0%) | 0 (0.0%) |
| $100,000 and over | 0 (0.0%) | 0 (0.0%) |
Public vs Private Health Insurance Coverage by Age in Salineno North
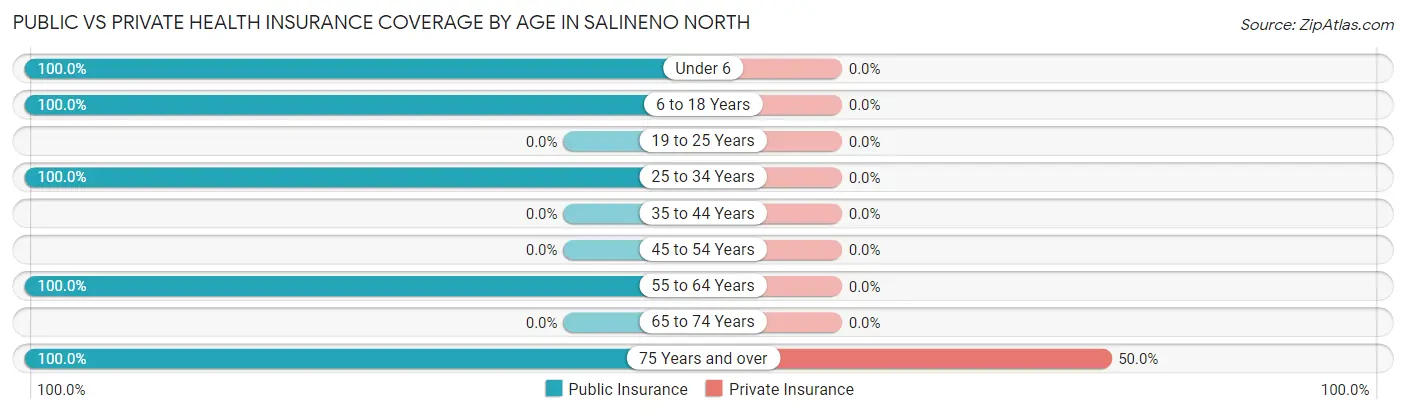
| Age Bracket | Public Insurance | Private Insurance |
| Under 6 | 27 (100.0%) | 0 (0.0%) |
| 6 to 18 Years | 7 (100.0%) | 0 (0.0%) |
| 19 to 25 Years | 0 (0.0%) | 0 (0.0%) |
| 25 to 34 Years | 23 (100.0%) | 0 (0.0%) |
| 35 to 44 Years | 0 (0.0%) | 0 (0.0%) |
| 45 to 54 Years | 0 (0.0%) | 0 (0.0%) |
| 55 to 64 Years | 4 (100.0%) | 0 (0.0%) |
| 65 to 74 Years | 0 (0.0%) | 0 (0.0%) |
| 75 Years and over | 16 (100.0%) | 8 (50.0%) |
| Total | 77 (100.0%) | 8 (10.4%) |
Disability Status by Sex by Age in Salineno North
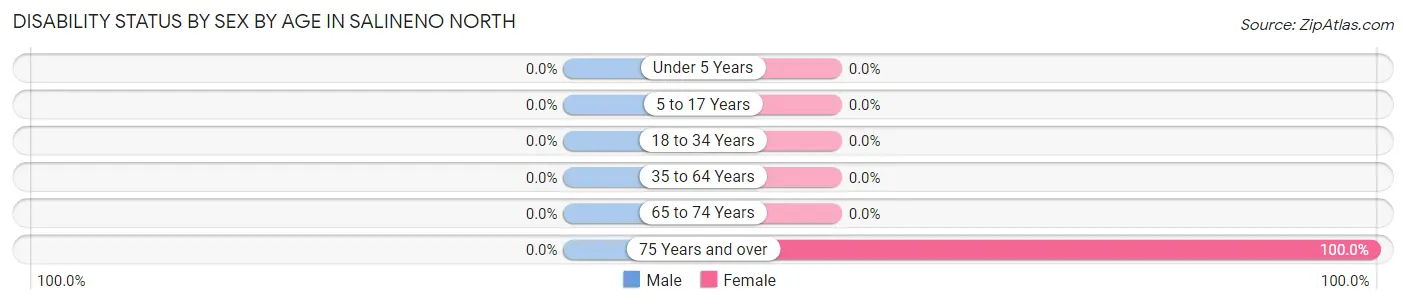
| Age Bracket | Male | Female |
| Under 5 Years | 0 (0.0%) | 0 (0.0%) |
| 5 to 17 Years | 0 (0.0%) | 0 (0.0%) |
| 18 to 34 Years | 0 (0.0%) | 0 (0.0%) |
| 35 to 64 Years | 0 (0.0%) | 0 (0.0%) |
| 65 to 74 Years | 0 (0.0%) | 0 (0.0%) |
| 75 Years and over | 0 (0.0%) | 5 (100.0%) |
Disability Class by Sex by Age in Salineno North
Disability Class: Hearing Difficulty
| Age Bracket | Male | Female |
| Under 5 Years | 0 (0.0%) | 0 (0.0%) |
| 5 to 17 Years | 0 (0.0%) | 0 (0.0%) |
| 18 to 34 Years | 0 (0.0%) | 0 (0.0%) |
| 35 to 64 Years | 0 (0.0%) | 0 (0.0%) |
| 65 to 74 Years | 0 (0.0%) | 0 (0.0%) |
| 75 Years and over | 0 (0.0%) | 0 (0.0%) |
Disability Class: Vision Difficulty
| Age Bracket | Male | Female |
| Under 5 Years | 0 (0.0%) | 0 (0.0%) |
| 5 to 17 Years | 0 (0.0%) | 0 (0.0%) |
| 18 to 34 Years | 0 (0.0%) | 0 (0.0%) |
| 35 to 64 Years | 0 (0.0%) | 0 (0.0%) |
| 65 to 74 Years | 0 (0.0%) | 0 (0.0%) |
| 75 Years and over | 0 (0.0%) | 0 (0.0%) |
Disability Class: Cognitive Difficulty
| Age Bracket | Male | Female |
| 5 to 17 Years | 0 (0.0%) | 0 (0.0%) |
| 18 to 34 Years | 0 (0.0%) | 0 (0.0%) |
| 35 to 64 Years | 0 (0.0%) | 0 (0.0%) |
| 65 to 74 Years | 0 (0.0%) | 0 (0.0%) |
| 75 Years and over | 0 (0.0%) | 0 (0.0%) |
Disability Class: Ambulatory Difficulty
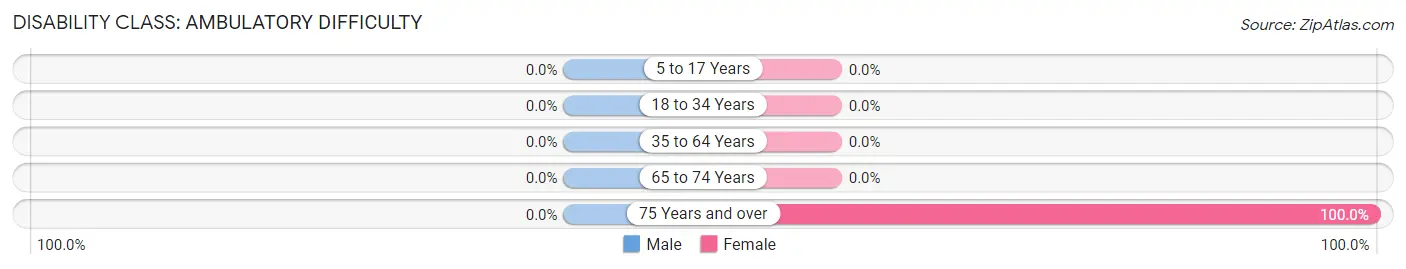
| Age Bracket | Male | Female |
| 5 to 17 Years | 0 (0.0%) | 0 (0.0%) |
| 18 to 34 Years | 0 (0.0%) | 0 (0.0%) |
| 35 to 64 Years | 0 (0.0%) | 0 (0.0%) |
| 65 to 74 Years | 0 (0.0%) | 0 (0.0%) |
| 75 Years and over | 0 (0.0%) | 5 (100.0%) |
Disability Class: Self-Care Difficulty
| Age Bracket | Male | Female |
| 5 to 17 Years | 0 (0.0%) | 0 (0.0%) |
| 18 to 34 Years | 0 (0.0%) | 0 (0.0%) |
| 35 to 64 Years | 0 (0.0%) | 0 (0.0%) |
| 65 to 74 Years | 0 (0.0%) | 0 (0.0%) |
| 75 Years and over | 0 (0.0%) | 0 (0.0%) |
Technology Access in Salineno North
Computing Device Access in Salineno North
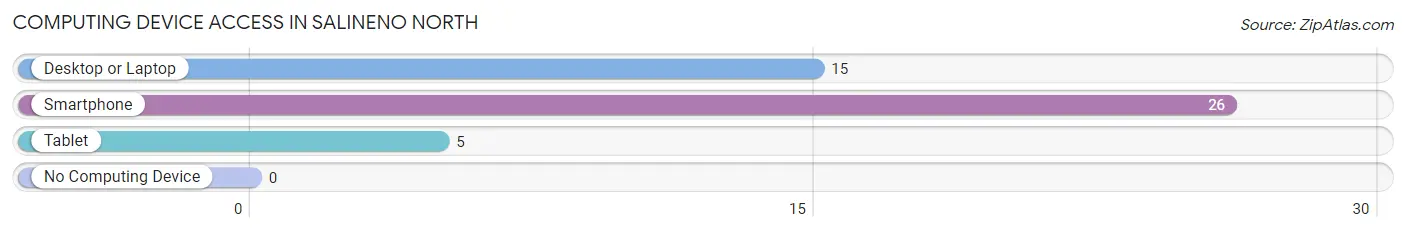
| Device Type | # Households | % Households |
| Desktop or Laptop | 15 | 57.7% |
| Smartphone | 26 | 100.0% |
| Tablet | 5 | 19.2% |
| No Computing Device | 0 | 0.0% |
| Total | 26 | 100.0% |
Internet Access in Salineno North
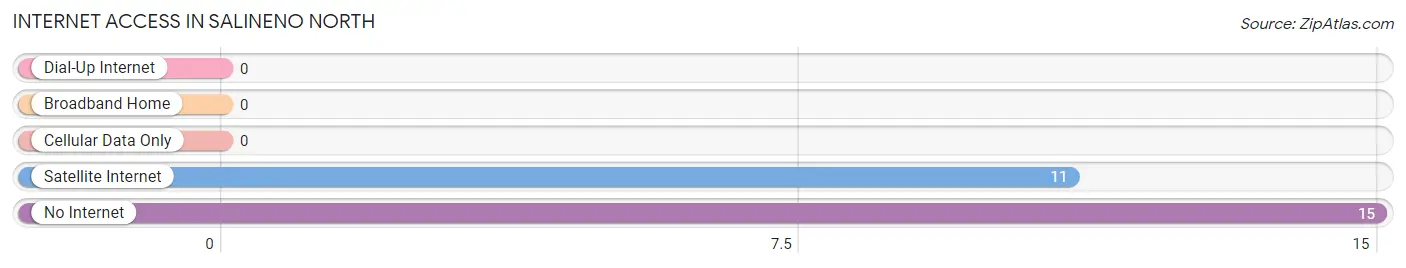
| Internet Type | # Households | % Households |
| Dial-Up Internet | 0 | 0.0% |
| Broadband Home | 0 | 0.0% |
| Cellular Data Only | 0 | 0.0% |
| Satellite Internet | 11 | 42.3% |
| No Internet | 15 | 57.7% |
| Total | 26 | 100.0% |
Salineno North Summary
Salineno North, Texas is a small unincorporated community located in Starr County, Texas. It is situated on the banks of the Rio Grande, just north of the Mexican border. The population of Salineno North was estimated to be around 1,000 people in 2020.
History
Salineno North was founded in the late 19th century by Mexican immigrants who were looking for a place to settle and start a new life. The area was originally known as El Salineno, which means “the salt” in Spanish. The name was changed to Salineno North in the early 20th century when the town was incorporated.
The town was originally a farming community, with many of the residents growing cotton, corn, and other crops. In the early 20th century, the town began to grow as more people moved to the area. The population of Salineno North peaked in the 1950s, when it had a population of around 2,000 people.
Geography
Salineno North is located in Starr County, Texas, on the banks of the Rio Grande. The town is situated on the northern edge of the Rio Grande Valley, which is a large agricultural region in South Texas. The town is located about 25 miles north of the Mexican border.
The climate in Salineno North is subtropical, with hot summers and mild winters. The average temperature in the summer is around 90 degrees Fahrenheit, and the average temperature in the winter is around 60 degrees Fahrenheit.
Economy
The economy of Salineno North is largely based on agriculture. The town is home to several large farms, which produce cotton, corn, and other crops. The town also has a few small businesses, such as restaurants, grocery stores, and gas stations.
The town is also home to a few manufacturing companies, which produce a variety of products, such as furniture, clothing, and electronics.
Demographics
The population of Salineno North is estimated to be around 1,000 people. The majority of the population is of Hispanic or Latino descent. The town also has a small population of African Americans, Native Americans, and other ethnicities.
The median household income in Salineno North is around $30,000 per year. The town has a high poverty rate, with around 40% of the population living below the poverty line.
Conclusion
Salineno North is a small unincorporated community located in Starr County, Texas. It is situated on the banks of the Rio Grande, just north of the Mexican border. The town was founded in the late 19th century by Mexican immigrants, and the population of Salineno North was estimated to be around 1,000 people in 2020. The economy of Salineno North is largely based on agriculture, and the majority of the population is of Hispanic or Latino descent.
Common Questions
What is Per Capita Income in Salineno North?
Per Capita income in Salineno North is $7,058.
What is Inequality or Gini Index in Salineno North?
Inequality or Gini Index in Salineno North is 0.44.
What is the Total Population of Salineno North?
Total Population of Salineno North is 77.
What is the Total Male Population of Salineno North?
Total Male Population of Salineno North is 30.
What is the Total Female Population of Salineno North?
Total Female Population of Salineno North is 47.
What is the Ratio of Males per 100 Females in Salineno North?
There are 63.83 Males per 100 Females in Salineno North.
What is the Ratio of Females per 100 Males in Salineno North?
There are 156.67 Females per 100 Males in Salineno North.
What is the Median Population Age in Salineno North?
Median Population Age in Salineno North is 26.8 Years.
What is the Average Family Size in Salineno North
Average Family Size in Salineno North is 3.8 People.
What is the Average Household Size in Salineno North
Average Household Size in Salineno North is 3.0 People.
How Large is the Labor Force in Salineno North?
There are 21 People in the Labor Forcein in Salineno North.
What is the Percentage of People in the Labor Force in Salineno North?
48.8% of People are in the Labor Force in Salineno North.